40
Structural Change in Space: Employment Transition and Urbanization in Developing Countries DEC POLICY RESEARCH TALK March 4, 2019 Forhad Shilpi

Structural Change in Space: Employment Transition and Urbanization in
Developing Countries
DEC POLICY RESEARCH TALK
March 4, 2019
Forhad Shilpi
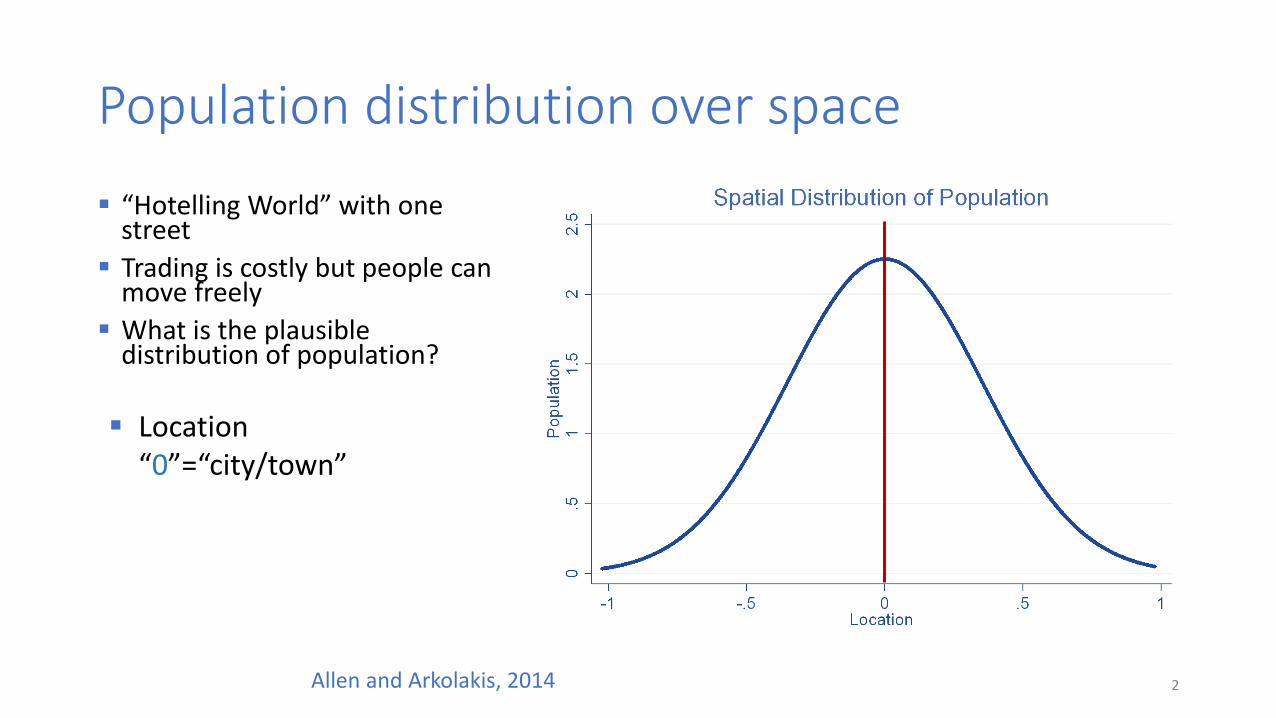
Population distribution over space
▪ “Hotelling World” with one street
▪ Trading is costly but people can move freely
▪ What is the plausible distribution of population?
Allen and Arkolakis, 2014
▪ Location “0”=“city/town”
2

Sectoral Division of Labor in Nepal
Fafchamps and Shilpi, 20053
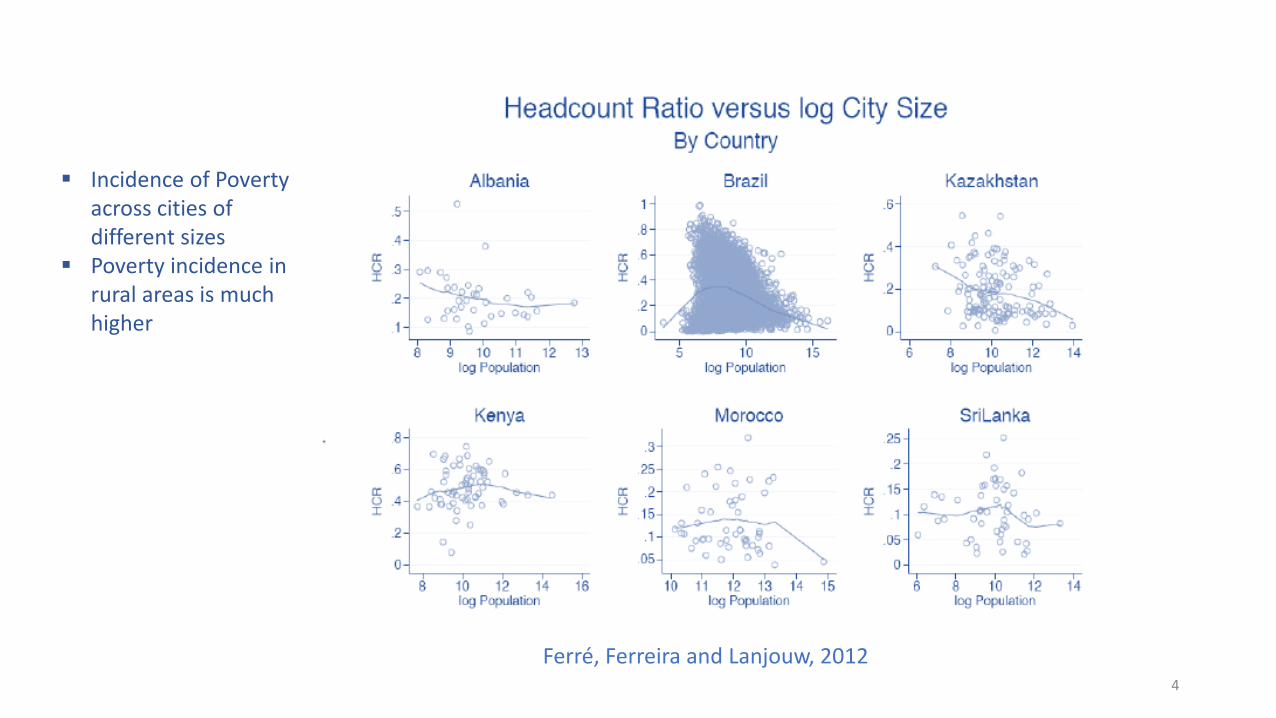
Ferré, Ferreira and Lanjouw, 2012
▪ Incidence of Poverty across cities of different sizes
▪ Poverty incidence in rural areas is much higher
4
Structural Transformation in Space
▪ Two fundamental aspects of economic development vary spatially with distances from urban centers: employment specialization; spatial (rural-urban) transformation (population density)
▪ Employment transformation: Labor productivity in agriculture is a fraction of that in non-agricultural activity. Even after adjusting for hours worked and human capital, labor productivity gap in agriculture vs. non-agriculture is about 2.2 (Gollin, Lagakos and Waugh, (2014); McMillan and Rodrik (2014)).
▪ Spatial transformation from rural to urban areas: Labor return in urban areas much higher than rural areas (Henderson, Nigmatulina and Kriticos, 2018)
▪ Urbanization and Structural Transformation are keys to economic development and poverty reduction
5
Outline
▪ Cities evolved over time from “Princely” cities to “factory” towns to “modern” cities. Where do cities in poorer developing countries fall in this time scale?
▪ How do concentration of population and employment specialization in developing countries responds to change in▪ Trade costs
▪ Can a city solve all of its problem by itself?▪ Internal migration and Unemployment and amenity
▪ PRT talks by Uwe and Harris focused on urban areas (cities)
▪ Focus will be on predominantly agricultural poorer countries; employment and population density over entire space not just urban or rural
6

Characterizing Cities in Developing countries
7

Ancient Cities
02
Po
pu
lation
-1 -.5 0 .5 1Location
80
.51
1.5
22.5
Po
pula
tion
-1 -.5 0 .5 1Location
Transport cost=0/infinity Transport cost: High
0.5
11
.52
2.5
Po
pu
lation
-1 -.5 0 .5 1Location
Transport cost=0 Transport cost: Low
Transport cost: High
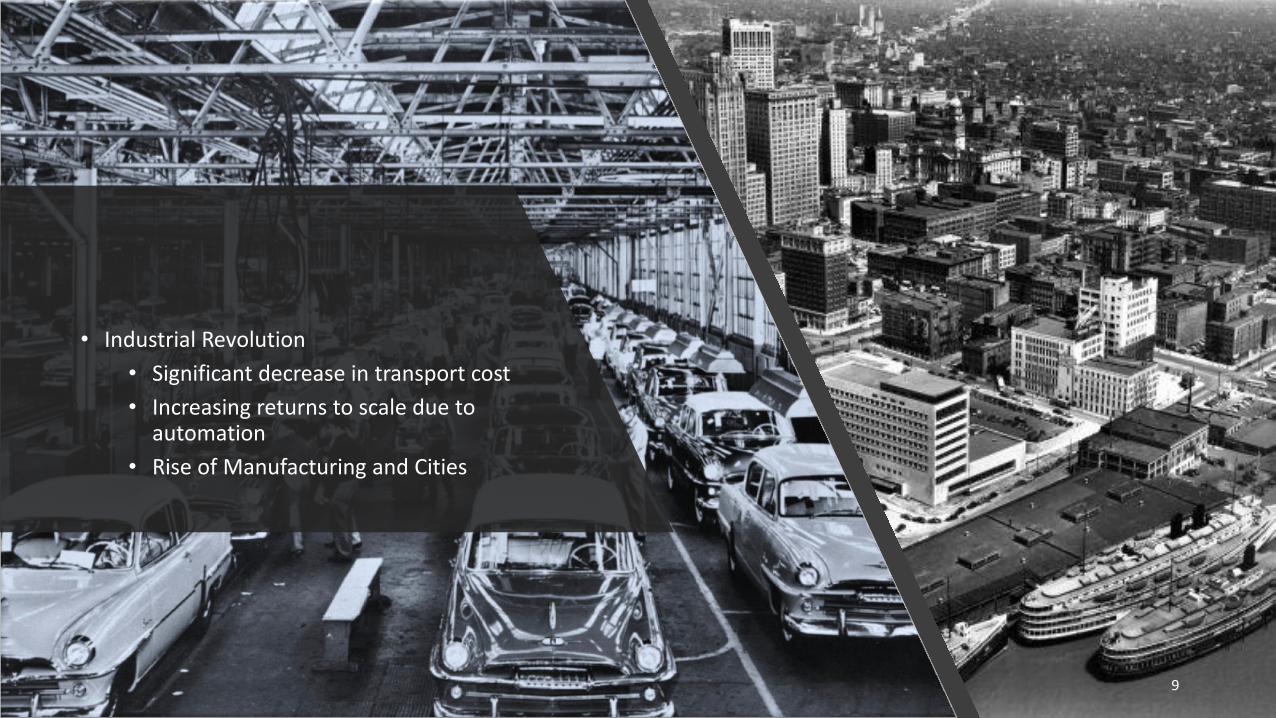
• Industrial Revolution
• Significant decrease in transport cost
• Increasing returns to scale due to automation
• Rise of Manufacturing and Cities
9

01
23
Po
pu
lation
-1 -.5 0 .5 1Location
Transport cost: Low Productivity spillovers
Increasing Returns and Productivity Spillovers
• Manufacturing moved out of cities• Transport cost fell dramatically again• Learning/Sharing /Knowledge externalities• Firm sizes are large because of increasing returns internal
to firms or agglomeration economies external to firms (Google, Facebook)
10

Evolution of cities
• Common to all cities: predominance of non-agricultural activities, specialization, concentration of diverse activities, thick market externalities (labor, intermediate goods, product)
• Differences: • Services in princely and modern cities; but manufacturing in factory towns
• Firm sizes much bigger in factory towns/ modern cities
• Agglomeration externalities much stronger in modern cities
11
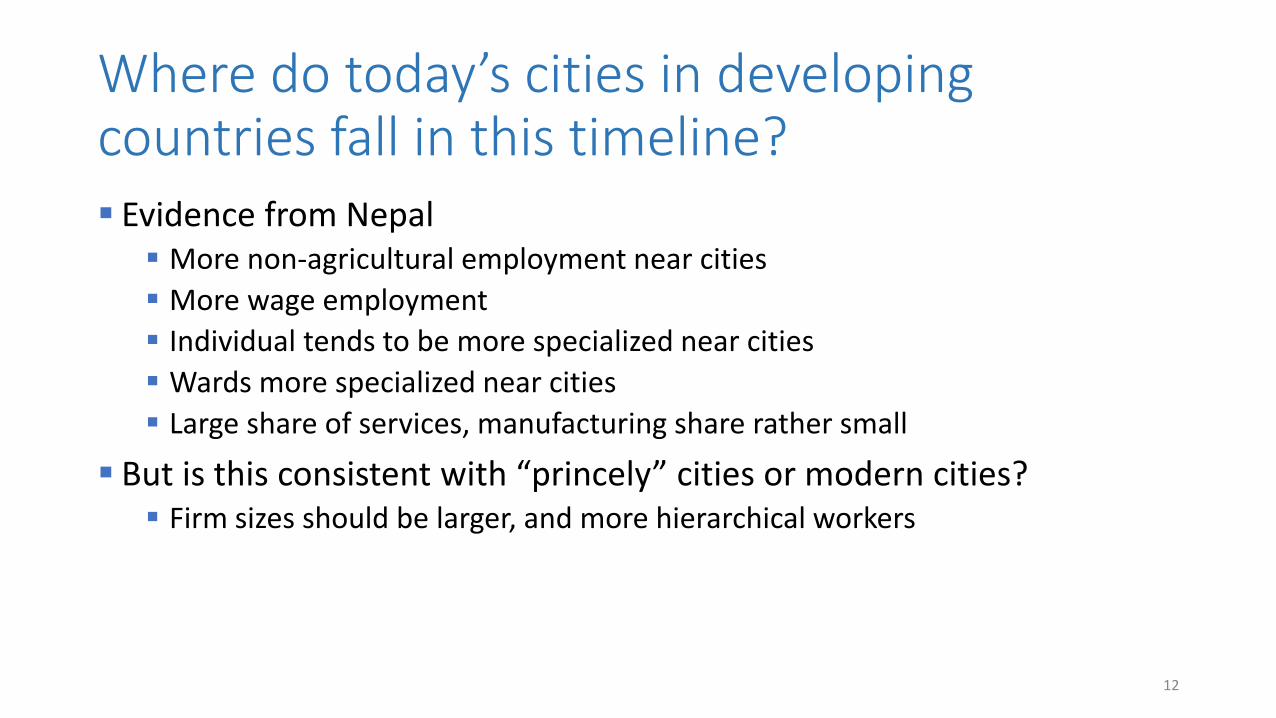
Where do today’s cities in developing countries fall in this timeline?▪ Evidence from Nepal
▪ More non-agricultural employment near cities
▪ More wage employment
▪ Individual tends to be more specialized near cities
▪ Wards more specialized near cities
▪ Large share of services, manufacturing share rather small
▪ But is this consistent with “princely” cities or modern cities?▪ Firm sizes should be larger, and more hierarchical workers
12

Specialization pattern in Nepal
Fafchamps and Shilpi, 200513

Firm Size
Fafchamps and Shilpi, 200514
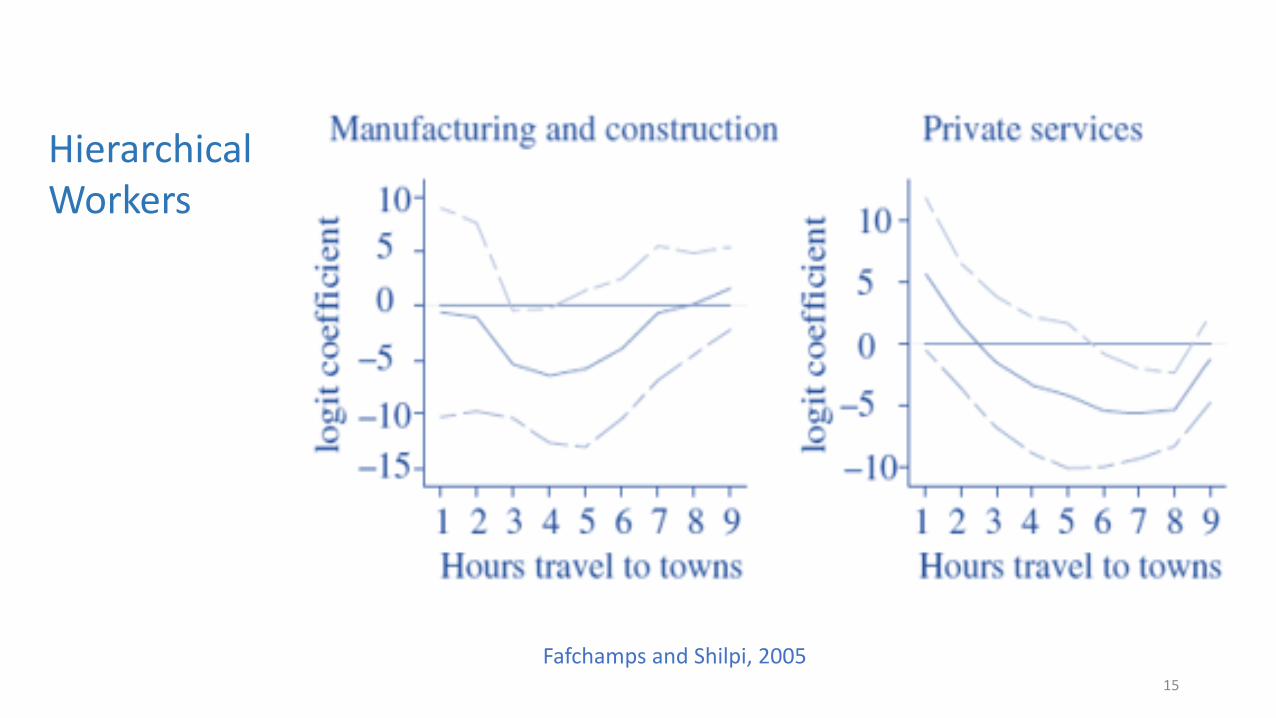
Hierarchical Workers
Fafchamps and Shilpi, 200515
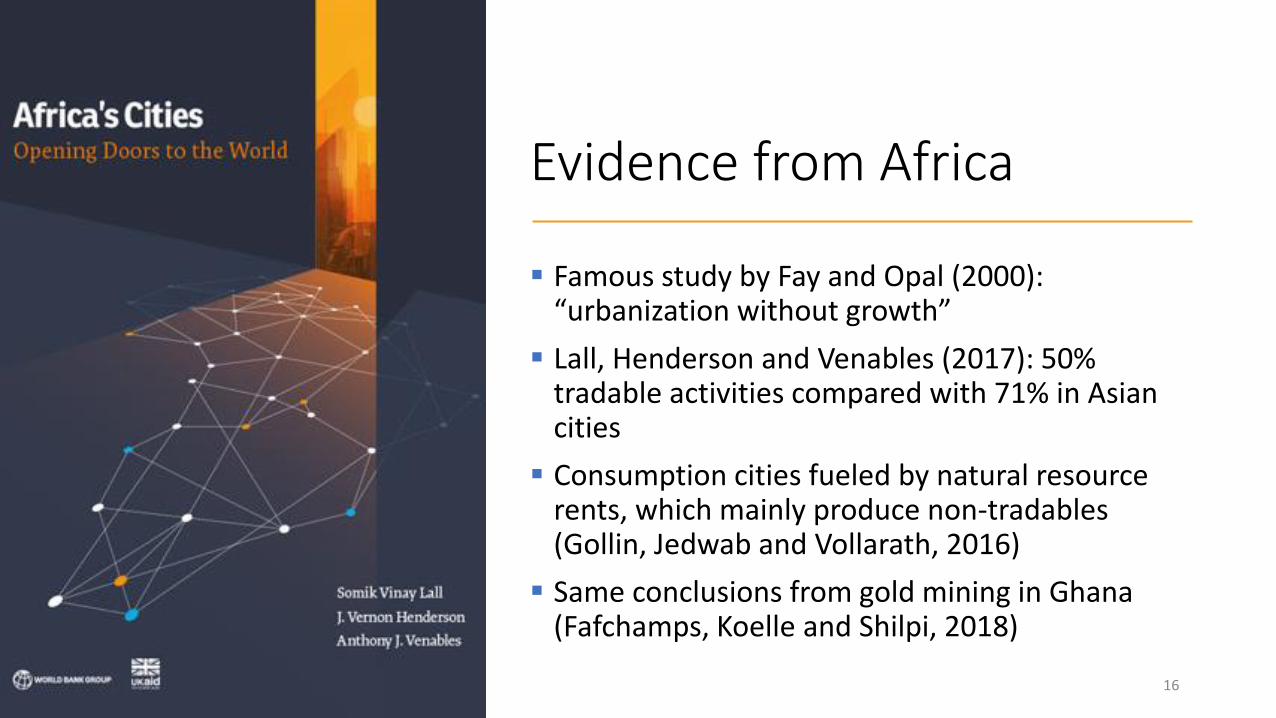
Evidence from Africa
▪ Famous study by Fay and Opal (2000): “urbanization without growth”
▪ Lall, Henderson and Venables (2017): 50% tradable activities compared with 71% in Asian cities
▪ Consumption cities fueled by natural resource rents, which mainly produce non-tradables(Gollin, Jedwab and Vollarath, 2016)
▪ Same conclusions from gold mining in Ghana (Fafchamps, Koelle and Shilpi, 2018)
16

Remarks
▪ Cities are at an early stage of development
▪ Transformation of cities would require:
▪ Opening up to grow (exports) (Lall, Henderson and Venables, 2017)
▪ Resource exports do not work (Gollin, Jedwab and Vollrath, 2016)
▪ Focus on tradables be it garment in Bangladesh or flower in Kenya
▪ Rural growth is another option particularly for smaller cities (Emran and Shilpi, 2018)
▪ This is in addition to getting cities right in terms infrastructure, housing, institutions (Cai, Selod and Steinbuks 2018). Harris talked about these issues in his PRT.
17

Gollin, Jedwab and Vollrath 2016; Lall, Henderson and Venables 2017
In resource exporting countries, urbanization is not accompanied by the development of manufacturing and services
18

Agricultural Productivity and Small Towns/Cities: Evidence from Bangladesh
Food
Other_manufac
Const_Transp
Trade
Education
Health
Other_Serv
0 1 2 3 4 5
Small Town Sample
Food
Other_manufac
Const_Transp
Trade
Education
Health
Other_Serv
-2 -1 0 1 2 3
Rural Sample
Emran and Shilpi, 2018 19

Trade Cost
20
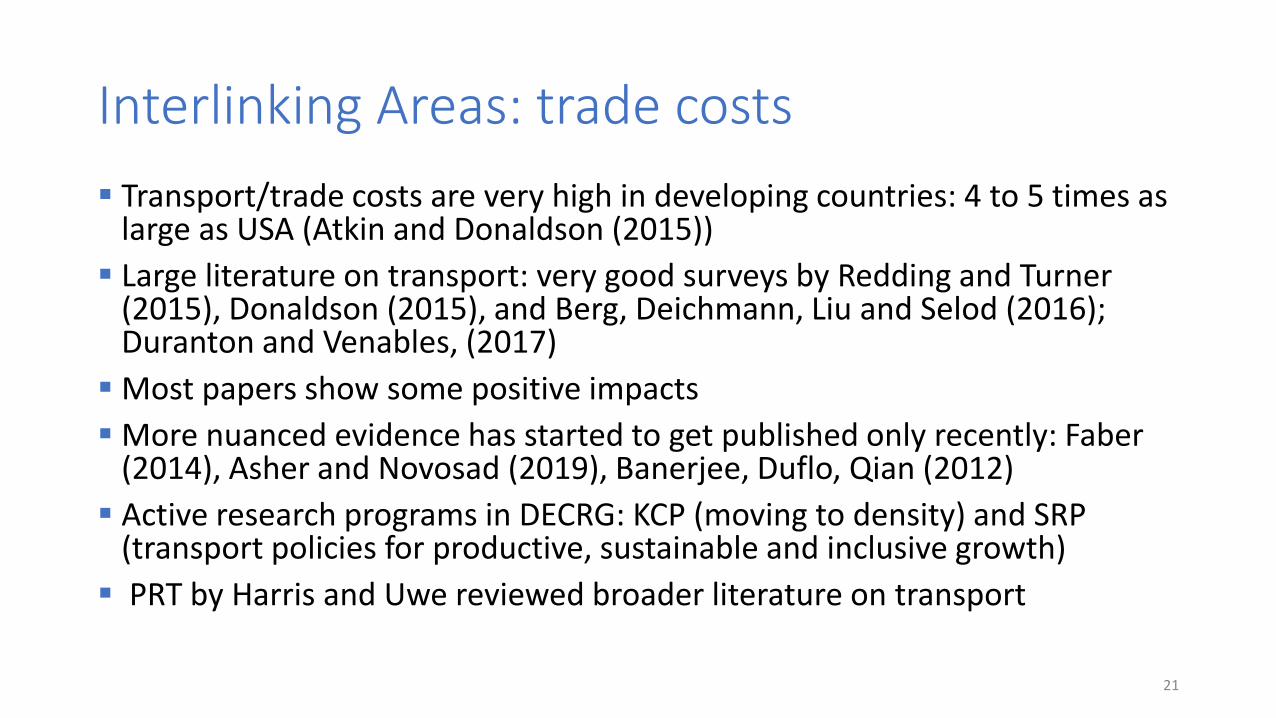
Interlinking Areas: trade costs
▪ Transport/trade costs are very high in developing countries: 4 to 5 times as large as USA (Atkin and Donaldson (2015))
▪ Large literature on transport: very good surveys by Redding and Turner (2015), Donaldson (2015), and Berg, Deichmann, Liu and Selod (2016); Duranton and Venables, (2017)
▪ Most papers show some positive impacts
▪ More nuanced evidence has started to get published only recently: Faber (2014), Asher and Novosad (2019), Banerjee, Duflo, Qian (2012)
▪ Active research programs in DECRG: KCP (moving to density) and SRP (transport policies for productive, sustainable and inclusive growth)
▪ PRT by Harris and Uwe reviewed broader literature on transport
21
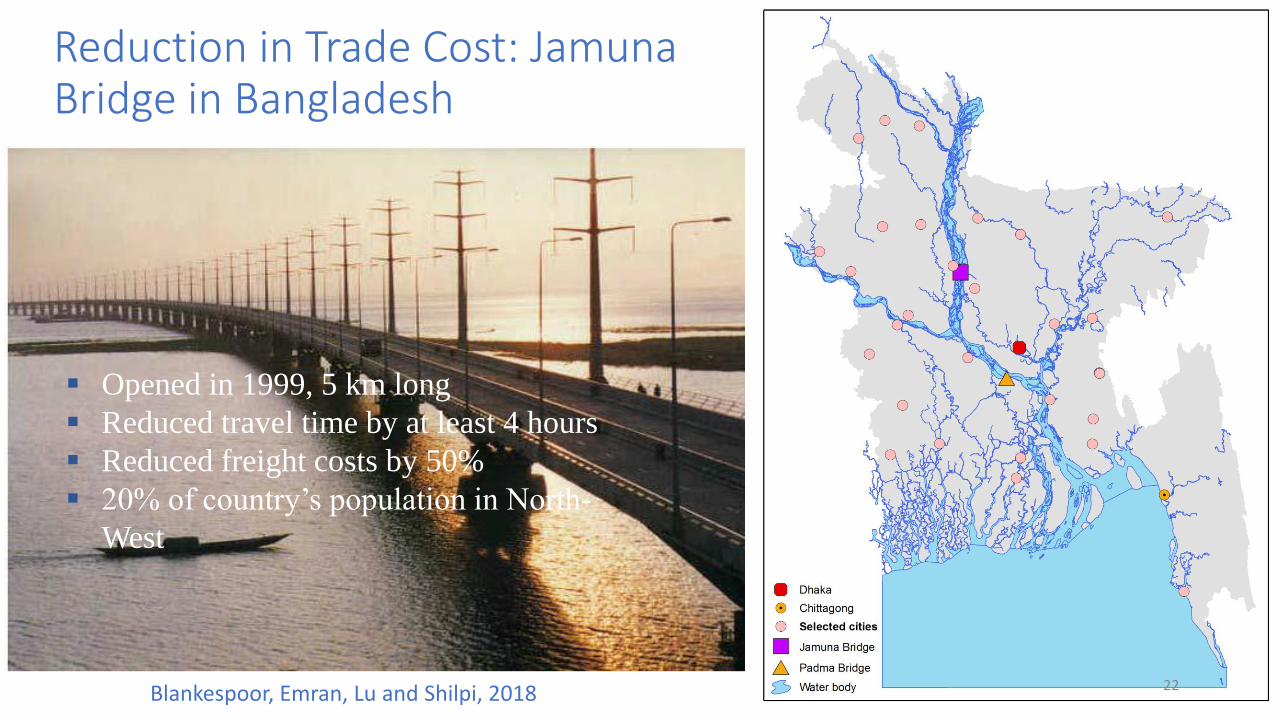
Reduction in Trade Cost: Jamuna Bridge in Bangladesh
▪ Opened in 1999, 5 km long
▪ Reduced travel time by at least 4 hours
▪ Reduced freight costs by 50%
▪ 20% of country’s population in North-
West
Blankespoor, Emran, Lu and Shilpi, 2018 22

Impacts of Bridge on population density and sectoral employment shares▪ Employment transition
from agriculture to services in the short-run in treatment hinterland
▪ Increase in population density in the long-run.
▪ Decline in industry in treatment hinterland but increase in center.
-.0
20
.02
.04
.06
Shortrun Longrun Shortrun longrun
Treatment Center
95% CI
Industry Share
0.0
1.0
2.0
3.0
4
Shortrun Longrun Shortrun longrun
Treatment Center
95% CI
Services
23
-.0
8-.
06
-.0
4-.
02
0
Shortrun Longrun Shortrun longrun
Treatment Center
95% CI
Agriculture Share
-.0
50
.05
.1.1
5.2
Shortrun Longrun Shortrun longrun
Treatment Center
95% CI
Population Density
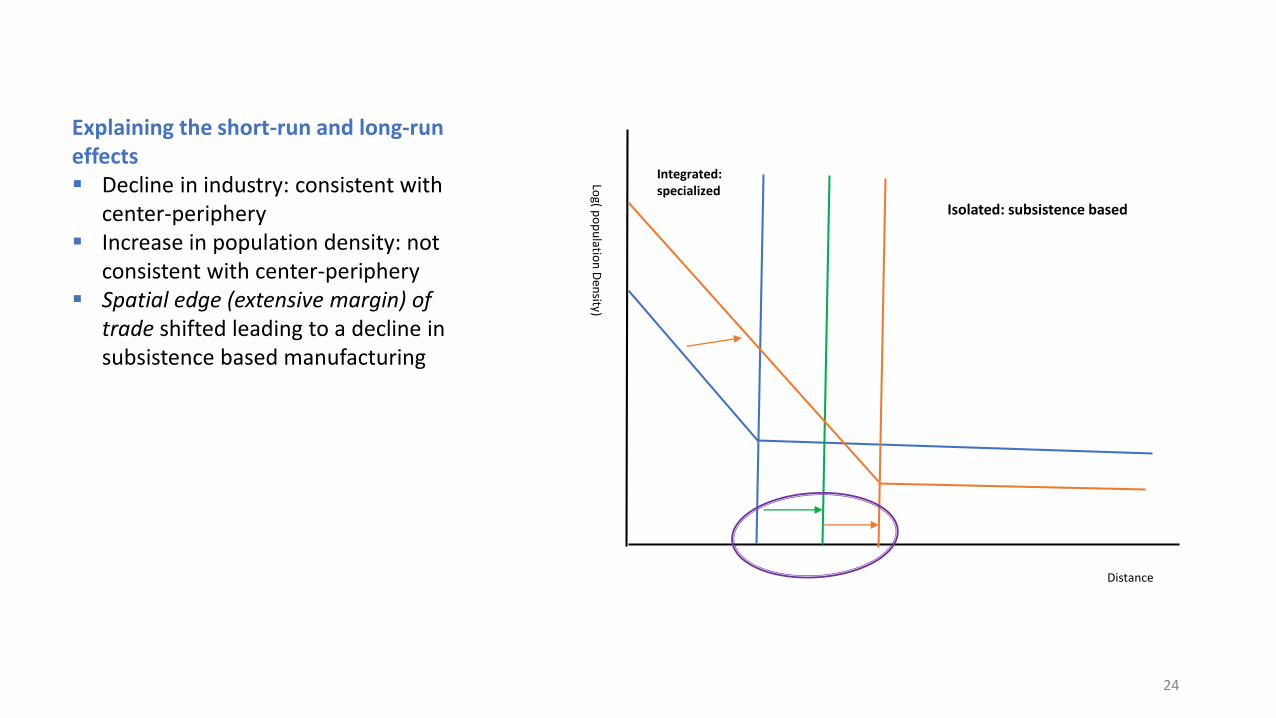
Integrated: specialized
Isolated: subsistence based
Log( p
op
ulatio
n D
ensity)
Distance
Explaining the short-run and long-run effects▪ Decline in industry: consistent with
center-periphery▪ Increase in population density: not
consistent with center-periphery▪ Spatial edge (extensive margin) of
trade shifted leading to a decline in subsistence based manufacturing
24
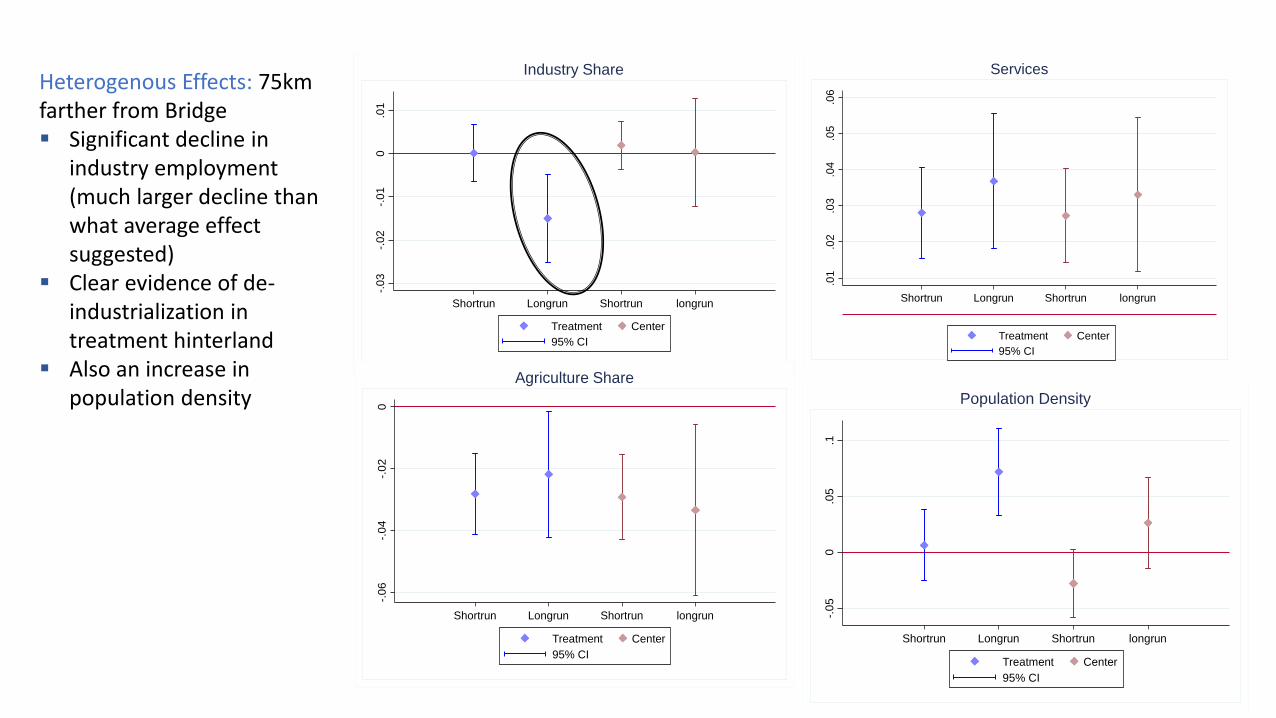
Heterogenous Effects: 75km farther from Bridge▪ Significant decline in
industry employment (much larger decline than what average effect suggested)
▪ Clear evidence of de-industrialization in treatment hinterland
▪ Also an increase in population density
-.0
3-.
02
-.0
10
.01
Shortrun Longrun Shortrun longrun
Treatment Center
95% CI
Industry Share
-.0
6-.
04
-.0
20
Shortrun Longrun Shortrun longrun
Treatment Center
95% CI
Agriculture Share
.01
.02
.03
.04
.05
.06
Shortrun Longrun Shortrun longrun
Treatment Center
95% CI
Services
25
-.0
50
.05
.1
Shortrun Longrun Shortrun longrun
Treatment Center
95% CI
Population Density

Productivity and Welfare Effects
26
-.1
-.0
50
.05
.1
Shortrun Longrun Shortrun longrun
Treatment Center
95% CI
Rice YieldSignificantly higher rice yield
Population density increased!
Welfare improvement instead of desolation! In 1974 famine, most fatality happened in the treatment area. By mid-2000, the same region became bread-basket of the country

Transport/trade costs in Africa
▪ Trade costs are higher in African countries
▪ Examined the issue in the context of landlocked African countries: Mali and Burkina Faso which are more agricultural than Bangladesh
27

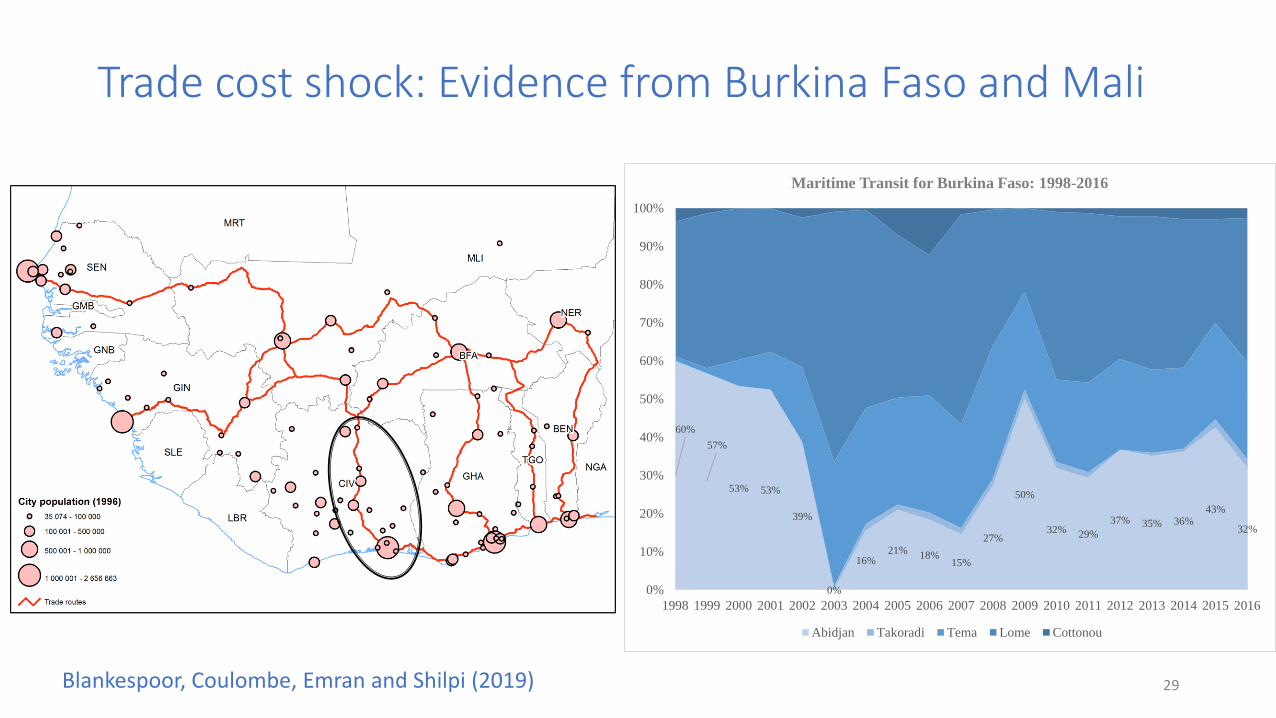
Trade cost shock: Evidence from Burkina Faso and Mali
• Armed civil conflict broke out in Cote d’Ivoire in 2002
• Cote d’Ivoire soccer team qualified for World Cup, 2006 and brought waring parties together for peace negotiation leading to peace treaty in 2007
• Abidjan was the main port handling maritime trade of Mali and Burkina Faso before CIV-crisis
• CIV- crisis led to a re-routing of trade to other routes and ports.
• Examine how re-routing affected spatial organization of activities in Mali and Burkina Faso
Trade cost shock: Evidence from Burkina Faso and Mali
60%
57%
53% 53%
39%
0%
16%21%
18%15%
27%
50%
32% 29%
37% 35% 36%43%
32%
0%
10%
20%
30%
40%
50%
60%
70%
80%
90%
100%
1998 1999 2000 2001 2002 2003 2004 2005 2006 2007 2008 2009 2010 2011 2012 2013 2014 2015 2016
Maritime Transit for Burkina Faso: 1998-2016
Abidjan Takoradi Tema Lome Cottonou
Blankespoor, Coulombe, Emran and Shilpi (2019) 29
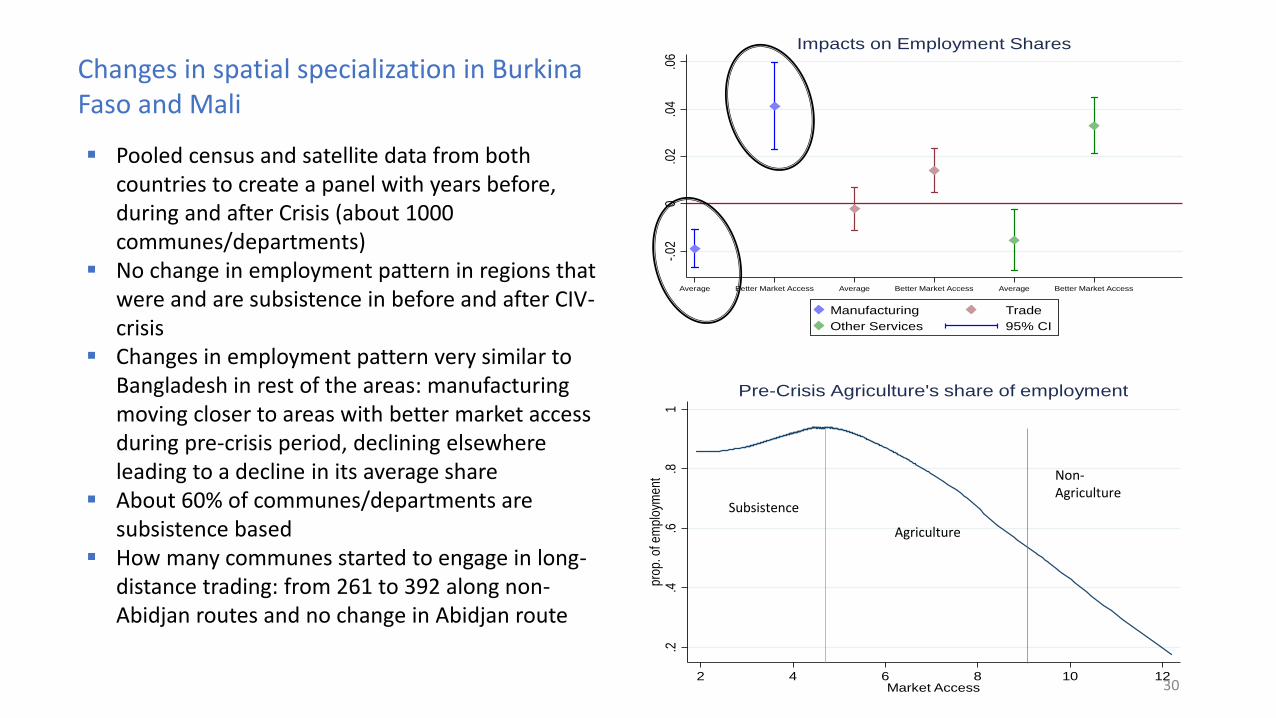
▪ Pooled census and satellite data from both countries to create a panel with years before, during and after Crisis (about 1000 communes/departments)
▪ No change in employment pattern in regions that were and are subsistence in before and after CIV-crisis
▪ Changes in employment pattern very similar to Bangladesh in rest of the areas: manufacturing moving closer to areas with better market access during pre-crisis period, declining elsewhere leading to a decline in its average share
▪ About 60% of communes/departments are subsistence based
▪ How many communes started to engage in long-distance trading: from 261 to 392 along non-Abidjan routes and no change in Abidjan route
-.02
0.0
2.0
4.0
6
Average Better Market Access Average Better Market Access Average Better Market Access
Manufacturing Trade
Other Services 95% CI
Impacts on Employment Shares
.2.4
.6.8
1pr
op. o
f em
ploy
men
t
2 4 6 8 10 12Market Access
Pre-Crisis Agriculture's share of employment
Changes in spatial specialization in Burkina Faso and Mali
30
Non-Agriculture
Agriculture
Subsistence
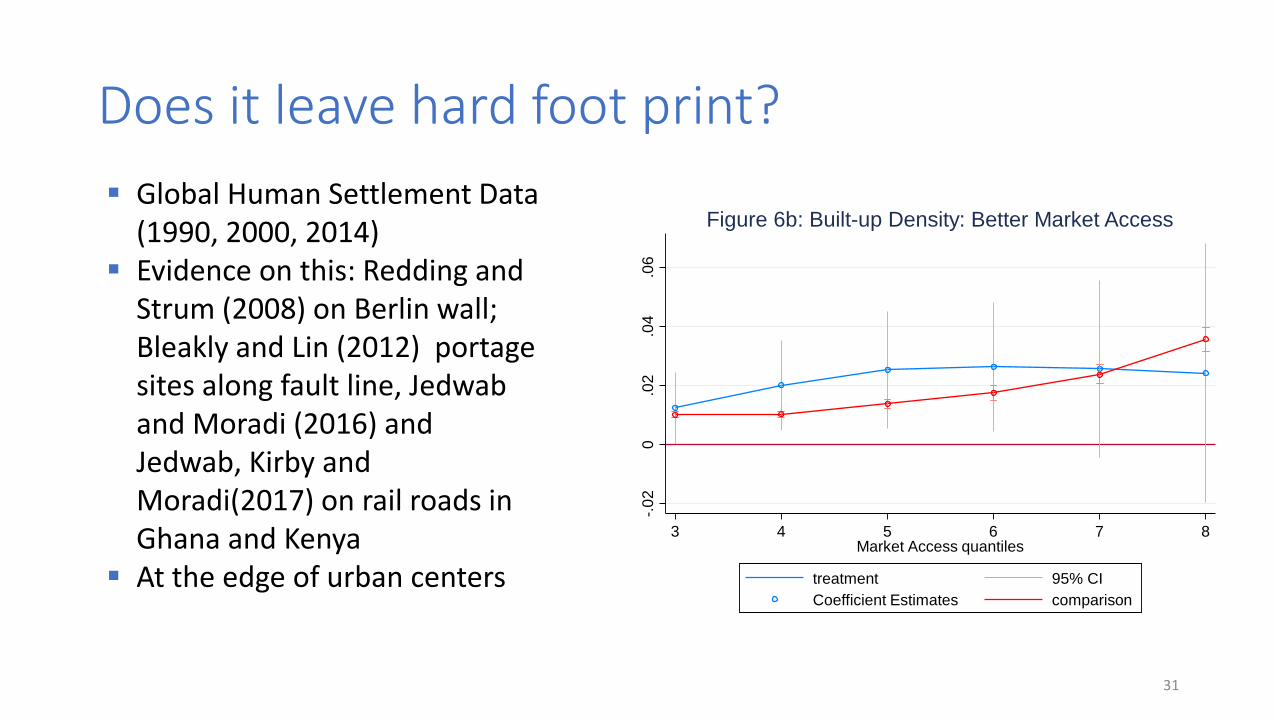
Does it leave hard foot print?
-.0
20
.02
.04
.06
3 4 5 6 7 8Market Access quantiles
treatment 95% CI
Coefficient Estimates comparison
Figure 6b: Built-up Density: Better Market Access▪ Global Human Settlement Data
(1990, 2000, 2014)▪ Evidence on this: Redding and
Strum (2008) on Berlin wall; Bleakly and Lin (2012) portage sites along fault line, Jedwab and Moradi (2016) and Jedwab, Kirby and Moradi(2017) on rail roads in Ghana and Kenya
▪ At the edge of urban centers
31

Remarks
▪ Structural and spatial transformation in response to transport but may not be the way it is often expected: need to see the whole picture
▪ Shift of Spatial Edge of Trade: key to understanding the change in spatial pattern of specialization
▪ Employment transformation more consistent with comparative advantage: Decline in manufacturing could be sign of subsistence based manufacturing disappearing because of changes at the spatial edge of trade and specialization. Placed based industrial policy would not work everywhere
▪ Long term persistence in effects
32

Internal Migration
33
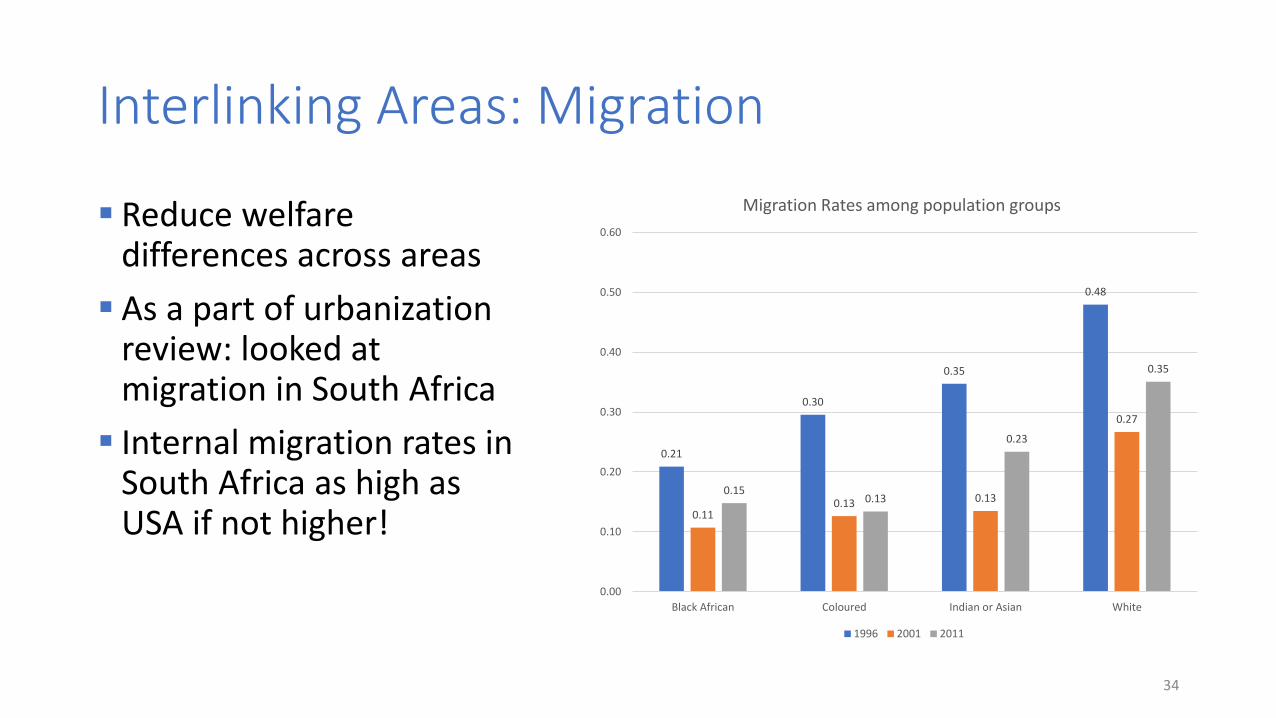
Interlinking Areas: Migration
▪ Reduce welfare differences across areas
▪ As a part of urbanization review: looked at migration in South Africa
▪ Internal migration rates in South Africa as high as USA if not higher!
34
0.21
0.30
0.35
0.48
0.110.13 0.13
0.27
0.150.13
0.23
0.35
0.00
0.10
0.20
0.30
0.40
0.50
0.60
Black African Coloured Indian or Asian White
Migration Rates among population groups
1996 2001 2011
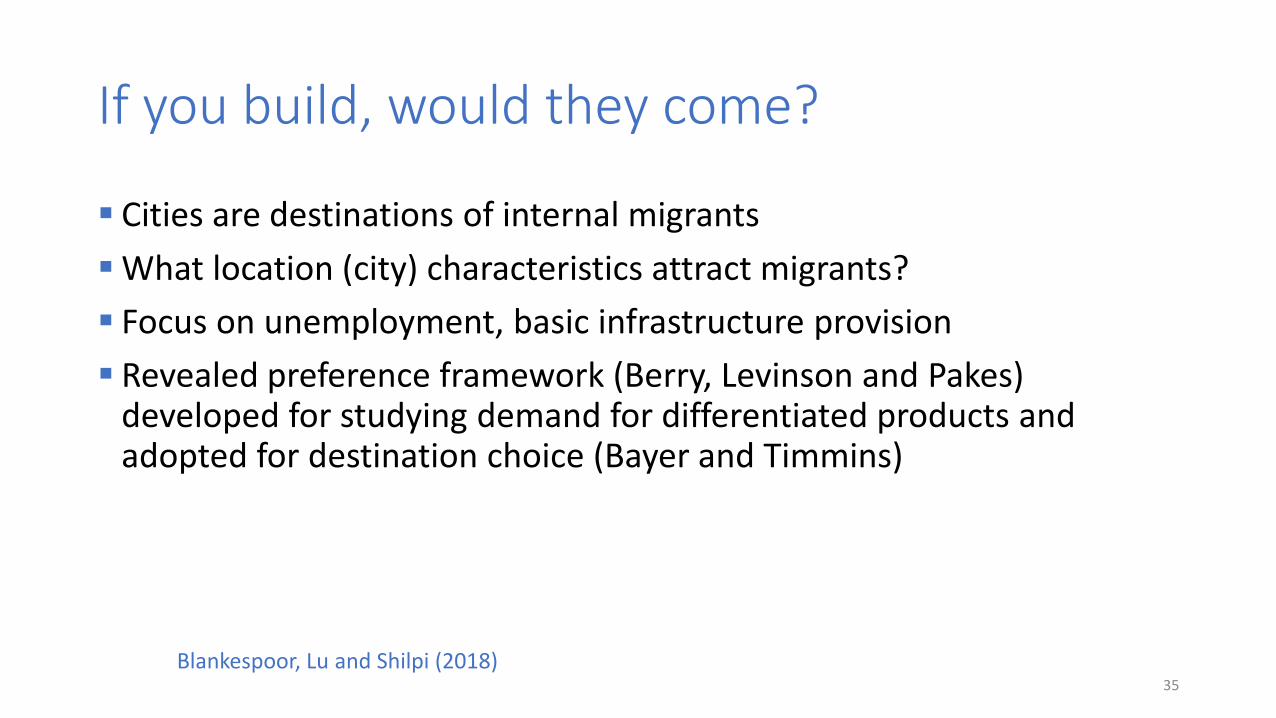
If you build, would they come?
▪ Cities are destinations of internal migrants
▪ What location (city) characteristics attract migrants?
▪ Focus on unemployment, basic infrastructure provision
▪ Revealed preference framework (Berry, Levinson and Pakes) developed for studying demand for differentiated products and adopted for destination choice (Bayer and Timmins)
Blankespoor, Lu and Shilpi (2018)35

Determinants of Migrant’s Choice of Destinations
▪ There are differences between unskilled, skilled Black and white: ▪ Income differences matter more for skilled blacks and whites▪ Distance between origin and destination matters more for unskilled blacks:
Causal evidence on credit constraint (Behal and Shilpi (2018); Ardington, Case and Hosegood (2009)
Unskilled/Semi-Skilled
Black AfricanSkilled Black African White
Predicted Income
Coef. 0.051 0.548 1.486
Std. Error. 0.014 0.016 0.027
Distance
Coef. -0.013 -0.009 -0.005
Std. Error 2.23E-05 1.69E-05 1.66E-05
Linguistic Distance
Coef. -4.956 -4.797 -8.788
Std. Error 0.013 0.011 0.042
36
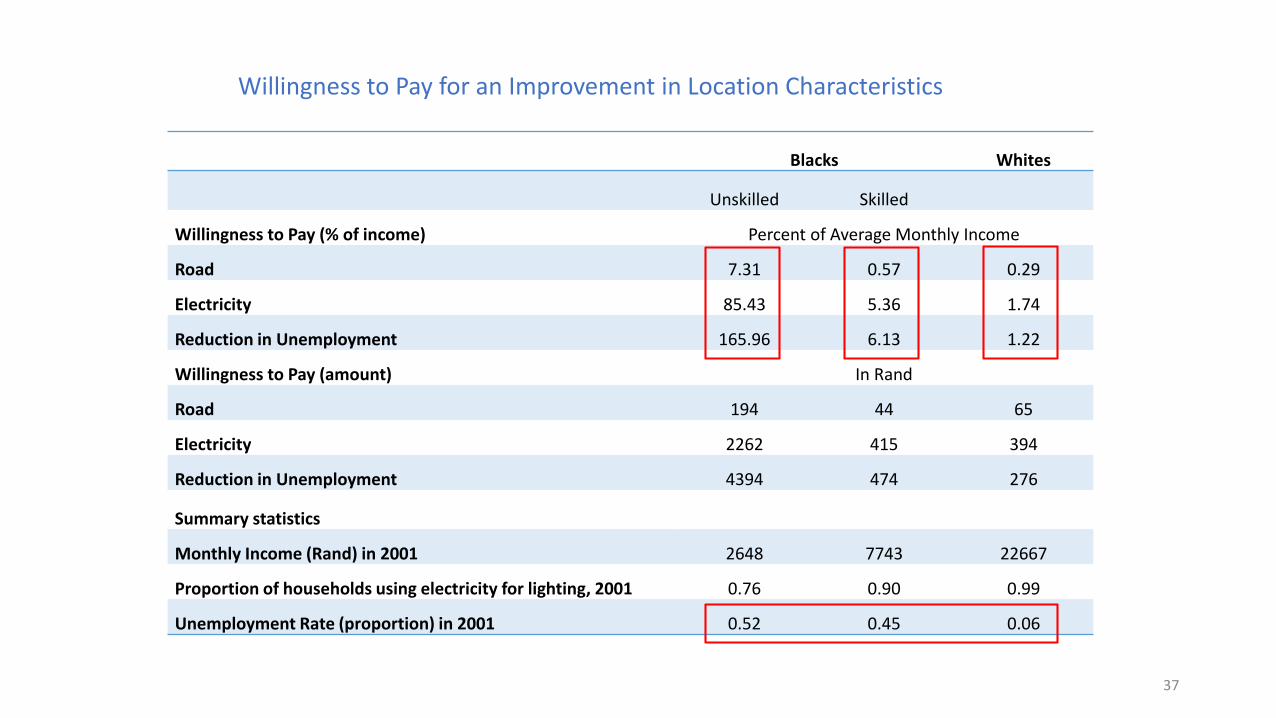
Blacks Whites
Unskilled Skilled
Willingness to Pay (% of income) Percent of Average Monthly Income
Road 7.31 0.57 0.29
Electricity 85.43 5.36 1.74
Reduction in Unemployment 165.96 6.13 1.22
Willingness to Pay (amount) In Rand
Road 194 44 65
Electricity 2262 415 394
Reduction in Unemployment 4394 474 276
Summary statistics
Monthly Income (Rand) in 2001 2648 7743 22667
Proportion of households using electricity for lighting, 2001 0.76 0.90 0.99
Unemployment Rate (proportion) in 2001 0.52 0.45 0.06
Willingness to Pay for an Improvement in Location Characteristics
37

Internal Migration: Main Points
▪ Take way 1:▪ Income differences are important but more so for Skilled Black/White
▪ Distance more important for unskilled black Africans
▪ Migration is important to reduce welfare differences
▪ Take Way 2: Infrastructure/Amenity differences play a big role in migration decision.▪ Migration can lead to increasing regional (within city) inequality, and
intergenerational persistence in poverty.
▪ Diamond(2016): Well-being inequality is much larger (30%) than college-high school wage gap suggests
▪ Placed based policies for human capital formation
38

39
Conclusions

Concluding Remarks
▪ Most cities in poorer developing countries are at an early stage of development
▪ Structural and spatial transformation will happen on the basis of comparative advantage: Place based industrial policies not appropriate everywhere
▪ Migration may not solve all the problems of regional inequality: Place based policy for human capital may be needed
▪ Areas in space are not islands: deep interactions among areas would have to be appreciated in policy making
40


