Page 1
Structural changes in four different precursors with heattreatment at high temperature and resin carbon structural model
Jincai Zhang • Jingli Shi • Yun Zhao •
Quangui Guo • Lang Liu • Zhihai Feng •
Zhen Fan
Received: 29 February 2012 / Accepted: 10 April 2012 / Published online: 28 April 2012
� Springer Science+Business Media, LLC 2012
Abstract Four precursors (mesophase pitch, condensed
polynuclear aromatic resin, polyimide resin, and thermo-
setting phenolic resin) were heat treated at temperatures
from 900 to 3000 �C. These products were characterized by
X-ray diffraction, transmission electron microscopy, and
helium adsorption density instruments. Heterogeneous
graphitization was observed above 2200 �C in the resin
carbons. Various constituents (amorphous, turbostratic, and
graphitic) coexisted and transformed from being disordered
to ordered with increasing treatment temperature. The
molecular structures of the starting materials played
important roles in the proportions of various constituents,
crystallite sizes, and preferred orientation of the graphitic
constituent of the different carbons during high temperature
treatment. High-resolution transmission electron micros-
copy images showed that the structural features of Jenkins’
and Shiraishi’s model all existed in three resin carbons.
Based on these results, we think that their structures are not
belong to Jenkins’ model, also do not belong to Shiraishi’s
model, are a complex of above two models.
Introduction
Carbon is a unique solid substance that can be manipulated
to exhibit broadly different, even controversial, structures
and properties. Some carbons can be extremely strong,
hard, and stiff; other forms can be soft and ductile. These
variations result from structural effects, such as the number
of defects, geomorphology, and amount of carbon phases
with modified extents of crystalline order [1]. Corre-
sponding to the degree of crystallinity, porosity, and
apparent density, Franklin [2] categorized carbon into
graphitizing and non-graphitizing. The structures, proper-
ties, and applications of graphitizing carbons, such as
mesophase pitch (MP) [3, 4], petroleum coke [5–7], coal
pitch coke [8–10], etc., have been extensively studied. The
apparent densities and pores of typical non-graphitizing
carbons (e.g., some carbons derived from thermosetting
resin, named as glassy carbons) have also been investi-
gated. The common feature of non-graphitizing carbons is
the decrease in the apparent density with increasing treat-
ment temperature [11–13]. Some theories involving vol-
ume expansion [14] and thermal strain [15] provide
relatively reasonable explanation. A well-known hetero-
geneous graphitization phenomenon in the high tempera-
ture treatment of some resin carbons [16–19] has been
reported by several studies. However, limited studies exist
on structural changes in these different constituent carbons
as well as the effects of these changes on the microstruc-
ture, apparent density, and porosity of non-graphitization
carbons. This change is very important for further studies
on non-graphitizing carbons.
J. Zhang � J. Shi (&) � Y. Zhao � Q. Guo � L. Liu
Key Laboratory of Carbon Materials, Institute of Coal
Chemistry, Chinese Academy of Sciences,
Taiyuan 030001, China
e-mail: [email protected]
J. Zhang (&)
Graduate University of the Chinese Academy of Sciences,
Beijing 100039, China
e-mail: [email protected]
J. Shi
School of Materials Science and Engineering,
Tianjin Polytechnic University, Tianjin 300387, China
Z. Feng � Z. Fan
National Key Laboratory of Advanced Functional Composites
Materials, Aerospace Research Institute of Material and
Processing Technology, Beijing 10076, China
123
J Mater Sci (2012) 47:5891–5899
DOI 10.1007/s10853-012-6492-1
Page 2
In the present study, the structural changes among multi-
phase carbons produced during the heterogeneous graphi-
tization of three resin carbons were investigated in detail.
Their microstructure features were also discussed. Based
on the discussions and a previous report [11, 16–20], a new
structural model of resin carbons that can demonstrate
the structural and property changes in resin carbons is
proposed.
Experimental
Starting materials
The four carbons investigated were obtained from the
carbonization of three resins, condensed polynuclear aro-
matic (COPNA), polyimide (PI), thermosetting phenolic
(PH), and also MP. Their detailed informations and mol-
ecules are listed in Table 1 and Fig. 1, respectively. The
synthesis of COPNA resin is given in the literature [21].
The synthesis condition was (120–135) �C for 4 h. COP-
NA, PI, and PH were first cured at 220 �C for 6 h, and then
carbonized at 900 �C for 2 h at a rate of 1 �C/min under a
N2 atmosphere.
MP was carbonized at the same condition as above for
comparison with graphitizing carbon.
The as-obtained carbons were COPNA carbon, PI car-
bon, PH carbon, and MP carbon, hereinafter denoted as
COC, PIC, PHC, and MPC, respectively.
Preparation of samples
The four carbons were treated at (1500, 2200, 2600, and
3000) �C for 0.5 h. The temperature for each sample was
increased from room temperature to the given temperature
point at a rate of 15 �C/min under an Ar atmosphere. After
natural cooling, the samples were removed from the
graphitization furnace and stored for analysis. Each sample
was named according to the starting material and treatment
temperature. For example, COC-30 was COPNA carbon
derived from the heat treatment of COC at 3000 �C; PHC-
15, PIC-22, and MPC-26 denoted PHC, PIC, and MPC
treated at (1500, 2200, and 2600) �C, respectively.
Characterization
Every sample treated at the various temperatures was
ground into particulates with diameters of \150 lm to
obtain their (002) diffraction profiles on a Rigaku-D/max-
Va rotate anode X-ray diffractometer with a silicon stan-
dard. The aim is to avoid the shift of diffraction peak to the
lower angle aside and also a broadening of the observed
profile. CuKaX-ray is used, where CuKbis removed by a
graphite counter monochromator. The accelerating voltage
and current applied to the X-ray tube are 30 kV and
100 mA, respectively. High-resolution transmission elec-
tron microscopy (HR-TEM) images of the samples were
obtained on an FEI Tecnai C2F20 field emission TEM. The
apparent densities were measured using an AccuPycII1340
helium adsorption density instrument. The porosities of the
various carbons treated at 3000 �C were calculated as
follows: porosity (%) = (qt - qa)/qt 9 100, where qt and
qa are the true and apparent densities, respectively. qt is
(2.15 and 2.26) g/cm3 for resin and pitch carbon,
Table 1 Manufacturers and product model of starting materials
Starting
materials
Manufacturer Product model
COPNA Experiment synthesis –
PI Qinyang tianyi chemical
Co, Ltd, China
TY005-1
PH Tianjin daying resin
and plastic Co, Ltd, China
413
MP Mitsubishi gas chemical
company Inc, Japan
Ar mesophase
pitch
* CH2 CH2 *
n
C
C
C
C
O
O O
O
N O *N*
n
OH
CH2
OH
*
n
H3C
COPNA PI
PH MP
Fig. 1 Molecules of starting materials
5892 J Mater Sci (2012) 47:5891–5899
123
Page 3
respectively, according to the literature [2]. The interlayer
spacings were calculated using the Bragg equation.
Results and discussion
Structural changes of resin carbons
during heterogeneous graphitization
Figure 2 shows the X-ray diffraction (XRD) profiles of the
four carbons heat-treated at high temperatures. According
to the discussions in the literature [22], when the full width
at half maximum (FWHM) intensity of the observed 002
reflection is more than 0.5�, each diffraction profile of
carbon is necessary to correct for Lorentz factor (L),
polarization factor (P), absorption factor (A) and atomic
scattering factor of carbon (fc). These corrections of dif-
fraction profiles have been made according to the methods
[22]. The profile of the 002 peak was divided into two or
three smaller peaks through multiple peak fit using Voigt
function. The credibility of profile fitting can be examined
with an R factor defined as
R ¼ R2h Ið2hÞ � Prð2hÞj jR2h
� 100½22�
Here, I(2h) is the experimentally observed intensity and
Pr(2h) is the profile fitted by calculation profiles. The three
smaller fitting peaks in the diffraction peak of each sample
in Fig. 2 represent three constituents for PIC and COC,
namely, the amorphous (A-), turbostratic (T-), and
graphitic (G-) constituents [18, 19].However, in the case
of PHC, there were two peaks in the profile of the 002
peak. For MPC, only one peak denoting the G-constituent
was observed in the profile of the 002 peak, which implied
the graphitizable characteristic of MP as reported in the
literature [23]. A remarkable feature observed in the XRD
profiles of the resin carbons was the structural changes that
occurred in the various constituents, i.e., the changes of A
to T and T to G with increasing treatment temperature. This
result indicates that the carbonization process enables the
conversion of the carbon materials from a disordered
structure to an ordered graphitic structure within (2200 to
3000) �C. To understand the change in the amount of
various constituents in resin carbon, the mol% of each
constituent was calculated as follows: mol% = (Ssp /
Sto) 9 100, where Ssp and Sto denote the areas of the
single and total peaks, respectively.
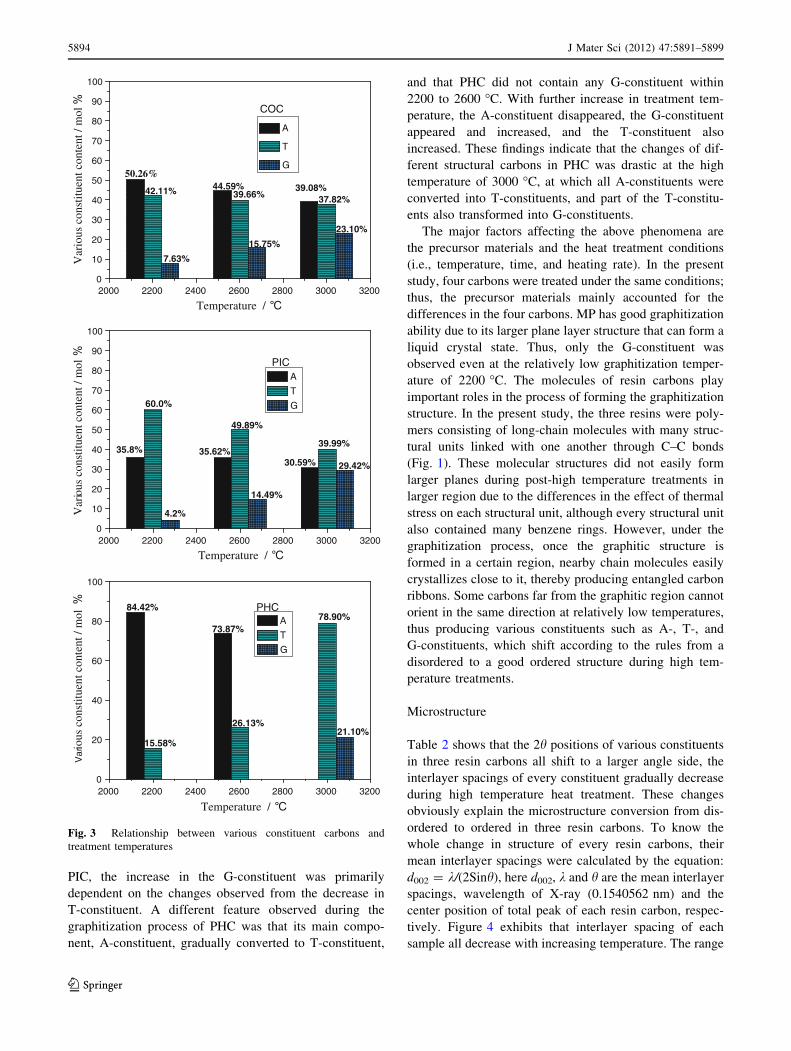
Figure 3 shows that the A-constituent in COC dramati-
cally decreased from 50.26 % at 2200 �C to 39.08 % at
3000 �C with increasing treatment temperature. The
T-constituent slightly decreased and the G-constituent
visibly increased to 23.10 % at 3000 �C from 7.63 % at
2200 �C. An obviously distinct change compared with
COC was observed in PIC. The A-constituent slightly
decreased and the T-constituent sharply decreased from
60 % at 2200 �C to 39.99 % at 3000 �C. PIC exhibited a
tendency similar to COC in that the G-constituent also
significantly increased. These phenomena indicated that the
amount of the shift from A to T was more, and the one of T
to G was less for COC than PIC. However, in the case of
PIC-22
R=9.66
A
T
G
R=7.15
PIC-26
A
T
G
16 18 20 22 24 26 28 30 32 34
PIC-30
R=2.85
A
T
G
16 18 20 22 24 26 28 30 32 34
COC-30
R=6.12
A
T
G
COC-26
R=8.02
A
T
G
COC-22
R=7.36
A
T
G
MPC-22
MPC-26
16 18 20 22 24 26 28 30 32 34
MPC-30
PHC-22R=11.28
T
A
16 18 20 22 24 26 28 30 32 34
PHC-30
R=8.26
T
G
PHC-26R=10.58
A
G
Fig. 2 Profiles of XRD for various carbons (black and red solid lines are origin and fitting peaks, respectively)
J Mater Sci (2012) 47:5891–5899 5893
123
Page 4
PIC, the increase in the G-constituent was primarily
dependent on the changes observed from the decrease in
T-constituent. A different feature observed during the
graphitization process of PHC was that its main compo-
nent, A-constituent, gradually converted to T-constituent,
and that PHC did not contain any G-constituent within
2200 to 2600 �C. With further increase in treatment tem-
perature, the A-constituent disappeared, the G-constituent
appeared and increased, and the T-constituent also
increased. These findings indicate that the changes of dif-
ferent structural carbons in PHC was drastic at the high
temperature of 3000 �C, at which all A-constituents were
converted into T-constituents, and part of the T-constitu-
ents also transformed into G-constituents.
The major factors affecting the above phenomena are
the precursor materials and the heat treatment conditions
(i.e., temperature, time, and heating rate). In the present
study, four carbons were treated under the same conditions;
thus, the precursor materials mainly accounted for the
differences in the four carbons. MP has good graphitization
ability due to its larger plane layer structure that can form a
liquid crystal state. Thus, only the G-constituent was
observed even at the relatively low graphitization temper-
ature of 2200 �C. The molecules of resin carbons play
important roles in the process of forming the graphitization
structure. In the present study, the three resins were poly-
mers consisting of long-chain molecules with many struc-
tural units linked with one another through C–C bonds
(Fig. 1). These molecular structures did not easily form
larger planes during post-high temperature treatments in
larger region due to the differences in the effect of thermal
stress on each structural unit, although every structural unit
also contained many benzene rings. However, under the
graphitization process, once the graphitic structure is
formed in a certain region, nearby chain molecules easily
crystallizes close to it, thereby producing entangled carbon
ribbons. Some carbons far from the graphitic region cannot
orient in the same direction at relatively low temperatures,
thus producing various constituents such as A-, T-, and
G-constituents, which shift according to the rules from a
disordered to a good ordered structure during high tem-
perature treatments.
Microstructure
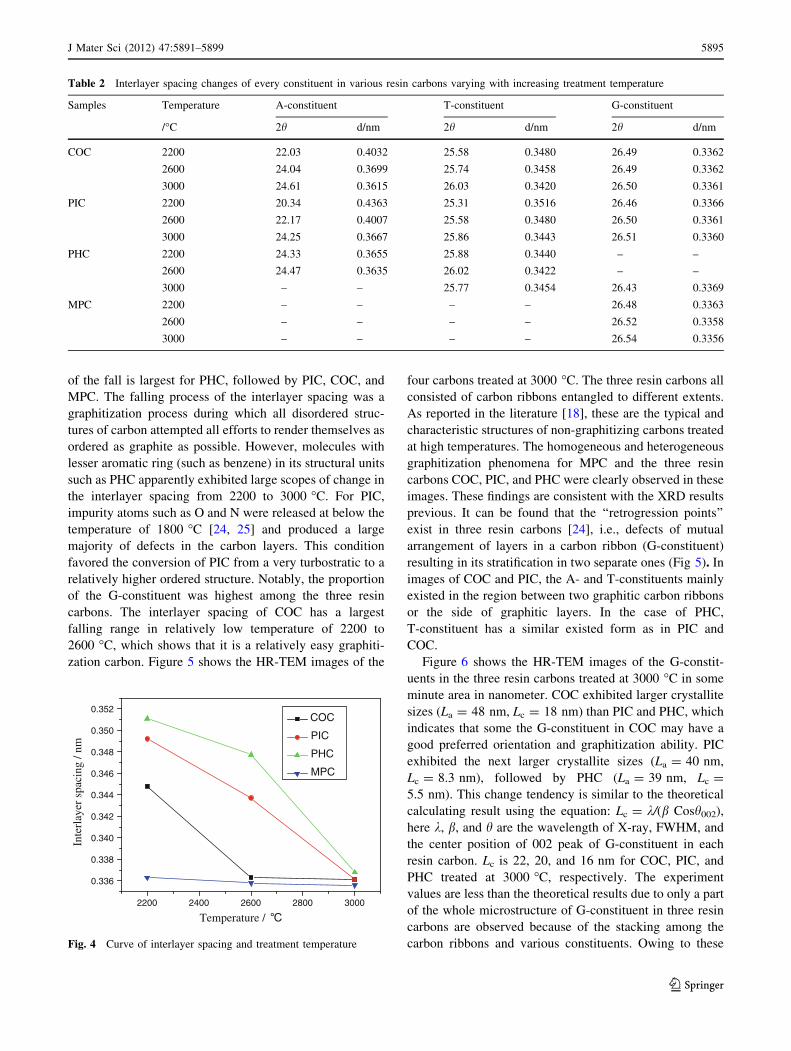
Table 2 shows that the 2h positions of various constituents
in three resin carbons all shift to a larger angle side, the
interlayer spacings of every constituent gradually decrease
during high temperature heat treatment. These changes
obviously explain the microstructure conversion from dis-
ordered to ordered in three resin carbons. To know the
whole change in structure of every resin carbons, their
mean interlayer spacings were calculated by the equation:
d002 = k/(2Sinh), here d002, k and h are the mean interlayer
spacings, wavelength of X-ray (0.1540562 nm) and the
center position of total peak of each resin carbon, respec-
tively. Figure 4 exhibits that interlayer spacing of each
sample all decrease with increasing temperature. The range
2000 2200 2400 2600 2800 3000 32000
10
20
30
40
50
60
70
80
90
100V
ario
us c
onst
ituen
t con
tent
/ m
ol
Temperature /
A
T
G
COC
50.26%
42.11%
7.63%
44.59%39.66%
15.75%
39.08%37.82%
23.10%
2000 2200 2400 2600 2800 3000 32000
20
40
60
80
100
Var
ious
con
stitu
ent c
onte
nt /
mol A
T
G
PHC84.42%
15.58%
73.87%
26.13%
78.90%
21.10%
2000 2200 2400 2600 2800 3000 32000
10
20
30
40
50
60
70
80
90
100
Var
i ous
con
stitu
ent c
onte
nt /
mol
Temperature /
Temperature /
A
T
G
PIC
35.8%
60.0%
4.2%
35.62%
49.89%
14.49%
30.59%
39.99%
29.42%
Fig. 3 Relationship between various constituent carbons and
treatment temperatures
5894 J Mater Sci (2012) 47:5891–5899
123
Page 5
of the fall is largest for PHC, followed by PIC, COC, and
MPC. The falling process of the interlayer spacing was a
graphitization process during which all disordered struc-
tures of carbon attempted all efforts to render themselves as
ordered as graphite as possible. However, molecules with
lesser aromatic ring (such as benzene) in its structural units
such as PHC apparently exhibited large scopes of change in
the interlayer spacing from 2200 to 3000 �C. For PIC,
impurity atoms such as O and N were released at below the
temperature of 1800 �C [24, 25] and produced a large
majority of defects in the carbon layers. This condition
favored the conversion of PIC from a very turbostratic to a
relatively higher ordered structure. Notably, the proportion
of the G-constituent was highest among the three resin
carbons. The interlayer spacing of COC has a largest
falling range in relatively low temperature of 2200 to
2600 �C, which shows that it is a relatively easy graphiti-
zation carbon. Figure 5 shows the HR-TEM images of the
four carbons treated at 3000 �C. The three resin carbons all
consisted of carbon ribbons entangled to different extents.
As reported in the literature [18], these are the typical and
characteristic structures of non-graphitizing carbons treated
at high temperatures. The homogeneous and heterogeneous
graphitization phenomena for MPC and the three resin
carbons COC, PIC, and PHC were clearly observed in these
images. These findings are consistent with the XRD results
previous. It can be found that the ‘‘retrogression points’’
exist in three resin carbons [24], i.e., defects of mutual
arrangement of layers in a carbon ribbon (G-constituent)
resulting in its stratification in two separate ones (Fig 5). In
images of COC and PIC, the A- and T-constituents mainly
existed in the region between two graphitic carbon ribbons
or the side of graphitic layers. In the case of PHC,
T-constituent has a similar existed form as in PIC and
COC.
Figure 6 shows the HR-TEM images of the G-constit-
uents in the three resin carbons treated at 3000 �C in some
minute area in nanometer. COC exhibited larger crystallite
sizes (La = 48 nm, Lc = 18 nm) than PIC and PHC, which
indicates that some the G-constituent in COC may have a
good preferred orientation and graphitization ability. PIC
exhibited the next larger crystallite sizes (La = 40 nm,
Lc = 8.3 nm), followed by PHC (La = 39 nm, Lc =
5.5 nm). This change tendency is similar to the theoretical
calculating result using the equation: Lc = k/(b Cosh002),
here k, b, and h are the wavelength of X-ray, FWHM, and
the center position of 002 peak of G-constituent in each
resin carbon. Lc is 22, 20, and 16 nm for COC, PIC, and
PHC treated at 3000 �C, respectively. The experiment
values are less than the theoretical results due to only a part
of the whole microstructure of G-constituent in three resin
carbons are observed because of the stacking among the
carbon ribbons and various constituents. Owing to these
Table 2 Interlayer spacing changes of every constituent in various resin carbons varying with increasing treatment temperature
Samples Temperature A-constituent T-constituent G-constituent
/�C 2h d/nm 2h d/nm 2h d/nm
COC 2200 22.03 0.4032 25.58 0.3480 26.49 0.3362
2600 24.04 0.3699 25.74 0.3458 26.49 0.3362
3000 24.61 0.3615 26.03 0.3420 26.50 0.3361
PIC 2200 20.34 0.4363 25.31 0.3516 26.46 0.3366
2600 22.17 0.4007 25.58 0.3480 26.50 0.3361
3000 24.25 0.3667 25.86 0.3443 26.51 0.3360
PHC 2200 24.33 0.3655 25.88 0.3440 – –
2600 24.47 0.3635 26.02 0.3422 – –
3000 – – 25.77 0.3454 26.43 0.3369
MPC 2200 – – – – 26.48 0.3363
2600 – – – – 26.52 0.3358
3000 – – – – 26.54 0.3356
2200 2400 2600 2800 3000
0.336
0.338
0.340
0.342
0.344
0.346
0.348
0.350
0.352
Inte
rlay
er s
paci
ng /
nm
Temperature /
COC
PIC
PHC
MPC
Fig. 4 Curve of interlayer spacing and treatment temperature
J Mater Sci (2012) 47:5891–5899 5895
123
Page 6
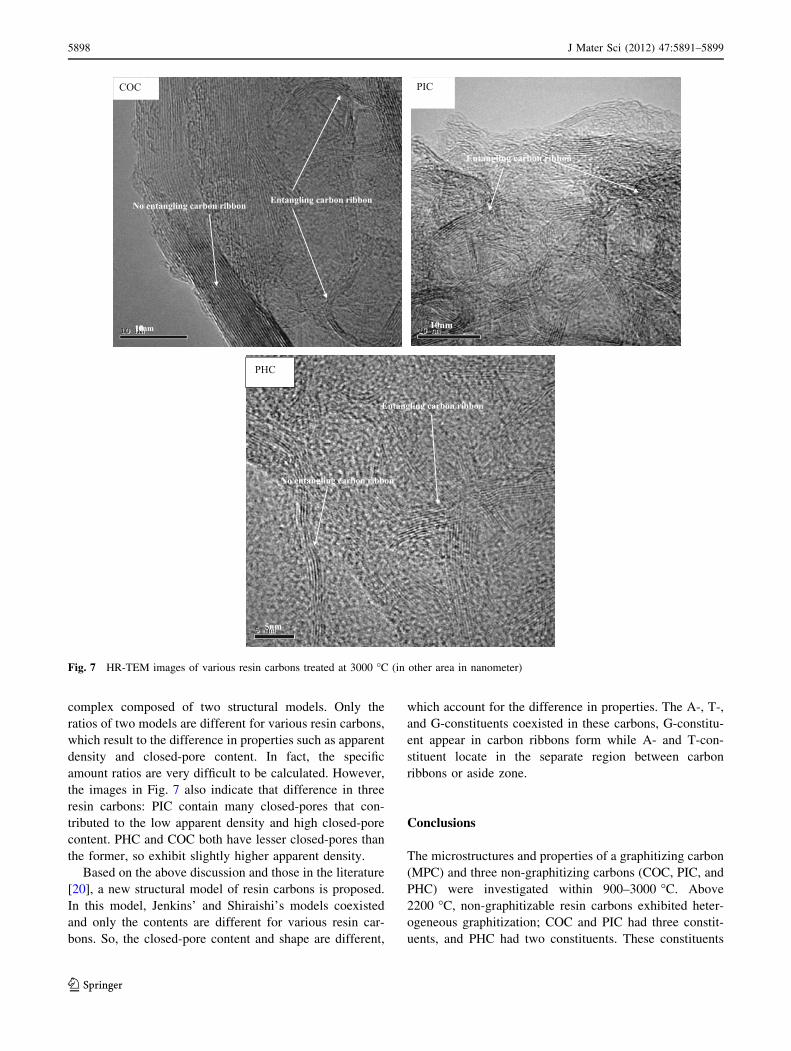
reasons, in more area, the crystallite parameters of these
resins are smaller. The images of these resin carbon
(Fig. 7) show that there are a majority of carbon ribbons
that are long and stiff or flexible carbon ribbon that tangled
each other in a very quaint manner, or the two type forms
carbon ribbon coexisted in a sample. A typical feature in
PIC is that almost all carbon ribbons are entangled, trans-
form into each other, are stratified in some separate ones,
and merge in one ribbon with others, forming a complex
polymer-like structure. The spaces between the stacks form
micropores of various configuration and sizes [26]. How-
ever, for COC and PHC, they are a combination of carbon
ribbons with or without entangling each other. Observed all
images in Figs. 6, 7, and 8, in nature, three resin carbons all
are the combination carbons inside of which existing two
graphitic carbon layers such as no-entangling or entangling
each other, T-constituent, or A-constituent lie in the side of
these carbon ribbons or the separate region between carbon
ribbons. Only difference among three resin carbons is the
amount of these various form (G-,A- and T) constituents is
different for different resin carbons.
The molecules of the starting materials may explain the
above results, including the change in the interlayer spac-
ing during high temperature treatments and the properties
of the G-constituent. As shown in Fig. 3, the large plane
molecule of MP is made of many benzene rings, which is
considered as a graphitizing material [23]. For resin car-
bon, more benzene rings and heterocycles contained in the
structural unit of molecules corresponded to less impurity
elements (N, O, S, and so on) and to the easier graphiti-
zation of the resin. PIC-30 contained more G-constituents
than the other resin carbons due to the presence of more
benzene and heterocycle rings in the PI molecules. How-
ever, the release of more impurity atoms (5O and 2 N in a
structure unit) at below 1800 �C resulted in many plane
defects inside the carbon layers. These defects were kept
partly during the graphitization process due to the struc-
tural rearrangement of lattice defects [27], which is the
reason why the crystallite parameters are not the largest
among the three resin carbons, as shown in Fig. 6. COPNA
resin has relatively more benzene rings and no impurity
atom in its structural unit, the two advantages that enabled
Fig. 5 HR-TEM images of four precursor carbons treated at 3000 �C
5896 J Mater Sci (2012) 47:5891–5899
123
Page 7
COC to possess the largest crystallite sizes. In the case of
PHC, only a benzene ring in conjunction with an oxygen
atom lying in the structural unit is the reason why PHC did
not have both a large layer size (La) and stack height (Lc) in
spite of these crystallite parameters are in local area.
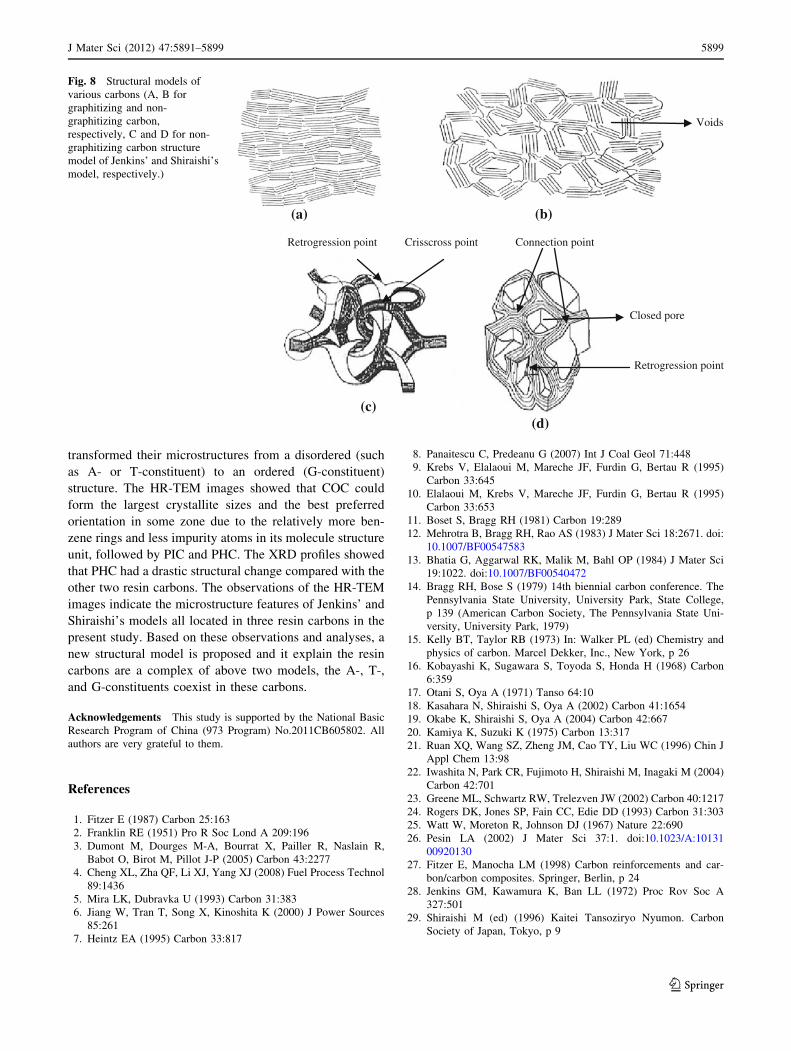
Structural model of resin carbon
Figure 8 shows the structural models of graphitizing and
non-graphitizing carbons. MPC is ascribed to A (Flanklin’s
model of graphitizing carbon [2] B, C, and D are non-
graphitizing models proposed by Flanklin [2], Jenkins [28],
and Shiraishi [29], respectively). C consists of entangled
carbon ribbons and has little closed-pores, consequently
showing the highest apparent density. All three resin car-
bons in the present study had small apparent densities;
1.64, 1.49, and 1.57 g/cm3 for COC-30, PIC-30, and
PHC-30, respectively. The true density of non-graphitizing
carbon is 2.1–2.2 g/cm3 [2], which means three resin
carbons.
All have many closed-pores. The closed-pore volume
fractions are 23.72, 30.7, and 26.98 % for COC-30, PIC-
30, and PHC-30, respectively, if selecting true density is
2.15 g/cm3. B and D models in Fig. 8 can well explain the
low apparent density of the three resin carbons, although a
better approach would be to consider the various constit-
uents A, T, and G. The amount and shape of the closed
pores were also different for the various resin carbons.
Analysis from the microstructure feature, Jenkins’ model
contains ‘‘retrogression points’’ and ‘‘crisscross point’’ of
carbon ribbons, while Shiraishi’s model contains ‘‘retro-
gression points’’ and ‘‘connection point’’ of carbon ribbons
(Fig. 8). Figures 5 and 7 both show the three resin carbons
all have these features, which indicates they are practically
Fig. 6 HR-TEM images of G-constituents in various resin carbons treated at 3000 �C (in some minute area in nanometer)
J Mater Sci (2012) 47:5891–5899 5897
123
Page 8
complex composed of two structural models. Only the
ratios of two models are different for various resin carbons,
which result to the difference in properties such as apparent
density and closed-pore content. In fact, the specific
amount ratios are very difficult to be calculated. However,
the images in Fig. 7 also indicate that difference in three
resin carbons: PIC contain many closed-pores that con-
tributed to the low apparent density and high closed-pore
content. PHC and COC both have lesser closed-pores than
the former, so exhibit slightly higher apparent density.
Based on the above discussion and those in the literature
[20], a new structural model of resin carbons is proposed.
In this model, Jenkins’ and Shiraishi’s models coexisted
and only the contents are different for various resin car-
bons. So, the closed-pore content and shape are different,
which account for the difference in properties. The A-, T-,
and G-constituents coexisted in these carbons, G-constitu-
ent appear in carbon ribbons form while A- and T-con-
stituent locate in the separate region between carbon
ribbons or aside zone.
Conclusions
The microstructures and properties of a graphitizing carbon
(MPC) and three non-graphitizing carbons (COC, PIC, and
PHC) were investigated within 900–3000 �C. Above
2200 �C, non-graphitizable resin carbons exhibited heter-
ogeneous graphitization; COC and PIC had three constit-
uents, and PHC had two constituents. These constituents
Fig. 7 HR-TEM images of various resin carbons treated at 3000 �C (in other area in nanometer)
5898 J Mater Sci (2012) 47:5891–5899
123
Page 9
transformed their microstructures from a disordered (such
as A- or T-constituent) to an ordered (G-constituent)
structure. The HR-TEM images showed that COC could
form the largest crystallite sizes and the best preferred
orientation in some zone due to the relatively more ben-
zene rings and less impurity atoms in its molecule structure
unit, followed by PIC and PHC. The XRD profiles showed
that PHC had a drastic structural change compared with the
other two resin carbons. The observations of the HR-TEM
images indicate the microstructure features of Jenkins’ and
Shiraishi’s models all located in three resin carbons in the
present study. Based on these observations and analyses, a
new structural model is proposed and it explain the resin
carbons are a complex of above two models, the A-, T-,
and G-constituents coexist in these carbons.
Acknowledgements This study is supported by the National Basic
Research Program of China (973 Program) No.2011CB605802. All
authors are very grateful to them.
References
1. Fitzer E (1987) Carbon 25:163
2. Franklin RE (1951) Pro R Soc Lond A 209:196
3. Dumont M, Dourges M-A, Bourrat X, Pailler R, Naslain R,
Babot O, Birot M, Pillot J-P (2005) Carbon 43:2277
4. Cheng XL, Zha QF, Li XJ, Yang XJ (2008) Fuel Process Technol
89:1436
5. Mira LK, Dubravka U (1993) Carbon 31:383
6. Jiang W, Tran T, Song X, Kinoshita K (2000) J Power Sources
85:261
7. Heintz EA (1995) Carbon 33:817
8. Panaitescu C, Predeanu G (2007) Int J Coal Geol 71:448
9. Krebs V, Elalaoui M, Mareche JF, Furdin G, Bertau R (1995)
Carbon 33:645
10. Elalaoui M, Krebs V, Mareche JF, Furdin G, Bertau R (1995)
Carbon 33:653
11. Boset S, Bragg RH (1981) Carbon 19:289
12. Mehrotra B, Bragg RH, Rao AS (1983) J Mater Sci 18:2671. doi:
10.1007/BF00547583
13. Bhatia G, Aggarwal RK, Malik M, Bahl OP (1984) J Mater Sci
19:1022. doi:10.1007/BF00540472
14. Bragg RH, Bose S (1979) 14th biennial carbon conference. The
Pennsylvania State University, University Park, State College,
p 139 (American Carbon Society, The Pennsylvania State Uni-
versity, University Park, 1979)
15. Kelly BT, Taylor RB (1973) In: Walker PL (ed) Chemistry and
physics of carbon. Marcel Dekker, Inc., New York, p 26
16. Kobayashi K, Sugawara S, Toyoda S, Honda H (1968) Carbon
6:359
17. Otani S, Oya A (1971) Tanso 64:10
18. Kasahara N, Shiraishi S, Oya A (2002) Carbon 41:1654
19. Okabe K, Shiraishi S, Oya A (2004) Carbon 42:667
20. Kamiya K, Suzuki K (1975) Carbon 13:317
21. Ruan XQ, Wang SZ, Zheng JM, Cao TY, Liu WC (1996) Chin J
Appl Chem 13:98
22. Iwashita N, Park CR, Fujimoto H, Shiraishi M, Inagaki M (2004)
Carbon 42:701
23. Greene ML, Schwartz RW, Trelezven JW (2002) Carbon 40:1217
24. Rogers DK, Jones SP, Fain CC, Edie DD (1993) Carbon 31:303
25. Watt W, Moreton R, Johnson DJ (1967) Nature 22:690
26. Pesin LA (2002) J Mater Sci 37:1. doi:10.1023/A:10131
00920130
27. Fitzer E, Manocha LM (1998) Carbon reinforcements and car-
bon/carbon composites. Springer, Berlin, p 24
28. Jenkins GM, Kawamura K, Ban LL (1972) Proc Rov Soc A
327:501
29. Shiraishi M (ed) (1996) Kaitei Tansoziryo Nyumon. Carbon
Society of Japan, Tokyo, p 9
Connection point
Retrogression point
Voids
(a) (b)
(c)(d)
Crisscross pointRetrogression point
Closed pore
Fig. 8 Structural models of
various carbons (A, B for
graphitizing and non-
graphitizing carbon,
respectively, C and D for non-
graphitizing carbon structure
model of Jenkins’ and Shiraishi’s
model, respectively.)
J Mater Sci (2012) 47:5891–5899 5899
123