European COoperation in the field of Scientific and Technical Research 1 Group Project 5 STRUCTURAL CONDITION EVALUATION OF PRESTRESSED CONCRETE STRUCTURES BASED ON ACOUSTIC MONITORING Co-ordinator: Stanislaw RADKOWSKI Working Group 3 - "New assessment methods"
Transcript
European COoperation in the field of Scientific and Technical Research
1
Group Project 5
STRUCTURAL CONDITION EVALUATION OF PRESTRESSED CONCRETE STRUCTURES
BASED ON ACOUSTIC MONITORING
Co-ordinator: Stanisław RADKOWSKI
Working Group 3 - "New assessment methods"
European COoperation in the field of Scientific and Technical Research
2
Participiants:
• Warsaw University of Technology - ������������ ����
• KWH Bautechnologen AG - ������� ���� ����� ������ ����������
• AGH University of Science and Technology - �����������������
• Poznan University of Technology - ����ł�� ������� ��� ���������
• Budapest University of Technology and Economics (BUTE) -!�$�%�&�����
• National Technical University of Athens - ' �������� ������
European COoperation in the field of Scientific and Technical Research
3
Problem:To evaluate the structural condition of prestressedconcrete structure by means of vibro-acoustic monitoring and by improving the applicability of the dynamic evaluation techniques
Basic assumption – increase and decrease of prestressing forces are accompanied by a change of stress distribution in the cross-section of concrete structure. The parameters of propagation path will change due to this phenomena.
European COoperation in the field of Scientific and Technical Research
4
1500
200
(199
)
100 (98)
260
260
700
Fo
UY
UX
1
1 6
9
1
13
2
15
1300
4
50
3X
Z
Y
X
Z
Y
4207
580 8
50
X
Z
Y
10
12
11
420580
5
X
Z
Y
14
X
Z
Y
225
What is the frequency stucture of a pulse?How it depends on: technical state and failure evolution?
WARSAW UNIVERSITY OF TECHNOLOGYThe Faculty of Automotive and Construction Machinery Engineering
European COoperation in the field of Scientific and Technical Research
5
1500
200
(199
)
100 (98)
260
260
700
Fo
UY
UX
1
1 6
9
1
13
2
15
1300
4
50
3X
Z
Y
X
Z
Y
4207
580 8
50
X
Z
Y
10
12
11
420580
5
X
Z
Y
14
X
Z
Y
225
Kielce measurement – prestressedconcrete beam, bending force (changeable) applied in middle, measuring vibrations exceeded with impulse. Various prestressed beams examined.
4200 4400 4600 4800 5000 5200 54000
0.005
0.01
0.015
0.02
0.025
0.03
0.03515 kN30 kN
Frequency [Hz]
Am
plitu
de
0 2000 4000 6000 8000 10000 12000 14000
0.005
0.01
0.015
0 ..02
0 ..025
0.03
1464
2137
4620
6947
2890
Frequency [Hz]
Am
plitu
de
European COoperation in the field of Scientific and Technical Research
6
0 10 20 30 40 50 60 70 0.7
0.75
0.8
0.85
0.9
0.95
1
1.05
Fre
qu
en
cy [F
/Fm
ax]
Force [ kN]
Natural freq. 1500 [Hz ]Natural freq. 7000 [Hz ]
before failure -dispersion phenomena
after failure – change of natural frequency
change of phase velocity
change of Young`s modulus
ρ�
� � =change of group velocity
amplitude modulation of carrier function
(
(( ()�
�
�
����� ++=
ρ
European COoperation in the field of Scientific and Technical Research
7
1500
200
(199
)
100 (98)
260
260
700
UY
UX
1
1 6
9
1
13
2
15
1300
4
50
3X
Z
Y
X
Z
Y
4207
580 8
50
X
Z
Y
10
12
11
420580
5
X
Z
Y
14
X
Z
Y
225
Without dispersion phenomena
European COoperation in the field of Scientific and Technical Research
8
Phase velocity
*(++
*(,+
*)++
*),+
**++
**,+
(+ )+ *+ ,+ -+ .+ /+ 0+ 1++
2����������%3 �����4
5�� ���� 3������ �����6���7�
European COoperation in the field of Scientific and Technical Research
9
Spectrum
European COoperation in the field of Scientific and Technical Research
10
1500
200
(199
)
100 (98)
260
260
700
UY
UX
1
1 6
9
1
13
2
15
1300
4
50
3X
Z
Y
X
Z
Y
4207
580 8
50
X
Z
Y
10
12
11
420580
5
X
Z
Y
14
X
Z
Y
225
Fo
DISPERSION!
European COoperation in the field of Scientific and Technical Research
11
Phase velocity
European COoperation in the field of Scientific and Technical Research
12
Effect ofdispersion
European COoperation in the field of Scientific and Technical Research
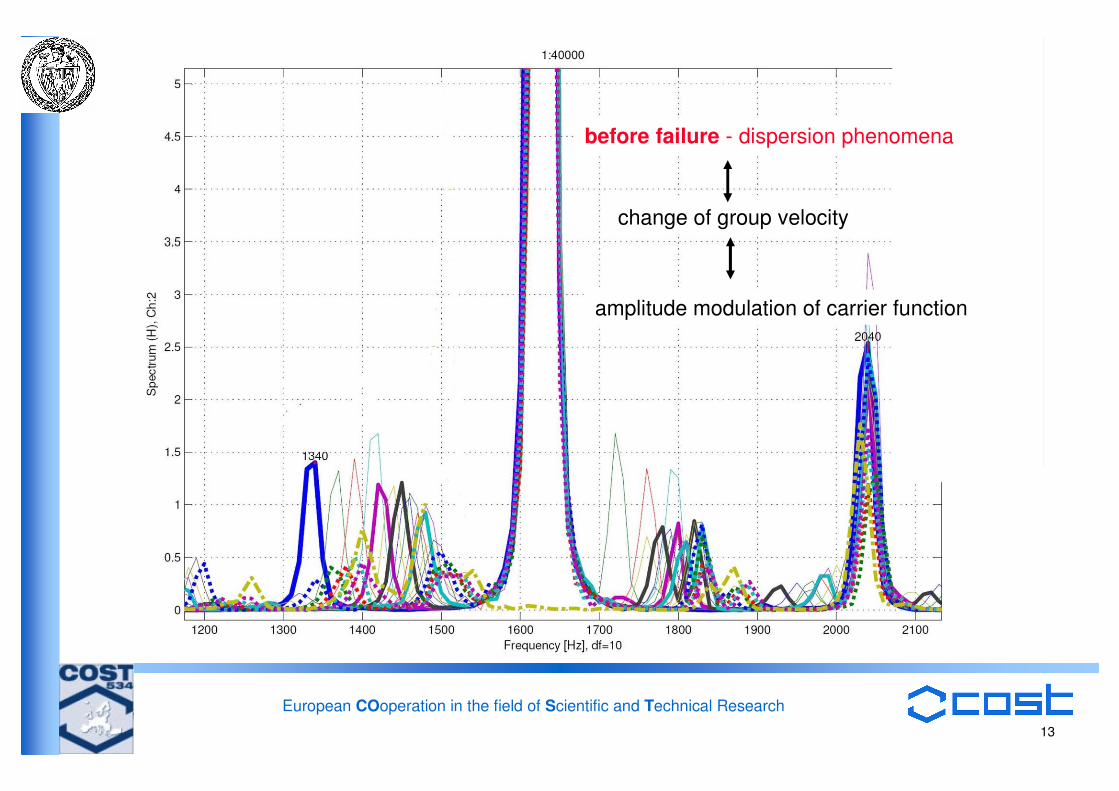
13
change of group velocity
amplitude modulation of carrier function
before failure - dispersion phenomena
European COoperation in the field of Scientific and Technical Research
14
Load value Evnelope amplitude distribution [m/s2]
0 10 20 30 40 50 60 70 0.7
0.75
0.8
0.85
0.9
0.95
1
1.05
Fre
qu
en
cy [F
/Fm
ax]
Force [ kN]
Natural freq. 1500 [Hz ]Natural freq. 7000 [Hz ]
Probability distribution of amplitude of evnelope value
European COoperation in the field of Scientific and Technical Research
Three test methods were developed and verified in the frame of the researches for prestressed concrete structures for the testing and assessment of the structure condition.
The test methods are based on:
time-modal analysis method,energy method of diagnostics, load power distribution analysis.
The elaborated research methods make the use of the analysis of vibroacoustic signals.
The vibration signals are taken from the tested structure and these have a form of decaying free vibrations.
The structure was excited by impact force .
Test stand
One can distinguish the several basic steps of the investigations.
In addition, the FEM model of the beam was elaborated, and itis planned to use the BEM model as well._______________________________________A part of these investigations will be continued if the project is completed.
Two sets of beams were worked out and made:• The first set consisted of the beams with a different controlled initial
prestress
• The second set consisted of the beams with introduced initial imperfections that simulated a different degradation degree (structure integrity loss).
Basic Tests
were realized by a training system on the prestressed beams.
�� �� �� �� � 8 ; :� :=
1+�4
(+�4
)+�4
*+�4
,+�4
-+�4
.+�4
/+�4
0+�4
1++�4
����� �� 3�������
:������%���:������
Artificially introduced disintegrity of beam structures - simulation of beam crack in middle part of beam (¼ , ½ , ¾ of full integrity loss )
Tendons placed symmetrically (even stress distribution in the beam cross-section
We can use the time integrated average R(f) frequency in order toassess the stress loss in the structures. (highest value of the correlation coefficient).
In order to detect the integrity loss of structures the following three parameters are suitable:
• Amplitude normalized total R(f) frequency deviation• Normalized R(f) frequency deviation • Frequency deviation rate.
The determination of the representative symptoms and their sensitivity require an individual approach for each test type of the structure.
The symptoms limit values of the representative symptoms on the basis ofexperimental data should be assessed.
�:&�@ � ������ ��
belka A0b nap. 00kN (w ym. pkt 3 ; odp.pkt. 3)
0
0,5
1
1,5
2
2,5
3
3,5
0 1000 2000 3000 4000
cz�stotliwo�� [Hz]
a R
MS
[m/s
2 ]
mz
cz kz
Fz(t)=F0 �(t)
����
&���=���=9���=
�
δ=ω++ 0202 ���
�������� ���* ������������ ���
220
1
2
1 ξ−
π=ξ−
ω=ω �� 3
"��)���������������������� ���
!)������ ����������� �� �+��
F
(+)G���HI����
���������
,
�1�(
�J ���
� �����
3�� �K�
���� �����
11(+
1*++
������
1++
1*+
2����� ����������������L
2 �������������� ��
2����� ������J�
*�����- �.�/ #0 ���/� %��-!1�
����� ���� � ������ �����
��� ��������� �+2
Zale�no�� przepływu energii od stanu obci��enia i stanu technicznego - na
podstawie maksymalnej mody drga� gi�tnych - belka A4d, wymuszenie p. 4, pomiar drga� - czujnik p. 1