1 SUPPLEMENTARY DATA Structural dynamics of possible late-stage intermediates in folding of quadruplex DNA studied by molecular simulations. Petr Stadlbauer 1 , Miroslav Krepl 1 , Thomas E. Cheatham III 2 , Jaroslav Koča 3 and Jiří Šponer 1,3 1 Institute of Biophysics, Academy of Sciences of the Czech Republic, Královopolská 135, 612 65 Brno, Czech Republic. 2 Department of Medicinal Chemistry, College of Pharmacy, University of Utah, Salt Lake City, UT 84124, USA 3 CEITEC – Central European Institute of Technology, Campus Bohunice, Kamenice 5, 625 00 Brno, Czech Republic SUPPLEMENTARY RESULTS Parallel-stranded tetrameric quadruplex with all-syn tetrad. The d(G 4 ) 4 3TVB quadruplex has the first tetrad in syn arrangement, which causes different unfolding mechanism in the no-salt simulation compared to the all-anti tetrameric parallel quadruplexes 352D and 1J8G. The unfolding in no-salt simulation began with disruption of the all-syn tetrad, which then formed all-syn triad while the remaining guanosine stacked above the triad. The syn guanosines blocked slippage of complete strands. Still, internal slippage by one step between two strands within the anti part was observed as the second step (11.1 ns, for more details see Figures S18 – S20). Note that this strand slippage involving incomplete strands was associated with additional perturbation of the structure. The anti guanosine part then underwent motion leading to ‘pseudocross-like’ structure (14.0 ns) (similar to the one seen in the main text Figure 3a). The syn triad was finally broken which resulted into a structure opened at the top (28.0 ns). Reformation attempt was observed (31.9 ns), but this did not lead to successful restoration of the quadruplex. Finally, the structure remained locked close to the conformation seen at 47.5 ns which is already substantially perturbed (Figures S18, S20) till the end of the no-salt simulation (100 ns). The lesson from the simulation is that the three consecutive all-anti tetrads would like to make strand slippage, which, however, is opposed by the all- syn tetrad (or triad in the later stage of the simulation). Four-tetrad dimeric antiparallel quadruplex with diagonal loops. The [d(G 4 T 4 G 4 )] 2 1JPQ quadruplex was quite stable even after 1.5 μs room-temperature no-salt simulation. The molecule, however, locally slowly deteriorated through numerous small perturbation steps that were usually reversed several times before becoming permanent. Typical perturbation step involves unwinding (unbinding) of one strand from the 3'-end (to lesser degree the unwinding occurs also at the 5'-end). During this unwinding, the individual guanines are loosing interaction with one adjacent strand while mostly maintaining pairing with the other adjacent strand (main text Figure 8). The process can also be likened to widening of one of the grooves. This leads to large fluctuations of the three guanines remaining in the incomplete tetrads. After short period of fluctuations, the unwound strand reintegrates back into the structure but often with different backbone configuration and with different position of the individual bases, i.e., the guanine base can be integrated into the loop region, into nonnative base triad or can form nonnative interaction within its former tetrad. The thymidine loops gradually lose their native structure. These unbinding-binding steps are repeated many times in the simulation, on times scales from few ns to tens of ns. After 400 ns, there was a tendency to form quite stable base triads in place of the former tetrads. This was accomplished by movement of at least one guanine away from the original tetrad and slight rearrangement of the remaining bases. In both outer tetrads, one guanine moved into the loop region. In one inner tetrad, guanine was bulged away from the structure. The other inner tetrad remained largely intact for the entire simulation. Guanines that moved into the loop region created additional base triads with thymines. All of the base triads contained at least one base in syn-conformation (main text Figure 9). Besides occasional and reversible unwinding of one strand (see above), the structure remained stable in this configuration for the rest of the simulation. It was difficult to select proper starting coordinates for refolding standard simulations. First, we used the final structure of the no-salt simulation (Figure 9). However, it remained virtually unchanged during 1 μs of standard simulation, representing stable misfolded structure. Therefore, we decided to use only slightly perturbed structure (from 30 ns) as starting coordinates for refolding simulation. In this structure, one strand was unwound (by its 3‘-end) from the structure, with two tetrads disrupted. We
Transcript
1
SUPPLEMENTARY DATA
Structural dynamics of possible late-stage intermediates in folding of quadruplex DNA studied by molecular simulations.
Petr Stadlbauer1, Miroslav Krepl
1, Thomas E. Cheatham III
2, Jaroslav Koča
3 and Jiří Šponer
1,3
1Institute of Biophysics, Academy of Sciences of the Czech Republic, Královopolská 135, 612 65 Brno,
Czech Republic. 2Department of Medicinal Chemistry, College of Pharmacy, University of Utah, Salt Lake City, UT
84124, USA 3CEITEC – Central European Institute of Technology, Campus Bohunice, Kamenice 5, 625 00 Brno,
Czech Republic
SUPPLEMENTARY RESULTS
Parallel-stranded tetrameric quadruplex with all-syn tetrad.
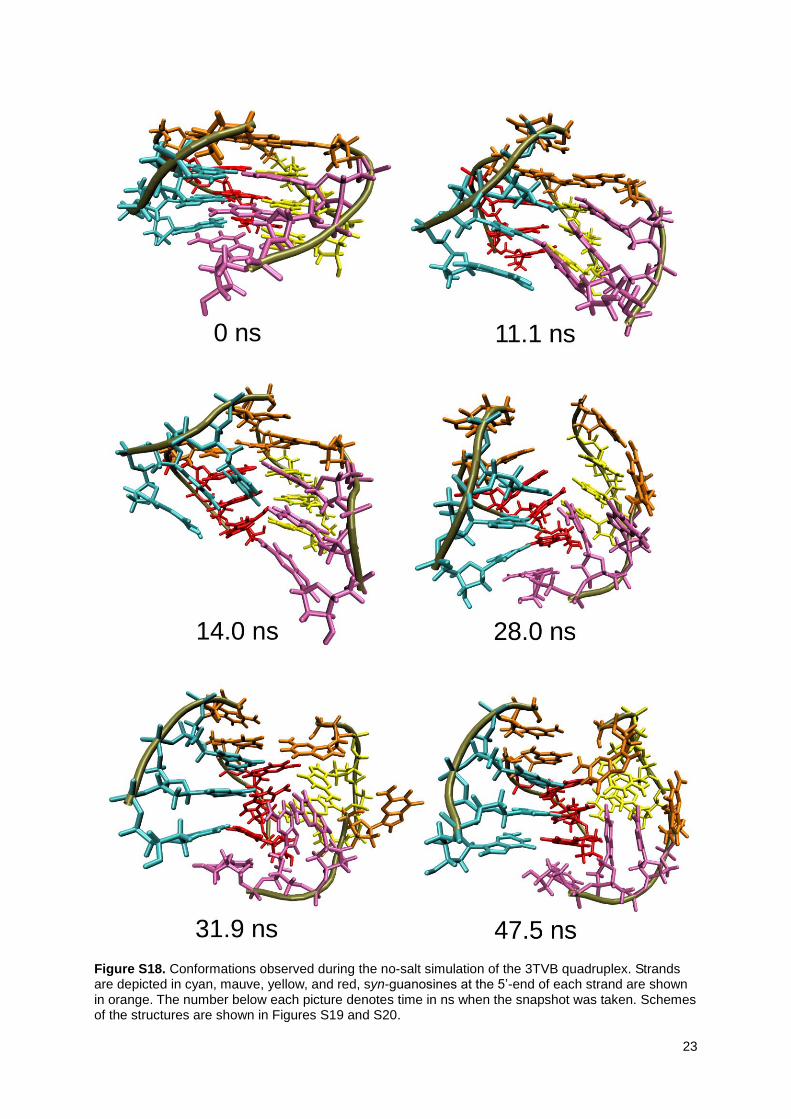
The d(G4)4 3TVB quadruplex has the first tetrad in syn arrangement, which causes different unfolding mechanism in the no-salt simulation compared to the all-anti tetrameric parallel quadruplexes 352D and 1J8G. The unfolding in no-salt simulation began with disruption of the all-syn tetrad, which then formed all-syn triad while the remaining guanosine stacked above the triad. The syn guanosines blocked slippage of complete strands. Still, internal slippage by one step between two strands within the anti part was observed as the second step (11.1 ns, for more details see Figures S18 – S20). Note that this strand slippage involving incomplete strands was associated with additional perturbation of the structure. The anti guanosine part then underwent motion leading to ‘pseudocross-like’ structure (14.0 ns) (similar to the one seen in the main text Figure 3a). The syn triad was finally broken which resulted into a structure opened at the top (28.0 ns). Reformation attempt was observed (31.9 ns), but this did not lead to successful restoration of the quadruplex. Finally, the structure remained locked close to the conformation seen at 47.5 ns which is already substantially perturbed (Figures S18, S20) till the end of the no-salt simulation (100 ns). The lesson from the simulation is that the three consecutive all-anti tetrads would like to make strand slippage, which, however, is opposed by the all-syn tetrad (or triad in the later stage of the simulation).
Four-tetrad dimeric antiparallel quadruplex with diagonal loops.
The [d(G4T4G4)]2 1JPQ quadruplex was quite stable even after 1.5 μs room-temperature no-salt simulation. The molecule, however, locally slowly deteriorated through numerous small perturbation steps that were usually reversed several times before becoming permanent. Typical perturbation step involves unwinding (unbinding) of one strand from the 3'-end (to lesser degree the unwinding occurs also at the 5'-end). During this unwinding, the individual guanines are loosing interaction with one adjacent strand while mostly maintaining pairing with the other adjacent strand (main text Figure 8). The process can also be likened to widening of one of the grooves. This leads to large fluctuations of the three guanines remaining in the incomplete tetrads. After short period of fluctuations, the unwound strand reintegrates back into the structure but often with different backbone configuration and with different position of the individual bases, i.e., the guanine base can be integrated into the loop region, into nonnative base triad or can form nonnative interaction within its former tetrad. The thymidine loops gradually lose their native structure. These unbinding-binding steps are repeated many times in the simulation, on times scales from few ns to tens of ns. After 400 ns, there was a tendency to form quite stable base triads in place of the former tetrads. This was accomplished by movement of at least one guanine away from the original tetrad and slight rearrangement of the remaining bases. In both outer tetrads, one guanine moved into the loop region. In one inner tetrad, guanine was bulged away from the structure. The other inner tetrad remained largely intact for the entire simulation. Guanines that moved into the loop region created additional base triads with thymines. All of the base triads contained at least one base in syn-conformation (main text Figure 9). Besides occasional and reversible unwinding of one strand (see above), the structure remained stable in this configuration for the rest of the simulation. It was difficult to select proper starting coordinates for refolding standard simulations. First, we used the final structure of the no-salt simulation (Figure 9). However, it remained virtually unchanged during 1 μs of standard simulation, representing stable misfolded structure. Therefore, we decided to use only slightly perturbed structure (from 30 ns) as starting coordinates for refolding simulation. In this structure, one strand was unwound (by its 3‘-end) from the structure, with two tetrads disrupted. We
2
placed one Na+ ion between the remaining two tetrads and Na
+ and Cl
- ions were distributed around
the molecule. The strand folded back immediately after the start of the simulation, albeit initially with increased fluctuations of the restored tetrads. The structure was fully stabilized after 22 ns when one additional Na
+ ion from the bulk spontaneously entered the channel. It was first captured into the
thymidine loop region and after period of fluctuations shuffled into the channel (Figure S22). During this transition, the 3‘-end guanine was still slightly perturbed and the tetrad completely reformed immediately after the ion entry into the G-stem (Figure S22).
In summary, the 1JPQ structure remains locked around the starting structures during even 1.5 µs no-salt simulation, which is a dramatically different behavior compared to the 2GKU no-salt simulation. It likely reflects presence of four tetrads in this system further supported by two diagonal loops. These structural features extend the time scale for structural perturbations beyond the capability of our computer facilities. In contrast to the 2GKU structure, two diagonal loops present in the [d(G4T4G4)]2 quadruplex prevent the stem from opening, so no splitting of the stem into duplexes takes place. This indicates that loop topology may have profound effect on the unfolding/folding processes at the atomistic level. The structure slowly locally deteriorates and in the later stages of the no-salt simulation it remains already essentially frozen. An attempt to start re-folding from locally misfolded structure turned out to be hopeless, demonstrating that the molecule can adopt highly stable locally misfolded arrangements.
Simulations of slipped 2GKU quadruplexes illustrate the potential for misfolding.
As explained in the method section, we built up eight misfolded 2-tetrad structures based on 2GKU quadruplex with single strand slippage and adequate adjustment of the χ torsion in the slipped strand (Figure S1). We simulated these structures in standard 100 ns simulations.
The following text describes the eight NaCl simulations. The eight KCl simulations (not shown) revealed qualitatively similar behavior as the NaCl simulations, i.e., some minor local changes but no restructuring.
The quadruplex core consisting of two tetrads was found stable in all eight systems. Significant dynamics of loops was observed in the first nanoseconds of each simulation, since the loops had been significantly affected by the building procedure. Increased fluctuations of the loops remained also during the rest of the simulation, which could be a consequence of both the misfolded G-stem and improper description of loop torsions caused by the force field.
The sodium ion initially placed above the G-stem (near the green guanine in Figure S1) was quickly lost in all cases. In all four systems with the first G-strand moved upward (i.e. deoxyguanosine from the first G-strand was missing in the bottom triad) the triad remained stable and both sodium ions in the channel kept their initial positions during the entire simulation. The triad of the systems with the last G-strand moved upward remained stable in two simulations and broke down at ~20 ns in the other two. In these cases the deoxyguanosine of the third G-strand (see Figure S1) moved away and the WC/H GG base pair between the first and second strand remained. Two different scenarios were observed then. First, both channel cations moved upward by one floor and the GG base pair was disrupted. Note that the ion that moved from in-between the tetrads above the terminal tetrad resided there till the end of the simulation unlike the ions that were placed there initially. In the second simulation, the channel cations kept their initial positions and the 3'-terminal deoxyadenosine residue formed a triad with the GG base pair with its N7 oriented toward the channel (Figure S23). Various behaviours of deoxyguanosines placed above the upper tetrad (G3 or G21, green in Figure S1) were observed, as expected from their different initial positions. The changes included specific and non-specific interactions with loop residues, stacking and turning the edge of the base toward solvents. When starting from syn configuration, the base remained in syn region in one case, when interaction with loop backbone was formed. In two cases, it turned anti and favorable interactions were formed. In the remaining simulation the syn base bulged out into bulk solvent after 40 ns and then fluctuated between syn and anti with a period of several ns. The χ torsion remained anti in all simulations where it was anti at the start. In summary, although we have seen some dynamics in our slipped systems, the sixteen independent 100 ns simulations show no sign of dynamics that would indicate capability of the molecule to move towards the properly folded quadruplex on any affordable simulation time scale. In others words, all simulations show stable misfolded 2-tetrad structures with altered syn/anti pattern either in the first or in the last strand. These simulations together with the 1JPQ simulations presented above underline the challenges in simulation treatment of G-DNA folding, showing that its complete capture by contemporary simulations is unrealistic and warning about over-interpretation of short simulations, as noted in the Introduction.
In order to fold properly, these misfolded molecules would likely first substantially unfold, then
3
re-adjust the syn/anti pattern, and then fold. This appears entirely outside capability of contemporary simulation timescales. SUPPLEMENTARY TABLES
Table S1. List of simulations of parallel-stranded quadruplexes. No-salt simulations aimed to destabilize the system while standard simulations tried to fold it back.
Initial structurea
ionic conditionb
force field trajectory length
Parallel quadruplex 1KF1
A 0c parmbsc0 100 ns
B (B2 branch) NaCl parmbsc0 100 ns
B (B3 branch) NaCl parmbsc0 100 ns
C (C4 branch) NaCl parmbsc0 100 ns
C (C6 branch) NaCl parmbsc0 100 ns
C5 (C7 branch) NaCl parmbsc0 2500 ns
D (D5 branch) NaCl parmbsc0 100 ns
D3 (D6 branch) NaCl parmbsc0 100 ns
E NaCl parmbsc0 20 ns
F NaCl parmbsc0 100 ns
G NaCl parmbsc0 1000 ns
Parallel quadruplex 352D
With thymidines 0c parmbsc0 50 ns
With thymidines – refolding NaCl parmbsc0 3000 ns
Without thymidinesd
0c parmbsc0 20 ns
Without thymidines – refolding Na+ net-neutral parmbsc0 400 ns
Parallel quadruplex 1J8G
With uridines 0c parmbsc0χol3 190 ns
With uridines – refolding NaCl parmbsc0χol3 500 ns
Parallel quadruplex 3TVB
G-stem without daunomycin 0c parmbsc0 100 ns
a see the main text Figure 2.
b '0' means no-salt simulation; NaCl means standard excess-salt simulation with concentration of Na
+ ~ 0.3 M and Cl
- ~ 0.15 M.
c Additional simulations in both excess-salt NaCl and KCl with the same force field and length as no-salt have been performed.
d Additional 520 ns simulation of the stem has been performed in presence of ions but without any ion initially in the channel. It
took the structure ~400 ns to capture the first ion from the bulk. It justifies our approach to attempt initial placing of the ions into the stem based on ESP calculations.
4
Table S2. List of simulations of hybrid and antiparallel quadruplexes.
Simulated initial structurea
ionic conditionb
force field trajectory length
Hybrid quadruplex 2GKU
P 0c parmbsc0 300 ns
2 × Q NaCld parmbsc0 20 ns each
R NaCld parmbsc0 40 ns
S NaCld parmbsc0 40 ns
T NaCld parmbsc0 40 ns
2 × U NaCld parmbsc0 100 ns each
2 × V NaCld parmbsc0 40 ns each
2 × W NaCld parmbsc0 100 ns each
2 × X NaCld parmbsc0 100 ns each
Y NaCld parmbsc0 100 ns
Z NaCld parmbsc0 500 ns
8 × slipped quadruplexes NaCld parmbsc0 100 ns each
Antiparallel quadruplex 1JPQ
With loops 0e parmbsc0 1500 ns
With loops – refolding NaCl parmbsc0 40 ns
Without loops 0c parmbsc0 20 ns
7 × Without loops – refolding NaCl parmbsc0 560 ns in total
a see the main text Figure 7. We have done additional ~3 μs of unsuccessful no-salt simulations of the hybrid and antiparallel
structures at 300 K not included in the Table, because no perturbation of the structures was achieved. b '0' means no-salt simulation; NaCl means standard excess-salt simulation with concentration of Na
+ ~ 0.3 M and Cl
- ~ 0.15 M.
c Simulated at 350 K. Additional simulations in both excess-salt NaCl and KCl with the same force field and length as the no-salt
simulation have been done. d We have also performed one simulation of each corresponding starting structure in conditions of excess-salt KCl with the same
force field and length as in the excess-salt NaCl simulations. e Simulated at 350 K. Additional simulations in both excess-salt NaCl and KCl with the same force field as no-salt and length of
500 ns have been done.
5
Table S3. List of simulations of single stranded helices.
b The starting structure was taken from the simulation of all-anti ss-helix after 80 ns when appropriate guanosines were manually
turned to syn according to the 2GKU syn/anti pattern. c Appropriate guanosines in the ss-helix were turned syn according to the 2GKU pattern.
d Appropriate guanosines in the ss-helix were turned syn according to the 15-TBA pattern.
6
Table S4. Time in the no-salt and excess-salt simulations of the quadruplex 1KF1 when each conformation was observed (see also the main text Figure 2). Please consider the times as approximate since the structures fluctuated and often there were no sharp borders between the conformations. The first line shows the no-salt simulation while the columns represent the excess-salt simulations. As the simulations capture conformational changes and not equilibrium, the simulation times cannot be used to assess any thermodynamics properties.
A 0 – 4.7
B 5.5 – 9.2
C 11.6 – 12.3
D 12.5 – 14.0
E 14.1 – 15.4
F 16.9 – 17.5
G 20.2 – 34.0
B1 2.4 – 2.5
C1 5.2 – 5.6
D1 0.8 – 1.4
F1 0.1 – 0.8
G1 0.4 – 0.6
B2 9.0 – 10.3
C2 5.9 – 8.2
D2 1.5 – 2.0
F2 1.7 – 2.0
G2 1.7 – 2.0
B3 6.0 - 100
C3 8.5 – 12.8
D3 3.6 – 8.8
F3 2.6 – 3.0
G3 5.4 – 135
C4 13.1 – 19.0
D4 9.1 – 10.8
F4 12.4 – 100
C5 1.5 – 78.4
D5 16.6 – 100
C6 79.6 – 100
D6 0 – 100
C7 30 - 2500
Table S5. Time in the no-salt simulation of the quadruplex 2GKU when each conformation was observed (see also the main text Figure 7). Please consider the times as approximate since the structures fluctuated and there were no sharp borders between the conformations. As the simulations capture conformational changes and not equilibrium, the simulation times cannot be used to assess any thermodynamics properties.
P 0 – 25.3
Q 33.0 – 33.2
R 33.4 – 33.7
S 33.8 – 34.7
T 34.8 – 35.5
U 35.6 – 36.9
V 37.2 – 38.7
W 39.2 – 39.7
X 41.7 – 46.5
Y 211 - 232
Z 236 - 243
ZZ 244 - 300
7
SUPPLEMENTARY FIGURES
Figure S1. Model structures build up using the human telomere quadruplex NMR 2GKU d[T2(G3T2A)3G3A] structure by slipping either a) the first or b) the last G-strand. c) Two distinct positions of G3 with respect to loop residue A20 in the structure labeled a (top view). d) Two distinct positions of G21 with respect to loop residue T1 in the structure labeled b (top view). The structural schemes (a) and (b) are visualized as follows: (deoxy)guanosine residues are depicted by rectangles. Yellow and orange mean anti and syn conformation, respectively; dark coloured residues are in the back. Red lines represent G-DNA WC/H hydrogen bonding. Black arrows show sugar-phosphate backbone in 5'→3' direction. Loops are depicted by thin black curves while flanking residues are not shown. In Figures c) and d), blue boxes represent loop residues, deoxyguanosine residues are depicted by all other rectangles. Yellow means anti conformation, orange means syn conformation, green represents guanosine occurring above the first tetrad due to the strand slippage (both syn or anti orientations were tested).
8
Figure S2. All atom mass-weighted RMSD plot of the 1KF1 quadruplex (with respect to the starting structure, equilibration part is not shown) simulated under different conditions; all residues (top) and stem residues only (bottom). The no-salt simulation leads to major structural changes. In the excess-salt simulations, there is some minor dynamics in the loops while the stem remains very stiff. In general, in Figures S2 – S6, comparison of top and bottom plots allows to differentiate fluctuations in loops and flanking base regions (which are not relevant for our study) from G-stem dynamics. Note that in all excess-salt simulations, the stems are entirely stable, thus, the no-salt simulations represent the only option to initiate early stages of unfolding.
9
Figure S3. All atom mass-weighted RMSD plot of the 352D quadruplex simulated under different conditions; all residues (top) and stem residues only (bottom). Note that greater RMSD in the all-nucleotides plot (top) for excess-salt simulation is caused by fluctuation of terminal thymidine residues. The stem is entirely stable.
10
Figure S4. All atom mass-weighted RMSD plot of the 3TVB quadruplex simulated under different conditions. Since there are no flanking or loop residues, only one plot is shown.
11
Figure S5. All atom mass-weighted RMSD plot of the 2GKU quadruplex simulated under different conditions; all residues (top) and stem residues only (bottom). These simulations were carried out at 350 K to speed up unfolding. Note that increased RMSD at the beginning of the no-salt simulation is due to the fact that the initial structure was taken from the end of the preceding 200 ns simulation held at 300 K.
12
Figure S6. All atom mass-weighted RMSD plot of the 1JPQ quadruplex simulated under different conditions; all residues (top) and stem residues only (bottom). These simulations were carried out at 350 K to speed up unfolding. Note that greater RMSD in the all-nucleotides plot in excess-salt simulations (top) is caused by movement of thymidines in the loops.
13
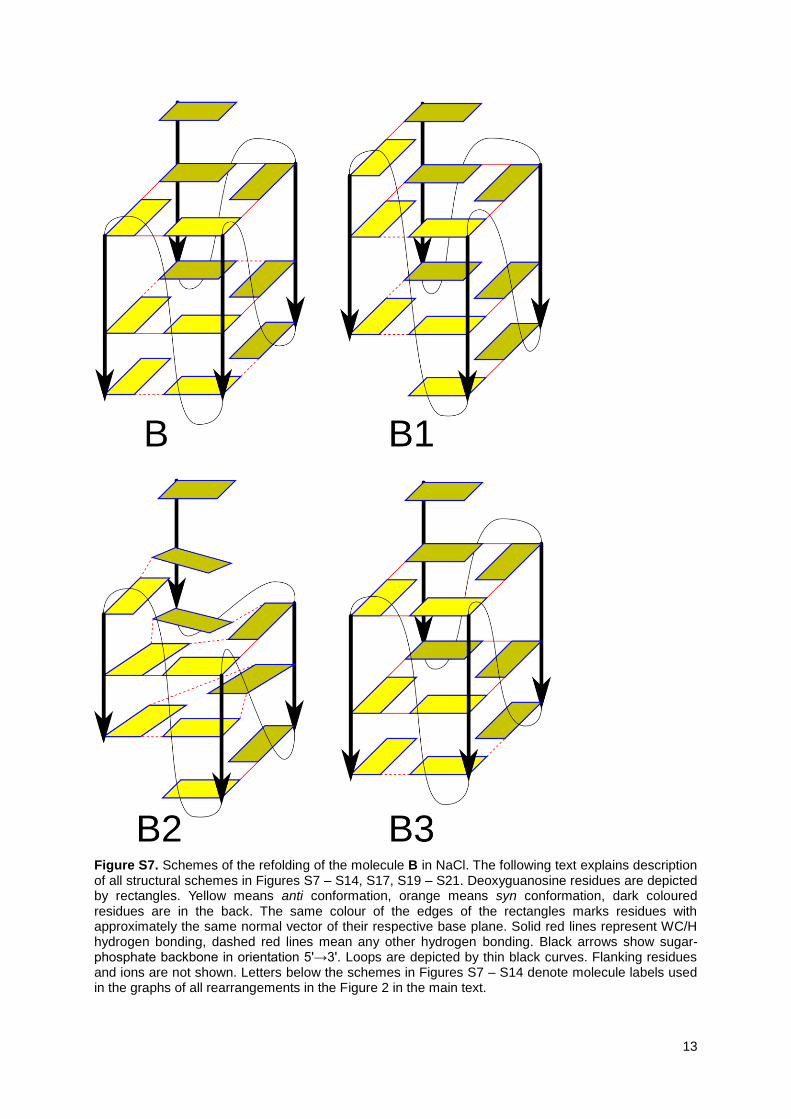
Figure S7. Schemes of the refolding of the molecule B in NaCl. The following text explains description of all structural schemes in Figures S7 – S14, S17, S19 – S21. Deoxyguanosine residues are depicted by rectangles. Yellow means anti conformation, orange means syn conformation, dark coloured residues are in the back. The same colour of the edges of the rectangles marks residues with approximately the same normal vector of their respective base plane. Solid red lines represent WC/H hydrogen bonding, dashed red lines mean any other hydrogen bonding. Black arrows show sugar-phosphate backbone in orientation 5'→3'. Loops are depicted by thin black curves. Flanking residues and ions are not shown. Letters below the schemes in Figures S7 – S14 denote molecule labels used in the graphs of all rearrangements in the Figure 2 in the main text.
14
Figure S8. Scheme of the successful pathway of refolding of the molecule C in NaCl. The orange nucleotide in structure C6 is syn, which causes a local misfolding. See the legend of Figure S7 for further details.
15
Figure S9. Scheme of the unsuccessful attempt to refold the molecule C in NaCl. See the legend of Figure S7 for further details.
16
Figure S10. Scheme of the refolding of the molecule D in NaCl, part one. See the legend of Figure S7 for further details.
17
Figure S11. Scheme of the refolding of the molecule D in NaCl, part two. See the legend of Figure S7 for further details.
18
Figure S12. Scheme of the molecule E and F. See the legend of Figure S7 for further details.
19
Figure S13. Scheme of the refolding of the molecule F in NaCl. See the legend of Figure S7 for further details.
20
Figure S14. Scheme of the refolding of the molecule G in NaCl. See the legend of Figure S7 for further details.
21
Figure S15. The molecule C5 (Figure S8) captures the second sodium cation from bulk solvent, so that one cation remains inside the two-tetrad stem and one additional is placed above the upper tetrad. Then the cation placed between the tetrads moves below the lower tetrad and the upper cation moves inside the channel which is followed by slippage of the second G-strand one step downwards, reducing the strand slippage to just one slipped strand, resulting in structure C7 (Figure S8). In later stages (not shown) the originally bound ion is lost and replaced by another bulk ion. The first G-strand is coloured black, the second is red, the third is orange and the fourth is blue. Vertical arrows symbolize backbone and are in 5'-to 3'-end direction. The horizontal lines represent planes of guanine rings. Loops are not shown. Sodium cations are cyan.
Figure S16. a) Structure from 8.5 ns of the no-salt simulation of the parallel all-anti tetrameric d(TG4T)4 G-DNA stem. b) Final structure in standard simulation; three tetrads are correctly restored, however, the nucleotides at the 5‘-end continue to fluctuate. Strands initially forming the cross-form are colored red and yellow, thymidines are green, the Na
+ ions are blue and the backbone brown. The
structure remains locally misfolded on the 3 µs time scale, which underlines the time-scale challenges to simulate G-DNA folding/formation processes. Although the structure looks at first sight well poised to form the complete stem, even our very long simulation does not lead to formation of the last tetrad, contrary to our expectations.
22
Figure S17. Observed conformational changes during the no-salt simulation of the Oxytricha nova telomere structure without the loops and during the subsequent standard simulations (see the legend of Figure S7 for schemes description). The Table top left shows time when the particular conformation from the no-salt simulation was taken for standard simulation and the type of perturbation we found in the conformation according to the labeled sketches shown in the other parts of the Figure and labeled a, b and c (note that the sketches show only the first and last tetrad). Cyan background in the Table means no perturbation with respect to the crystal structure (time 0), green background means that the perturbed tetrad recovered successfully and yellow that the tetrad did not recover properly or was fully disrupted. Note that conformations taken at time 10 and 20 ns are not shown, since their tetrads including the inner ones are heavily perturbed and subsequent standard simulations were not successful to achieve refolding.
23
Figure S18. Conformations observed during the no-salt simulation of the 3TVB quadruplex. Strands are depicted in cyan, mauve, yellow, and red, syn-guanosines at the 5’-end of each strand are shown in orange. The number below each picture denotes time in ns when the snapshot was taken. Schemes of the structures are shown in Figures S19 and S20.
24
Figure S19. Scheme of the unfolding of the quadruplex 3TVB, part one. The number below each picture denotes time in ns when the snapshot was taken. See also Figure S18 and the legend of Figure S7 for further details. Note that the structure tries to perform strand slippage in its three-tetrad all-anti region, which is evidently opposed by the all-syn tetrad.
25
Figure S20. Scheme of the unfolding of the quadruplex 3TVB, part two. The number below each picture denotes time in ns when the snapshot was taken. See also Figure S18 and the legend of Figure S7 for further details.
Figure S21. Hairpin from the single-strand simulation after the manual anti syn transition (see the main text for detailed description); the residues 1-12 are shown. The two consecutive WC/H base pairs are green and blue, other guanosines are in red, thymidines and adenosine are yellow and backbone is tan. Detail is in the center, sketch of the duplex is in the right (see the legend of Figure S7 for description).
26
Figure S22. Capture of a cation in standard simulation of d(G4T4G4)2. This Figure refers to simulation of initially only slightly perturbed system which has been successfully repaired in excess-salt simulation, see the Supplementary Results text above. Structure of the thymidine loop and the first guanine tetrad before (a) and after (b) ion entry into the channel. Thymidines are in red, guanosines are in yellow, backbone is brown and Na
+ ion is blue. Interaction of guanine on the 3‘-end (front left)
with adjacent guanine is slightly perturbed during this process.
Figure S23. 3'-terminal deoxyadenosine residue (red) forming a triad with GG base pair (yellow) with its N7 oriented toward the channel in simulation of 2GKU with slipped last G-strand in one of the simulations of initially locally misfolded structures (see the text for more details). Deoxyguanosine that formed G-triad in the initial structure (orange) is turned away with no edge contacts. The tetrad next to the triad is blue, backbone is silver and sodium cation inside the channel is cyan.