This article was downloaded by: [Umeå University Library] On: 02 October 2013, At: 09:25 Publisher: Taylor & Francis Informa Ltd Registered in England and Wales Registered Number: 1072954 Registered office: Mortimer House, 37-41 Mortimer Street, London W1T 3JH, UK International Journal of Production Research Publication details, including instructions for authors and subscription information: http://www.tandfonline.com/loi/tprs20 Structural Equation Modelling of lean manufacturing practices S. Vinodh a & Dino Joy a a Department of Production Engineering, National Institute of Technology, Tamil Nadu, India Published online: 28 Jul 2011. To cite this article: S. Vinodh & Dino Joy (2012) Structural Equation Modelling of lean manufacturing practices, International Journal of Production Research, 50:6, 1598-1607, DOI: 10.1080/00207543.2011.560203 To link to this article: http://dx.doi.org/10.1080/00207543.2011.560203 PLEASE SCROLL DOWN FOR ARTICLE Taylor & Francis makes every effort to ensure the accuracy of all the information (the “Content”) contained in the publications on our platform. However, Taylor & Francis, our agents, and our licensors make no representations or warranties whatsoever as to the accuracy, completeness, or suitability for any purpose of the Content. Any opinions and views expressed in this publication are the opinions and views of the authors, and are not the views of or endorsed by Taylor & Francis. The accuracy of the Content should not be relied upon and should be independently verified with primary sources of information. Taylor and Francis shall not be liable for any losses, actions, claims, proceedings, demands, costs, expenses, damages, and other liabilities whatsoever or howsoever caused arising directly or indirectly in connection with, in relation to or arising out of the use of the Content. This article may be used for research, teaching, and private study purposes. Any substantial or systematic reproduction, redistribution, reselling, loan, sub-licensing, systematic supply, or distribution in any form to anyone is expressly forbidden. Terms & Conditions of access and use can be found at http:// www.tandfonline.com/page/terms-and-conditions
Transcript
This article was downloaded by: [Umeå University Library]On: 02 October 2013, At: 09:25Publisher: Taylor & FrancisInforma Ltd Registered in England and Wales Registered Number: 1072954 Registered office: Mortimer House,37-41 Mortimer Street, London W1T 3JH, UK
International Journal of Production ResearchPublication details, including instructions for authors and subscription information:http://www.tandfonline.com/loi/tprs20
Structural Equation Modelling of lean manufacturingpracticesS. Vinodh a & Dino Joy aa Department of Production Engineering, National Institute of Technology, Tamil Nadu, IndiaPublished online: 28 Jul 2011.
To cite this article: S. Vinodh & Dino Joy (2012) Structural Equation Modelling of lean manufacturing practices, InternationalJournal of Production Research, 50:6, 1598-1607, DOI: 10.1080/00207543.2011.560203
To link to this article: http://dx.doi.org/10.1080/00207543.2011.560203
PLEASE SCROLL DOWN FOR ARTICLE
Taylor & Francis makes every effort to ensure the accuracy of all the information (the “Content”) containedin the publications on our platform. However, Taylor & Francis, our agents, and our licensors make norepresentations or warranties whatsoever as to the accuracy, completeness, or suitability for any purpose of theContent. Any opinions and views expressed in this publication are the opinions and views of the authors, andare not the views of or endorsed by Taylor & Francis. The accuracy of the Content should not be relied upon andshould be independently verified with primary sources of information. Taylor and Francis shall not be liable forany losses, actions, claims, proceedings, demands, costs, expenses, damages, and other liabilities whatsoeveror howsoever caused arising directly or indirectly in connection with, in relation to or arising out of the use ofthe Content.
This article may be used for research, teaching, and private study purposes. Any substantial or systematicreproduction, redistribution, reselling, loan, sub-licensing, systematic supply, or distribution in anyform to anyone is expressly forbidden. Terms & Conditions of access and use can be found at http://www.tandfonline.com/page/terms-and-conditions
International Journal of Production ResearchVol. 50, No. 6, 15 March 2012, 1598–1607
Structural Equation Modelling of lean manufacturing practices
S. Vinodh* and Dino Joy
Department of Production Engineering, National Institute of Technology, Tamil Nadu, India
(Received 8 July 2010; final version received 24 January 2011)
The purpose of this research study is to analyse lean manufacturing practices in different industries and toidentify the critical factors for its success implementation. Despite the fact that lean manufacturing has beenfrequently promoted as a means of improving business competitiveness, little empirical evidence exists in theliterature validating its positive link with organisational performance. Lean manufacturing practices not onlyhelp in reducing the number of defects but also reduces the cost of production. For this purpose, empiricaldata is collected to measure the lean manufacturing practices prevailing in different industries located in TamilNadu, India. A Structural Equation Modelling (SEM) technique is used to build the measurement andstructural models. Later, statistical estimates are used to validate the model that has been built. The dataanalysis helps to determine whether to accept or reject the hypothesis that has been stated based on thestructural model. The result shows how lean manufacturing practices are correlated and help in improving theorganisational performance among the industries being surveyed.
The industrial scenario has witnessed a radical change over the past two decades with changing marketconditions, customer requirements and growing technology. In order to sustain in this competitive scenario,organisations have started the reorientation of their competencies by means of implementation of varied practices.Lean manufacturing is a system that is focused on reconfiguration of the manufacturing systems by means ofstreamlining the processes which facilitate waste reduction, minimising variations and thereby facilitating costreduction (Shah and Goldstein 2006). Several tools and techniques have been proposed in the context of leanmanufacturing. Though lean manufacturing is widely regarded as a business strategy, few researchers haveconcentrated on the validation of its positive link with business performance (Detty and Yingling 2000, Singhet al. 2006). One of the ambiguous questions is that how a manufacturer can identify tools and techniques (Lipinget al. 2009), and the relevant capabilities and abilities to become lean. There are several important issues that needto be addressed to understand how lean manufacturing and management be achieved with clarity of purpose,focus and goals. On the basis of a thorough literature review, a conceptual model of lean manufacturing ispresented which summarises the links between leanness drivers, enablers and outcomes. Structural EquationModelling (SEM) is a multivariate statistical analysis technique that is used to analyse structural relationships.SEM technique is the combination of factor analysis and multiple regression analysis, and it is used to analyse thestructural relationship between measured variables and latent constructs (Tenenhaus et al. 2005). On the basis ofthis model, research hypotheses have been formulated. Then, by means of a survey amongst the 60 Small andMedium Enterprises (SMEs) located in Tamil Nadu, India the proposed hypotheses have been tested in order toempirically validate the proposed model.
2. Literature review
The literature has been reviewed from the perspectives of lean manufacturing and Structural EquationModelling.
Lean manufacturing is based on the fundamental goals of the Toyota Production System (TPS) which is aimed at
continuously minimising waste to maximise flow. Lean manufacturing has its focus on cost reduction, waste
minimisation and better material management (Seth and Gupta 2005). According to TPS, the seven most
common wastes are overproduction, waiting, transport, inappropriate processing, unnecessary inventory, waste of
motion and defects (Hines and Rich 1997, Hines et al. 1999). There are various tools and techniques to implement
lean principles to an industry; Total Productive Maintenance (TPM), Total Quality Management (TQM), Failure
Mode and Effect Analysis (FMEA), 5S, Quality Function Deployment (QFD), Kaizen, Kanban, Value Stream
Mapping (VSM), etc (Braglia et al. 2006; Salem et al. 2006, Shah and Ward 2007). Holweg (2007) presents an
historical account of the research that led to the formulation and dissemination of one of the most influential
manufacturing paradigms of recent times. Salem et al. (2006) developed a new ‘lean assessment tool’ to quantify
the results of lean implementation. The assessment tool evaluates six lean construction elements: last planner,
increased visualisation, huddle meetings, first-run studies, 5 S’s, and fail safe for quality. Shah and Ward (2007)
mapped the operational space corresponding to conceptual space surrounding lean production. Configuration
theory provides the theoretical underpinnings and helps to explain the synergistic relationships among its
underlying components. Black (2007) discusses four design rules for implementing the TPS. Hicks (2007) deal
with the development of a conceptual framework for a set of lean principles supporting the improvement of
information management and the overall information systems infrastructure. Lander and Liker (2007) have dealt
with a case study of a low volume highly customised artistic clay-tile company. They have illustrated the process
by which the firm used TPS to learn how to understand its process, gain stability and control, empower its
workforce, and become far more profitable.Lean operations eliminate obvious wastes, reduce variability, reduce inventory and thereby reduce cost. Lean
manufacturing is based on six principles which include waste elimination, Pull Production, Zero defects,
Streamlining of processes, Quality at the source and Continuous improvement. The principles of lean
manufacturing can be practiced only through the involvement of management and manufacturing practices.
Thus the four enablers’ namely management responsibility leanness, manufacturing management leanness,
manufacturing strategy leanness, and technology and workforce leanness play a vital role in lean manufacturing
systems.
2.2 Literature review on structural equation modelling
Among the milestones in the development of statistical modelling are undoubtedly the advent of comprehensive
methodologies for SEM and multilevel (regression) modelling (e.g. Goldstein 1986). Conventional SEMs have
thus been generalised to accommodate different kinds of responses. The factors affecting world-class
manufacturing and its evaluation using SEM were investigated by Eid (2009). The need to empirically test and
refine the proposed factors and to explore relationships among the various variables is well explained in the
current article. Kadipas and Pexioto (1999) extended the study to global manufacturing practices and evaluated
the same using SEM. Thus researchers used the statistical tool of SEM for finding the relationship among
variables and for quantification. Maani et al. (1994) empirically analysed the Quality Improvement in
Manufacturing and its effects in the organisation. The study focused on direct and indirect relationships between
quality, productivity and manufacturing performance. Prajogo (2005) examined the difference between
manufacturing and service firms with respect to the implementation of Total Quality Management (TQM)
practices, and the relationship of these practices to quality performance. The researchers extended the study from
countries to a group of industries, which in turn led the SEM analysis from the macro to the micro level.
Recently, Lau et al. (2010) extended the study to supply-chain integration and product modularity, which made
SEM an effective technique in supply-chain design and product development. Huang et al. (2009) found the key
enablers in improving the business performance which includes integrated supplier management, new product
development and knowledge sharing practices which are three primary business activities utilised to enhance
manufacturers business performance. Curkovic (2003) carried out the study in a relatively new field, namely
Environmentally Responsible Manufacturing (ERM). The ERM model was developed and validated using SEM
technique.
International Journal of Production Research 1599
Dow
nloa
ded
by [
Um
eå U
nive
rsity
Lib
rary
] at
09:
25 0
2 O
ctob
er 2
013
2.3 Research gap
Though SEM technique has been used by the researchers for certain purposes, the application of SEM technique tomodel the lean manufacturing system enablers and outcomes has not been attempted which formed the researchproblem.
3. Concept of SEM
SEM is preferred by the researchers because it estimates the multiple and interrelated dependence in a singleanalysis. In SEM two types of variables are used, namely endogenous and exogenous variables. Endogenousvariables are equivalent to dependent variables and exogenous variables are equal to the independent variables.Although the literature on SEM includes a rich spectrum of works, there is no consensus on the definition of quality.The notion of quality has been defined in different ways by different authors. SEM is used to analyse therelationship between improvement programs and performance outcomes. SEM is a collection of statisticaltechniques that allow the examination of relationships among multiple predictor and response variables. Thesevariables can be observable (directly measured, also referred to as manifest variables) or unobservable (Bagozzi andYi 1988). Owing to its ability to allow the researcher to focus on the structural level, SEM is considered more flexiblethan other statistical methods. It is also possible to include variables in an SEM model to test their indirect effects.Such variables are said to be moderate or mediate the relationships among the variables of main interest inthe model.
SEM theory can be thought of as a set of relationships providing consistency and comprehensive explanations ofthe actual phenomena. SEM consists of two types of models:
(1) Measurement model: the measurement model represents the theory that specifies how measured variablescome together to represent the theory.
(2) Structural model: the structural model represents the theory that shows how constructs are related to otherconstructs.
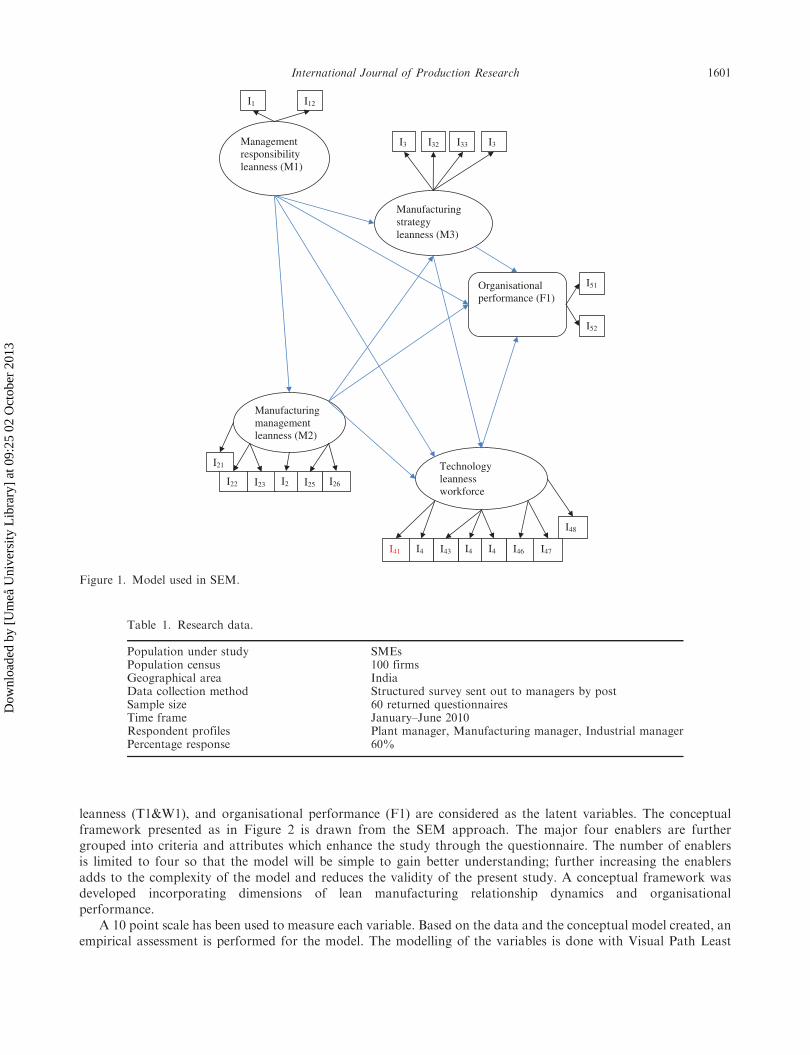
SEM is also called causal modelling because SEM tests the proposed causal relationships. The conceptual modelwhich has been considered in this paper consists of enablers, which are subdivided into criteria and attributes asshown in Figure 1. The main enablers considered in this paper are management responsibility leanness (M1),manufacturing management leanness (M2), manufacturing strategy leanness (M3), and technology and workforceleanness (T1&W1).
4. Methodology
Initially, 100 SMEs were considered. 60 organisations responded by returning the filled in questionnaire. Thisrepresents a 60% response rate. The research data details are shown in Table 1.
SEM was used to test the model with data collected using an email questionnaire. The questionnaire wasprepared based on four enablers, namely management responsibility leanness (M1), manufacturing managementleanness (M2), manufacturing strategy leanness (M3), and technology and workforce leanness (T1&W1). It isthen further classified into lean criteria and lean attributes. Thus the attributes measure the model which is beingstudied and that directly relates to the criteria and finally enablers. This two level classification of enablers intocriteria and attributes improves the reliability of the questionnaire. The excerpt of the questionnaire shown inTable 2 represents the attributes of management responsibility leanness. Effective lean manufacturing practiceshave become a potentially valuable way of securing competitive advantage and improving organisationalperformance since competition is no longer between organisations, but among lean manufacturing practicingfirms. This research conceptualises and develops five dimensions of leanness practice (management responsibilityleanness, manufacturing management leanness, manufacturing strategy leanness, and technology and workforceleanness) and tests the relationship between organisational performances. In our conceptual model, eachunobserved (latent) variable comprises a number of constructs. For example, manufacturing managementleanness consists of six constructs: smooth information flow (I21), team management for decision making (I22),interchange-ability of personnel (I23), management goal (I25), management involvement and transparency ininformation sharing (I26). For the purpose of the current study, management responsibility leanness (M1),manufacturing management leanness (M2), manufacturing strategy leanness (M3), technology and workforce
1600 S. Vinodh and D. Joy
Dow
nloa
ded
by [
Um
eå U
nive
rsity
Lib
rary
] at
09:
25 0
2 O
ctob
er 2
013
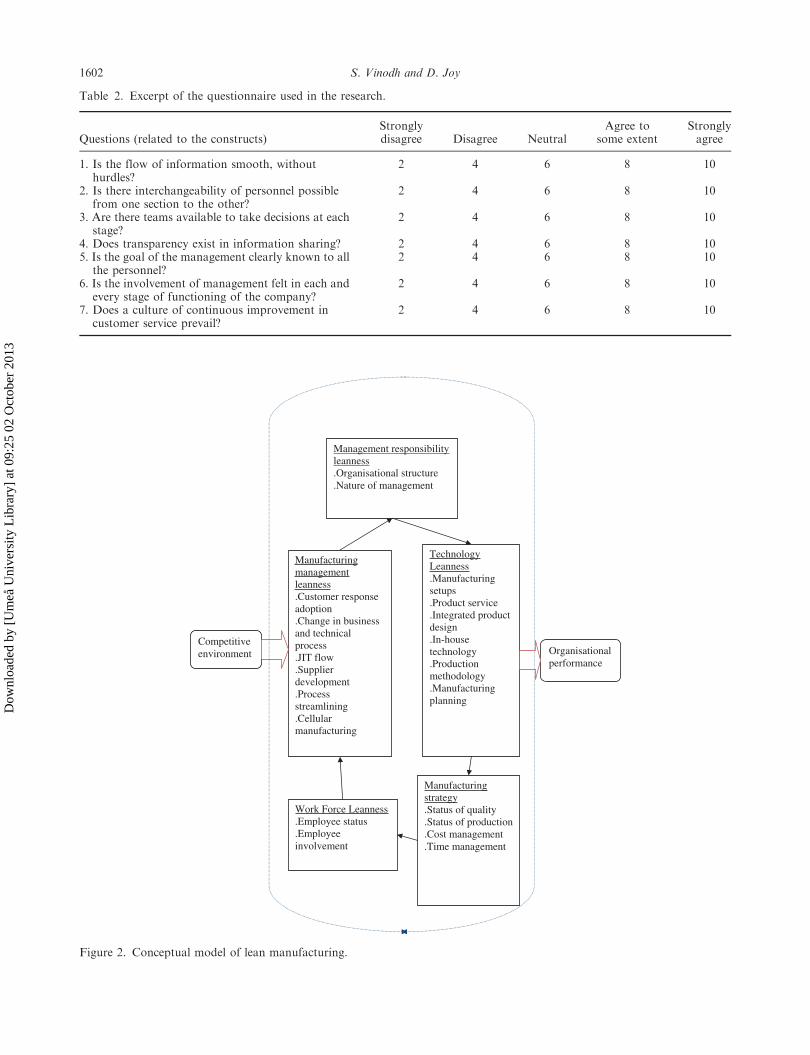
leanness (T1&W1), and organisational performance (F1) are considered as the latent variables. The conceptualframework presented as in Figure 2 is drawn from the SEM approach. The major four enablers are furthergrouped into criteria and attributes which enhance the study through the questionnaire. The number of enablersis limited to four so that the model will be simple to gain better understanding; further increasing the enablersadds to the complexity of the model and reduces the validity of the present study. A conceptual framework wasdeveloped incorporating dimensions of lean manufacturing relationship dynamics and organisationalperformance.
A 10 point scale has been used to measure each variable. Based on the data and the conceptual model created, anempirical assessment is performed for the model. The modelling of the variables is done with Visual Path Least
Management responsibilityleanness (M1)
I12
Manufacturingstrategyleanness (M3)
I1
I3 I32 I33 I3
Organisationalperformance (F1)
I51
I52
Manufacturingmanagement leanness (M2)
I21
I22 I23 I26I25I2
Technologyleannessworkforce
I41
I48
I47I46I4I4I43I4
Figure 1. Model used in SEM.
Table 1. Research data.
Population under study SMEsPopulation census 100 firmsGeographical area IndiaData collection method Structured survey sent out to managers by postSample size 60 returned questionnairesTime frame January–June 2010Respondent profiles Plant manager, Manufacturing manager, Industrial managerPercentage response 60%
International Journal of Production Research 1601
Dow
nloa
ded
by [
Um
eå U
nive
rsity
Lib
rary
] at
09:
25 0
2 O
ctob
er 2
013
Management responsibility leanness.Organisational structure .Nature of management
Manufacturingmanagement leanness.Customer response adoption.Change in business and technical process.JIT flow .Supplierdevelopment .Processstreamlining .Cellular manufacturing
TechnologyLeanness.Manufacturingsetups.Product service .Integrated product design.In-housetechnology.Productionmethodology .Manufacturingplanning
Work Force Leanness.Employee status .Employee involvement
Manufacturingstrategy.Status of quality .Status of production .Cost management .Time management
Competitive environment Organisational
performance
Figure 2. Conceptual model of lean manufacturing.
Table 2. Excerpt of the questionnaire used in the research.
Questions (related to the constructs)Stronglydisagree Disagree Neutral
Agree tosome extent
Stronglyagree
1. Is the flow of information smooth, withouthurdles?
2 4 6 8 10
2. Is there interchangeability of personnel possiblefrom one section to the other?
2 4 6 8 10
3. Are there teams available to take decisions at eachstage?
2 4 6 8 10
4. Does transparency exist in information sharing? 2 4 6 8 105. Is the goal of the management clearly known to all
the personnel?2 4 6 8 10
6. Is the involvement of management felt in each andevery stage of functioning of the company?
2 4 6 8 10
7. Does a culture of continuous improvement incustomer service prevail?
2 4 6 8 10
1602 S. Vinodh and D. Joy
Dow
nloa
ded
by [
Um
eå U
nive
rsity
Lib
rary
] at
09:
25 0
2 O
ctob
er 2
013
Square (PLS) software, which is exclusively used for the SEM. In this model, there are 10 hypotheses which arebeing tested for validity. The hypotheses include the following:
(H1) Management responsibility leanness and manufacturing management leanness are significantly correlated.(H2) Management responsibility leanness and manufacturing strategy leanness are significantly correlated.(H3) Management responsibility leanness, technology and workforce leanness are significantly correlated.(H4) Management responsibility leanness and organisational performance are significantly correlated.(H5) Manufacturing management leanness and manufacturing strategy leanness are significantly correlated.(H6) Manufacturing management leanness, technology and workforce leanness are significantly correlated.(H7) Manufacturing management leanness and organisational performance are significantly correlated.(H8) Manufacturing strategy leanness, technology and workforce leanness are significantly correlated.(H9) Manufacturing strategy leanness and organisational performance are significantly correlated.
(H10) Technology, workforce leanness and organisational performance are significantly correlated.
The following steps are involved in building the model:
(1) Defining individual constructs: the first step in SEM is to define the constructs theoretically. Conduct a pre-test to evaluate the item.
(2) Developing the overall measurement model: in SEM, the measurement model is also known as path analysis.Path analysis is a set of relationships between exogenous and endogenous variables. This is shown by meansof an arrow. The measurement model follows the assumption of unit-dimensionality. Measurement theory isbased on the idea that latent constructs cause the measured variable and that the error term is uncorrelatedwithin measured variables. In a measurement model, an arrow is drawn from the measured variable to theconstructs.
(3) Designing the study to produce the empirical results: in this step, the researcher must specify the model. Theresearcher should design the study to minimise the likelihood of an identification problem. In SEM, ordercondition and rank condition methods are used to minimise the identification problem.
(4) Specifying the structural model: in this step, structural paths are drawn between constructs. In the structuralmodel, no arrow can enter an exogenous construct. A single-headed arrow is used to represent ahypothesised structural relationship between one construct and another. This shows the cause and effectrelationship. In SEM, each hypothesised relationship uses one degree of freedom. In SEM, the model can berecursive or no recursive.
(5) Examine the structural model validity: in the last step of SEM, a researcher examines the structural modelvalidity. In SEM, a model is considered a good fit if the value of the chi-square test is insignificant.
5. Reliability and validity tests
The reliability and validity tests are done using the bootstrap and jack-knife procedures. For this purpose, thepopular SEM software Visual PLS has been used. Significance test was conducted using re-sampling procedure.Both bootstrap and jack-knife procedures depends on the re-sampling number and model size. The bootstrapprocedure involves the selection of random samples with replacement from a data set and analysing each sample inthe same way. Sampling with replacement means that every sample is returned to the data set after sampling. So aparticular data point from the original data set could appear multiple times in a given bootstrap sample. Thenumber of elements in each sample equals the number of elements in the original data set. The range of sampleenables us to establish the uncertainty of the quantity which is to be estimated. Similar to the bootstrap is the jack-knife, which uses re-sampling to estimate the bias and variance of sample statistics. The jack-knife helps todetermine the mean, standard error, and t-statistic. Thus by using bootstrap and the jack-knife procedures, it can beensured that the sample represents the population. Bootstrap and jack-knife will both locate specific research resultsin the continuum between purely confirmatory and purely exploratory testing, and help to specify required thesample sizes for structural model fitting. The sample size in our study is 50 which represents the population and isquite good for validating the model. Thus the model is confirmed using both bootstrap and jack-knife procedures.
The responses given in the returned filled in questionnaire were converted into data, which were usedsubsequently for conducting the reliability and validity tests. During the reliability tests, the reliability of theconstructs given in the questionnaire was tested using Visual PLS software. Reliability of the constructs refers to theaccuracy with which the constructs repeatedly measure the same phenomenon within permissible variation.
International Journal of Production Research 1603
Dow
nloa
ded
by [
Um
eå U
nive
rsity
Lib
rary
] at
09:
25 0
2 O
ctob
er 2
013
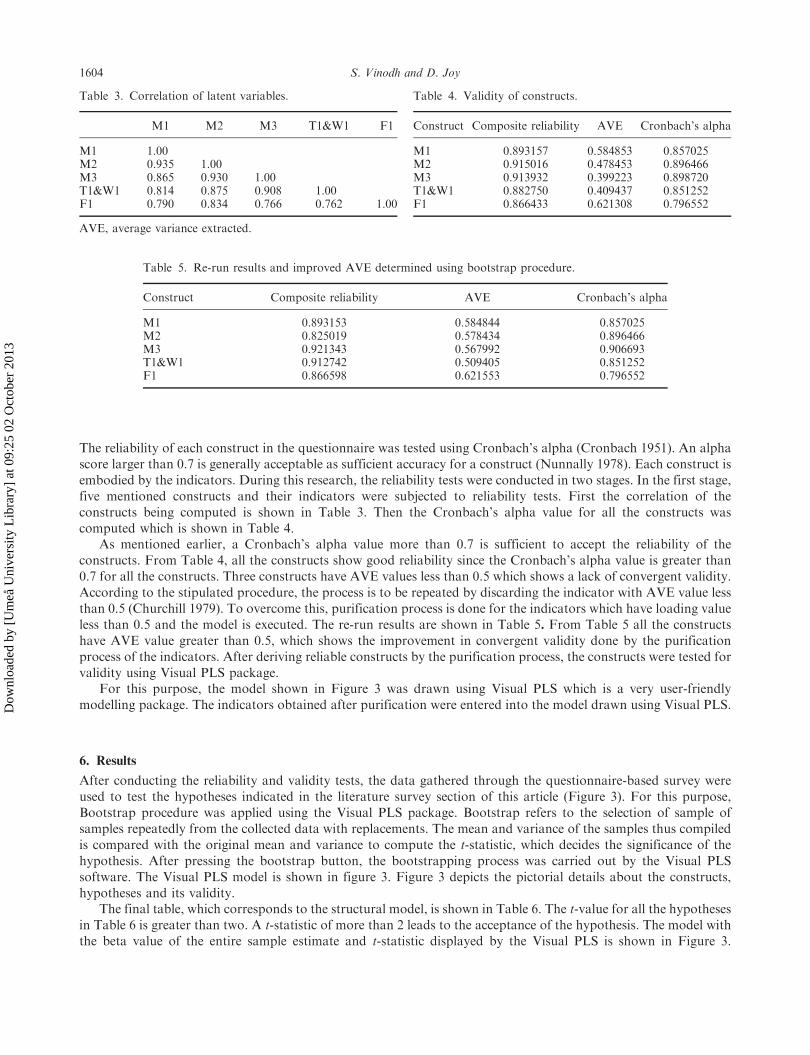
The reliability of each construct in the questionnaire was tested using Cronbach’s alpha (Cronbach 1951). An alphascore larger than 0.7 is generally acceptable as sufficient accuracy for a construct (Nunnally 1978). Each construct isembodied by the indicators. During this research, the reliability tests were conducted in two stages. In the first stage,five mentioned constructs and their indicators were subjected to reliability tests. First the correlation of theconstructs being computed is shown in Table 3. Then the Cronbach’s alpha value for all the constructs wascomputed which is shown in Table 4.
As mentioned earlier, a Cronbach’s alpha value more than 0.7 is sufficient to accept the reliability of theconstructs. From Table 4, all the constructs show good reliability since the Cronbach’s alpha value is greater than0.7 for all the constructs. Three constructs have AVE values less than 0.5 which shows a lack of convergent validity.According to the stipulated procedure, the process is to be repeated by discarding the indicator with AVE value lessthan 0.5 (Churchill 1979). To overcome this, purification process is done for the indicators which have loading valueless than 0.5 and the model is executed. The re-run results are shown in Table 5. From Table 5 all the constructshave AVE value greater than 0.5, which shows the improvement in convergent validity done by the purificationprocess of the indicators. After deriving reliable constructs by the purification process, the constructs were tested forvalidity using Visual PLS package.
For this purpose, the model shown in Figure 3 was drawn using Visual PLS which is a very user-friendlymodelling package. The indicators obtained after purification were entered into the model drawn using Visual PLS.
6. Results
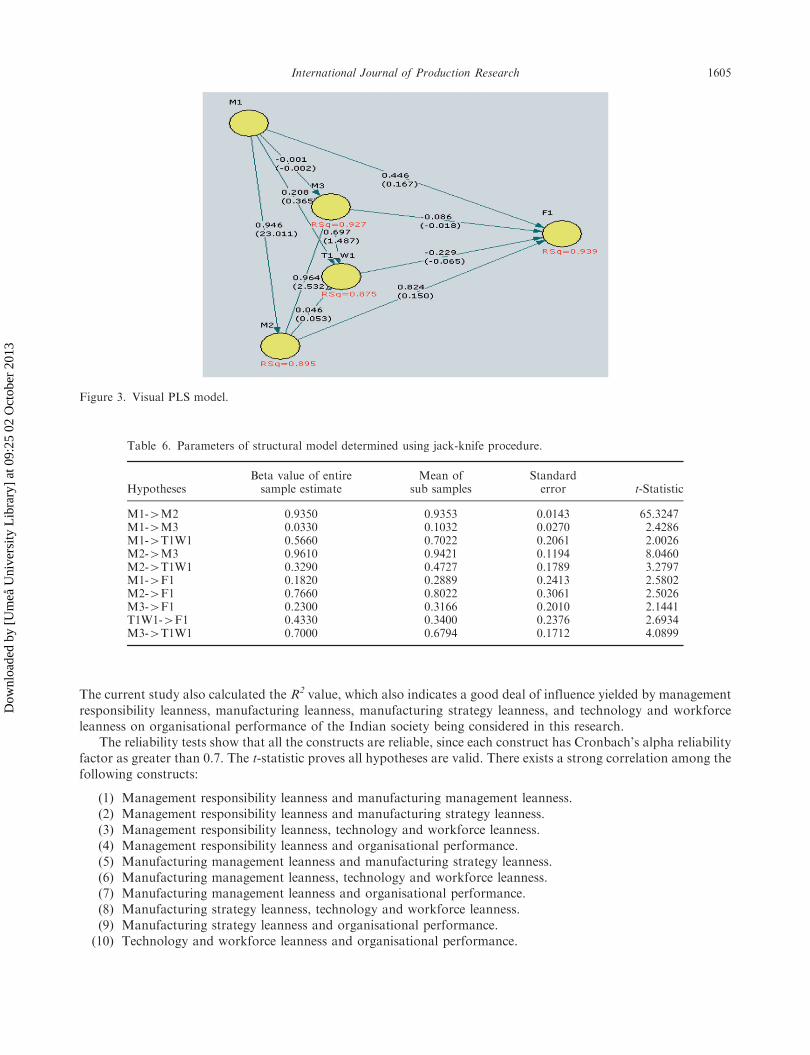
After conducting the reliability and validity tests, the data gathered through the questionnaire-based survey wereused to test the hypotheses indicated in the literature survey section of this article (Figure 3). For this purpose,Bootstrap procedure was applied using the Visual PLS package. Bootstrap refers to the selection of sample ofsamples repeatedly from the collected data with replacements. The mean and variance of the samples thus compiledis compared with the original mean and variance to compute the t-statistic, which decides the significance of thehypothesis. After pressing the bootstrap button, the bootstrapping process was carried out by the Visual PLSsoftware. The Visual PLS model is shown in figure 3. Figure 3 depicts the pictorial details about the constructs,hypotheses and its validity.
The final table, which corresponds to the structural model, is shown in Table 6. The t-value for all the hypothesesin Table 6 is greater than two. A t-statistic of more than 2 leads to the acceptance of the hypothesis. The model withthe beta value of the entire sample estimate and t-statistic displayed by the Visual PLS is shown in Figure 3.
Table 5. Re-run results and improved AVE determined using bootstrap procedure.
The current study also calculated the R2 value, which also indicates a good deal of influence yielded by managementresponsibility leanness, manufacturing leanness, manufacturing strategy leanness, and technology and workforceleanness on organisational performance of the Indian society being considered in this research.
The reliability tests show that all the constructs are reliable, since each construct has Cronbach’s alpha reliabilityfactor as greater than 0.7. The t-statistic proves all hypotheses are valid. There exists a strong correlation among thefollowing constructs:
(1) Management responsibility leanness and manufacturing management leanness.(2) Management responsibility leanness and manufacturing strategy leanness.(3) Management responsibility leanness, technology and workforce leanness.(4) Management responsibility leanness and organisational performance.(5) Manufacturing management leanness and manufacturing strategy leanness.(6) Manufacturing management leanness, technology and workforce leanness.(7) Manufacturing management leanness and organisational performance.(8) Manufacturing strategy leanness, technology and workforce leanness.(9) Manufacturing strategy leanness and organisational performance.
(10) Technology and workforce leanness and organisational performance.
Figure 3. Visual PLS model.
Table 6. Parameters of structural model determined using jack-knife procedure.
The application of lean manufacturing by firms being analysed has enabled them to increase their manufacturingstrength through the concurrent improvement among the manufacturing objectives (cost, quality, flexibility andenvironment). This leads to increased competitiveness. Lean manufacturing streamlines the processes, reducesprocess variations and wastes, and contributes to the improvement of financial performance of the firm. This studyanalyses the lean manufacturing not only from a theoretical view point, but also from empirical validation which isaimed at determining the compatibility of lean manufacturing in a real time industrial scenario. The current study isfocused on the analysis of lean manufacturing implementation among the 60 SME’s located in Tamil Nadu, India.Based on the literature review, a conceptual model has been proposed which has been tested in a small sample ofSME’s. The lean manufacturing is identified as a global manufacturing model with fully fledged integration of:
(1) Totally committed management(2) Highly trained, motivated and empowered employees working in a team.(3) Internal integration of operations with suppliers and customers.(4) Promotion of creativity and innovative culture.(5) Streamlining of processes and waste elimination.
The positive and significant influence of the environment on implementation of lean manufacturing practiceswas tested. Manufacturing management, manufacturing strategy and manufacturing responsibility leanness havebeen identified as important drivers for lean manufacturing. This study utilises a systematic approach to the analysisof lean manufacturing system, considering the leanness practices or enablers in an integrated manner. This approachis essential because most literature on lean manufacturing deals with leanness strategy or techniques in an isolatedmanner. This research study fills the literature gap by analysing not only from a theoretical viewpoint, but also froman empirical viewpoint, testing the suitability of lean manufacturing in a real time environment.
References
Bagozzi, R. and Yi, Y., 1988. On the evaluation of structural equation models. Journal of Academy and Marketing Science, 16 (1),
74–94.
Black, J.T., 2007. Design rules for implementing the Toyota Production System. International Journal of Production Research,
45 (16), 39–64.Braglia, M., Carmignani, G., and Zammori, F., 2006. A new value stream mapping approach for complex production systems.
International Journal of Production Research, 44 (2), 3929–3952.
Churchill, G.A., 1979. A paradigm for developing better measures of marketing constructs. Journal of Marketing Studies, 16 (2),
12–27.Cronbach, L.J., 1951. Coefficient alpha and internal structure of tests. Psychometrika, 16 (2), 297–334.Curkovic, S., 2003. Environmentally responsible manufacturing: the development and validation of a measurement model.
Journal of Operations Research, 146 (2), 130–155.Detty, R.B. and Yingling, J.C., 2000. Quantifying benefits of conversion to lean manufacturing with discrete event simulation: a
case study. International Journal of Production Research, 38 (2), 429–445.Eid, R., 2009. Factors affecting success of world class manufacturing implementation in less developed countries. Journal of
Manufacturing Technology and Management, 20 (2), 989–1008.
Goldstein, H., 1986. Multilevel mixed linear model analysis using iterative generalised least squares. Biometrika, 73, 43–56.Hicks, B.J., 2007. Lean information management: understanding and eliminating waste. International Journal of Information
Management, 27 (2), 233–249.
Hines, P. and Rich, N., 1997. The seven value stream mapping tools. International Journal of Operations and Production
Management, 17 (1), 46–64.Hines, P., Rich, N., and Esain, A., 1999. Value stream mapping, a distribution industry application. International Journal of
Benchmarking, 6 (1), 60–77.Holweg, M., 2007. The genealogy of lean production. Journal of Operations Management, 25 (2), 420–437.
Huang, T.-T., Stewart, R.A., and Chen, L., 2010. Identifying key enablers to improve business performance in Taiwanese
electronic manufacturing companies. International Journal of Operations & Production Management, 30 (2), 155–180.Kadipas, N. and Pexioto, M.B., 1999. Global manufacturing practices: an empirical evaluation. Industrial Manage & Data
Systems., 99 (3), 101–108.
Lander, E. and Liker, J.K., 2007. The Toyota production system and art: making highly customized and creative products the
Toyota way. International Journal of Production Research, 45 (16), 3681–3698.
1606 S. Vinodh and D. Joy
Dow
nloa
ded
by [
Um
eå U
nive
rsity
Lib
rary
] at
09:
25 0
2 O
ctob
er 2
013
Lau, K.W., Yam, C.M., and Tang, P.Y., 2010. Supply chain design and product modularity. International Journal of Operationsand Production Management, 30 (1), 20–56.
Liping, Y., et al., 2009. Research on the evaluation of academic journals based on structural equation modeling. Journal ofInformetrics, 3 (2), 304–311.
Maani, K.E., Putterill, M.S., and Sluti, D.G., 1997. Empirical analysis of quality improvement in manufacturing. InternationalJournal of Quality & Reliability Management, 11 (7), 19–37.
Nunnally, J.C., 1978. Psychometric theory. New York: McCraw-Hill.Prajogo, D.I., 2005. The comparative analysis of TQM practices and quality performance between manufacturing and service
firms. International Journal of Service Industry Management, 16 (3), 217–228.
Salem, O., et al., 2006. Lean construction: from theory to implementation. Journal of Management in Engineering, 22 (4),168–175.
Seth, D. and Gupta, V., 2005. Application of value stream mapping for lean operations and cycle time reduction: an Indian case
study. Production Planning and Control, 16 (1), 44–59.Shah, R. and Goldstein, S.M., 2006. Use of structural equation modeling in operations management research: looking back and
forward. Journal of Operations Management, 24 (2), 148–169.Shah, R. and Ward, P.T., 2007. Defining and developing measures of lean production. Journal of Operations Management, 25 (2),
785–805.Singh, R.K., et al., 2006. Lean tool selection in a die casting unit: a fuzzy-based decision support heuristic. International Journal
of Production Research, 44 (7), 1399–1429.
Tenenhaus, M., et al., 2005. PLS path modeling. Computational Statistics & Data Analysis., 16 (2), 297–334.