DEGREE PROJECT, IN , ENGINEERING MECHANICS - SOLID MECHANICS SECOND LEVEL STOCKHOLM, SWEDEN 2014 Structural integrity of dental crowns NATHALIE HAMSUND KTH ROYAL INSTITUTE OF TECHNOLOGY SCHOOL OF ENGINEERING SCIENCES
Transcript
DEGREE PROJECT, IN ,ENGINEERING MECHANICS - SOLID MECHANICSSECOND LEVEL
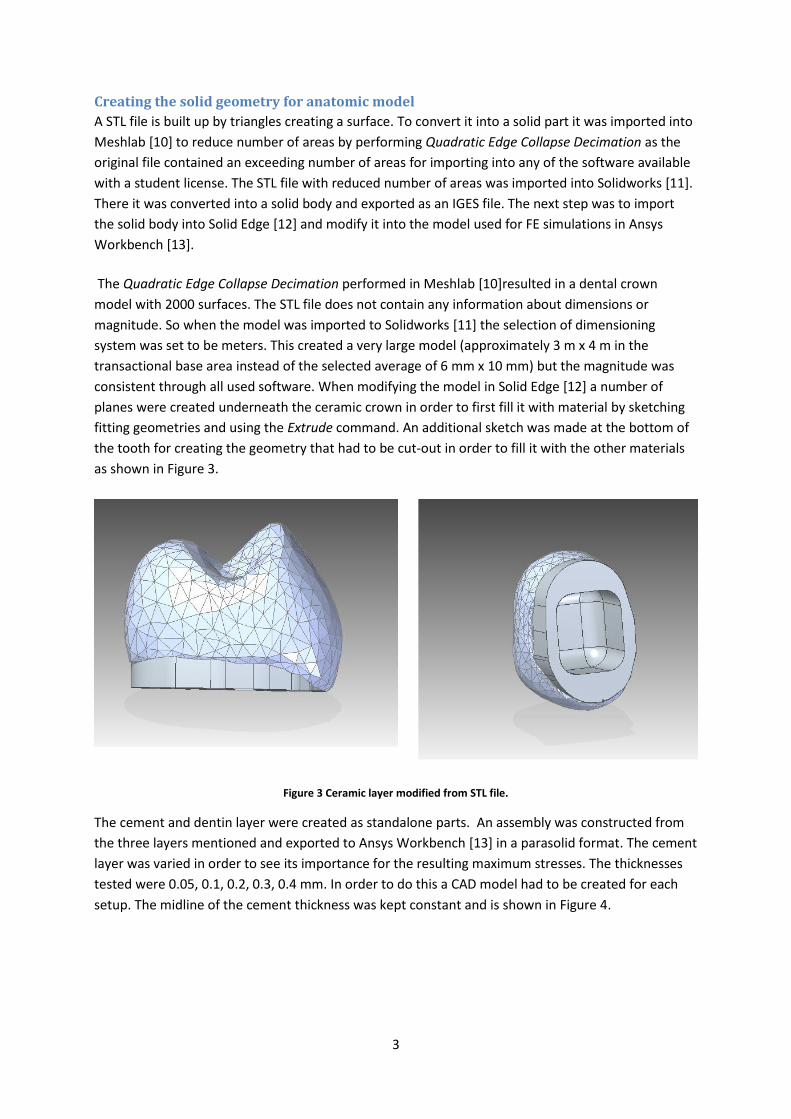
STOCKHOLM, SWEDEN 2014
Structural integrity of dental crowns
NATHALIE HAMSUND
KTH ROYAL INSTITUTE OF TECHNOLOGY
SCHOOL OF ENGINEERING SCIENCES
Acknowledgements This report is a Master thesis project in Solid Mechanics at the Royal Institute of Technology (KTH).
The work was performed at the Mechanical Engineering department at Queen´s University in Belfast,
Northern Ireland during the spring 2014. Doctor Elaheh Ghassemieh was the supervisor at Queen´s
University and Professor Bo Alfredsson was the examiner at KTH.
I would like to take the opportunity to express my deepest gratitude to my supervisor Doctor Elaheh
Ghassemieh for her great support through the project and continuous feedback. Along the way I
have also received valuable advice from Professor Bo Alfredsson and Associate Professor Artem
Kulachenko.
Summary There is currently no standardized method for testing dentures made of dental ceramic materials.
This creates problems for comparisons between studies concerning strength in materials and
geometry. The geometry of the maxillary first premolar was used for the analysis. The modeled
crown has two underlying layers, a thin cement layer closest to the crown that attaches the crown to
dentin. Simplifications are made so that dentin geometry is modeled in CAD as a cuboid and the
cement layer above follow its geometry. For the actual analysis, a FE-analysis has been made of
different loading positions and areas to clearly show how important it is to be consistent in the
selection of these. The load has been placed on two surfaces with 150 N each to resemble a real
occlusal maximum load. The standard area used in other analysis was set to be 5.5 mm2 on each
cusp. A comparative analysis has been made of various ceramic materials to see what impact it has
on the cement layer strength. Similarly the cement material properties were modified to see how it
affects the ceramic crowns strength. In real applications, one usually tries to achieve as thin cement
layer as possible but here the analysis is of how much influence the cement layer thickness has on
the overall crown strength. Two cylindrically shaped simplified models were created to see how
much the anatomical geometry effects on the maximum stresses. One was modeled with a flat top
and the other with an angled top.
The load placement and the magnitude of its area turned out to be very important for the resulting
maximum stresses. Surface area ranged from 0.07 - 26 mm2, and the resulting von Mises stresses for
these ranged from 1120 to 34 MPa. Generally speaking, varying cement materials available on the
market does not give huge impact on ceramic bearing stress. Panavia F 2.0 was found to be the
strongest cementing layer that caused the highest failure load of the existing materials on the
market. Super Bond B&D gave the lowest failure load. However, you could see that it was a bit more
important to be careful for the crown material. The made up ceramic materials (Hypothetical
Ceramic and Experimental Ceramic) proved to cause relatively close stresses for the cement to fail. It
was also clear that a thicker cement layer reduces the expected failure load and the structure
becomes weaker. The simplified models seemed to give a substantial exaggeration of strength. The
expected failure load was nearly twice as large for these (slightly lower for the angled model) than
for the anatomical model.
When comparing with the test data from another study it proved that it does not match with the
simulations. In the study different cementing materials had been tested and Super Bond B&D turned
out to be the strongest material. With this in hand it can be said that a stable test setup with
consistently identical geometries is necessary in order to evaluate these kinds of structures.
Sammanfattning Idag finns ingen standardiserad provninvgsmetod för tandproteser gjorda i odontologiska
keramikmaterial. Det skapar problem vid jämförelser mellan studier som rör hållfasthet med
avseende på material och geometri. I det här examensarbetet har en geometri från övre käkbenets
första premolar analyserats. Den modellerade kronan har två underliggande lager, ett tunt
cementlager närmast kronan som fäster kronan till dentin. Förenklingar är gjorda så att dentinets
geometri modellerats i CAD som ett rätblock och cementlagret ovan följer dess geometri. Vid själva
analysen har man gjort FE-analys av olika lastpositioner och areor för att tydligt visa hur viktigt det är
att vara konsekvent vid valet av dessa. Lasten har lagts på två ytor med 150 N på vardera kusp för att
likna ett verkligt betts högsta lastkraft. Som standardfall att använda för andra analyser valdes en
area på 5.5 mm2 på vardera kusp. En jämförande analys har gjorts av olika ceramiska material för att
se vilken inverkan det har på cementlagrets hållfasthet. På samma sätt ändrades cement materialets
egenskaper för att se hur det inverkar på kermaikkronans hållfasthet. I verkliga applikationer
försöker man oftast nå ett så tunnt cementlager som möjligt, här har en analys gjorts av hur stor
inverkan på hållfastheten som cementlagret har. Två cylindriskt formade förenklade modeller
skapades för att se den anatomiska geometrins inverkan på spänningsbilden. En modellerades med
platt topp och den andra med vinklad topp.
Lastens placering och arean den är utbredd på visade sig vara väldigt viktigt för de resulterande
maximala spänningarna. Ytans area varierade mellan 0.07 – 26 mm2 och resulterande von Mises
spänningarna för dessa varierade 1120 – 34 MPa. Generellt sett hade olika cementmaterial som finns
på marknaden inte jättestor inverkan på keramiklagrets spänningsbild. Panavia F 2.0 visade sig ändå
vara det starkaste cementeringslagret som orsakade högst brottlast av de befintliga materialen på
marknaden. Superbond B&D gav lägst resultat. Däremot kunde man se att det var lite viktigare att
vara noggrann med kronans materialval. De påhittade keramikmaterialens (Hypothetical Ceramic och
Experimental Ceramic) spänningar visade sig komma realtivt nära cementlagrets brottgräns. Det
visade sig också tydligt att för ett tjockare cement lager minskar den förväntade brottlasten och
strukturen blir svagare. De förenklade modellerna tycktes ge en kraftig överdrift i hållfasthet. Den
förväntade brottlasten var nästan dubbelt så stor för dessa (något lägre för den vinklade modellen)
än för den anatomiska modellen.
Vid jämförelse med testdata från en annan studie visade de sig inte stämma överens med
simuleringarna särskilt bra. Man hade testat olika cementeringsmaterial och där visade sig
Superbond B&D vara det starkaste materialet. Utifrån det kan man säga att en stabil
provningsuppställning med konsekvent identiska geometrier är nödvändigt för att kunna evaluera
sådana här strukturer.
Table of Contents Introduction ............................................................................................................................................. 1
Cement Material E-moduli [GPa] Poisson’s ratio Super bond C&B, self-cure dental adhesive resin cement
1.8 0.25
RelyX luting plus 4 0.35 Average Cement 5 0.3 Rely X Unicem, dual-polymerized self- adhesive universal resin cement
8 0.33
Panavia F 2.0, dual-polymerized phosphate- modified resin cement
18.3 0.3
Hypothetical, extreme high value material 40 0.35
Calculating expected failure load When calculating the expected load for failure it was assumed that the load-to-failure value would be
linear as this is a linear elastic model explained in (6).
(6)
The differences in expected load to failure are due to von Mises and Rankine theory. Rankine failure
criterion only look at the maximum Principal stress, the most positive or most negative principal
stress and use the compressive or tensile strength respectively as a reference as seen in (7).
| |
(7)
When using von Mises failure criterion the value used in the scale factor takes into account for all
principal stresses. In the 3D case this means the 1st, 2nd and 3rd Principal stress. Then this value is
compared to the flexural strength according to (8). The flexural strength of a material is determined
by a three point bending test is used as measurement for bending strength in brittle materials.
√
[
]
(8)
The relations of (7) and (8) shows that the different failure criterions have little to do with each
other. They do not use the same reference values and the output value for comparison depends a lot
on the Principal stresses relation in magnitude.
9
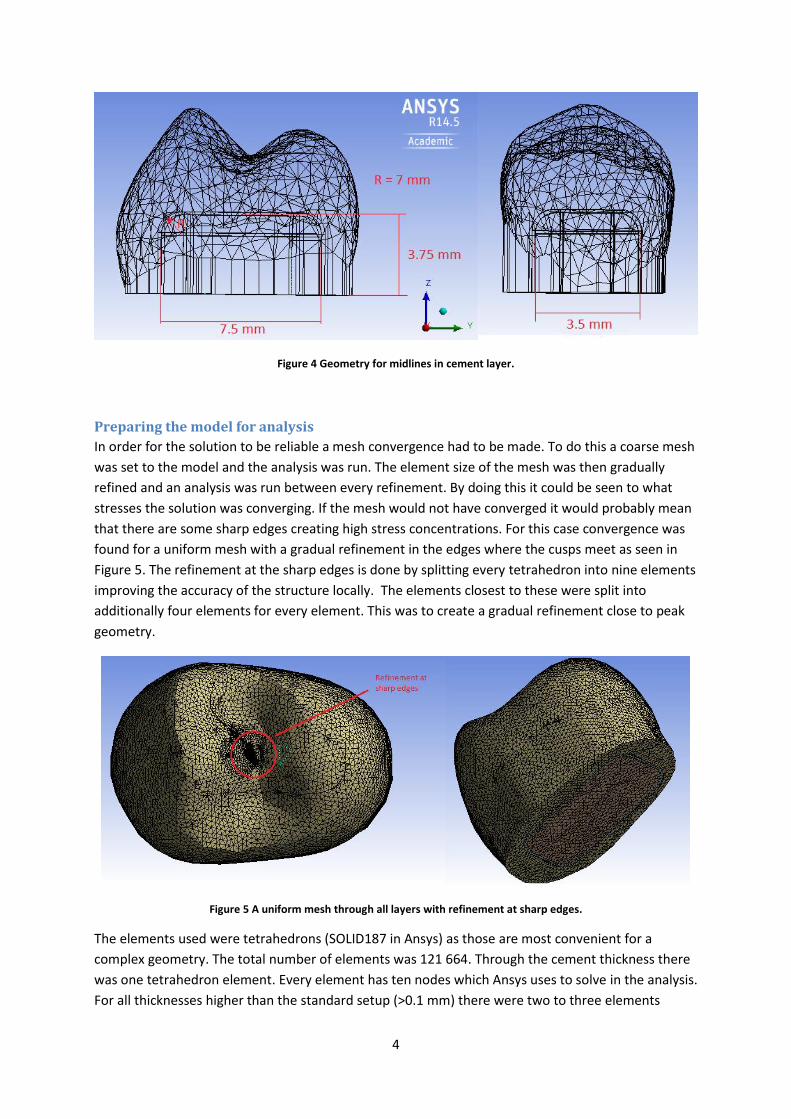
Results and Discussion For all analysis cases in Ansys the solution became non-linear. This is expected for a model with contact elements [14]. The expected failure load for the original setup is seen in Table 4. The original setup means that the applied load is 150 N at 5.5 mm2 on each cusp and cement thickness of 0.1 mm. The ceramic material used was IPS e.max Press and the cement material used was RelyX luting plus. Table 4 Expected failure load according to different strengths.
Expected failure load according to von Mises [N]
Expected failure load according to Rankine in
compression [N]
Expected failure load according to Rankine in
tension [N] 977 759 1594
According to these simulations the dental crown seems to be most sensitive to compression and least to tension. The expected failure loads seem reliable when comparing to another study where testing has been made of ceramic crowns of IPS e.max [15]. The failure load in that study was mainly between 800 – 850 N. A specification of failure mode was not reported as the samples generally were totally demolished.
Load application The expected failure load showed to be very much dependent on the loading area. This can be seen
from the diagram in Figure 12. The flexural strength for the ceramic is seen by a line in the diagram.
For a very small loading area presented on the right hand side the flexural strength seems to cause a
problem. According to the flexural strength, failure in ceramic has occurred for less than half the load
applied here when loading at the tips on 0.07 mm2.
Figure 12 Diagram showing the maximum von Mises stress according to loading position and area. The flexural strength for the ceramic layer (IPS e.max Press) is marked out with a line.
The simulation made for compression on tips has a slightly smaller area than the largest load area on
the cusps. The resulting maximum von Mises stress seems to be higher when loading at the cusps
than when loading at the tips. This implies that a compressive test by loading at the tips can create a
10
risky underestimation of the actual maximum stress that occurs in a real case where loading mainly
occurs at the cusps.
Stresses in Ceramic when varying Cement thickness The results from changing the cement thickness are presented in Table 5. It is seen that the stresses
increase for an increasing cement thickness. This indicates that it is valuable to keep as thin cement
thickness as possible. It is recognized that this stage of the process I critical. The cement material is
applied manually and painted on the dentin. This makes it sensitive as there is a human impact that
easily causes irregularities and flaws. Also the cement layer has to be prepared and applied within a
short working time, about 2 min [5]. The short timeframe can therefore also be a parameter causing
problem by the human factor.
Table 5 The maximum von Mises and Principal stresses in the different layers when varying the cement layer thickness.
Resulting stresses for simplified models The simplified models lead to an underestimation of the maximum stresses compared to the
anatomical model. This is shown in Figure 13. The diagram to the left shows the dentin and cement
layer and the diagram to the right shows the results for ceramic. These diagrams show that an
angled setup is more like the anatomical setup than the flat one.
Figure 13 Comparing the simplified and anatomic models in maximum stresses for the different layers.
The underestimation is large for all material layers and is probably not recommended for making
reliable simulations. It can be discussed that simplified modelling can be of value for comparable
simulation between the material layers. These results were somehow expected as the geometry is
much idealized in the simplified models.
Table 7 The expected failure loads for the different models
Failure criteria Failure load;
Flat model[N] Failure load;
Angled model [N] Failure load;
Anatomic model [N] von Mises 2920 1909 977 Rankine 2147 1616 759
The setup of the simplified flat model can be compared to previous testing [1]. The measured failure
load is in those experiments about 800 N. Considering that the geometry used in testing was oval
instead of circular and the E-modulus for the ceramic was 65 GPa in the experiments and here it was
94.4 GPa. This shows that the simulation might cause exceeding overestimations of crown strength
for such simple geometry when comparing to the first column in Table 7.
12
Different materials in Ceramic and Cement The ceramic and cement material were varied according to Table 2 and Table 3 respectively.
Varying Ceramic material
The ceramic was varied in order to see the crown material impact on the cement layer. The stress
results for the cement are seen as solid filled columns in Figure 14. The results show that the stresses
vary 140 % in bending and 100 % in compression when comparing highest to lowest maximum
stresses. It is seen from the transparent column in Figure 14 that the expected failure is far from
reaching for all different ceramic layers. The expected failure load is calculated from the assumption
of linear behaviour between applied load and resulting stresses. The stress at failure is the flexural
strength of the cement material and from this an expected failure load is calculated. The
Experimental Ceramic and the Hypothetical Ceramic are the only ceramics that imply an expected
failure load of about 1000 N and could indicate that the cement might fail before the ceramic crown.
The failure load for the ceramic is mentioned in Table 7 for the anatomic model. This seems a bit odd
as the elastic moduli at the ceramic are very different. This could be an indication that the elastic
modulus in combination of Poisson’s ratio is important. Also there is a possibility that the maximum
stresses do not occur at the exact same node for the different material setups. These are not real
materials but it shows that the materials available on the market probably have relatively good
properties to keep the cement layer from failing.
Figure 14 The maximum stresses in cement layer when varying the ceramic material are seen by solid filling. The transparent columns show how long is remained until cement reaches failure.
13
Varying Cement material
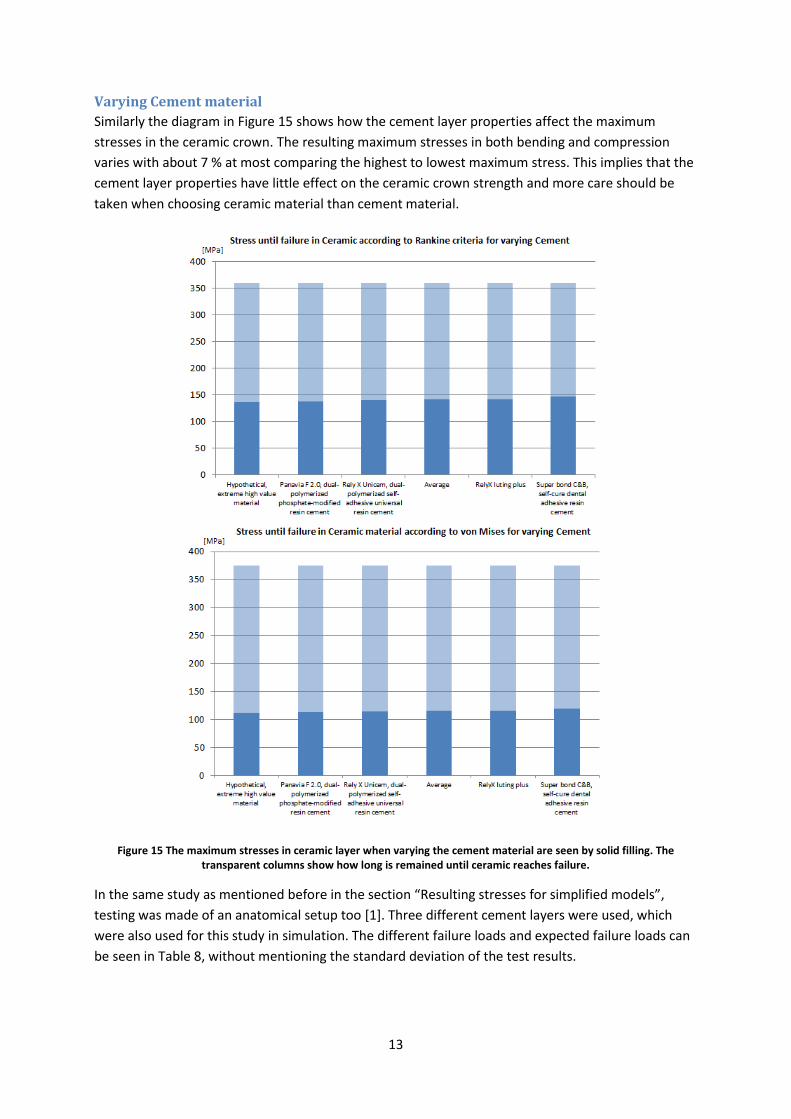
Similarly the diagram in Figure 15 shows how the cement layer properties affect the maximum
stresses in the ceramic crown. The resulting maximum stresses in both bending and compression
varies with about 7 % at most comparing the highest to lowest maximum stress. This implies that the
cement layer properties have little effect on the ceramic crown strength and more care should be
taken when choosing ceramic material than cement material.
Figure 15 The maximum stresses in ceramic layer when varying the cement material are seen by solid filling. The transparent columns show how long is remained until ceramic reaches failure.
In the same study as mentioned before in the section “Resulting stresses for simplified models”,
testing was made of an anatomical setup too [1]. Three different cement layers were used, which
were also used for this study in simulation. The different failure loads and expected failure loads can
be seen in Table 8, without mentioning the standard deviation of the test results.
14
Table 8 Comparing the expected failure load from simulations with test study failure load.
Cement material Failure load
comparison study [1] [N]
Expected Failure load; vM criteria [N]
Expected Failure load; Rankine criteria [N]
Panavia F 2.0, dual-polymerized phosphate-modified resin cement
550 1000 780
Rely X Unicem, dual-polymerized self-adhesive universal resin cement
400 990 770
Super bond C&B, self-cure dental adhesive resin cement
650 940 730
From Table 8 it is seen that generally the simulations seem to overestimate the strength of the
crown. When looking into detail it seems to be none at all similarities between the comparisons of
cement materials. Panavia F 2.0 seems to be the strongest cement material according to simulations
and Super bond C&B seems to be the strongest according to testing. The high diversity of these
results may say something about the importance of correct geometries. In the simulations the
geometries are always kept perfectly constant comparing to testing where flaws easily occur.
15
Conclusions The aim of the project was to show that loading area and position has a great impact on the stress
result in a dental crown. This was achieved by the results provided and all the most important
conclusions are listed below.
Loading area and the position of loading seems to be a very important factor for the
maximum stresses and indirectly the apparent strength of the dental crown.
A standardized testing method should be established in order to make fair comparisons
between testing.
More care has to be taken when choosing ceramic material than cement material in order to
control the crown strength.
A thick cement layer indicates to have a negative influence on the crown strength.
The simplified model seems to lead to a risky overestimation of the crown strength.
However, these simplified models can have a value in qualitatively comparing and ranking
materials while the large geometry effect on strength is rumored.
Practical testing seems to be very sensitive to flaws, load application and alignment.
16
References
[1] S. Shahrbafa, R. van Noorta, N. Martin, E. Ghassemieh and B. Mirzakouchakib, “Fracture strength of machined ceramic crowns as afunction of tooth preparation design and the elasticmodulus of the cement,” Dental Materials, pp. 234-241, 2013.
[2] J. R. Kelly, “Clinically relevant approach to failure testing of all-ceramic restorations,” 1999.
[3] T. Sornsuwan, A. Ellakwa and M. V. Swain, “Occlusal geometrical considerations in all-ceramic pre-molar crown failure testing,” Dental Materials, vol. 27, p. 1127–1134, 2011.
[4] D. Zhang, C. Lu, X. Zhang, S. Maob and D. Arola, “Contact fracture of full-ceramic crowns subjected to occlusal loads,” Journal of Biomechanics, vol. 41, p. 2995–3001, 2008.
[6] J. Kinney, S. Marshall and G. Marshall, “The Mechanical Properties of Human Dentin: a Critical Review and Re-evaluation of the Dental Literature,” Critical Reviews in Oral Biology and Medicine, vol. 14, no. 1, pp. 13-29, 2003.
[7] Michal Staninec,Grayson W. Marshall,Joan F. Hilton,David H. Pashley,Stuart A. Gansky,Sally J. Marshall and John H. Kinney, “Ultimate tensile strength of dentin: Evidence for a damage mechanics approach to dentin failure,” Journal of Biomedical Materials Research, vol. 63, no. 3, p. 342–345, 2002.
[8] S. Shahrbafa, R. van Noorta, B. Mirzakouchakib and E. Ghassemieh, “Effect of the crown design and interface lute parameters on the stress-state of a machined crown–tooth system: A finite element analysis,” Dental Materials, p. 9, 2013.
[9] B. Dejaka, A. Mlotkowskib and C. Langota, “Three-dimensional finite element analysis of molars with thin-walled prosthetic crowns made of various materials,” Dental materials, vol. 28, pp. 433-441, 2012.
[10] 3D-CoForm, “MeshLab,” 2012.
[11] D. S. S. Corp., “Solidworks”.
[12] “Solid Edge,” ST5.
[13] “ANSYS,” 14.5.
[14] P. David H. Johnson, “http://www.ansys.com,” 2002. [Online]. Available: http://www.ansys.com/staticassets/ANSYS/staticassets/resourcelibrary/confpaper/2002-Int-ANSYS-Conf-201.PDF. [Accessed 20 02 2013].
[15] J. Buller, “Comparison of structural integrity of dental crown systems of CAD/CAM and pressed,” Queen's University, Belfast, 2014.