Page 1
Journal of Natural Sciences Research www.iiste.org
ISSN 2224-3186 (Paper) ISSN 2225-0921 (Online)
Vol.3, No.13, 2013
137
Structural Interpretation of Abakiliki – Ugep, using Airborne
Magnetic and Landsat Thematic Mapper (TM) Data
Goodhope Anyanwu,Luke Mamah*
Department of Geology University of Nigeria, Nsukka, Enugu State Nigeria
* E-mail of the corresponding author: [email protected]
Abstract
The study area is part of the Southern Benue Trough and lies within Latitudes 5º 30' - 6º 30' N and Longitudes 8º
00' - 8º 30' E. Structural interpretation of Abakaliki–Ugep area using aeromagnetic and Landsat data was carried
out to determine the depth to the magnetic basement, delineate the basement morphology, relief, and the
structural features associated with the basin uplift, (Abakaliki Uplift) as well as their trends/patterns.
Aeromagnetic and Landsat data were subjected to various image and data enhancement and transformation
routines. Results of the 2-D spectral analysis revealed a two depth models: the shallower magnetic source bodies
range in depth (D1) from 0.035km to 1.285km with an average of 0.656km while the deeper magnetic source
bodies range in depth (D2) from 1.585km to 4.136km with an average depth of 3.096km.The shallower magnetic
anomalies resulted due to basement rocks which intruded into the sedimentary rocks while the deeper magnetic
anomalies are associated with intra-basement discontinuities associated with faults. The average sedimentary
thickness of 3.096km estimated in the study area may favor hydrocarbon generation. The drainage pattern is
dendritic which is indicative of lithological, structural and topographic differences and also indicative of alluvial
rocks, which is typical of the geology of the area that consists mainly of sedimentary rocks. Also, results from
the study revealed lineaments with trend directions in the N-S, NE-SW, NW-SE and E-W directions, with the
NE-SW trends being dominant. The dominant trend of the magnetic data is the NE-SW which agrees with the
fault orientation within the Benue Trough.
Keywords: Structural trends, Aeromagnetic anomalies, basement depths, Lineaments, Landsat
1. Introduction
The interpretation of aeromagnetic maps in the past decade has moved from the interpretation of basement
structures to detailed examination of structures and lithological variations in the sedimentary section. Magnetic
basement is an assemblage of rocks that underlies sedimentary basins and may also outcrop in places. If the
magnetic units in the basement occur at the basement surface, then depth determinations for these will map the
basin floor morphology and its structure, Onyedim and Awoyemi, (2006). In many sedimentary basins, magnetic
anomalies arise from secondary mineralization along fault planes, which are often revealed on aeromagnetic
maps as surface linear features. Some lineament patterns have been defined to be the most favorable structural
conditions in control of various mineral deposits. They include the traces of major regional lineaments, the
intersection of major lineaments or both major (regional) and local lineaments, lineaments of tensional nature,
local highest concentration (or density) of lineament, between echelon lineaments, and lineaments associated
with circular features. Linear features are clearly discernible on aeromagnetic maps and often indicate the form
and position of individual folds, faults, joints, veins, lithological contacts, and other geologic features that may
lead to the location of individual mineral deposits. They often indicate the general geometry of subsurface
structures of an area thereby providing a regional structural pattern. Since the primary objective of this study is
to identify structures and geomorphic features expressed as lineaments and classify them according to their
spatial and directional attributes, it would be necessary to process the aeromagnetic and Landsat -TM data in a
manner that would both enhance trends and facilitate the computation of locations and depths to magnetic
sources. Drainage pattern, termination of potential field (gravity or magnetic) map, anomalies on a linear trend,
termination of drainage line on linear trends and straight stream segments were the basic hypothetical models
used to map fractures. Ajayi, et al (1991) believes that lineaments can also be revealed on aeromagnetic maps by
breaks in anomaly trends (lengthwise) and prominently narrow magnetic lows (broad wise) and sharp gradients
of anomaly.
The purpose of this study therefore is to investigate the basement topography, identify and delineate the
structures associated with the basin, identify the trends and patterns of such structures, and to make inferences
about their relationship with basin formation and dynamics.
Page 2
Journal of Natural Sciences Research www.iiste.org
ISSN 2224-3186 (Paper) ISSN 2225-0921 (Online)
Vol.3, No.13, 2013
138
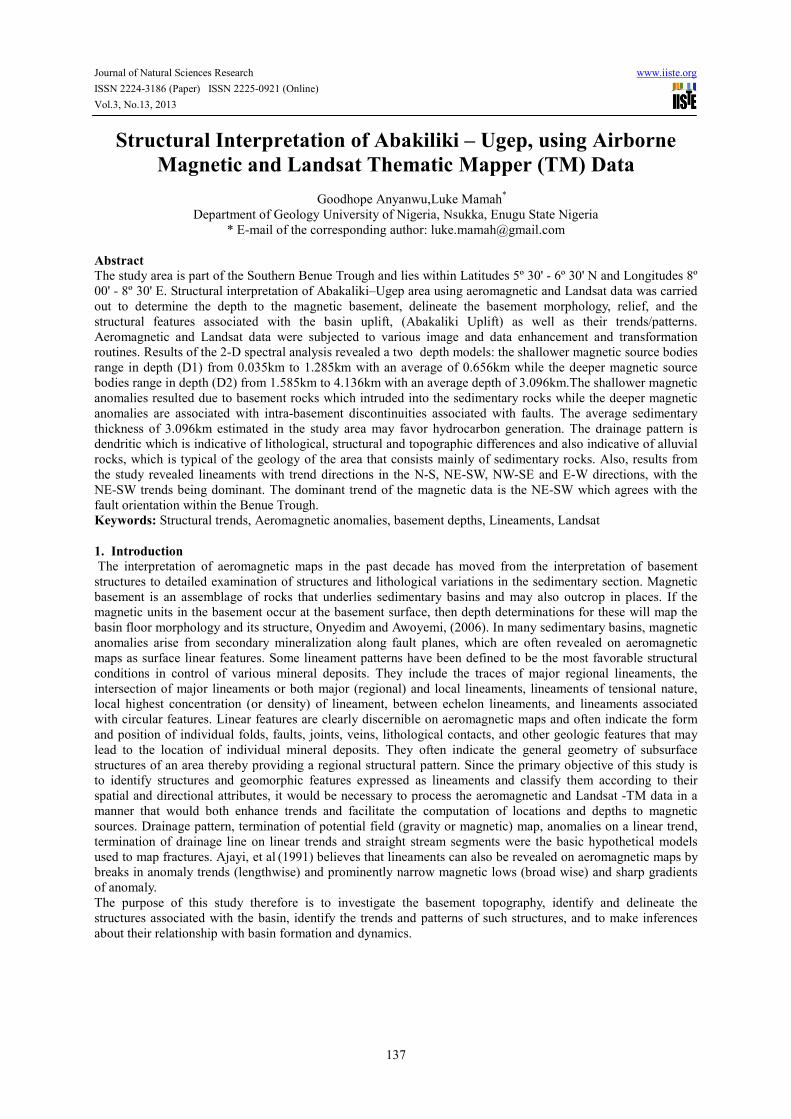
2.Geology
The study area is located within latitudes 5
o 30' and 6
o 30'N and longitudes 8
o 00' and 8
o30'E (Fig. 1).The Benue
Trough was formed as a result of series of tectonics and repetitive sedimentation in the Cretaceous time when
South American continent separated from Africa and the opening of the South Atlantic Ocean.The depositional
history of the Benue Trough is characterized by phases of marine regression and transgression (Murat, 1972;
Reyment, 1965; Short and Stauble, 1967). These sedimentary sequences were n
Fig. 1: Geological map of the Study Area (Adapted from the Nigerian Geological Survey Agency (NGSA) map,
sheets 303 & 314) showing areas with sedimentary formations, igneous intrusions and metamorphic terrain.
Interrupted by large scale tectonics which occurred in two phases: the Cenomanian and the Santonian
deformations (Nwachukwu, 1972; Olade, 1975). The Santonian deformation was characterized by compressive
folding, generally along a NE-SW direction, parallel to the Trough margin. The folding episode which took place
during the Santonian strongly affected the development of the Abakaliki Anticlinorium. A predominantly
compressional nature of the folds that developed during this period is revealed by their asymmetry and the
reversed faults associated with them. Benkhelil (1988), in a detailed report on the geology of Abakaliki domain,
likened its development to that which occurs in a complete orogenic cycle including sedimentation, magmatism,
metamorphism and compressive tectonism. He suggested that the compression responsible for the large scale
folding and cleavage was directed N155ºE. The magmatism that occurred resulted in the injection of numerous
intrusive bodies into the shale of the Eze Aku and Asu River Group. Okereke and Ananaba (2006) et al generated
a regional magnetic field intensity map from aeromagnetic data of the Southern Benue Trough and Niger Delta.
The produced regional map showed prominent features and major tectonic trends in the NE-SW direction which
when compared with those indicated on the tectonic map of Africa, suggested a linear extension of the Chain
and Charcot fracture zones into the continental part of Nigeria
3. Methodology
For this study, the contoured aeromagnetic data used (sheets 303 and 314, published on a scale of 1:100,000)
were obtained from the Nigeria Geological Survey Agency (NGSA). The maps were digitized in order to get the
longitude and latitude positions of towns with respect to susceptibility which is a physical quantity in
aeromagnetic survey. The digitized data were filtered using a low pass Fourier domain sub routine filter of
MatLab 7.5 to eliminate unwanted wavelengths and to pass longer wavelengths. Several potential field software
with different analytical modules were used in the interpretations of the aeromagnetic maps. These include
Geosoft Oasis Montaj 6.4.2.HJ version, U.S. Geological Survey Potential-Field geophysical software Version
2.0, Surfer 10 and Matlab 7.5 Regional - residual separation was carried out using polynomial fitting. This is a
Page 3
Journal of Natural Sciences Research www.iiste.org
ISSN 2224-3186 (Paper) ISSN 2225-0921 (Online)
Vol.3, No.13, 2013
139
purely analytical method in which matching of the regionals by a polynomial surface of low order exposes the
residual features as random errors.
For the magnetic data, the regional gradients were removed by fitting a plane surface to the data by
using multi- regression least squares analysis. The expression obtained for the regional field T(R) is given as:
T(R) = 7612.158 + 0.371x – 0.248y
The regional trend is represented by a straight line, or more generally by a smooth polynomial curve. The fitting
of polynomials to observed geophysical data is used to compute the mathematical surface giving the closest fit to
the data that can be obtained within a specified degree of details. This surface is considered to approximate the
effect of deep seated or regional structures if it is of low degree. Other analytical methods used include
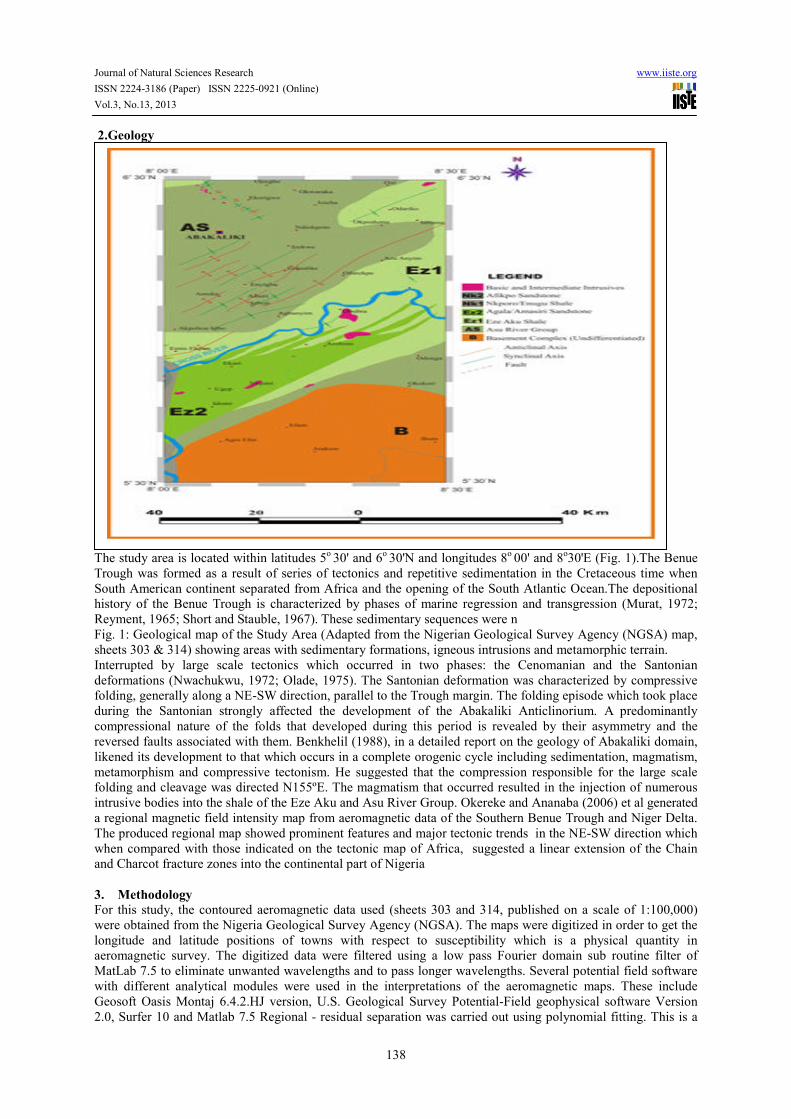
Reduction-to-pole, Second vertical derivatives and trend surface analysis 2-D spectral analysis.
Reduction-to-pole (RTP) transformation was applied to the aeromagnetic data to minimize polarity
effects (Blakely, 1995). These effects are manifested as a shift of the main anomaly from the center of the
magnetic source and are due to the vector nature of the measured magnetic field. The RTP transformation
usually involves an assumption that the total magnetizations of most rocks align parallel or anti-parallel to the
Earth's main field. Similarly, second vertical derivative filters were used to enhance subtle anomalies while
reducing regional trends. These filters are considered most useful for defining the edges of bodies and for
amplifying fault trends.
Fig 2 shows shaded relief map with amplified structural trends.
In mathematical terms, a vertical derivative can be shown to be a measure of the curvature of the
potential field, while zero second vertical derivative contours defines the edge of the causative body. Thus, the
second vertical derivative is in effect a measure of the curvature, i.e., the rate of change of non- linear magnetic
gradients. The zero magnetic contours of the second vertical derivative often coincide with the lithologic
boundaries while positive and negative anomalies often match surface exposures of the mafic and felsic rocks
respectively.
Average depth values to buried magnetic rocks using the power spectrum of total intensity field were
achieved using spectral analysis. These depths were established from the slope of the log- power spectrum at the
lower end of the total wave number or spatial frequency band. The application of spectral analysis to the
interpretation of potential field data is therefore sufficiently well established (Spector and Grant, 1970). The
method allows an estimate of the depth of an ensemble of magnetized blocks of varying depth, width, thickness
and magnetization. Most of the approaches used involve Fourier transformation of the digitized aeromagnetic
data to compute the energy (or amplitude) spectrum. This is plotted on a logarithmic scale against frequency.
The slopes of the segments yield estimates of average depths to magnetic sources of anomalies.
Page 4
Journal of Natural Sciences Research www.iiste.org
ISSN 2224-3186 (Paper) ISSN 2225-0921 (Online)
Vol.3, No.13, 2013
140
The Landsat Thematic Mapper (Landsat-TM) imagery acquired on 17/02/2001 from National Space
Research and Development Agency (NASRDA), Nigeria, was used to map linear structures in the study area.
The raw data was geo-referenced using the coordinates of the topographic sheets in the study area. The geo-
reference projection was carried out using the Universal Traverse Mercator (UTM). Image processing,
enhancement and analysis were carried out using ILWIS 3.1 Academic software. Image enhancement operations
carried out include contrast stretching, spatial filtering and edge detection, which were done to enhance
sharpness of the satellite image for better visual interpretation, reduce noise in the image and to aid structural
interpretation. The image was obtained using landsat ETM sensor with band combinations 2, 3 and 4 with a
resolution of 30m. However, Arc View 3.2 software was used to extract the lineaments and carry out statistical
analysis of the interpreted lineaments in the area. The lineament trend directions were summarized by using a
Rose diagram (Azimuth Distribution Diagram) as shown in Figure 13.
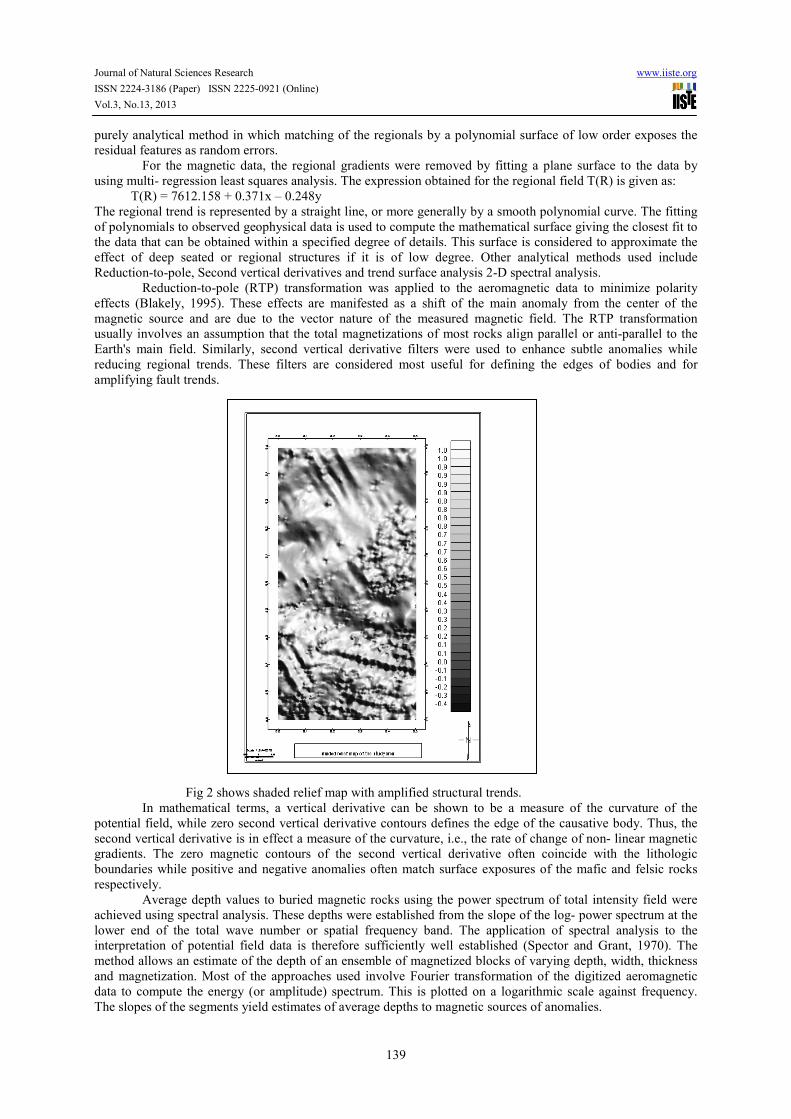
4 Results and Interpretation
Fig.2 is a shaded relief map derived from the total magnetic field intensity. Towards the north it shows an
enhancement of linear structural features with a dominant NW-SE lineation being superimposed on the NE-SW
earlier lineation. The total field of the aeromagnetic data also revealed that the underlying basement around Ugep
has magnetic intensity estimated at 7900 gammas while that of Abakaliki has 7860 gammas. The wire-frame
revealed high basement relief in places indicating folded topography, which may be interpreted as part of the
Abakaliki folded belt. Magnetic anomalies both short and long wavelengths were interpreted within the study
area. These are represented by magnetic highs and lows. Areas with high magnetic intensity anomalies are seen
around the northern, central and south-western parts of the study area. At Ugep, the intensity ranges from 7900γ
to 7910γ while at Abakakili, it ranges from 7840γ to 7860γ.
Fig 3 shows a wireframe 3-D map of the total
magnetic field with indications of folded basement
First to fourth degree regional magnetic fields tend to support the deductions of NE-SW earlier structural trend
Fig 4a-d while the residual fields presented in Figures 5a-d emphasized the later NW-SE structural trend. It was
also discovered that first degree residual magnetic intensity of the study area ranges between -48 to 52.9 gammas,
second degree residual varies from -47.6 to 52.8, third degree residual varies from -47.7 to 51.5, and fourth
degree residual varies from -52 to 51.0. The figure above portrays the study area as area of negative residual
anomalies flanked by positive residual anomalies. The negative residuals area reflects zone of low magnetization
while the positive residual anomalies reflect area of high magnetization. These negative anomalies surrounded
by the elongated positive anomaly reflect high magnetization zone engulfed by the lower magnetization zone.
The first, second, third and fourth residuals show that Abakaliki – Ugep area has positive residual anomalies.
This implies that shallow to near surface magnetized bodies exist in the area.
Page 5
Journal of Natural Sciences Research www.iiste.org
ISSN 2224-3186 (Paper) ISSN 2225-0921 (Online)
Vol.3, No.13, 2013
141
Fig. 4a-d shows first to fourth degree regional magnetic fields depicting NE_SW structural trend
Page 6
Journal of Natural Sciences Research www.iiste.org
ISSN 2224-3186 (Paper) ISSN 2225-0921 (Online)
Vol.3, No.13, 2013
142
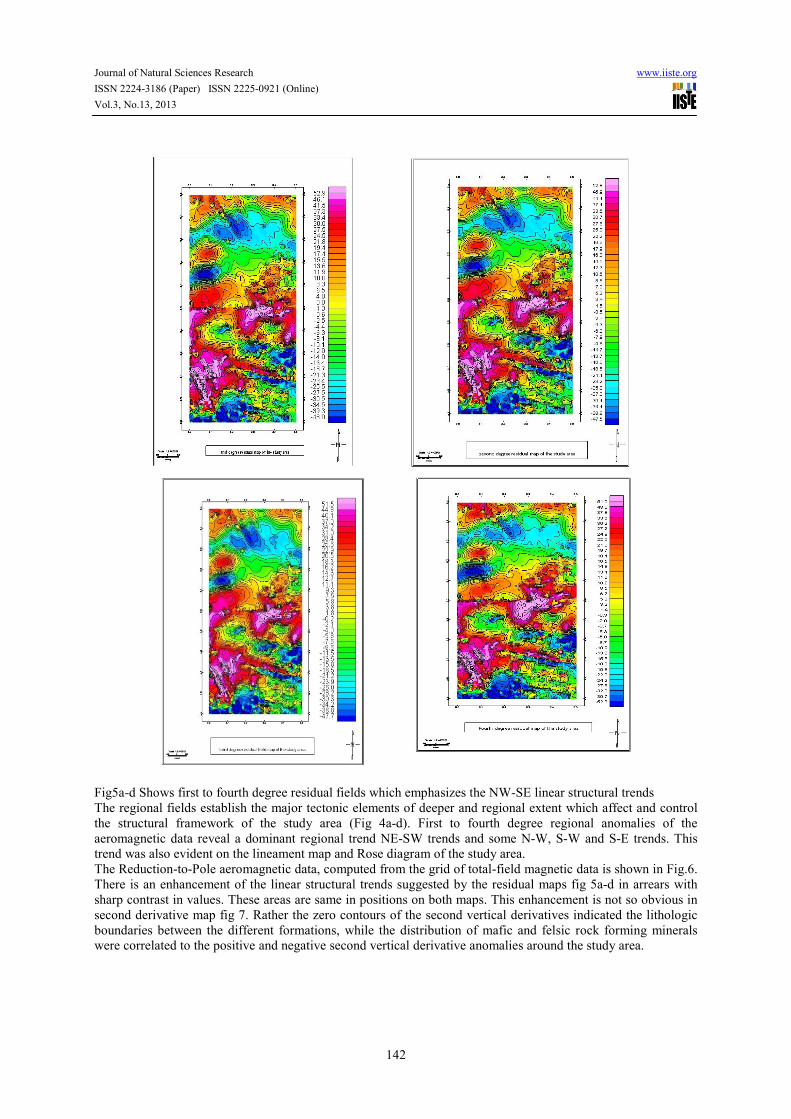
Fig5a-d Shows first to fourth degree residual fields which emphasizes the NW-SE linear structural trends
The regional fields establish the major tectonic elements of deeper and regional extent which affect and control
the structural framework of the study area (Fig 4a-d). First to fourth degree regional anomalies of the
aeromagnetic data reveal a dominant regional trend NE-SW trends and some N-W, S-W and S-E trends. This
trend was also evident on the lineament map and Rose diagram of the study area.
The Reduction-to-Pole aeromagnetic data, computed from the grid of total-field magnetic data is shown in Fig.6.
There is an enhancement of the linear structural trends suggested by the residual maps fig 5a-d in arrears with
sharp contrast in values. These areas are same in positions on both maps. This enhancement is not so obvious in
second derivative map fig 7. Rather the zero contours of the second vertical derivatives indicated the lithologic
boundaries between the different formations, while the distribution of mafic and felsic rock forming minerals
were correlated to the positive and negative second vertical derivative anomalies around the study area.
Page 7
Journal of Natural Sciences Research www.iiste.org
ISSN 2224-3186 (Paper) ISSN 2225-0921 (Online)
Vol.3, No.13, 2013
143
Fig 6. Reduction to Pole (RTP) map of Fig 7. Second derivative Map og Aeromagnetic
Total Aeromagnetic field (gammas) field of study.
For the spectral determination of depths to layers of magnetization, the study area was divided into eight (8)
blocks containing 28 km × 28 km. In doing this, adequate care was taken so that essential parts of each anomaly
were not cut by the blocks. In order to achieve this, the blocks were made to overlap each other. Graphs of the
logarithms of the spectral energies against frequencies obtained for various blocks are shown in Fig. 8. From the
gradients of the segments, the average depths to the causative layers were determined as D1and D2. The
estimated depths to magnetic basement are shown as D1 and D2 (Table 1). The first layer depth (D1), is the
depth to the shallower source represented by the second segment of the spectrum. This layer (D1) varies from
0.035km to 1.285km with an average of 0.656km. The second layer depth (D2) i.e. depth to the basement
represented by the first segment of the spectrum, varies from 1.585km to 4.136km, with an average of 3.096 km.
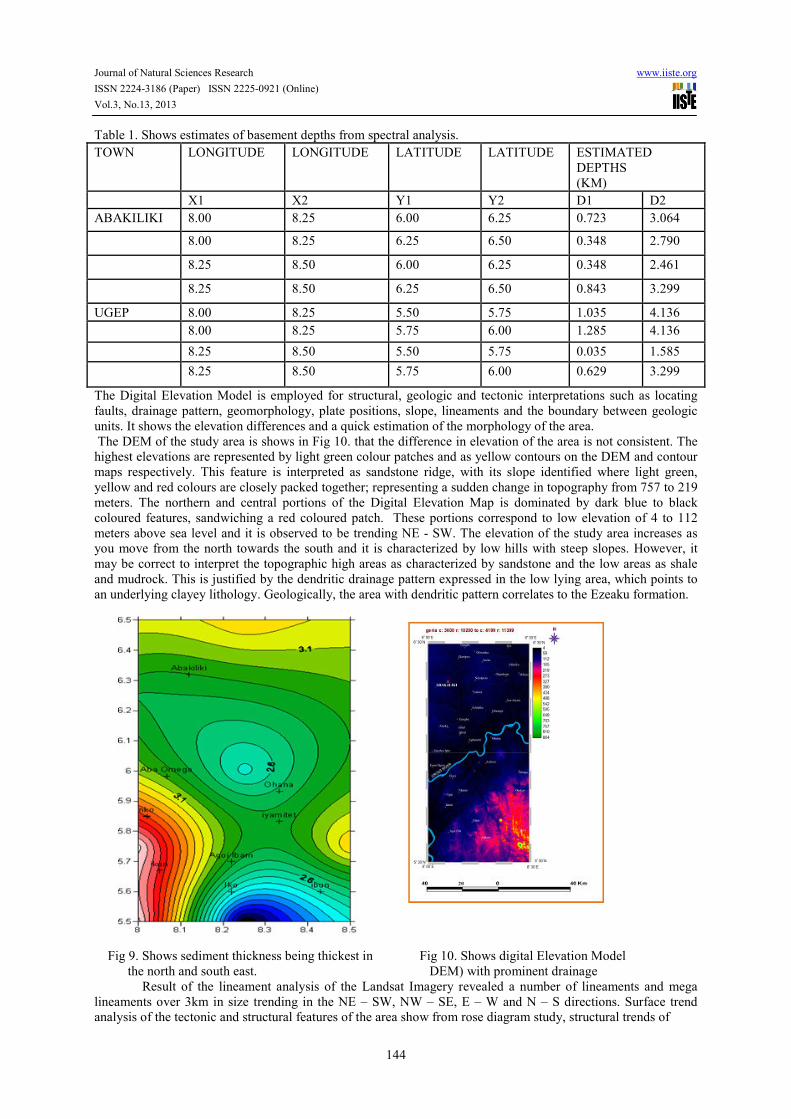
The basement depth (sedimentary thickness) contour map of the study area is shown in Fig. 9. The map reveals
the sedimentary thickness, as thinning towards the Southern direction and it ranges from 1.6km to 4.0km. The
colour codes show the depth in km.
Fig 8 shows Spectral inversion plots of 28X28km blocks defining slopes for the determination of depths to
causative sources.
your reader’s attention with a great quote from the
Page 8
Journal of Natural Sciences Research www.iiste.org
ISSN 2224-3186 (Paper) ISSN 2225-0921 (Online)
Vol.3, No.13, 2013
144
Table 1. Shows estimates of basement depths from spectral analysis.
TOWN LONGITUDE LONGITUDE LATITUDE LATITUDE ESTIMATED
DEPTHS
(KM)
X1 X2 Y1 Y2 D1 D2
ABAKILIKI 8.00 8.25 6.00 6.25 0.723 3.064
8.00 8.25 6.25 6.50 0.348 2.790
8.25 8.50 6.00 6.25 0.348 2.461
8.25 8.50 6.25 6.50 0.843 3.299
UGEP 8.00 8.25 5.50 5.75 1.035 4.136
8.00 8.25 5.75 6.00 1.285 4.136
8.25 8.50 5.50 5.75 0.035 1.585
8.25 8.50 5.75 6.00 0.629 3.299
The Digital Elevation Model is employed for structural, geologic and tectonic interpretations such as locating
faults, drainage pattern, geomorphology, plate positions, slope, lineaments and the boundary between geologic
units. It shows the elevation differences and a quick estimation of the morphology of the area.
The DEM of the study area is shows in Fig 10. that the difference in elevation of the area is not consistent. The
highest elevations are represented by light green colour patches and as yellow contours on the DEM and contour
maps respectively. This feature is interpreted as sandstone ridge, with its slope identified where light green,
yellow and red colours are closely packed together; representing a sudden change in topography from 757 to 219
meters. The northern and central portions of the Digital Elevation Map is dominated by dark blue to black
coloured features, sandwiching a red coloured patch. These portions correspond to low elevation of 4 to 112
meters above sea level and it is observed to be trending NE - SW. The elevation of the study area increases as
you move from the north towards the south and it is characterized by low hills with steep slopes. However, it
may be correct to interpret the topographic high areas as characterized by sandstone and the low areas as shale
and mudrock. This is justified by the dendritic drainage pattern expressed in the low lying area, which points to
an underlying clayey lithology. Geologically, the area with dendritic pattern correlates to the Ezeaku formation.
Fig 9. Shows sediment thickness being thickest in Fig 10. Shows digital Elevation Model
the north and south east. DEM) with prominent drainage
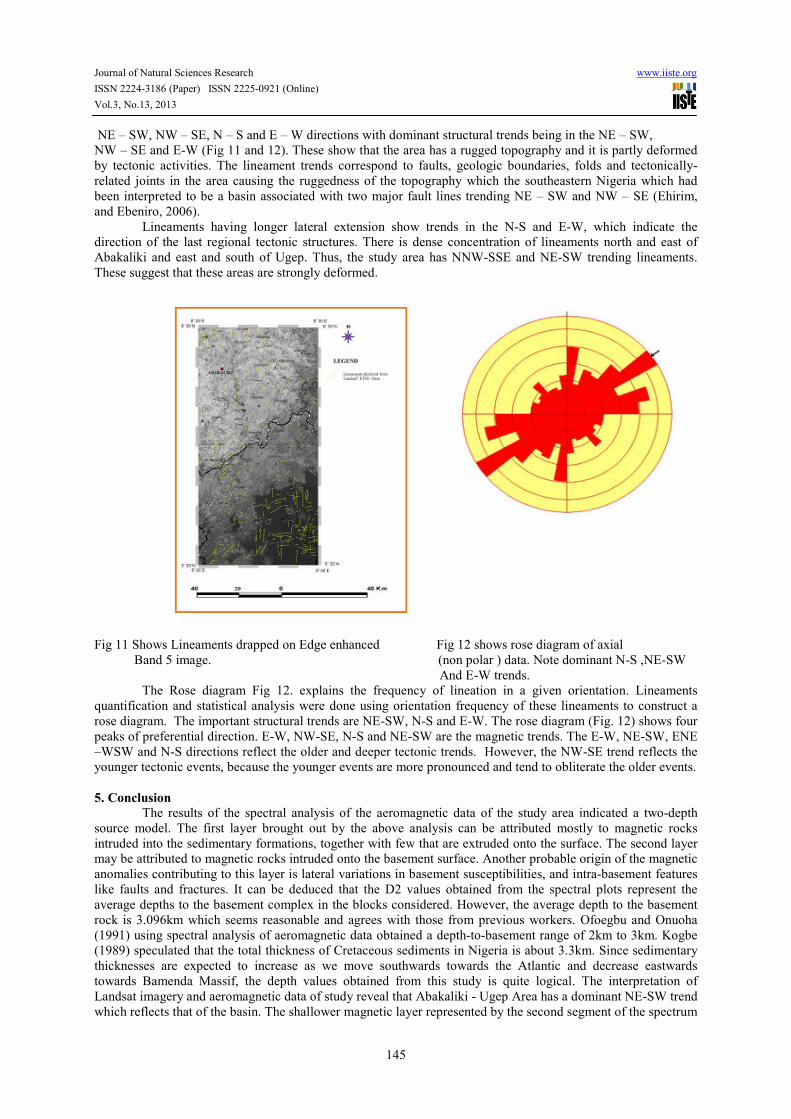
Result of the lineament analysis of the Landsat Imagery revealed a number of lineaments and mega
lineaments over 3km in size trending in the NE – SW, NW – SE, E – W and N – S directions. Surface trend
analysis of the tectonic and structural features of the area show from rose diagram study, structural trends of
Page 9
Journal of Natural Sciences Research www.iiste.org
ISSN 2224-3186 (Paper) ISSN 2225-0921 (Online)
Vol.3, No.13, 2013
145
NE – SW, NW – SE, N – S and E – W directions with dominant structural trends being in the NE – SW,
NW – SE and E-W (Fig 11 and 12). These show that the area has a rugged topography and it is partly deformed
by tectonic activities. The lineament trends correspond to faults, geologic boundaries, folds and tectonically-
related joints in the area causing the ruggedness of the topography which the southeastern Nigeria which had
been interpreted to be a basin associated with two major fault lines trending NE – SW and NW – SE (Ehirim,
and Ebeniro, 2006).
Lineaments having longer lateral extension show trends in the N-S and E-W, which indicate the
direction of the last regional tectonic structures. There is dense concentration of lineaments north and east of
Abakaliki and east and south of Ugep. Thus, the study area has NNW-SSE and NE-SW trending lineaments.
These suggest that these areas are strongly deformed.
Fig 11 Shows Lineaments drapped on Edge enhanced Fig 12 shows rose diagram of axial
Band 5 image. (non polar ) data. Note dominant N-S ,NE-SW
And E-W trends.
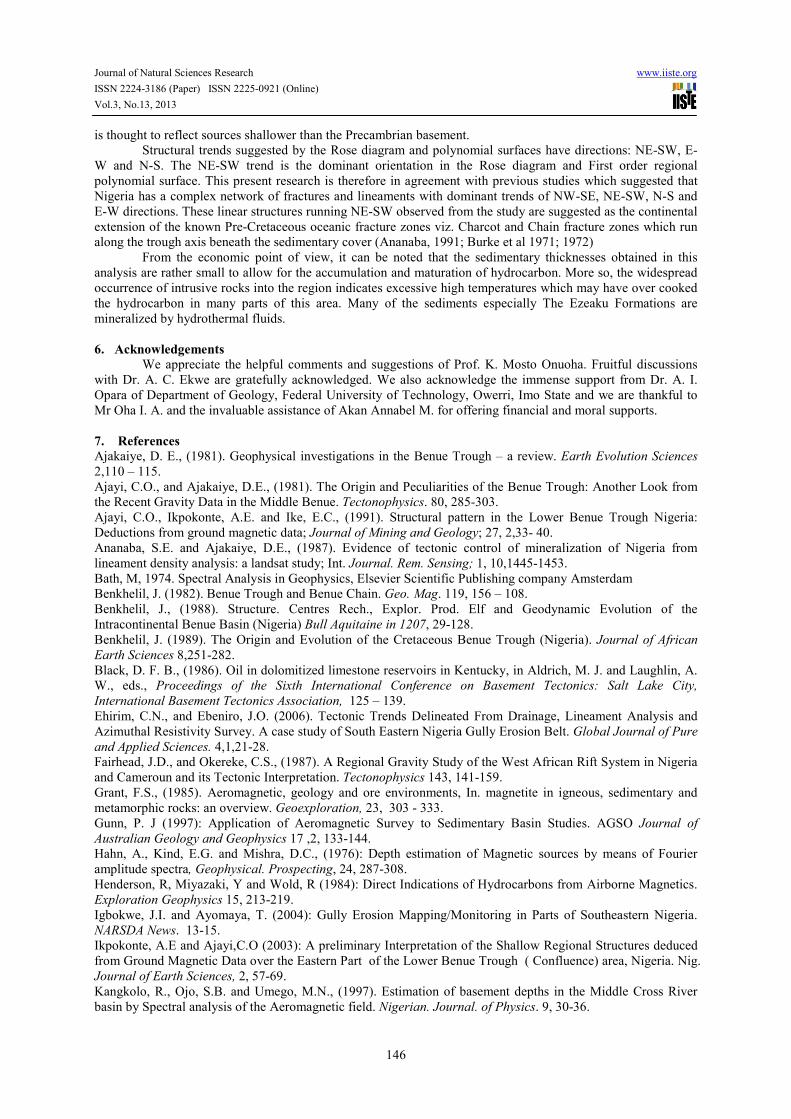
The Rose diagram Fig 12. explains the frequency of lineation in a given orientation. Lineaments
quantification and statistical analysis were done using orientation frequency of these lineaments to construct a
rose diagram. The important structural trends are NE-SW, N-S and E-W. The rose diagram (Fig. 12) shows four
peaks of preferential direction. E-W, NW-SE, N-S and NE-SW are the magnetic trends. The E-W, NE-SW, ENE
–WSW and N-S directions reflect the older and deeper tectonic trends. However, the NW-SE trend reflects the
younger tectonic events, because the younger events are more pronounced and tend to obliterate the older events.
5. Conclusion
The results of the spectral analysis of the aeromagnetic data of the study area indicated a two-depth
source model. The first layer brought out by the above analysis can be attributed mostly to magnetic rocks
intruded into the sedimentary formations, together with few that are extruded onto the surface. The second layer
may be attributed to magnetic rocks intruded onto the basement surface. Another probable origin of the magnetic
anomalies contributing to this layer is lateral variations in basement susceptibilities, and intra-basement features
like faults and fractures. It can be deduced that the D2 values obtained from the spectral plots represent the
average depths to the basement complex in the blocks considered. However, the average depth to the basement
rock is 3.096km which seems reasonable and agrees with those from previous workers. Ofoegbu and Onuoha
(1991) using spectral analysis of aeromagnetic data obtained a depth-to-basement range of 2km to 3km. Kogbe
(1989) speculated that the total thickness of Cretaceous sediments in Nigeria is about 3.3km. Since sedimentary
thicknesses are expected to increase as we move southwards towards the Atlantic and decrease eastwards
towards Bamenda Massif, the depth values obtained from this study is quite logical. The interpretation of
Landsat imagery and aeromagnetic data of study reveal that Abakaliki - Ugep Area has a dominant NE-SW trend
which reflects that of the basin. The shallower magnetic layer represented by the second segment of the spectrum
Page 10
Journal of Natural Sciences Research www.iiste.org
ISSN 2224-3186 (Paper) ISSN 2225-0921 (Online)
Vol.3, No.13, 2013
146
is thought to reflect sources shallower than the Precambrian basement.
Structural trends suggested by the Rose diagram and polynomial surfaces have directions: NE-SW, E-
W and N-S. The NE-SW trend is the dominant orientation in the Rose diagram and First order regional
polynomial surface. This present research is therefore in agreement with previous studies which suggested that
Nigeria has a complex network of fractures and lineaments with dominant trends of NW-SE, NE-SW, N-S and
E-W directions. These linear structures running NE-SW observed from the study are suggested as the continental
extension of the known Pre-Cretaceous oceanic fracture zones viz. Charcot and Chain fracture zones which run
along the trough axis beneath the sedimentary cover (Ananaba, 1991; Burke et al 1971; 1972)
From the economic point of view, it can be noted that the sedimentary thicknesses obtained in this
analysis are rather small to allow for the accumulation and maturation of hydrocarbon. More so, the widespread
occurrence of intrusive rocks into the region indicates excessive high temperatures which may have over cooked
the hydrocarbon in many parts of this area. Many of the sediments especially The Ezeaku Formations are
mineralized by hydrothermal fluids.
6. Acknowledgements
We appreciate the helpful comments and suggestions of Prof. K. Mosto Onuoha. Fruitful discussions
with Dr. A. C. Ekwe are gratefully acknowledged. We also acknowledge the immense support from Dr. A. I.
Opara of Department of Geology, Federal University of Technology, Owerri, Imo State and we are thankful to
Mr Oha I. A. and the invaluable assistance of Akan Annabel M. for offering financial and moral supports.
7. References
Ajakaiye, D. E., (1981). Geophysical investigations in the Benue Trough – a review. Earth Evolution Sciences
2,110 – 115.
Ajayi, C.O., and Ajakaiye, D.E., (1981). The Origin and Peculiarities of the Benue Trough: Another Look from
the Recent Gravity Data in the Middle Benue. Tectonophysics. 80, 285-303.
Ajayi, C.O., Ikpokonte, A.E. and Ike, E.C., (1991). Structural pattern in the Lower Benue Trough Nigeria:
Deductions from ground magnetic data; Journal of Mining and Geology; 27, 2,33- 40.
Ananaba, S.E. and Ajakaiye, D.E., (1987). Evidence of tectonic control of mineralization of Nigeria from
lineament density analysis: a landsat study; Int. Journal. Rem. Sensing; 1, 10,1445-1453.
Bath, M, 1974. Spectral Analysis in Geophysics, Elsevier Scientific Publishing company Amsterdam
Benkhelil, J. (1982). Benue Trough and Benue Chain. Geo. Mag. 119, 156 – 108.
Benkhelil, J., (1988). Structure. Centres Rech., Explor. Prod. Elf and Geodynamic Evolution of the
Intracontinental Benue Basin (Nigeria) Bull Aquitaine in 1207, 29-128.
Benkhelil, J. (1989). The Origin and Evolution of the Cretaceous Benue Trough (Nigeria). Journal of African
Earth Sciences 8,251-282.
Black, D. F. B., (1986). Oil in dolomitized limestone reservoirs in Kentucky, in Aldrich, M. J. and Laughlin, A.
W., eds., Proceedings of the Sixth International Conference on Basement Tectonics: Salt Lake City,
International Basement Tectonics Association, 125 – 139.
Ehirim, C.N., and Ebeniro, J.O. (2006). Tectonic Trends Delineated From Drainage, Lineament Analysis and
Azimuthal Resistivity Survey. A case study of South Eastern Nigeria Gully Erosion Belt. Global Journal of Pure
and Applied Sciences. 4,1,21-28.
Fairhead, J.D., and Okereke, C.S., (1987). A Regional Gravity Study of the West African Rift System in Nigeria
and Cameroun and its Tectonic Interpretation. Tectonophysics 143, 141-159.
Grant, F.S., (1985). Aeromagnetic, geology and ore environments, In. magnetite in igneous, sedimentary and
metamorphic rocks: an overview. Geoexploration, 23, 303 - 333.
Gunn, P. J (1997): Application of Aeromagnetic Survey to Sedimentary Basin Studies. AGSO Journal of
Australian Geology and Geophysics 17 ,2, 133-144.
Hahn, A., Kind, E.G. and Mishra, D.C., (1976): Depth estimation of Magnetic sources by means of Fourier
amplitude spectra, Geophysical. Prospecting, 24, 287-308.
Henderson, R, Miyazaki, Y and Wold, R (1984): Direct Indications of Hydrocarbons from Airborne Magnetics.
Exploration Geophysics 15, 213-219.
Igbokwe, J.I. and Ayomaya, T. (2004): Gully Erosion Mapping/Monitoring in Parts of Southeastern Nigeria.
NARSDA News. 13-15.
Ikpokonte, A.E and Ajayi,C.O (2003): A preliminary Interpretation of the Shallow Regional Structures deduced
from Ground Magnetic Data over the Eastern Part of the Lower Benue Trough ( Confluence) area, Nigeria. Nig.
Journal of Earth Sciences, 2, 57-69.
Kangkolo, R., Ojo, S.B. and Umego, M.N., (1997). Estimation of basement depths in the Middle Cross River
basin by Spectral analysis of the Aeromagnetic field. Nigerian. Journal. of Physics. 9, 30-36.
Page 11
Journal of Natural Sciences Research www.iiste.org
ISSN 2224-3186 (Paper) ISSN 2225-0921 (Online)
Vol.3, No.13, 2013
147
Kogbe, C., A. (1981b) Geological Interpretation of Landsat Imageries of Part of Central Nigeria. Journal Mining
and Geology 18, 66 – 69.
Konecny , G. (1987). Development and State of the Arts of remote sensing in Remote Sensing for Resource
Development and Environment Management ( Damen, M.C.J, Smit S.G and Vertappen H.TH, Balkema,
Rotterdam eds.), 3, 969 - 972.
Mamah, L. I., Ezepue, M. C. and Ezeigbo, H. I. (2000) Integration of Geology and geophysics in Mineral
Exploration in the Benue Trough, Nigeria. The Onuahia Lead – Zinc deposit. A Case Study Global Journal of
Pure and Applied Sciences 6,2, 255 – 262.
Milligan, P. R. and Guun, P. J. (1997) Enhancement and presentation of airborne geophysical data, AGSO
Journal of Australian Geology & Geophysics,17, 2, 63 – 76.
Mishra, D. C. and Naidu, P. S. (1974) Two – dimensional power spectrum and analysis of aeromagnetic fields.
Geophysical Prospecting. 22, 345-353
Murat, R.C. (1972). Stratigraphy and Paleogeography of the Cretaceous and Lower Tertiary in Southern Nigeria.
In African geology ( Dessauvagie, T.F.J and Whiteman, A.J, eds.), 251-266. Ibadan University Press, Ibadan,
Nigeria.
Naudy, H. and Dreyer, H., 1968. Non – linear filtering applied to aeromagnetic profiles. Geophysical
Prospecting, 16,2, 171 - 178
Nettleton, L. L., (1971) Elementary Gravity and Magnetics for Geologists and Seismologists: Society of
Exploration Geophysicists Monograph Series 1, 83 -87.
Njoku, C.O., (1985). Geophysical Investigation of the Ndi-Akparanta Area of the Abakaliki Anticline.
Unpublished MSc Thesis University of Nigeria, Nsukka
NUR, A., (2000) Analysis of aeromagnetic data over the Benue Trough, Nigeria. Journal of Mining and Geology
36,1, 77 – 84.
Nwachukwu S. O., (1972) The tectonic evolution of the southern portion of the Benue Trough. Geological.
Magazine. 109, 5, 411 – 419.
Nwachukwu, S. O. (1975) Temperatures of formation of vein minerals in the southern portion of the Benue
Trough, Nigeria J Mining Geol. 11, 45-54
O’Leary, D.W., Friedman, J.D., and Phn, H.A., (1976). Lineament, Linear, Lineation: Some proposed new
standard for old terms. Geol. Soc. Amer. Bull., 87 ,463-1469.
Obi, D. A., Okereke C. S., Obei B. C. and George A. M., (2009). Aeromagnetic Modeling of Subsurface
Intrusives and its Implication on Hydrocarbon Evaluation of the Lower Benue Trough, Nigeria. European
Journal of Scientific Research. 47,3, 347 -361.
Odegard, M.E., and Berg, J.W., (1965). Gravity interpretation using the Fourier integral, Geophysics, XXX, 3,
424-38.
Odeyemi, I.B., (1993). A comparative study of remote sensing images of structure of the Okemesi fold belt,
Nigeria. ITC Journ. 1,77-83
Ofoegbu C. O. and Onuoha, K. M. (1991). Analysis of Magnetic data over the Abakaliki Anticlinorium of
the Lower Benue Trough, Nigeria Journal of Marine Geology. 45 – 51.
Ofoegbu, C. O. (1984). Interpretation of magnetic anomalies over the Lower and Middle BenueTrough of
Nigeria. Geophysical Journal Royal Astronomical Society 79, 813 – 823.
Ofoegbu, C. O. and Onuoha, K. M. (1990). A review of geophysical investigations in the Benue Trough. In: The
Benue Trough, Structure and Evolution (Edited by Ofoegbu, C. O.), 171 -201. Vieweg and Sohn, Braunschweig,
Germany.
Ofoegbu, C. O., (1985a). A review of the geology of the Benue Trough of Nigeria. Journal of African. Earth
Science. 3, 285 – 291.
Ofoegbu, C. O., (1985b). Interpretation of an aeromagnetic profile across the Benue Trough of Nigeria. Journal
of African Earth Science, 3, 293 – 296.
Ofoegbu, C. O., (1985c). Long wavelength anomalies and the crustal structure underneath the Benue Trough
and surrounding regions. Nigerian Journal of Mining and Geology, 22, 45 – 50.
Ofoegbu, C. O., (1988). An Aeromagnetic Study of Part of the Upper Benue Trough, Nigeria. Journal of
African. Earth Science. 7, 77- 90.
Okereke, C.N., and Ananaba, S.E., (2006). Deep crustal Lineament inferred from aeromagnetic anomalies over
the Niger Delta, Nigeria. Journal of Mining and Geol., 42, 127-131.
Olade, M. A. (1979). The Abakaliki pyroclastics of southern Benue, Nigeria: their petrology and tectonic
significance. Journal Mining and Geology 16, 17 – 25.
Olade, M. A., (1975). Evolution of Nigeria’s Benue Trough (Aulacogen); a tectonic model. Geological
Magazine. 112, 575 – 583.
Onwuemesi, A. G., (1995). Interpretation of magnetic anomalies from the Anambra Basin of Southeastern
Page 12
Journal of Natural Sciences Research www.iiste.org
ISSN 2224-3186 (Paper) ISSN 2225-0921 (Online)
Vol.3, No.13, 2013
148
Nigeria. Unpublished Ph.D Thesis, Nnamdi Azikiwe University, Awka, Nigeria.
Onyedim, G.C and Awoyemi, E.A (2006): Aeromagnetic Imaging of the Basement Morphology in the part of
the middle Benue Trough. Journal of mining and Geology. 42, 2, 157-163.
Petters, S.W. (1978). Stratigraphic evolution of the Benue Trough and its implication for the lower Cretaceous
paleogeography of West Africa. Journal of Geology, 86, 312 – 32
Raina, B.N (1980), Landsat Exploration of Himalayan and Peninsular Regions (Remote sensing and Mineral
Exploration) – Progress Report of Workdone in India, IGCP Project 143), in Advances in Space Exploration vol.
10 Remote sensing and Mineral Exploration, edited by Carter W.D Rowan, L.C and Huntington, J.F, Pergamon
Press Paris, 59-78.
Reeves, C. V., (1992). New horizons in airborne geophysical mapping, Exploration Geophysics, 23, 273 – 280.
Reeves, C. V., (2001). The role of airborne geophysical reconnaissance in exploration geosciences. First Break,
19,9, 501- 508.
Reeves, C., (2005). Aeromagnetic Survey: Principles, Practice and Interpretation
Reyment, R.A., (1965). Aspects of Geology of Nigeria, Ibadan University Press, Ibadan Nigeria.106
Reynolds, R.L., Rosenbaum, J.G., Hudson, M.R., and Fishman, N.S., (1990). Rock magnetism, the distribution
of magnetic minerals in the Earth’s crust, and aeromagnetic anomalies: U. S. Geological Survey Bulletin 1924,
24-45 .
Rothery, D.A., (1987). Improved discrimination of rock units using LANDSAT Thematic Mapper Imagery of
the Oman ophiolite. Journal. Of the Geological. Society. 144, 587-597.
Schetselaar, E. M., Chung, C. F., Kim, K. E., (2000). Integration of Landsat TM, Gamma Ray, Magnetic and
Field Data to discriminate Lithological Units in Vegetated Granite – Gneiss Terrain. Remote Sensing of the
Environment, 71, 89 – 105.
Sharma, P.V., (1987). Magnetic Method Applied to Mineral Exploration. Ore Geology. Review. 2, 323-357
Short, K.C., and Stauble, A.J., (1967) Outline geology of the Niger Delta. American. Association. Petroleum.
Geology. Bulletin. 51, 761-779.
Spector, A., (1968). Spectral analysis of aeromagnetic data. Unpublished PhD Thesis, University of Toronto,
Canada
Spector, A. and Grant, F.S.(1970). Statistical models for interpreting aeromagnetic data; Geophysics, 35, 293-
302.
Telford, W. M., L.P. Geldart and R.E. Sheriff, (1998). Applied Geophysics, (2nd
Ed), Cambridge University Press,
USA, 113 – 114.
Townshend, J.R.G. & Tucker, C.J. (1984). Objective assessment of advanced very high resolution radiometer
data for land cover mapping. International Journal of Remote Sensing 5,2, 987-1009
Townshend, J.R.G., Goff, T.E. & Tucker, C.J. (1984). Multitemporal dimensionality of images of the
normalized difference vegetation index at continental scales. Submitted to Trans. IEEE, Geosciences and Remote
Sensing.
Ukaegbu, V.U and Akpabio, I. O (2009): Geology and Stratigraphy of the Middle Cretaceous Sequences
Northeast of Afikpo Basin, Lower Benue Trough, Nigeria. The Pacific Journal of science and technology. 10, 1,
518-527.
Uzuakpunwa, A.B., (1974). The Abakaliki pyroclastics-eastern Nigeria: New age and tectonic implications,
Geological Magazine III, 65-70.
Wenmenga, U., (2005). Landsat and Aeromagnetic interpretation of the structural features of the
Palaeoproterozoic Basement of Boussouma area, Burkina Faso. Journal of Mining & Geology. 4,1, 33 – 40.
Whiteman, A. (1982). Nigeria: Its Petroleum Geology, Resources and Potentials. 1 & 2, Graham and Trotham
Limited: London, UK.
Zaborski, P. M., (1998). A review of the Cretaceous System in Nigeria, African Geosciences Review, . 5, 4, 385
– 483.
First Author: Mr. Good Hope Anyanwu (BSc. Geology FUTO ’03, MSc Applied geophysics UNN ’13)
His interest is to apply his currently acquired knowledge to the betterment of mankind.
Second Author: Dr. Luke I Mamah ( BSc Geology,UNN, ’75: MSc Geophysical Engineering,CSM,’79:
PhD,GeophysicCSM,’81), born in Nigeria but had higher education in Colorado School of Mines in Golden
USA. He is a member of American Geophysical Union. Currently he is a Senior lecturer at University of Nigeria
Nsukka with exploration Geophysics as the major interest.
Page 13
This academic article was published by The International Institute for Science,
Technology and Education (IISTE). The IISTE is a pioneer in the Open Access
Publishing service based in the U.S. and Europe. The aim of the institute is
Accelerating Global Knowledge Sharing.
More information about the publisher can be found in the IISTE’s homepage:
http://www.iiste.org
CALL FOR JOURNAL PAPERS
The IISTE is currently hosting more than 30 peer-reviewed academic journals and
collaborating with academic institutions around the world. There’s no deadline for
submission. Prospective authors of IISTE journals can find the submission
instruction on the following page: http://www.iiste.org/journals/ The IISTE
editorial team promises to the review and publish all the qualified submissions in a
fast manner. All the journals articles are available online to the readers all over the
world without financial, legal, or technical barriers other than those inseparable from
gaining access to the internet itself. Printed version of the journals is also available
upon request of readers and authors.
MORE RESOURCES
Book publication information: http://www.iiste.org/book/
Recent conferences: http://www.iiste.org/conference/
IISTE Knowledge Sharing Partners
EBSCO, Index Copernicus, Ulrich's Periodicals Directory, JournalTOCS, PKP Open
Archives Harvester, Bielefeld Academic Search Engine, Elektronische
Zeitschriftenbibliothek EZB, Open J-Gate, OCLC WorldCat, Universe Digtial
Library , NewJour, Google Scholar