Structural Investigations of Sol-gel Glasses Using Optical Probes
Submitted for the Degree of Master of Science
Presented to Dublin City University
by
Gerard Joseph Ennis, B.Sc. School of Physical Sciences
Dublin City University
Research Supervisor Dr. Colette Mc Donagh, B.Sc., Ph.D.
Abstract
The optical spectroscopy of the europium ion has been used as a probe of the structural
changes occurring as a function of processing temperature in sol-gel derived glasses The
fluorescence and fluorescence decay times of the EuJ' ion were observed and changes in
the emission spectra and decay measurements were interpreted in terms of the changes
taking place within the sol-gel matrix Measurements of the fluorescence decay time
indicate abnormally short lifetime measurements for sol-gel derived glasses even at
relatively high fabrication temperatures This was construed as being due to residual OH
groups remaining in the glass structure Measurements also indicated the presence of a fast
lifetime component superimposed upon the slower decay of the Eu1* ion This was
interpreted as concentration quenching because of rapid energy transfer within clusters of
the dopant europium ion
Acknowledgements
It is a pleasure to thank Dr Colette Mr Donagh for all her help and encouragement over
the last two years I would also like to thank my fellow postgraduates Kevin Mellon,
Kevm Devlin, Kevin Mc Guigan^Pauhne Marron, Brian Hurley, Jim Campion, Mark and
Siobhan Daly, Charles Markham, Liam Roberts, Simon M' Cabe, Kieran Higgms and
Brian Cummins who all made contributions in various shapes and forms to this report and
provided many a laugh along the way
I would also like to thank Brendan O Kelly at Trinity College Dublm for preparing the
sol-gel samples and Dr John M' Gilp and his research group at T C D for allowing me
access to his laboratory for lifetime measurements and especially Z R Tang who stayed
many a late night to help me complete them
I am deeply indebted to Dr Martin Henry for both his encouragement and the facilities he
extended me in the production of this thesis, and to Man an and Barbara who let me at
their printer I would also like to acknowledge the Co Kildare Vocational Education
Committee for their financial support Finally to my housemates, this report may be
finished, but without your help and encouragement it might ne\er have been, Thanks.
11
Table of Contents
Acknowledgements 11
Declaration
Table of Figures vi
Chapter 1 Conventional Glasses and Sol-gel Glasses
I 0 Introduction 1I I Conventional Glass and Sol-gel glass 112 The Glassy or Vitreous State 21 3 Structural Characteristics of Glass 414 Sol-gel Derived Glasses 41 5 Methods of Sol-gel Glass Production 61 6 Conclusion 8
Chapter 2 Review of Rare Earth Ions As Fluorescent Probes
2 0 Introduction 92 1 Fluorescence and Fluorescence Decay 922 Optically Active Ions 102 3 The Interaction of Light with Optically Active Ions 112 4 Transition Probabilities 1223 Radiative and Non Radiative Transitions 142 6 The Nature of Europium Fluorescence 142 7 Conclusion 18
Chapter 3 The Experimental Systems
3 0 Introduction 193 1 Fluorescence Measurements 1932 Fluorescence Data Acquisition 193 3 Tune Resolved Fluorescence Data Acquisition 203 4 Lifetime Measurements 213 5 The Nitrogen Laser 213 6 The SR400 SRS Gated Photon Counter 213 7 Lifetime Data Acquisition 223 8 Lifetime Data Analysis 243 9 Relationship Between Mean and Half Life 243 10 Multi Component Decays and Component Stripping 263 11 Data Analysis Program for Methods 1 and 2 293 12 Synthesis of the Samples Studied in this Report 31313 Conclusion 33
Chapter 4 Eu3+ Fluorescence and Decay Measurements as a Function of Sol pH inSol-gel Glasses
4 0 Introduction 3441 Materials Preparation as a Function of pH 34
rv
Abstract 1
4 2 Acid and Base Catalysis of Sol-gels 354 3 Fluorescencc Studies of Base Catalysed Samples (pH=5 6) 354 4 Fluorescence Studies of Base Catalysed Samples (pH=8) 384 5 Lifetime studies for Sol-gels at pH=5 6 and pH=8 384 6 Structural Implications 414 7 Studies of Deuterated Sample set (Sample Set No 3) 444 8 Conclusion 46
Chapter 5 The Fluorescence Properties of the Eu3< ion in sol-gel glass as a Function of Water:TEOS Ratio
5 0 Introduction 475 1 Variation of H20 TEOS Ratios 4752 Acid Catalysed Samples 475 3 Base Catalysed Samples 485 4 Conclusion 50
Chapter 6 Investigations of AJuminium-Europium Codoped Samples
6 0 Introduction 536 1 Rare Earth Doping of Conventional and Sol-gel Glasses 536 2 Neodymium Doped Glasses 546 3 Results and Discussion of Experiments on Aluminium Codoped Samples 546 4 Conclusion 63
Chapter 7 Soaking of Sol-gel Samples in a Europium Nitrate Solution
7 0 Introduction 647 1 Soaked Samples 6412 Results and Discussion 647 3 Deuteration of the Sol-gel Pores 707 4 Conclusion 71
Concluding Remarks 72
References 74
Appendix 1 Programme Listing "Aver2"
Appendix 2 Programme Listing "Lifet"
Appendix 3 Programme Listing "Compstw"
Appendix 4 Programme Listing "Half of 84"
Appendix 5 Absorption of Eu3* in a Glass and a liqu id
v
Table of Figures
Chapter 1
1 1 Atomic Distribution Comparison for Various Materials 212 Temperature-Volume Diagram for Glass 31 3 Structural Differences m Silica Based Materials 51 4 Hydrolysis and Condensation in the Sol gel "
Chapter 2
2 1 The Excitation and Emission Process 1022 Radiative and Non-radiative Processes between Two Energy Levels 152 3 Energy Levels of Europium 162 4 Emission Spectra of Eu1* in Three Glass Types 17
Chapter 3
3 1 The Fluorescence Measurement System 2032 The Operating Principle of Time Resolved Photon Counting 233 3 The Lifetime Measuring System 253 4 Multi-Component Decay Curve Analysis 273.5 Triggering Problems in Lifetime Data Acquisition 30
Chapter 4
4 1 Fluorescence Spectra of Sample Set No 1 . 374.2 Fluorescence Spectra of Sample Set No2 394 3 Hydrolysis and Condensation as a function of pH.„ 424 4 Fluorescence Spectra of Acid Catalysed Samples.« 434.5 Fluorescence spectra of Deuterated Samples 45
Chapter 5
5 1 Fluorescence Spectra of Acid Catalysed 200° Samples 4952 Fluorescence Spectra of Base Catalysed 200° Samples 51
Chapter 6 '
6 1 Fluorescence spectra of 1 0% Aluminium Containing Samples 5762 Fluorescence Spectra of 05% Aluminium Containing Samples 586 3 Fluorescence Spectra of 0 0% Aluminium Containing Samples 596 4 Lifetime Measurements for 0 5% Aluminium Sample 616 5 Lifetime Measurements for 0 0% Aluminium Sample 62
Chapter 7
7 1 Fluorescence Spectra for Various Soaked Samples _ 6672 Fluorescence Spectra for Conventionally Doped Sol-gel Glasses 677.3 Fluorescence Spectrum of a Europium Nitrate Solution 68
VI
Chapter 1
Conventional Glasses and Sol-gel Glasses
1.0 IntroductionThe purpose of Chapter 1 is to provide the reader with a general introduction to the science
and technology of glass and to the characteristics of sol-gel glasses This chapter commences
with an introduction to conventional glasses and their qualities
1.1 Conventional Glass and Sol-gel Glass
Glass science and technology is probably one of mans oldest attempts at cultivating what is
both an art and a science American Plains Indians used obsidian, a silicate glass formed by
volcanic activity, as a cutting tool which they chipped into knives The technique of blowing
air into a gob of molten glass refined the process of glassworking to produce some of the
finest examples of decorative glass seen These techniques invented hundreds of years ago are
still in use today in the production of fine crystal for decorative purposes
The raw materials for glass manufacture are still, as they were thousands of years ago, sand
and limestone There are hundreds of different recipes for making glass each one specific to
the type of application that the glass is for The starting mixture is ground together along with
20 to 30 % of waste glass and this mixture is melted in tank furnaces in temperatures of up
to 1500°C Special scientific glass is made from the addition of special compounds to the
above mixture or can be made from completely different starting materials, eg borate glasses
At this point the temperature is lowered to around 1000°C and the discoloration of the glass
melt is removed by the addition of various metal oxides such as antimony or manganese
Depending on the composition the thick viscous melted glass is formed to the required shapes
by casting, rolling or drawing
Chapter 1 Page 1
1.2 The Glassy or Vitreous State and its PropertiesGlasses are defined by a collection of parameters that describe what each type of glass
particularly resembles, le X-ray studies show that a glassy substance has no long range order
of its atomic structure It can be seen m Figure 1 1 that the distribution pattern of atoms in
a glass has a strong resemblance to that of a liquid but specifically not to that of a crystalline
r
Figure 1.1 Atomic Distribution Comparisons for Various Materials
type of environment When the contents of a glass melt start to cool its specific volume starts
to decrease When the melting point is reached a normal liquid will give up its heat of fusion
and turn into the crystalline state This does not happen to a glass melt unless the cooling rate
of the melt is slow enough The characteristic temperature volume curve of glass is of the
general form shown in figure 1 2, le, A to B to E
If the cooling rate is fast then crystallization does not take place at the freezing temperature,
T„ but the volume decreases as the temperature is lowered, this is what is known as
Chapter 1 Page 2
Figure 1.2 Temperature-Volume Diagram for Glass
supercooling At the point E, the glass transition temperature the volume expansion curve
undergoes a change of slope It is at temperatures below T, that the material is said to be a
glass or in a vitreous state The point E on the graph does not have an exact position as it
depends on the rate of cooling It is also found that if a temperature,, known as the
maintenance temperature, is kept fixed then the volume of glass decreases with time
Eventually it reaches a certain equilibrium volume This phenomenon is called stabilization
At room temperature the time required for stabilization is close to infinity At ordinary
temperatures therefore glass structure shows no change with time.
To sum up this description of glassy properties, glass can be defined as a supercooled liquid
which is maintained at a temperature below it’s melting point so that no devitrification occurs
Chapter ] Pace 5
1.3 Structural Characteristics of Glass
Figure 1 3 shows how glass type structures can differ The structure of a silica glass is
compared to that of crystalline quartz The structure is very simihar m that both materials
consist of SiOj tetrahedra, but in crystalline quartz, Figure 1 3(a), the bond angles are regular
forming a hexagonal structure In silica glass, Figure 1 3(b) however the bond angles are not
constant and an irregular network structure is formed Modifier ions disrupt the silicon
network, Figure 1 3(c), and occupy holes so formed within the network This is illustrated in
Figure 1 3
In order to quantify the types and characteristics of the glass forming materials Zachanasan,
[1], formulated a set of rules for the structure of oxide glasses He proposed that such glasses
would have
1 An oxygen ion co-ordination number of 3 or 4 for the amons forming the
structure
2 An irregular 3-D network formed by these triangular or tetrahedral
structural units with the comer oxygen ions as shared points
Although there are other theories of glass structure, including some which propose some short
range order, Zachanasan’s theory is one of the widest held
1.4 Sol-gel Derived GlassesSol-gel glasses offer many interesting advantages over conventional high temperature glasses.
Perhaps the most striking of these is that a glass can be manufactured from what is initially
a liquid precursor at room temperature This negates the requirement for a high temperature
processing system as the sol-gel glass need only be densified at relatively low temperatures.
The method of sol-gel glass production means that the sol can be used to spin form thin glass
films and coat optical fibres These techniques have found current application m the
fabrication of optical devices as chemical sensors and protective coatings, [2] [3] Another
advantage of the nature of the sol-gel process is the ease with which relatively large amounts
of structure modifying ions can be added to the sol, [4] [5], this results m the production of
glasses with high enough dopant concentration to be considered as possible glass laser
materials However the major advantage of the sol-gel system is that it produces a more
homogeneous glass than possible by conventional means There are however some
disadvantages to the sol-gel method for producing glass Among these are that the sol-gel
Chapter 1 Page 4
glass undergoes large scale shrinkage dunng drying and densification, as discussed in Section
1 5, and the production of monolithic pieces of sol-gel glass is non-tnvial requiring careful
drying and chemical controls, [6]
1.5 Methods of Sol-gel Glass Production
There are m general three methods of sol gel glass production These methods are,
(1) Gelation of a solution of colloidal powders
(2) Hydrolysis and polycondensation of alkoxide precursor followed by
hypercritical drying of the gels
(3) Hydrolysis and polycondensation of an alkoxide precursor followed by ageing
and drying under ambient pressure
In this report all the sol-gel samples produced were manufactured by method 3 A silica gel
may be formed by network growth from simultaneous hydrolysis and polycondensation of an
organometallic precursor Such a precursor is Tetraethylorthosilicate also known as TEOS
What happens is that a liquid alkoxide precursor, (TEOS) or in general any Si (OR),, where the
R can be CH3, C2H5, C3H7, is hydrolysed by mixing it with water,
The hydrolysed Si tetrahedra interact in a condensation reaction forming Si-O-Si bonds
Linking of additional =Si-OH tetrahedra occurs as a polycondensation reaction and eventually
results in an Si02 network This process is illustrated in Figure 1 4
The H20 and alcohol expelled by the reaction mechanism will eventually remain in the pores
of the network now in place, until partial densification at moderate temperature and further
densification at higher temperature removes the bulk of the hydrocarbon and O-H groups As
the silica network begins to link together the low viscosity fluid slowly changes until at the
gelation there is a sudden increase in the viscosity and the solution takes on the shape of
whatever mould it was poured into At this stage of the process the samples used in this
process were dried and variously fired at different temperatures The term gel is often used
to describe the solidified solution regardless of the following processing steps, but there is a
difference If the pore liquid, H20 and alcohol, is removed at ambient pressure by
evaporation, ie drying, the resultant dried gel is known as an xerogel If the pore liquid is
removed as a gas from the pore network under hypercritical drying conditions the remaining
network is known as an aerogel
The surface area of a dried gel is 100’s m2 per gramme A dried gel still contains large
concentrations of OH' radicals chemisorbed onto the surface of the pore walls Further heat
Chapter 1 Page 6
OCjHj OHI I
HjC20 - S i - 0 C 2HJ + 4(HjO) — ► HO —Si—OH «
OC2H, OH
TEOS + 4(HjO) — ► Si(OH)4 + 4(0,^011)
Condensation
Hydrolysis
OH OH OH OHI I I I
H O -S i— OH + HO — Si— OH — * HO - Si— O - S i-O HI • I I IOH OH OH OH
Polycondensatioo
OH OHI I
H O - S i - O - S i - O H + 6Si(OH)4 _ ►I I
OH OH
OH OHI I
H O - S i- O H H O - S i - O HI I
OH O O OH
1 1 ^ 1 1H O - S i - O - S i------- O ------ S i - O - S i - OHI I I IOH O O OH
I IH O - S i- O H H O - S i - O H
I IOH OH
Figure 1.4 Hydrolysis and Condensation in the Sol Gel
4(CjHjOH)
+ h 2o
+ 601,0)
Chapter 1 Page 7
treatment is required to remove these groups The effect of remaining radical groups in the
gel and partially densified structure is discussed m detail m Chapter 4 Heat treatment at high
temperatures reduces the number of pores and their connectivity due to viscous phase
sintermg This is known as densitiC3tion and as it progresses the volume of the structure
decreases and its density increases The porous gel is transformed into a dense glass when all
the pores have been removed The densification temperature depends considerably on
(A) The dimensions of the pore network and the connectivity of the pores
(B) The surface area of the structure
Densification temperatures of the order of 1200-1500°C have been reported, with temperatures
as low as 1000°C for samples produced by method 3. Silica glass produced by densification
of porous silica gel is amorphous and nearly equivalent in structure and density to vitreous
silica made by fusing quartz crystals or sintering of Si02 powders made by chemical vapour
deposition (CVD) of SiCl4
. 1.6 Conclusion
This chapter has reviewed the characteristics of glassy media in general and the characteristics
of sol-gel derived glasses in particular. Attention was drawn to the process of evolution of
the glassy state in sol-gel materials.
Chapter 1 Page 8
Chapter 2
Review Of Rare-Earth Ions As Fluorescent Probes
2.0 Introduction
This chapter discusses the behaviour of optically active ions in glasses and glassy type
materials In order to understand the behaviour of these dopant ions it is necessary to have
an understanding of some of the mechanisms of excitation, energy transfer and excited state
decay that can occur in these doped insulating materials The chapter commences with a
discussion of the interaction of radiation with optically active materials and discusses
absorption, luminescence and energy transfer Next it examines the nature of europium
fluorescence. Europium has been widely used as a structural probe of both crystalline and
glassy environments, [1] In this chapter the nature of the fluorescence emitted by the
europium ion and the importance of the various transitions is discussed in terms of the
environment experienced by the europium ion This chapter also reviews phenomena reported
by others and discusses their relevance with respect to similar results reported in Chapter 4.
2.1 Fluorescence and Fluorescence Decay
Research into optically active materials is fuelled by interest and need for optical devices such
as lasers led’s detectors etc at all the visible and industrial invisible wavelengths such as the
near IR and the near U V Research into optically active glasses is motivated by interest in
such areas as fluorescent displays but more particularly by interest in glass lasers
In order to understand the processes and terms discussed in this and later chapters it is
important to firstly outline some of the phenomena associated with the interaction of optical
radiation with an optically active material Central to this discussion is the subject of
fluorescence Fluorescence involves the loss of energy radiatively as a species goes from a
higher state to a lower energy state There are several methods of exciting a species to a
higher energy level Photoluminescence is energy decay due to excitation by optical radiation.
Other types of fluorescence are for example Electroluminescence a technology driven by the
need for flat panel displays and Chemiluminescence an important source of study for
chemists The concept of luminescence is illustrated in Figure 2 1
Chapter 2 Page 9
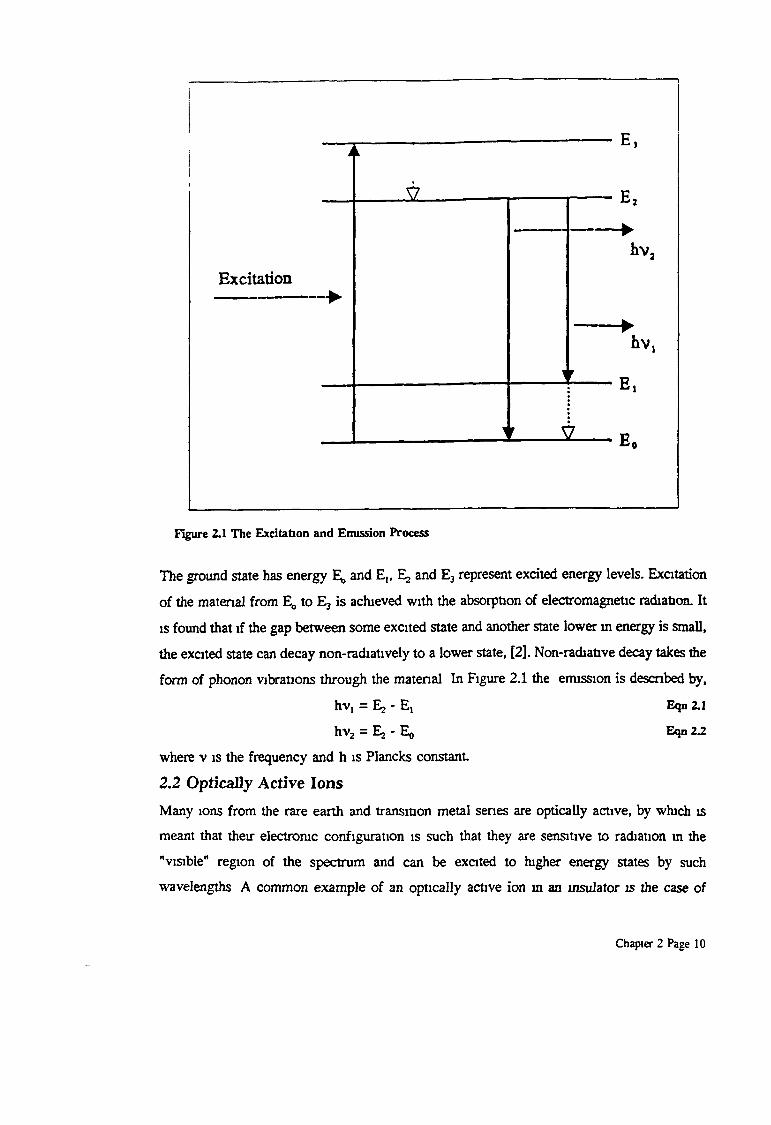
Figure 2.1 The Excitation and Emission Process
The ground state has energy E*, and E,, E2 and E3 represent excited energy levels. Excitation
of the material from E0 to E3 is achieved with the absorption of electromagnetic radiation. It
is found that if the gap between some excited state and another state lower in energy is small,
the excited state can decay non-radiatively to a lower state, [2]. Non-radiative decay takes the
form of phonon vibrations through the material In Figure 2.1 the emission is described by,
hv, = Ej - E, Eqn 2.1
hv2 = Ej - Eo Eqn 22
where v is the frequency and h is Plancks constant.
2.2 Optically Active Ions
Many ions from the rare earth and transition metal senes are optically active, by which is
meant that their electronic configuration is such that they are sensitive to radiation in the
"visible" region of the spectrum and can be excited to higher energy states by such
wavelengths A common example of an optically active ion in an insulator is the case of
Chapter 2 Page 10
Ruby, [2] This material is AUO , (Aluminium Oxide), doped with a few percent of Cr* ions
The deep red is a result of the chromium having strong absorption in the blue and green
Ruby can also be pink and varying shades of red which is actually the effect of the varying
concentrations of Cr3+ ions The subject of dopant concentration is very important and will
be discussed in detail later Chromium, (as Cr3*), in glass gives the glass a green colour,
which indicates that the environment of the host matrix plays a large role in determining the
emission characteristics of the dopant ion The corollary of this is that if a deliberate doping
of a glass with an optically active ion takes place then it should be possible to infer some
sort of qualitative/quantitative information about the structure of the ions environment by
examination of the optical properties of the activated ion.
The investigations on the optical characteristics of glasses reported in this study used
Europium as an optical probe Europium is a Rare Earth element or Lanthanide which occurs
near the bottom of the Periodic Table All these elements have unfilled 4f orbitals, which
gradually fill up as the list of elements is crossed. The general form of their electronic
configuration being denoted as
Is2 2s2 2p6 3s2 3p6 3d10 4s2 4s2 4p# 4d10 4f" 5s2 5p6 5dra 6s2, Eqn 23
Their Atomic Numbers range from 58 for Cerium to 70 for Ytterbium The number of
electrons in the unfilled 4f shell vanes from 1 to 13, while for Europium the number is 6 The
electronic configuration of the triply ionised Europium ion is,
Is2 2s2 2p6 3s2 3p6 3d10 4s2 4p6 4d10 5s2 5p6 4f* Eqn 2.4
2.3 The Interaction of Light with Optically Active Ions
When an optically active ion is placed in a solid, the manner in which it interacts with visible
radiation is governed by what the initial and final energy states of the ion will be and how
strongly the ion interacts with the radiation One of the commonest interactions is the process
of absorption Optical absorption occurs when an electron is optically excited from the ground
state i to an excited state / If a flux of photons N is incident upon an active medium of
thickness d then, [3],
— = -N k Eqn 2.5fix
where k is the probability of absorption of a photon per meter and d is measured along the
Chapter 2 Page 11
x axis From the above then it can be seen that
Eqn 2 6
or in it’s more usual form,
Nd = Nc exp(-kd ) Eqn 2.7
The intensity of the light I0 is proportional to N0 so therefore
k is called the absorption coefficient and varies with frequency of radiation, (to), so finally,
The excitation from one state to another is however not random or straightforward and is
discussed in terms of transition probabilities
2.4 Transition Probabilities
Visible radiation can interact with an activator ion in a number of different ways Two of the
principal processes are
1 The Electric Dipole Process
2 The Magnetic Dipole Process,
Both of these interaction processes are characterised by transition probabilities If i is the
initial state of a system before light is absorbed and f is the final state of the system after
absorption, then the transition probability is, [4],
/¿(u) = /„(«) exp(-kd ) Eqn 2.9
Eqn 2.10
Chapter 2 Page 12
where V(l is the matrix element of the transition and V is a Hamiltonian operator denoting the
interaction energy of the transition between the ion and incident optical radiation For an
electnc dipole transition, V=p.E, where p is the electric dipole moment of the transition and
E is the electnc field intensity ot the incident radiation The value of p the electnc dipole
moment is, [4],
p = £ e rt Eqn 2 11I
Where e is the electronic charge and the summation is over all the optically active electrons
For a magnetic dipole transition, the interaction term is V=n-B, where |i is the magnetic
dipole operator and B is the magnetic field strength of the radiation field The value of |a is
given by, [4],
v = E t - + 2 s < > E q n 2 1 2I 2/71
where 1, and s-, are the orbital and spin angular momentum operators respectively. The
magnetic dipole process is a much weaker process than the electric dipole process but
nevertheless if a transition via the electnc dipole process is forbidden then it may take place
via a magnetic dipole process The determination of what transitions may or may not take
place are governed by Laportes Selection Rule, [4], [5] What this says is that for an electnc
dipole transition to occur there must be a change in parity. For a Rare Earth ion all the free
ion levels are formed by the same 4 f configuration so transitions between these levels should
only occur as magnetic dipole interactions Admixing of states, [6], of opposite panty is
required before the normally forbidden electnc dipole transitions take place This occurs with
the mixing of the 4 f'‘, 5d configuration into the 4 f configuration, relaxing the Laporte
selection rule and makes the electnc dipole transition process possible The physical
requirement to allow a normally forbidden electnc dipole process to occur is an asymmetnc
ligand field m for example glass The transition probabilities for intraconfigurational
transitions of these Rare Earth ions in a glass host are site dependent If the distnbution of
suitable sites for the rare earth ion is large the excited state decay mechanism will be highly
nonexponential This is the case in the glassy environment Therefore it is the range of site
geometries available to the dopant ion allied to the fact that the ion is in general residing in
Chapter 2 Page 13
a distorted site that is the reason the observed transitions via an electnc dipole process
become allowed
2.5 Radiative and Non Radiative Transitions
Many of the luminescent ions in solid/glassy environments have quantum efficiencies far
below the theoretical limit of 1 An assumption can therefore be made that there exists some
mechanism for radiationless decay whereby an ion can return to the ground state without
emitting any radiation. The basis of this assumption is that there exists a coupling mechanism
between the excited ion and the host matrix which allows an efficient transfer of energy
between the ion and the host This is achieved through phonon assisted decay
Non-radiative transitions occur when the total energy of the phonons created in a transition
equals the energy gap between the initial and final states This is illustrated m Figure 2 2
The fluorescent decay time x of the transition can be described as follows,
where WR and W,* are the radiative and non-radiative transition rates.
2.6 The Nature Of Europium Fluorescence
The fluorescence of the Eu* ion in an environment can reveal a lot about its surroundings
The fluorescence spectra of Europium doped sol gel glasses were studied to elucidate the
process of the sol to gel to glass transition, and to compare the fluorescence spectra with
those of conventionally produced high temperature glasses, [7] The Eu* ion, which has a
configuration 4f® 5s2 5p6, has strong f-f transitions in the visible The ground state of the ion
is the 7F0 state. The principle Europium transitions of interest are the sD0-7Fj transitions where
J= 0,1, 2. All of these three transitions emit light within the wavelength band of 550-650nm
Fluorescence occurs from the excited D state to any level of the F multiplet. An energy level
diagram is shown in Figure 2 3.
In the materials examined the fluorescence transitions studied were from the D level to the
Eqn 2.13
where t r is the radiative decay time and is the non radiative decay or
W - wM + wm Eqn 2.14
Chapter 2 Page 14
Some centres will not transfer excitation energy back to dopant ions leading to decay via multi-phonon emission reducing the quantum efficieny
Figure 22 Radiative and Non - Radiative Processes Between Two Energy Levels
various levels of the F multiplet described above In the glassy state the transitions are split
by the influence of the surrounding ligand field In a glass however, because of
inhomogeneous broadening the levels are not always clearly resolvable These levels are said
to be degenerate and their number given by 2J+1 Therefore the J=0 level has 1 resolvable
transition, the J=1 level has 3 resolvable transitions and the J=2 level has 5 transitions not all
resolvable It should be noted that in the case of sol-gel glasses that the number of resolvable
transitions depends largely on the Europium ions environment This is especially so in the
case of the sol and dried gel stage of the sol-gel glass synthesis
In Figure 2 4, 3 fluorescence spectra, from sol-gel glass (A), conventional silicate (B) and
borate glass (C) are displayed
In Figure 2 4 the three transitions and the associated splitting for each can be seen for three
types of glass (See Appendix 5 for absorption of Eu3* in a glass and a liquid) The SD0-7F0
transition is a singlet transition and does not split under the influence of the ligand field, [8]
It’s width is a result of the inhomogeneous broadening induced by a large collection of
different sites made available to the ion m the glass environment And it can be used as an
Chapter 2 Page 15
Energy Levels and F luorescence Transitions
5D
2
Figure 2.3 Energy Levels of Europium
indicator of the range of sites in which the ion resides To convince oneself of this one should
compare the width of the SD0-7F0 transition in the symmetrical solvation shell of a solution,
(le very narrow), with the same broadened transition of the ion in an asymmetric, (ie glassy),
environment (See Section 7 2, Figure 7 3)
The 5D0-7F, transition is an allowed magnetic dipole process, [6] For a magnetic dipole
transition to occur the initial and final states must have the same panty This transition takes
place within the 4f shell The importance about this transition is that the symmetry of the
environment surrounding the Eu3* ion does not affect the transition probability, [6], and
hence the intensity which is what we want to measure.
For an electnc dipole process to occur there must be a change in panty The 5D0-7F2 transition
is an electnc dipole process, [6] This transition occurs within the 4f shell and so is forbidden
by the Laporte Selection Rule For it to occur it needs a mixing of panty which can happen
if the Europium ion expenences an asymmetncal field, [8] This is why the intensity of the
transition to the 7F, state increases dramatically in going from the sol to the gel to the glassy
Chapter 2 Page 16
s’
U)-4—'• ■ ■
c
_QL_
>N
c<1)
Wavelength (nm)
Figure 2.4 Emission Spectra of Eu* in Three Glass Types. Sol-gel glass (A), conventional silicate (B) and borate glass (C).
Chapter 2 Page 17
type matnx The intensity' of the transition is dependent on the asymmetry of the Europium
ions environment
In an attempt to quantify the asymmetry dependence of the emission intensity, Gallagher [8],
proposed that a measurement of the ratio of the two transitions :D0-'F: and 5D0-'F, should be
made This ratio, the fluorescence ratio, is called the Rn ratio throughout the report
As can be seen from the Equation 2.15 above, as the intensity of the 5D0-7F2 transition
increases the Rn value increases Therefore R^ is a measure of the asymmetry of the
environment surrounding the Eu3* ion The Rn value is tabulated for most of the fluorescence
spectra shown in this thesis
2.7 Conclusion.This chapter has reviewed some of the phenomena associated with optically active ions in
glass and glassy type media The discussion presented in this chapter provided an introduction
to the ideas of fluorescence, radiative and non radiative transitions. These topics are the mam
phenomena studied in the investigation of the Europium ions behaviour in the Sol Gel type
materials Also discussed were the current ideas on the characteristics of the ions in these
types of materials
Chapter 2 Page 18
C hapter 3
3.0 Introduction
The experimental system used in this project is outlined in this chapter There were basically
two different experimental procedures followed, one for the fluorescence measurements over
a wavelength range and another to determine the lifetime of the Eu* ion in the sol-gel system
The differing excitation sources and the data acquisition techniques employed are described
3.1 Fluorescence Measurements
The excitation source used was a 200W Applied Photophysics water cooled Xenon Arc Lamp
Light at a wavelength of 398nm, ( see Appendix 5 ), was selected by passing the lamps
output through a Minimate Monochromator, (see Figure 3 1) This was then focused onto the
sample under investigation The fluorescence from the sample was collected and focused onto
the slit of a Jobin Yvon lm focal length spectrometer, where it was detected by a Hamamatsu
R928 photomultiplier tube The Xenon lamp was not the only source used for fluorescence
measurements An Ultra Violet stnplamp peaking at 368nm was also used as well as a PRA
pulsed nitrogen laser The use of the nitrogen laser was mainly confined to the measurement
of excited state lifetimes These techniques are described in the following section.
3.2 Fluorescence Data Acquisition
The fluorescence data acquisition was achieved via an Acorn Electronics Analogue Interface
Board This was connected to a BBC Master microcomputer The expenment was controlled
by the BBC Basic computer program "Aver2" (for listing see Appendix 1) Briefly this
program allowed the operator to select both the starting and finishing wavelengths and the
increment size Another feature of the program was that it permitted the operator to time
average the signal by explicitly requesting how many times each data point was to be
sampled This coupled with the background (ambient count) subtraction provided the operator
with a greatly improved signal to noise ratio
The Experimental Systems
Chapter 3 Page 19
In order to use a pulsed source as an excitation source a different data acquisition technique
was necessary In this case the pulsed source was the Nitrogen Laser mentioned already A
programme "Lifet",( for listing see Appendix 2), was written by Devlin and Ennis, in order
to enable the BBC microcomputer to analyse data from the time resolved fluorescence
measurements To control the photon counter, (described later) the nitrogen laser receives a
series of trigger pulses from a function generator Upon receipt of the same trigger pulse the
photon counter enables a counting gate for a predetermined length of time Dunng this time
period the detector signal is measured Following this the gate is disabled until the next
trigger pulse and the spectrometer is incremented by one step
3.3 Time Resolved Fluorescence Data Acquisition
Jobrn Yvon lm Spectrometer Sample
Figure 3.1 The Fluorescence Measurement System
Chapter 3 Page 20
3.4 Lifetime Measurements
The two mam workhorses of the fluorescence lifetime measurement system are
1 The Stanford Research Instruments SR400 photon counter and
2 The PRA/Laser Photonics Pulsed Nitrogen Laser
3.5 The Nitrogen LaserThe mam advantages of a pulsed molecular nitrogen laser are it's simplicity of operation and
it’s relatively high repetition rate Atmospheric pressure nitrogen lasers can produce
nanosecond or sub nanosecond pulses in the near ultraviolet The 337nm output is the first
choice source for many as a dye pump for wavelengths from 360nm to approx l im for
experiments in dye laser spectroscopy and the study of photochemical kinetics The laser used
in these experiments was operated at 45 and 80 psi Operating nominally at 15Kv, a very fast
transverse excitation across a 6mm rectangular cross section channel produced a 0 6
nanosecond duration discharge Triggering of the discharge was via a trigger transformer and
spark gap arrangement The physical description of what actually happens is reasonably
straightforward. The Nitrogen molecules are excited by a fast high voltage discharge. This
populates the upper laser level of the nitrogen molecule This level is an excited electronic
state with a lifetime of about 40ns, emitting a photon at 337nm when dropping to the lower
laser level The laser transition mvolves changes to both the electronic and vibrational energy
levels As a result careful examination of the neutral nitrogen spectrum at high resolution
reveals that the 337 lnm transition includes many discrete lines arising because the initial and
the final states have a multitude of vibrational sublevels By laser standards Nitrogen lasers
are broadband but compared to a UV lamp for example they can be considered as
monochromatic
3.6 The SR400 Stanford Research Systems Gated Photon Counter
The SR400 Gated Photon counter provides the user with the facility to repetitively measure
excited lifetimes The function generator (see Figure 3 3) simultaneously triggers both the
nitrogen laser and the photon counter The instrument is configured to count in the "A,B for
Preset T" mode which means that on being enabled via a trigger pulse the counters, A and
B, wait a specified time, (determined by the operator), before counting The principle of time
resolved photon counting is illustrated in Figure 3 2
Chapter 3 Page 21
The counier T is used to determine the number of times the photon count is measured at a
specific delay time, in other words how many triggers of the nitrogen laser for each data
point The T counter is normally set to 100 triggers so therefore the A counter counts the
photons falling w ithin it’s gate w ldth 100 times The counting method is illustrated in Fig 3 3
Because the Nitrogen laser is a gas discharge based light source it’s output power can vary
significantly from pulse to pulse, this can be due to a number of reasons but m our
experimental setup it is due mainly to the degradation of the nitrogen gas in the triggering
spark gap and the resultant fouling of the spark gap itself This problem was overcome by
forcing the spark gap to allow high pressure nitrogen gas to bleed slowly through it, this
allied to careful alignment of the transverse electrodes and control of the operating pressure
of the nitrogen produced a vast improvement in the pulse to pulse reproducibility of the lasers
output and also in the maximum operating repetition rate to a previously unobtainable level
of approximately 10 Hz However despite this increase m reliability it was necessary to
compensate for small variations in the pulse to pulse reproducibility To that end the counter
"B" was set to an initial delay of 30 usee’s and then allowed to count for a gate width of
lmsec This in effect measured the total intensity of the fluorescence pulse. The count figure
for both the A gate and the B gate was then transferred to the BBC microcomputer via the
TF.F.F. interface board and the data was normalized with respect to the intensity of the
excitation pulse, le counter A ’s contents divided by counter B The Lifetime systems are
depicted in Figure 3 3 In addition to the lifetime acquisition system in use at D C U some
collaborative work was done at the University of Dublin, Trinity College The experimental
system used is shown schematically in Fig 3 3 and consisted of a Spectron Nd Yag pumped
dye laser which was filled with Rhodamine dye The dye laser’s output was frequency
doubled using a KDP crystal and the excitation wavelength used was 318nm, ( see Appendix
5 for absorption spectrum of Eu1*) The output of the photomultiplier tube was fed to the
SR400 photon counter and the ambient count and the pulse to pulse normalization was
performed as described above
3.7 Lifetime Data Acquisition
The lifetime data acquisition was accomplished by the BBC Basic program "Lifet",(see
Appendix 2 for listing) This controlled the SR400 photon counter through an IEEE Acorn
488 Board The program saves the data, as well as all the important operating parameters such
as counting mode, no of points, gate delays etc It also provides the normalization described
Chapter 3 Page 22
above, (See Sec 3 6), so that the saved data file is ready to undergo the various data analysis
routines that are contained m other programmes In the acquisition programme itself provision
is made to call the data analysis programme "Compstw", (see Appendix 3 for listing), this
programme displays the decay curve and draws a semi logarithmic plot of the same curve
The details of this and other data analysis programmes is give in the following sections
3.8 Lifetime Data Analysis
The analysis of the decay curve data is not unfortunately quite as straightforward as it may
appear on first inspection In glass or glassy media the analysis is further complicated by the
fact that the decay process is highly non exponential due to the wide choice of sites available
for the dopant ions, (See Sec 21) In the following section a bnef description of the
characteristics of transient phenomena is given, this is follow'ed by a description of the
analysis techniques used later m this report as well as suggestions about other possible
analysis techniques
3.9 Relationship Between Mean and Half Life and its Calculation
The mean life TI/2 is generally defined as the time it takes the intensity to fall to half it’s
original value In excited state measurements this usually means the time required for the
emission intensity to halve. Of more importance is the quantity known as the mean lifetime.
If a decay is exponential the mean lifetime Tm is equal to 1/k, the decay rate constant The
initial excited state concentration, is reduced by a factor of 1/e at t= x For an exponential
decay T lr2 and x are related by, [1],
T i / 2 = ^ l n 2 3 1
T1/2 = . 6 9 3 xm Eqn3.2
Since Ti/2 is independent of the starting time t0 for an exponential decay it can be used to
measure how exponential a decay curve is This is known as the T1/2 test and is described
later In the majority of lifetime measurements the decay process is or is generally assumed
to be what is known as a first order process A first order process is one where the probability
Chapter 3 Page 24
Trinity College Lifetime SystemSample
SRS Gated Photon Counter
IEEE Interface Board
BBC Micro
Second Harmonic | Crystal
Poknser
Dye Laser
Nd YAG Laser
Dublin City University Lifetime SystemJobm Y von lm Spectrometer SSOnm Filter Sample
SRS Gated Photon Counter
IEE Interface Board
BBC Micro
Pulsed Dye Laser
Nitrogen Laser
Figure 3.3 The Lifetime Measuring Systems
Chapter 3 Page 25
of decay of the excited species D* is unaffected by the presence or like neighbours Generally
the time dependence of the excited decay is of the form,
[£>*] = [D' ]0 e x p ( - k t ) E<ln33
Looking at the above equation one can see that if a semi logarithmic plot of the data is taken
then the resultant plot is of the form,
In [Z?*] = In [D*] 0 -k t Eq" 3-4
The plot itself is linear with a slope of -k and an intercept of ln[D*]0 The above procedure
is what the analysis programme "Compstw" follows The programme produces a weighted
least squares fit of the decay curve on the computer monitor as well as a semilog plot of the
data Problems arose however when calculating the lifetime from a decay curve which is not
originally a single exponential decay but is actually a multi-component or sum of exponential
decays Part of the solution is given in the name of the analysis programme "Compstw", this
programme also allows the user to component stnp a decay curve, ie to break down a decay
curve into it’s component lifetimes The theory behind this technique is outlined below.
3.10 Multi Component Decays and Component Stripping
According to Demas, [1], problems begin to anse when one has to analyse a decay curve
which is composed of several species each with different lifetimes which emit spontaneously
and simultaneously The classical method of representing a detectors response, D(t) is,
» hD(t) = £ K i exp ( - — ) Eqn3.5
i«i Ti
Where N is the number of emitting components In general semilog plots of D(t) versus t are
concave for a multicomponent decay, this is illustrated in Figure 3 4 for a multicomponent
decay with it’s associated semilog plot This is true unless the t, are equal or one of the K,
dominates, in which case the plots are nearly linear
The diagram shows two curves D(t) and lnD(t) versus t for a decay that is the sum of two
Chapter 3 Page 26
exponentials, (K,=5000, T,=35nsec. K:=5000. T,=7nsec) That it is not exponential is readily
seen by applying the T,,; test to different portions of the curve At t=0, T1/2 is 10ns, at t=l0ns,
T,r is 14ns, at t=50ns T1/2 is equal to 25ns, this corresponds to a t value of 36ns the last
value is in excellent agreement with the long lifetime component value
The result is expected because at such a long time scale the fast lifetime (7ns) makes no
contribution to the decay process The differences in the T1/2 show that the decay process is
nonexponential, the semilog plot confirms it If one considers the semilog plot, (Fig 3 4(B))
one can see that on a long time base the curve will be linear with a slope of -1/t and an
intercept of lnl^ Using this K, and tj the contribution of the slow component is subtracted
from the D(t) to yield D’(t),
D'{t) - D (t) - K. exp(——) Eqn 3.5(a)Ti
D’(t) approximates the pure decay curve for the short lived component Note that D’(t) is not
the difference between the observed decay and the calculated exponential decay of the long
lived component An inspection of the plot of the D’(t) curve reveals a danger in the
component stripping method. At longer times the lnD’(t) vs t becomes very noisy Therefore
the component fitting regions must be chosen with care Component stripping provides a
measurement of a second component lifetime but the increasing difficulty of the process when
it is extended to more than two components makes it’s use limited A more common method
of analysing complicated nonexponential decay curves, such as those from a glass
environment, was described by both Demas, [1], and Lempicki et al [2] This was the method
that was adopted in the analysis of the nonexponential decay curves found in this study. The
average lifetime tAv is defmed as in Equation 3 6
[ t a r n *J0 & Eqn 3.6
tAv = — ------------- -f l M d ti *
Where I(t) is the experimental decay curve The quantity xAv is the summation over time of
the number of excited species decayed in a time interval dt, multiplied by their age at time
Chapter 3 Page 28
of decay This quantity is averaged over the total population This technique is achieved
through numerical integration m the case of a multicomponent decay Another method was
to use an algorithm based on Simpson s Rule, [3], for determining the area under a curve
Results obtained with both these techniques were in good agreement with each other m all
measurements In all the tables of lifetime data the three methods of lifetime calculation will
be given Method 1 will be Numerical Integration Method 2 will be by Simpsons Rule
Method 3 will be by the semilog plot technique described earlier Comparisons with the
semilog plot were m general very good for principally exponential decays but differed
considerably when multicomponent decays were considered
3.11 Data Analysis Program for Methods 1 and 2
The data analysis program "Half of 84", (For listing see Appendix 4), performed the
calculations for methods 1 and 2 above One of the programs features was that the operator
could select where on the decay curve the lifetime was to be determined from This was
necessary because of the manner in which the photon counter was triggered. It was found that
the trigger pulse from the function generator wandered around its set mark space ratio This
resulted in different initial delays before counting commenced even though the initial delay
had nominally been set fixed at 20|jsecs The problems encountered because of the wavenng
trigger are depicted in Fig 3.5(a+b) In the diagram shown the most favourable point to
commence the tAv calculation was at point "B", higher count number means higher signal to
noise ratio At point "C" the count has dropped significantly while at point "A" unless those
points were disregarded the calculations would have been in error In theory for an
exponential decay it does not matter where on the decay curve the lifetime calculations begin,
but this is not stnctly the case for a multicomponent decay curve because information from
short lived decay components can be missed or ignored The problem with the triggering
method was overcome by the use of an optical trigger placed beside the sample This
provided a trigger pulse a fixed time after the excitation pulse The ideal case was where the
A gate delay of the photon counter could be set to zero or perhaps ljosec thus allowing the
A gate to be enabled almost immediately after the excitation pulse The enablmg trigger was
delayed only by propagation delays within the detection electronics
The program then produced a value of the lifetime based on both methods, the results are in
very good agreement and only vary for the high temperature samples where "Compstw"
calculated the results as discussed above, (see Section 3 10)
Chapter 3 Page 29
3.12 Synthesis of the Samples Studied in this Report
All of the samples used in this study were synthesised from TEOS and water by mr Brendan
O'Kelly, T C D Investigations into the character of the sol to gel to glass transitions were
focused on observing how changes to the initial conditions were mirrored in the emission
spectra of the dopant rare earth ions Of the initial conditions that were easily variable the
following were deliberately altered the pH of the water used in hydrolysis, used to investigate
two different catalysis regimes, the HzO/TEOS ratio, known as Rhjo/teos* known to effect the
hydrolysis rate . As well as the two conditions described above, a sample set of glasses were
produced which were co-doped with Aluminium to investigate the behaviour of the optically
active rare earth probes in the sol-gel glass matnx The importance of the first two processing
parameters is discussed below Discussion of the other samples is left to the relevant sections
in Chapters 3 and 4 to discuss
The evolution of sample history is shown below
Table 1.1 Evolution of Samples used in this Project
Sample Series No.l
Temperature Sol, Gel, 200°C, 500°C, 800°C
H20/TE0S Ratio 4
pH of H20 5 6
Sample Set No.2
Temperature Sol, Gel, 200°C, 500°C, 800°C
H20/TE0S Ratio 4
pH of H20 8
Sample Set No.3
Temperature Sol, Gel, 200°C, 500°C, 800°C
H20/TE0S Ratio 4
pH of D20 8
Sample Set No.4 H20/TE0S Ratio for Acid Catalysis
Temperature 200°C
H20/TE0S 4, 10, 20, 40
pH of H20 1
Chapter 3 Page 31
Sample Set No.5 H ,0/TE0S Ratio for Base Catalysis
Temperature 200°C
pH of H,0 5 6
Sample Set No.6 Aluminium Co-Doped Samples
% Aluminium Temperature
0 0 200°C, 500°C, 800°C
0 5 200°C, 500°C, 800°C
1 0 200°C, 500°C, 800°C
pH of H20 1
Sample Set No.7 Soaked Sample Set
48 hours Soaking in 1% w/w solution of Eu(NOj)3
Temperature 200°C, 500°C, 800°C
Sample Set No.8 Quenched Samples-Base Catalysed
Sample Name Temperature
Sample 8(i) Gel (72°C)
Sample 8(11) 800°C Air Quenched
Sample 8(m) 800°C H20 Quenched
Sample 8(iv) 800°C D20 Quenched
All of the samples used in this study were doped with 2% europium which was to act as a
structural probe of the sol gel derived glass system As the samples were processed from the
initial sol to the gel and on to the final densified glass the changes observed in the fluorescent
spectra of the samples were noted With the exception of Sample Set no 6 none of the
samples under study were codoped with any network modifying ions such as aluminium or
sodium The reason for the sample sets being designed as they are is explained again briefly
below
Sample Sets 1*3
These Sample Sets were chosen to investigate the effect of acid and base
catalysis on the structural evolution as a function of temperature of the sol gel
Chapter 3 Page 32
derived glass
Sample Sets 4-5
These sample sets were chosen to investigate the effect of the H;0/TE0S ratio
on the evolution of the sol gel derived glass In particular how' the Hydrolysis
and Condensation rates effect the fluorescence properties of the Eu3* structural
probe
Sample Set 6
This was the only sample set where a deliberate attempt to alter the structure
of the densified glass was made It was done to determine if aggregation of
Rare Earth ions in the high temperature glass stage could be overcome by the
addition of the network modifying Aluminium ions
Sample Set 7
This sample set was chosen to determine the difference between incorporating
the Europium in the solution stage of fabrication and soaking when already
made and what effect the residual radical groups that remained in the pores of
the structure could have on the luminescence characteristics of the sol gel
glass They were soaked in a Europium solution and fired to various
temperatures
Sample Sets 8-9
These sample sets were chosen to investigate what the characteristics of the
heating process were They were quenched in various ways to investigate the
non-radiative pathways for the Eu* fluorescence.
3.13 ConclusionIn this chapter is outlined the experimental systems used m this project It has discussed the
problems associated with analysing excited state lifetime measurements when the decay
process is both exponential and highly non exponential It outlines the history of the sol gel
samples whose results are discussed in Chapters 4 to 7
Chapter 3 Page 33
Chapter 4
Eu3+ Fluorescence and Decav Measurements as a Function of Sol
pH in Sol-gel Glasses
4.0 Introduction
This is the first in a series of results and discussion chapters The aim of this and the
following chapters is to present the results of the experimental work earned out on sol-gel
silica samples which have been prepared in different ways, as discussed m section 3 12.
For all materials, the principal aim is to investigate the role played by the Eu3' as a structural
probe of the sol-gel material This chapter discusses the experimental work earned out on
three initial sample sets, Sample Sets Numbers 1, 2 and 3
4.1 Materials Preparation as a Function of pH
Three sample sets were produced each having different pH conditions Each set contained
ten samples labelled A to K. The three sets were known as Sample Set Number 1,2 and 3
respectively For Sample Set No 1 the TEOS was hydrolysed by water at a pH of 5 6 Sample
Set No 2 was hydrolysed with water at a pH of 8 and Sample Set No 3 was hydrolysed by
deuterium at a pH of 8 For each pH, samples were prepared using the following heat
treatments:
A Sol;
This is the original mixed solution, which had undergone no heat treatment
B Gel;
This is the initial gelled sample, cured at 73° for 24 hours and then sealed in a clean
container
D.E Xerogel;
This is the gel cured at 73° for 189 hours and then placed in a clean container
F.G-K Partially Densified;
Any remaining liquid was shaken off, the sample was then dried at 73° and then
fumaced for 24 hours at,
Chapter 4 Page 34
F,G;
Fumaced for 24 hours at 200°C
H,I;
Fumaced for 24 hours at 500°C
J,K;
Fumaced for 24 hours at 800°C
The treatment described above was also applied to Sample Set No 2 in exactly the same way
Any modifications are stated as they occur Both sample sets were examined and the emission
spectra are displayed in Figure 4 1 and 4 2
4.2 Acid and Base Catalysis of Sol-gels.
The rapid increase in gel times for sol-gels, [1], as pH approaches 2 5, the isoelectric point
of Silica, has led to the adoption of a convention in this thesis Sol-gels whose precursor pH
is greater than 2 5 are termed base catalysed Sol-gels whose precursor pH is less than 2 5 are
termed acid catalysed, [2] The explanation of this nomenclature is given below
The isoelectric point is defined as the point at which a sol is most likely to coagulate because
the electnc repulsion between particles is reduced, [3] The aggregation of colloidal particles
to form a gel is essentially a base phenomenon, [4] Thus gels formed at a pH of greater than
2.5 are termed as base catalysed as their gelation characteristics are those of the gelation of
a colloidal precursor solution Similarly gels formed at a pH of less than 2 5 are termed acid
catalysed because they display the ramified, long chained structure which comes out of
solution m a much shorter time than the base catalysed structure Thus it can be seen that a
pH value of 2 5 represents a watershed in terms of describing a process as acid or base
catalysed
4.3 Fluorescence Studies of Base Catalysed Samples (pH=5.6)
The evolution of the fluorescence as a function of temperature for the base catalysed sample
sets can be seen m Figure 4.1 which shows how the spectrum of the sol is similar in many
ways to that of the emission characteristics of the Europium ion in solution, ([5], see also
Figure 7 3) The intensity is noticeably weak as evidenced by the small signal to noise ratio,
however the spectral profile is similar to the ion in solution because of the narrowness of the
peaks and the lack of any structural splitting or peak broadening Another feature of the sol
is the width of the transition around 578nm, this transition, the 5D0-7F0, can generally be
Chapter 4 Page 35
regarded as an indicator of the site multiplicity [6], the interpretation of the narrow peak is
that the range of sites available to the Europium ion is quite limited This is also the case for
a Europium ion m solution where it is surrounded by a symmetric solvation shell, [5],[7]
Therefore the narrowness of the transition gives an indication of the "wetness" of the sample
and it is surprising to note that the transition remains quite narrow even at moderately high
temperatures A measurement of the fluorescence ratio, Rn as defined in section 2 6, also
mdicates that the environment is quite symmetrical because of it's low value The Rn ratio
for the samples shown is tabulated in Table 4 1 Note the decrease m R in going from sol
to gel This would imply a more symmetrical environment for the gel This effect was
observed in acid-catalysed samples [7], both in the fluorescence data and the lifetime data and
is under further investigation In this study the effect is not corroborated by the lifetime data
for pH=5 6, (Table 4 3)
Type Rn +.(0 5)
Sol 30
Gel 18
200° 3.1
500° 4 2
800° 4.3
Table 4.1 Fluorescence Ratios (R^) for Sample Set 1,( pH=5.6)
As the temperature increases the spectra show the evolution of the J field splitting, (See Sec
2 6) The splitting associated with a glassy state becomes more apparent with the ?F, transition
starting to show the development of it’s three levels However from both lifetime and spectral
measurements the 800°C sample, the highest treatment temperature in this sample set, has not
yet acquired the same characteristics as the conventional high temperature Silicate glass
doped with Eu3*, [6] The 200°C sample is interesting because as can be seen from Table 4 1,
although the Rn increased and the J splitting has appeared in the two lower energy transitions,
the singlet transition 5D0-7F0 remained relatively narrow which indicated that a wide range of
sites was not available to the Europium ion in this an intermediate stage between a gel and
Chapter 4 Page 36
»
Figure 4 1 Excitation
CD-+-J
*C3
_Qs_
< ,
>N
COc<1)
550 600 650
Wavelength (nm)
Fluoresccnce Spectra of Sample Set No.l, (pH=5.6 Base Catalysed, Room Temperature, X= 398nm)
Chapter 4 Pace '7
a glass This is in contrast to the 800°C sample where the u ider transition widths indicate a
much wider range ot site geometries for the dopant ion, as is the case for a conventional
glass
4.4 Fluorescence Studies of Base Catahsed Samples (pH=8)
Figure 4.2 shows the fluorescence spectra for the base catalysed, pH=8, Sample Set No 2 The
spectra are very similar to those of the pH=5 6 sample set of the previous figure, Fig 4 1,
except the Rp, measurements, within the errors indicated, increase monotomcally as a function
of densification temperature The Rn measurements are tabulated in Table 4 2.
Type Rn +.(0 5)
Sol 17
Gel 15
200° 3 2
500° 5.5
800° 7 4
Table 4 2 Fluorescence Ratio (R*,) Measurements for Sample Set No.2 (Base Catalysed at pH=8)
Again the singlet transition width of the partially densified glass, the 200°C sample, is quite
narrow indicating that there are still large amounts of radical groups both hydrocarbon and
water based remaining within the pores of the structure, although from the lack of splitting
of any of the other levels it is obvious that this stage is still far from a conventional glass
4.5 Lifetime Studies for Sol-gels at pH=5.6 and pH=8
One of the most sensitive indicators of change to the environment surrounding the Europium
ion is the measurement of it’s fluorescent lifetime Fluorescent lifetime measurements were
earned out on all samples The lifetime values for Sample Set’s Number 1 and Number 2 are
tabulated in Table 4 3 and 4 4
For both pH 5 6 and pH 8 the lifetime values, within the error, increase monotomcally with
densification temperature, (see Table 4 3 and 4 4) This increase can be attributed to the slow
Chapier 4 Page 38
(/) • I
c3
j D
-I-»
*co c0
550 600 650
Wavelength (nm)
Figure 4.2 Fluorescence Spectra For Sample Set No.2 (Base Catalysis pH=8, Room Temperature, XExcitation = 398nm)
Chapter 4 Page 39
Type tAv Method 1 +. (0 01)ms
tAv Method 2 + (OOl)ms
T Semi-Log + (0 05)ms
Sol 017 017 0 19
Gel 016 016 0 17
200° 0 26 027 0 29
500° 0 75 0 76 0 87
800° 0 97 0.99 12
Table 4.3 Lifetime Measurements for Sample Set No.l, (pH=5 6 Base Catalysed, Room Temperature, X Excitation = 337nm)
Type tAv Method 1 +. (0 01)ms
tAr Method 2 +. (0 01)ms
x Semi-Log +. (0 05)ms
Sol 018 0.18 0.19
Gel 017 0.18 0.18
200° 0.27 0.27 0.3
500° 0.7 0.7 08
800° 10 10 L2
Table 4 4 Lifetime Measurements for Sample Set No.2, (pH=8 Base Catalysed, Room Temperature, X Excitation = 337nm)
decomposition of hydroxyl groups in the structure and the consequent reduction m the non-
radiative decay paths for the Eu3* ion The low value of the lifetime measurement in the case
of the partially densified sample is attributed to the presence of residual OH' groups residing
in the bulk of the sample Previous work [8] has shown that most of the orgamcs will have
been removed by about 400°C though some can remain until considerably higher
temperatures The low value of the measured lifetime of the 800°C sample compared to the
value of approximately 2 3ms measured for Eu3* m a conventional silicate glass, [6], is
attributed in part to the presence of residual hydroxyl ions m the matnx even at this
temperature, and also to the fact that the structure of silica (Si02) glass is quite different to
that of a mixed silicate glass, [9]
Chapter 4 Page 40
It is well known that the pH ot the initial components is an important factor in the synthesis
of sol-gel glasses, [10] A low value of pH, le <2, corresponds to a high hydrolysis rate and
a low condensation rate, while materials with pH=3 should have a lower hydrolysis rate and
a high condensation rate, [11] These trends can be seen by referring to Figure 4 3(a) which
shows the hydrolysis rate as a function of pH or Figure 4 3(b) which shows the condensation
rate as a function of pH
Figure 4 4 shows the fluorescence spectra of sol-gel silica at pH=l from a previous study m
this laboratory [7] From the low lifetime and values, Tables 4 5 and 4 6 respectively, it
can be seen that this data is consistent with Eu3* in a symmetric environment of mainly
hydroxyl ions at the sol and gel stage This reflects the high hydrolysis rate at this pH For
pH values of 5 6 or 8 the environment is less symmetrical with more organic and less
hydroxyl groups, as indicated by the larger values of Rn in Tables 4 1 and 4 2 The larger
values for the lifetime of the sol and the gel also agree with a less symmetrical Eu3* site, (see
Table 4 3 and 4 4) This is consistent with a lower hydrolysis rate and a higher condensation
rate. The predictions outlined above are borne out by the results of the lifetime data and
fluorescence shown earlier The pH=5 6 and pH=8 sample sets, display an increase in
intensity for the sol and gel compared to figure 4 4 for pH=l, resulting from the increased
asymmetry of the environment due to the increased number of organic and OH groups
surrounding the ion at higher pH This is a characteristic of base catalysis For acid catalysis,
the high hydrolysis rate compared to the condensation rate results in more OH' groups being
present at the sol and gel stage hence giving nse to the low lifetimes and small R values
measured.
4.6 Structural Implications
Type t Semi-Log msecs +. 0 002
Sol 0 134(2)
Gel 0 123(2)
200° 0 38(2)
800° 1 05(2)
Table 4.5 Lifetime Measurements for Acid Catalysed Samples (pH=l, Room Temperature, A. Excitation=398nm, From [7])
Chapter 4 Page 41
pH
(a)
I
pH
(b)
Figure 4.3(a) Hydrolysis Rate as a function of pH and (b) Condensation Rate as a function of pH From iBnnker and Scherer "Sol Gel Science"].
Chapter 4 Page 42
INTE
NSI
TY
(arb
u
nit
s)
WAVELENGTH (nm)
Figure 4.4 Fluorescence spectra of Acid Catalysed Samples (pH=l, Room Temperature, X Excitation 398nm) From 17]
Type Fluorescence Ratio Rn
Sol 1 58
Ge! 0 95
200° 3 62
800° 4 33
Table 4 6 Fluorescence Ratio, R^, Measurements for Acid Catalysed Samples (pH=l, Room Temperature, X Excitation=398nm) From [7]
4.7 Studies of Deuterated Sample Set (Sample Set No.3)
In previous work on rare earth fluorescence it was known that synthesis of a solution using
D ,0 instead of H,0 produced a much increased fluorescence yield and excited state decay
times, [12] The reasons that the lifetime increases is that for a H,0 based gel the
predominant energy loss is through radiationless decay via the hydroxyl groups vibration The
heavier deuterium atom has a lower frequency of vibration. The vibration energy is reduced
from 3600 to 2700 cm'1 for the O-H stretch by Deuterium substitution for Hydrogen.
Therefore as more vibrational quanta are required to fill the non radiative energy gap the
probability of non radiative decay diminishes, therefore the fluorescence efficiency and the
fluorescence lifetime increase This is best described by Equation 2.13, (See Section 2 5).
I = JL ♦ _L Eqn 2.13
Bearing in mind that the OH radical mentioned earlier is a possible source of fluorescence
quenching it was decided to examine the properties of a sample set of sol-gel glasses
synthesised with D20 replacing H20 The results of the luminescence scans are illustrated in
Figure 4 5
On inspection of Figure 4 5 it can be seen that the signal to noise ratio of the scans is very
large Indeed the sol could be seen to fluoresce when excited even under normal laboratory
lighting conditions The deuterated samples were compared directly with Sample Set No 2 as
they were manufactured identically except for the Deuterium substitution. Comparison with
the Sample Set No 2 reveals some very sigmficant differences The major difference is in the
observed value of the lifetime measurement It was approximately three times longer for the
sol and gel, (see Table 4 7), than similar H20 hydrolysed samples This confirms the role
played by OH' ions in quenching the fluorescence according to equation 2 13 The presence
of OD' instead of OH' in the sol and the gel decreases non-radiative decay and increases
Chapter 4 Page 44
if)• -cZ)j QL_
< ,
-+~>
\ n cCD
Wavelength (nm)
Figure 4 5 Fluorescence Spectra of Deuterated Samples, (pH=8, Room Temperature, X Excitation =398nm)
Chapter 4 Page 45
intensity and measured decay times
Type tAv Method 1 + (0 01)ms
t v Method 2 + (0 01)ms
t Log-Line + (0 05)ms
Sol 0 48 0 48 0 48
Gel 0 46 045 0 42
200° 0 30 0 29 0 32
500° 0 72 0 73 0 76
800° 100 100 110
Table 4.7 Lifetime Measurements for Deuterated Sample Set, (pH=8, Room Temperature, A. Excitation = 337nm)
As the treatment temperature increased however the lifetime values of both sample sets, at
pH=8 and the deuterated samples at pH=8 came closer together After the gel stage, the
deuterium has been used up in hydrolysis and non-radiative decay due to OH' and C-H
vibrations, as products of condensation continue to quench the fluorescence.
4.8 Conclusion
The lifetime and fluorescence data presented for base catalysed samples at pH =5 6 and pH=8
are consistent with predicted variation of hydrolysis and condensation rate as a function of
pH. The less symmetrical environment for the gel indicated by the data needs further
investigation. The data from samples hydrolysed by D20 emphasises the large role played by
non-radiative decay via OH' ions in Eu* fluorescence in sol-gel materials From the results
presented it is clear that the deuterated sol and the gels have a much longer lifetime and an
increased fluorescence efficiency
Chapter 4 Page 46
C hapter 5
T h e Fluorescence Properties o f the E u3+ in Sol-gel g lass as a
Function of W aterrT EO S Ratio
5.0 IntroductionThis chapter reports the work undertaken on sdica samples where the water:TEOS ratio was
vaned, ( Sets Numbers 4 and 5, in Sec 3 13). Solution pH plays a large role in determining
the eventual properties of the monolithic gel structure There is however a further factor in
the evolution of the glass from the solution. The ratio of water to TEOS, known as r,
determines the rate of evolution of the gel from the sol The investigation of the behaviour
of the gels at varying water TEOS ratios is discussed below
5.1 Variation of H20 :T E 0 S Ratios
A series of samples were produced in two pH regimes, ie pH=l and pH=5 6. For both these
senes a partially densified glass, (200°), was produced For each set of samples that were
produced there were four different values of the Water TEOS ratio, r. The values of the ratio
were 4, 10, 20, 40
In sol gel silica the minimum number of water molecules needed per TEOS molecule for
complete hydrolysis is 2, [1]. Variation of r affects hydrolysis, condensation and gel times.
In the following pages the results of experiments earned out on Sample Set No 4 and 5, with
varying Water TEOS ratios are reported. The experiments were earned out on partially
densified samples, (heated to 200°C)
5.2 Acid Catalysed Samples
Table 5 1 contains the lifetime measurements for the complete Sample Set Number 4, vanous
water TEOS ratios at pH=l It can be seen from the Table 5 1 for acid catalysis, the r=4
matenal has a longer fluorescence decay and a larger intensity ratio The Intensity Ratio, Rn,
measurements are tabulated in Table 5 2 This behaviour is consistent with the model of a
low pH system, which is that of a loose polymer like structure produced by fast hydrolysis,
[2], For r>4 however water remains in the matrix, producing shorter decay times and smaller
Chapter 5 Page 47
fluorescence ratios, due to nonradiative decay mechanisms of the OH group At r=4 however,
most of the water is used up m the hydrolysis stage so that the immediate environment of the
EuJ* ion contains fewer hydroxyl groups
Water TEOS t v Method 1 +. (0 01)ms
xAr Method 2 +. (0 01)ms
t Log-Line +. (0 05)ms
4 0 29 0 30 0 30
10 024 025 0.25
20 0 20 0 20 0.22
40 0 23 0 23 0 24
Table 5.1 Lifetime Measurements for 200*C Samples at Various WaterrTEOS Radas (Acid Catalysed, pH=l)
Water TEOS Rn+. (05)
4 4 2
10 2.7
20 31
40 2 9
Table 52 Fluorescence Ratio. R , Measurements for 200* Samples at Various Water:TEOS Ratios, (Acid Catalysed pH=l)
The Fluorescence spectra of the Acid catalysed Sample set No 4 are shown in Figure 5 1
5.3 Base Catalysed Samples
At pH=5 6 the slower hydrolysis occurs due to a series of competing reactions, [3] More
water is needed for complete hydrolysis and there is a high rate of condensation, [4] The
nature of high pH synthesised sol gel glass is of an aggregation of colloidal particles, [4] As
a result the Eu^ ion is not as exposed to such a large variety of environments as r changes,
le, the colloidal particles tend to screen the ion. This should have resulted in a marked
Chapter 5 Page 48
■D.-T
CO
c
_Q
> N -4—''co
c(D
Wavelength (nm )
Figure 5.1 Fluorescence Spectra of Acid Catalysed 200* Samples (Sample Set No 4, pH=l, RoomTemperature, X Excitation = 398nm)
Chapter 5 Page 49
msensitnity to the excess water available at the higher R values This did indeed appear to
be the case as an examination of the x and the Rn values, w'lthm the error bounds, confirms
The calculated lifetimes for the base catalysed samples of Sample Set No 4 are tabulated m
Table 5 3 for the 200°C samples
As can be seen in Table 5 3 there was very little difference m the decay measurements for
the pH=5 6 sample set, and this was m agreement with the model proposed above The
Water TEOS tAv Method 1 +. (0 01)ms
tAv Method 2 +. (0 01)ms
x Log-Line +. (0 05)ms
4 0 28 0 30 0 30
10 0 30 0 30 0 30
20 0 33 0 33 0 33
40 0 29 0 30 0 29
Table 5 J lifetim e Measurements for 200* Samples at Various Water.TEOS Ratios, (Base Catalysed pH=5.6, Room Temperature, X Excitation = 337nm)
WaterTEOS Rfi+-(0 5)
4 4 0
10 4 7
20 39
40 4 6
Table 5.4 Fluorescence Ratio, R , Measurements for 200* Samples at Various Water TEOS Ratios, (Base Catalysed pH=5 6, Room Temperature)
fluorescence ratios for the 200°° samples are shown in Table 5 4
5.4 Conclusion
In conclusion it is proposed that the Fluorescence and Lifetime characteristics corroborate the
theories about the mechanics of gel formation from the sol, [1], [2] These fonnation
Chapter 5 Page 50
CO
c3
_QL_
< ,
>N-4-'
*co cCD
Wavelength (nm)
Figure 52 Fluorescence Spectra of Base Catahsed 200’C samples, (Base Catalysed, pH=5 6, RoomTemperature, k Excitation = 398nm)
Chapter 5 Page 51
mechanisms are seen to be pH dependent and determined by the ratio of water to the TEOS
It is proposed that the fluorescence characteristics for the Acid Catalysed Sample set show
the Eu3* ion to be in an environment of mainly hydroxvl ions as r increases consistent with
a rapid hydrolysis rate At higher pH, the fluorescence decay data show a marked insensitivity
to the Water TEOS ratio which is consistent with the more colloidal structure present in this
pH regime where the Eu* ion is screened to a larger extent from the added water molecules
Chapter 5 Page 52
C hapter 6
In vestigations o f A Ium inium -E uropium C odoped Sam ples
6.0 Introduction
This chapter reports the results of the experimental work earned out on AIuminium-Europium
codoped samples, Sample Set Number 6 AIuminium-Europium codoped samples were
produced to investigate the effect of a network modifying ion, aluminium, on the fluorescence
characteristics of the Europium ion in a sol-gel host The motivation behind this work was
to examine the effect of the aluminium on the distnbution of the Eu3* ion in the sol-gel
matrix In Neodymium doped systems codopmg with Aluminium dispersed the Nd ions
throughout a sol gel matnx allowing higher Nd dopant concentrations and better luminescence
efficiencies than had been previously thought obtainable Sample Set Number 6 was
synthesised with aluminium concentrations of 0%, 0 5%, and 1% TTiis, according to previous
work, [1], on sol-gel systems should be enough to disperse the europium
6.1 Rare Earth Doping of Conventional and Sol Gel Glasses
Rare earth ions are difficult to add to a simple glass network in any large quantity, [2] Rare
earth ions can enter a glass principally as a network modifier It is frequently difficult to add
more than 1% o f rare earth ions to a simple oxide glass system such as Si02 or GeOz without
causing the ions to cluster The reason is that the network of these single component glasses
are tightly bonded by bndgrng oxygens If a network modifying ion is added then the network
of the Silicon is broken and nonbndgmg oxygens occur The rare earth ion can now be
inserted in the gaps left by the broken structure
Because of the method of addition, it is easier to add larger amounts of rare earth ions to a
sol gel solution It had been thought that because of the nature of the sol solution that the
dopant ion would be homogeneously distnbuted throughout the structure However recent
expenmental work here at this laboratory and in other places has indicated that the sol gel
denved glass may also suffer from clustering of the dopant rare earth ion In the case of the
rare earth ions in the sol-gel, it appears that dunng the polymensation process it is preferable
for the dopant ion to associate and precipitate out in clusters It had been thought that the rare
Chapter 6 Page 53
earth ion would be evenly distributed throughout the amorphous structure The next section
consists of a brief discussion of the effects of aluminium doping on Nd-doped conventional
and sol-gel glasses
6.2 Neodymium doped Glasses
It has been reported, ([1],[3]), that for both conventional and sol-gel Nd-doped Si02 glasses,
the addition of small amounts of aluminium or phosphorous to the silica matrix serves to
increase the fluorescence efficiency and the fluorescence lifetime by preventing the clustering
of the Nd* ions Neodymium doped sol-gel silica is an important candidate for new laser
materials because of the superior mechanical properties of the sol-gel silica matrix compared
to those of conventional mixed silicate materials, [6] For this reason the clustering of the
laser ions is a major problem that has to be overcome to achieve optimum laser performance
In pure sol-gel silica doped with Nd* the dopant ion has a tendency to cluster as discussed
in the previous section. This results in low fluorescence efficiencies and reduced radiative
decays, [4] Close analysis of the decay curves showed the presence of a fast decay
component, (FDC), superimposed on the longer Nd* lifetime, slow decay component (SDC)
The presence of the FDC was associated with the concentration quenching of the Nd* ion due
to clustering Addition of small amounts of aluminium or phosphorous caused the FDC to
decrease and the SDC to increase Thus the presence of the aluminium or phosphorous
appeared to disperse the Nd* ions hence improving the optical performance Similar effects
were seen in Nd* doped conventional S i02 glass prepared by plasma torch chemical vapour
deposition, [3] This work prompted a similar investigation into the phenomenon of Eu*
clustering in Eu*-Al codoped Si02 prepared by the sol-gel method
6.3 Results and Discussion of Experiments on Aluminium Codoped Samples
The work discussed in Section 6 2 provided the motivation for producing the sol-gel glasses
with various concentrations of Aluminium as a network modifier in an attempt to corroborate
the results on Nd* materials and to investigate the properties of Al-Eu* codoped samples
The results of the lifetime and fluorescence measurements show the Aluminium to have
decreased the lifetime by a significant amount compared to the control sample which contain
no aluminium , see Tables and Figures 6 1, 6 2, 6 3 respectively
This was an unexpected result It was thought that the Aluminium in it’s role as a network
modifying ion would disperse the Eu* ion and hence increase the
Chapter 6 Page 54
Type xAv Method 1 + (OOl)ms
xlv Method 2 + (OOl)ms
x Log-line + (0 05)ms
Gel 0 09 0 09 0 09
200° 0 16 0 16 0 15
500° 0 73 0 74 0 73
OoCO 0 81 0 81 09
Tabic 6 I Fluorescence Lifetimes for \% Aluminium Samples (Sample Set No 6, X Excitation = 337nm, Room Tem perature)
Type xAv Method 1 + (0 01 (ms
xav Method 2 + (0 01)ms
x Log-line +. (0 05) ms
Gel 0 08 0 08 0 09
200° 018 018 019
Ooin 0 51 0 52 0 50
800° 0 80 0 82 0 95
Table 6 2 Fluorescence Lifetimes for 0 5% Aluminium Samples (Sample Set No 6, X Excitation = 337nm, Room Tem perature)
Type xAv Method 1 + (0 01)ms
i av Method 2 + (0 01)ms
x Log-lme + (0 05) ms
Gel 0 10 0 11 0 12
200° 0 18 0 36 0 37
500° 0 51 0 54 0 581oOo00 0 74 0 82 0 90
Table 6 3 riuorcsience Lifetimes for 0% Aluminium (Sample Set No 6, X Excitation = 337nm, Room Temperature)
Chapter 6 Page 55
fluorescence efficiency and lifetime This did not however appear to be the case Both
lifetimes and fluorescence efficiencies had decreased for the Aluminium containing samples
This was particularly so in the case of the gel and 200° samples for both Aluminium sets
This was interesting because it is precisely these samples that have the largest amount of
hydroxyl and other radical groups Examining the fluorescence spectra of these samples,
(Figure 6 1 , 6 2 and 6 3) it can be seen that the transition widths of the gel are quite narrow
indicating that there is a large OH content in the samples.
In the case of the Aluminium - Europium codoped samples the problem of quenching of
luminescence in the gel and partially densified stage seems to be exacerbated by the addition
of Aluminium rather than eased As the densification temperature increases the average
lifetime, tAv, increases in both Aluminium containing samples In this way the Aluminium
containing samples are similar to other previously exammed sample sets
The question that must be answered is what exactly is the role of the Aluminium codopant
in the sol gel system The objective of the Aluminium addition to the sol gel system was
specifically to break up the SiO< tetrahedra chains that formed as a result of the
polymerisation of the sol This would then allow space for the Eu* ion. As a result there
would be a wider more homogeneous distribution of sites throughout the gel Recent work
on aluminosilicate sol-gel glasses, [5], indicate that even small amounts of aluminium reduces
the pH of the sol thus increasing the hydrolysis rate This would certainly explain the smaller
value of the fluorescence efficiency and lifetime for the aluminium codoped samples m this
study However it is observed from the data on the 800°C aluminium codoped glasses that the
behaviour is not the same as that found for the neodymium system A measure of how
effective the Aluminium was in breaking the Si04 polymer into shorter lengths could be
achieved through a molecular weight analysis of the Si polymer, a so called chain length or
N-bar analysis with for example an Ubbelohde Viscometer. This could be done at the sol
stage to determine the polymer length of the Aluminium and non Aluminium containing
samples, unfortunately this was not available at the sol production stage For the Aluminium
to attain its primary objective, that is the breaking up of the polymensed structure, there
should be a distinct difference between the two N-bar readings Work is presently underway
in this laboratory to determine more accurately the function of the Aluminium as a network
modifying ion at the sol stage In the experiments on the aluminium doped samples, (sample
Set No 6), a fast decay component was clearly observed with a of approx 0 8|jsecs, (see
Figure 6 4 and 6 5) However for samples containing no aluminium a fast decay component,
Chapter 6 Page 56
co • —
c3
j QL_
< ,
-4-»
‘co c cu
Wavelength (nm)
Figure 6.1 Fluorescence Spectra of 1% Aluminium Containing Sol-gel samples, (Add Catalysed pH=l,Room Temperature, X Excitation = 398nm)
Chapter 6 Page 57
■D.-F
if)
c- QL_
> x-M*cn c
0
Wavelength (nm)
Figure 6 2 Fluorescence Spectra of 0.5% Aluminium Containing Sol-gel Samples (Acid Catalysed pH=l,Room Temperature, X Excitation = 398nm)
Chapter 6 Page 58
’D .-T j
if)H—’• I ■cZ D
_ oL_
< ,
*if)c0 )
Wavelength (nm )
Figure 6.3 Fluorescence Spectra for 0.0% Aluminium Containing Samples (Acid Catalysed pH=l, RoomTemperature, A. Excitation = 398nm)
Chapter 6 Page 59
»•
• •
Fig 6.4(a) Decay Curve for .5% AI Sample Fast Decay Component Measurement
T —.SfjLSFDC
V •• .•r f # • f * • •
h.**. s ' V % -* • • w # • «
20 40 60 80 100 120 140 160 180 200
Time (/¿sec's x 0.1)
T~"
VV
Fig 6.4(b) Decay Curve for 0.5% Al Sample Slow Decay Component Measurement
T" = 0.51ms soc
1.3
Time (m sec's)
Figure 6 4 Lifetime Measurements for 03% Al containing sample, (A) Fast Dccay Component, (FDC), (B) Slow Decay Component, (SDC). Room Temperature, X Excitation = 337nm
Chapter 6 Page 60
Fig 6.5(a) Decay Curve for 0.0% A1 Sample
Fast Decay Component Measurement
7" = 1.5/*sFDC
1-------- 1-------- 1-------- 1--------1 1 1 1 1--------0 20 40 60 80 100 120 140 160 180 200
Time (/¿sec's x 0.1)
, •
\. . »
Fig 6.5(b) Decay Curve for 0.0% Al Sample Slow Decay Component Measurement
T" =0.54ms SDC
1.35
Time (m sec's)
Figure 6.5 Lifetime Measurements for 0.0% Al containing sample, (A) Fast Decay Component, (FDC), (B) Slow Decay Component, (SDC). Room Temperature, X Excitation = 337nm.
Chapter 6 Page 61
(FDC), was observed with t FD(_=1 5(jsecs This is in gcxxl agreement w'lth previous preliminary
work done on the alummium-europium codoped system examined m this laboratory, (Devlin
et al [6]) It appears from this that clustering does indeed exist in these materials and that the
presence of the aluminium is not dispersing the europium ions It is proposed that the fast
decay component, (FDC), is due to an alternative route for the Eu-* de-excitation whereby the
energy is transferred across from the excited state of ion 1 to an adjacent ion 2 in the cluster
instead of de-exciting to the ground state of ion 1 This is known as concentration quenching
The excitation transfer time is shorter than the decay time to the ground state From the data
it is clear that the presence of aluminium has some effect as it reduces to some extent the fast
decay component, (FDC), as compared to the aluminium free material This could be
interpreted as a reduction of the clustering effect in the presence of aluminium It is clear that
the presence of aluminium in the Eu* doped materials does not eliminate the clustering and
that the aluminium effects the detailed hydrolysis and condensation rates in the process
Further work is necessary in order to (1) verify the presence of the clustering of the Eu* ions
in the sol-gel matrix through other measurement techniques and (2) to investigate in detail the
effect of the aluminium on both the clustering and the chemistry of the sol-gel process.
6.4 ConclusionThis chapter reported the results of the investigations into Aluminium - Europium codoped
samples It is concluded that the ad hoc addition of aluminium to a sol, hydrolysed with water
at a pH=l and a WaterTEOS ratio of 4, does not provide good dispersion of the Europium
The europium ions have a tendency to precipitate and form clusters The presence of these
clusters was confirmed by the measurement of a fast decay component in the Aluminium and
non Aluminium containing samples Based on the results presented in this and earlier chapters
it is concluded that the phonon quenching due to residual OH' ion content as well as fast
decay phenomena are responsible for the quick decay of the europium ion’s fluorescence It
is felt that the fast decay component measurement provides conclusive proof of the existence
of the clusters of europium ions
A problem that is not well understood is that of the form of the fast decay component Is
there just a single decay at such short timescales or are there a senes, discrete or otherwise,
of fast decays0 It is tentatively suggested that the fast decay component may take the form
of a senes of discrete fast decays each characteristic of a particular cluster type in a glass
environment
Chapter 6 Page 62
In conclusion the addition of aluminium to the sol-gel samples studied m this chapter did not
result in the wide dispersion of the europium ion The gel and partially densified samples
contained more residual OH groups than previously examined samples This was one of the
quenching mechanisms that are responsible for a fast decay in doped sol gel glass
Upon heating another fast decay mecharusm was observed m the sol gel system A |asec decay
time was observed in both aluminium and non aluminium containing samples This showed
that the aluminium was not able to disperse the europium ions as had been reported in the
case of neodymium by Berry
The measurement of the fast decay component corroborated earlier work by Devlm, [6], in
his report of a fast decay component m europium doped sol-gel glasses As can be seen in
Table 5 3 there was very little difference in the decay measurements for the pH=5 6 sample
set, and this was in agreement with the model proposed above The fluorescence ratios for
the 200°° samples are shown in Table 5 4
Chapter 6 Page 63
C hapter 7
Soak ing o f S o l-G el Sam ples in a E uropium N itrate Solution
7.0 Introduction
This chapter reports the work earned out on samples produced without any Europium doping
and subsequently soaked in a Europium solution Comparisons are made between the
characteristics of the soaked samples and those of the conventionally doped sol-gel samples
An effort is made to infer the nature of the position of the Europium ion in the soaked sol-gel
glass in order to determine whether or not the Europium ion does indeed reside m the
skeleton of the sol gel glass or within the pore structure A set of glasses, (Sample Set No 7),
were produced which contained no Europium These samples were then soaked for 48 hours
in a solution of Eu(NOj)3 in ethanol and dried for 24 hours at 73°C The samples were then
fumaced at various temperatures in order to examine the fluorescence characteristics of the
soaked samples as a function of temperature.
7.1 Soaked Samples
Earlier preliminary work, [1], on soaked samples of sol gel glasses had indicated that upon
soaking, the Europium ion was incorporated in a pore in the sol gel glass structure It was
suggested that the ion was attached to a pore wall and surrounded by water molecules and
that as the densification temperature increased the changing emission characteristics reflected
the differences between the soaked sample and a conventionally doped sol gel sample
A more comprehensive study was undertaken with a selection of glasses that were produced
with no Europium and then were soaked in a manner described above. The results of both the
fluorescence and lifetime measurements are shown m Figure 7 1 and Table 7 1 respectively
The dried gels were fumaced to 200°, 500° and 800°
7.2 Results and Discussion
The gel lifetime was measured to be 08ms (Method 1) This is of the order of the lifetime
of .lms reported by Kropp and Windsor, [2], in their study of Europium ion fluorescence in
Chapter 7 Page 64
Type xAv Method 1 + (OOl)ms
tAv Method 2 + (OOl)ms
Log-line + (0 05)ms
Gel 0 08 0 08 0 09
200° 0 29 0 29 0 29
500° 0 31 031 0 37
oo00 0 73 0 74 0 75
Table 7 1 Fluorescence Lifetimes for Soaked Samples ( Sample Set No 7, Room Temperature, X Excitation = 337nm)
Type tAv Method 1 +. (0 01)ms
t,v Method 2 +. (0 01)ms
Log-line +. (0 05) ms
Gel 011 011 0.12
200° 0 35 0 36 037
500° 0 51 054 0 58
800° 0 74 0 82 0 90
Table 7.2 Fluorescence Lifetimes for Conventionally Doped Samples, (pH=l, Room Temperature, k Excitation = 337nm)
solution. Examining the fluorescence spectra of the gel however shows that there is a marked
degree of asymmetry in the europium ions environment as in the conventionally doped gel
compared with the solution, (see Figure 7 3) This can be qualitatively appreciated from the
intensity of the 5D0-7F2 transition at 615nm, (refer to figure 7 1) The narrowness of the three
peaks m the spectrum of the gel show the characteristics of an ion in a liquid like
environment with the relative narrowness of the low energy 5D0-7F0 peak indicating a
restricted range of site geometries for the europium ion in the pore structure of the gel.
The implication is that the ion is incorporated into the pore structure and surrounded by the
molecules of the solution This would account for the quick excited decay and the mixture
of solution and gel emission characteristics In figure 7 2 the spectra of conventionally doped
sol-gel glasses are displayed. Here it can be seen that the spectrum of the gel sample is also
quite solution-like in its appearance However from Table 7 2 it can be noted that the lifetime
Chapter 7 Page 65
enc
ID
_Q
< ,
‘ coC<D
Wavelength (nm)
Figure 7.1 Fluorescent Spectra for Various Soaked Samples (pH=l, R=4 Sample Set No.4, RoomTemperature, k Excitation = 398nm)
Chapter 7 Page 66
I
if)-4—'ic_QL_
>N
‘ (0c<D
Wavelength (nm)
Figure 72 Fluorescent Spectra for Conventionally Doped Sol Gel Glasses. ( pH=l, R=4, RoomTemperature, X Excitation = =398nm)
Chapter 7 Page 67
Wavelength (nm)
Figure 7.3 Fluorescence Spectrum of a Europium Nitrate Solution Eu(NO,)l (Room Temperature XExcitation = 398nm)
Chapter 7 Page 68
measurements are quite different An explanation for the discrepancy is discussed m the nevt
paragraph
As the densification temperature increases the spectra of the samples fumaced to different
temperatures, (see Figure 7 1), acquire some of the characteristics of their conventionally
doped counterparts, (Figure 7 2) The lifetime measurements at both 200°C and 500°C for the
soaked samples are m no way similar to the lifetime measurements for the equivalent
conventional samples At T = 200°C the lifetime tAy = 0 29ms for the soaked sample and tAv
= 0 36ms for the conventionally doped sample This indicates that the Europium ion is in a
much different environment from the partially densified conventionally doped sample In
conventionally doped samples the 200°C sample has been described, (see Ch 4 Sec 4 3), as
representing a kind of intermediate step between gel and densified glass because it contains
a proportionally shorter lifetime than the treatment temperature would indicate However the
soaked sample lifetime at 200°C is much shorter again and so must contain a much higher
proportion of hydroxyl groups around the Europium ion At 500°C the lifetime for the soaked
sample is again less than for the conventionally doped sample The fluorescent spectrum of
the 500°C soaked sample is quite similar to the spectrum of corresponding conventional
sample but the lifetime measurements indicate that the environment is still quite different in
terms of hydroxyl group content So even though the soaked sample displays the splitting
associated with the high degree of asymmetry in a glassy state it must still contain a large
amount of OH' groups as evidenced by it’s comparatively fast decay time
The 800°C soaked sample displays a fluorescence spectrum that is very similar to that of a
densified gel. The broad transitions are matched by a long decay time of 0 73ms, this
compares very well with a lifetime of 0 74ms for the conventionally doped 800°C sample The
high energy 5D0-7F0 singlet transition is quite broad indicating that there are a large range
of environments for the europium ion. The similarities between the soaked and conventionally
doped sample are expected at a densification temperature of 800°C This is because at such
a relatively high temperature the densification process is nearly complete, [3] The sample
either soaked or conventionally doped will have adopted some or nearly all of the
characteristics of amorphous S i02 glass It is expected that for the soaked sample the
europium ion is included into the bulk of the glass sample at this temperature as a large
proportion of the pores have collapsed This makes its optical properties appear very similar
to the conventionally doped sol gel glasses where the europium is added at the solution stage
of the sol gel synthesis
Chapter 7 Page 69
It was emphasised in Chapter 4 Section 4 6 that the maximum Eu^ lifetime of approximately
lms measured m these studies is still quite low compared to the npical lifetime measurements
of approximately 2ms for Eu* in conventional glass It is thought that a significant
contribution to this small lifetime is the amount of residual OH' still present in the materials
even after densification to 800°C To confirm this hypothesis a senes of samples was
prepared, (Sample Set no 8), which were quenched m either air, water or D20
Base Catalysed, (pH=8), sol-gel samples were prepared at two temperature regimes, gels and
800°C The gel was dried after soaking in D20 and received no heat treatment and the 800°C
samples were quenched in Air, Water and Deuterium respectively They were then sealed in
individual containers and lifetime measurements were earned out The D20 samples werer
sealed in an airtight container and so were impervious to degradation by water vapour
Previous work, [2], on Eu* fluorescence in deuterated solutions had reported a decrease in
lifetime with time This was attnbuted to the effects of water vapour coming into contact with
the deuterated solution
Lifetime measurements were performed as it was considered that they were a more sensitive
indicator of the changes m the Eu* ions environment than were fluorescence spectra The
results of the lifetime measurements are tabulated in Table 7 3
From the data presented in Table 7 3 it can be seen that the forced quenching mechanisms
introduced have had a pronounced affect One the most notable things about these samples
is that they were base catalysed at a pH=8 This should have provided the Eu* ion with a
screened environment, (see chapter 5 Sec 5 3) making it less sensitive to changes in the
environment surrounding it As a guide to the lifetime measurements the decay time for the
air quenched sample compares very favourably to the measured decay time of 1 0 msec for
a pH=8, 800°C sample reported in Chapter 4, (Table 4 4) Using this result as a yardstick it
can be seen that the effect of the water and D20 on the decay times of 800°C samples is quite
significant The quenching in D20 results in the doubling of the decay time and the quenching
of the sample in water results m a reduction of approximately 30% m the measured lifetime
The lifetime of the water quenched sample is consistent with the presence of more water in
the Eu* environment compared to the air quenched sample The sample quenched in D20 has
a lifetime close to that expected for Eu* in conventional densified glass The pore surface is
saturated with OD' ions which do not cause quenching of the Eu* fluorescence as discussed
7.3 Deuteration of the Sol-gel Pores
Chapter 7 Page 70
in chapter 4 Finally the deuterated gel sample has a lifetime of 0 31ms, which is
approximately twice the \alue for the normal gel This is consistent with the presence of a
layer of water on the pore surface, much of which is not displaced by D:0 on soaking
It is concluded that the presence of OH ions in the sol-gel matrix i§ the mam contributor to
the reduced Eu* fluorescence lifetime Work is at present underway in this laboratory to
confirm this
Sample Type tAv Method 1 (msec + 0 01)
Gel 0 31
800° Air 0 91
800° Water 0 62
800° D20 20
Table 7.3 Fluorescent Decay Measurements for pH=8 Samples. (Sample Set No.8, Room Temperature, X Excitation = 337nm)
7.4 Conclusion
Based on the experimental work earned out on the fluorescence and lifetime properties it is
clear that the soaked samples have a unique combination of luminescence and lifetime
characteristics. Comparison with similar conventionally doped samples show clear differences
in lifetime measurements and / or fluorescent spectra. However the properties of the soaked
sample at 800° are in very good agreement with the properties of the conventionally doped
sol gel glass. It is suggested that at this temperature the Europium ion in the soaked sample
has become incorporated into the bulk structure of the glass as the increased densification
temperature causes the structure to decrease in volume collapsing the pore arrangement and
surrounding the Europium ion
On the basis of the results discussed m this chapter it is concluded that when the Europium
ion is added to the sol stage of the sol gel glass synthesis that it is distnbuted throughout the
structure, bearing m mind the conclusion from Chapter 6 The europium ion does not reside
m the pores of the gel structure as can be seen from the fluorescence spectra but more
especially from the lifetime measurements
Chapter 7 Page 71
C on clu d in g R em arks
This section summarizes the discussion of the properties of Eu“ doped sol-gel glasses and
includes various ideas for future work
Concluding Remarks
The motivation behind the work detailed m this thesis was to develop an understanding of the
structure of sol-gel glasses via the optical spectroscopy of the Eu* ion in it’s role as a
structural probe The optical emission characteristics of the Eu* ion are a sensitive indicator
of structural changes taking place within the sol-gel matrix
This study concentrated on explaining the changes in fluorescent spectra and decay times
brought about by deliberate changes to the starting materials The modified starting materials
were monitored as they were processed to different temperatures
Areas of investigation mcluded the role of sol pH, the confirmation of the role of OH‘ groups
as a large scale fluorescence quenching agent m sols and gels, this led to the investigation of
the role played by Water TEOS ratios m an attempt to determine whether there was an
optimum ratio for the acid and base catalysis of sol-gel samples Another significant area of
investigation was mto the role of Aluminium as a material codopant along with Europium
It was hoped to show that by addition of Aluminium, dispersion of Europium would occur
thus allowing higher dopant concentration However results indicated that the presence of
Aluminium encourages large scale water retention thus causing more fluorescence quenching
than in samples without Aluminium codopmg The role of Aluminium as a network modifier
in sol-gel systems was also investigated following the observation of a fast decay component,
(FDC), in both aluminium free and aluminium containing samples
Studies were also earned out to determine whether or not the Eu* ion resides in the pores
of the gel structure or in the glass matnx itself On the basis of the results presented in
Chapter 7 it was concluded that when dopant ions are incorporated m the sol stage that they
become enmeshed m the glass skeleton as the densification temperature increased It was also
found that high temperature sol-gel samples quenched in water suffered significant reduction
in decay time and those quenched in deutenum expenenced significant increases in decay
times
Conclusion Page 72
Suggestions for Further WorkSol-gel science and technology raises some questions that the use of the Eu* ion as a
structural probe may elucidate Based on the investigations reported in this thesis it is
suggested that the following might be representative of such
From Chapter 4
What exactly is the pH dependence in the asymmetry decrease of the fluorescence transitions
during the change from the sol to the gel 9 It appears that it may be associated with the
isoelectric point of Silica at pH=2 5
From Chapter 5
From the deuterated sample measurements in Chapter 4 it is known that the less OH groups
present m the structure the greater the fluorescence efficiency It would be important to
develop the Water TEOS experiments specifically at the sol to 200°C stage to determine how
the hydrolysis, condensation rates progress as a function of pH What would be the effect for
example of hypercritical drying on high pH samples at various waterTEOS ratios?
From Chapter 6
The question of Aluminium and other metal ion codoping, for example Na, [1], raises a lot
of questions about the role of the codopant as a network modifier. Based on the results
presented in this thesis it would appear that the Aluminium encourages fluorescence
quenching by retaining large amounts of water in the structure It does not, again based on
the results contained in this thesis, appear to disperse the Europium ions with any great degree
of efficiency This was confirmed by the observation of a fast decay component, (FDC), m
both Aluminium and Aluminium free sol-gel samples This was ascribed to clustering of the
europium ions m the sol-gel matrix It would be interesting to determine how many FDC’s
could be measured, [2], in a sol-gel Alumimum-Europium codoped sample Would it be
possible to discretize the time response of the decay to determine whether or not a particular
cluster type is resolvable in terms of a characteristic fast decay component?
Conclusion Page 73
References
Chapter I[1] Zachanasen, W H (1932), J Am Chem Soc 54, 3841
[2] Mc Craith, B D , Ruddy, V , Potter, C , O’Kelly, B , Mc Gilp, J F ELectromc Letters
27, 14
[3] Sakka, S "Proceedings of the Winter School on Glasses and Ceramics from Gels"
(1989) San Carlos Brazil p 346
[4] Berry, AJ , King, T A , (1989) J Phys D Appl Phys 22, 1419
[5] Bnnker, CJ , Scherer, G , "Sol Gel Science" Academic Press
[6] Hench, L , West, J (1990) Chem Rev 90 33
[7] Klein, L C, Garvey, G J, in "Ultrastructure processing of ceramics, glasses amd
composites" Hench, LL, Ulnch, D R, Eds Wiley (1984), p88
[8] Hench, L L, Wilson MJ, Balaban, C, Nogues, J L, "Sol-gel processing of large silica
optics". Proc of the 4th International Conference of Ultrastructure processing of
ceramics, glasses and composites, Tucson AZ (1989).
Chapter 2
[1] Yen, W M (1981) in Laser Spectroscopy of Solids Edited by W M Yen and PM
Selzer Topics in Applied Physics Series, Vol 49 Springer-Verlag, Berlin
[2] Imbusch, G F (1978), in Luminescence Spectroscopy, Edited by M. Lumb Academic
Press
[3] Demas, J N (1983) in Excited State Lifetime Measurements, Academic Press
[4] Imbusch, G F (1978), in Luminescence Spectroscopy, Edited by M Lumb Academic
Press
[5] Hufner, S (1978) in Optical Spectra of Transparent Rare Earth Compounds, Academic
Press
[6] Yen, W M (1989) in Laser Spectroscopy of Solids II. Topics in Applied Physics Vol
65 Edited by W M Yen, Spnnger-Verlag, Berlm.
[7] Devlin, K (1991) Ph D Thesis, Dublin City University
[8] Gallagher, PK (1964) J. Chem. Phys, 41,10, 3061
References Page 74
Chapter 3
[1] Demas, J N (1983) in Excited State Lifetime Measurements, Academic Press
[2] Lempicki et al (1981), J Chem Phys 74 10
[3] Bevmgton, P R , in Data Reduction and Error Analysis for the Physical Sciences Mc
Graw Hill, (1969)
Chapter 4
[1] Iler, R K , (1979), The Chemistry of Silica, Wiley Interscience
[2] Bnnker, C J , Scherer, G , m "Sol Gel Science" Academic Press, (1990)
[3] Gray, H J , Isaacs, A (1978) m A New Dictionary of Physics, Longman
[4] Hench, L , West, J (1990) Chem Rev 90 33
[5] Gallagher, P K , (1964) J Chem Phys 41 10 3061
[6] Brecher, C , Riseberg, L.A., (1980) J Non-Cryst Solids, 40 469
[7] Devlin, K , O’Kelly, B , Tang, Z R., M'Donagh, C., Mc Gilp, J F. (1991) J Non-Cryst
Solids, 135, 8
[8] James, P F , (1988) J Non-Cryst Solids, 100 93
[9] Weber, M , (1981) in Laser Spectroscopy of Solids, Edited by W Yen and M Selzer,
Springer-Verlag, Berlin
[10] Hench, L., West, J (1990) Chem Rev 90 33
[11] Bnnker, CJ , (1988), J Non-Cryst Solids, 100, 31
[12] Kropp, J L , Windsor, M , (1965), J Chem. Phys 42, 5, 1599
Chapter 5
[1] Bnnker, CJ , Scherer, G , in "Sol Gel Science" Academic Press, (1990)
[2] Hench, L , West, J (1990) Chem Rev 90 33
[3] Bnnker, CJ , (1988), J Non-Cryst Solids, 100, 31
[4] James, P F , (1988) J Non-Cryst Solids, 100, 93
References Page 75
Chapter 6
[1] Berry, A J , King, T A., (1988) J Phys D Appl Phys 22 1419
[2] Weber, MJ , (1990) J Non-Cryst Solids, 123, 208
[3] Arai, K , Namikawa, H , Kumata, K , Ishn, Y , Tanaka, H , Iida, I (1983), Japanese
Journal of Applied Physics, 22, 7, 397
[4] Peterson, G F , Bndenbaugh, P M , (1964), J Opt Soc Am , 54, 644
[5] Mullins, M E , Cormlsen, B C , Kline, A A , Sokolov, Lj M , Surapanmi, S (1991),
Proceedings of the VII International Conference on the Physics of Non-Crystalline
Solids, Cambridge, England.
[6] Devlin, K , (1991) Ph D Thesis Dublin City University
Chapter 7
[1] Devlin, K , O’Kelly, B., Tang, Z R , M'Donagh, C , Mc Gilp, J F. (1991) J. Non-Cryst.
Solids, 135, 8.
[2] Kropp, J L , Windsor, M , (1965), J Chem Phys 42, 5,1599
[3] Hench, L , West, J. (1990) Chem Rev. 90 33
Concluding Remarks
[1] Devlin, K , (1991) Ph D Thesis, Dublin City University
[2] Arai, K , Namikawa, H , Kumata, K , Ishn, Y , Tanaka, H , Iida, I. (1983), Japanese
Journal of Applied Physics, 22, 7, 397
References Page 76
Appendix 1: Programme Listings
Data Acquisition Programme "Aver2"
This progjam was used to run the fluorescence scans o f the Euv doped sol-gel glasses It provided the spectrometer motor control and performed the data acquisition
10 REM ****20 REM ** **30 REM ** LUMINESCENCE **40 REM ** **
50 REM ** SIGNAL AVERAGED **60 REM»* **
70 REM ****75 CLS77 MODEO80 PRINT PRINT PRINT 90 PRINTTAB(5100 PRINTTAB(5,6)”* *"110 PRINTTAB(5,7)"* DATA ACQUISITION PROGRAM *"120 PRINTTAB(5,8)"* *"125 PRINTTAB(5,9)"* KEVIN DEVLIN D C U *130PRINTTAB(5.9)"************************************”132 PRINTTAB(5,12)"OPTIONS AVAILABLE"133 PRINTTAB(5,14)"(A) Scanning Emission Spectrometer*134 PRINTTAB(5,16)”(B) Scanning Excitauon Spectrometer”136 INPUTTAB(5,18)”CHOICE= ".CHS140 CLS 150 CLOSE«)160 MODEO 170 A=AFCF0180 7(A+11)=&C0 , (A+2)=&70 ’ (A+4)=6 ’ (A+5H*190 C=0200 INPUTTAB(5,5)" NUMBER OF SAMPLES PER POINT .A V 210 PRINTTAB(5,15)" CHECK TO SEE IF SLIT IS CLOSED"220 K=GET 230 FOR T=1 TO 10 240 7A=16 '>(A+12)=&0C “>(A+12)=&0E 250 a=0>(A+l))*16K', (A))MOD16 260270 C=C+a 280 PRINTa 290 NEXT 300 B=C DIV 10310 PRINTTAB(5,15)"BACKGROUND D C SIGNAL ="B 320 K=GET 330 CLS 340350 PRINTTAB(5,5) "ADJUST FOR MAX SIGNAL"360 PRINTT AB(5,10)"TYPE R TO CONTINUE"370 K=GET380 ^ A+12)=&0C.9(A +12)=&0E 390 IN='>(A+l)*16f,J(A)MOD16 400 PRINTTAB(5,15)"MAX SIGNAL ="B-IN 410 IF K o 6 9 AND K o 8 2 THEN 370
Appendix 1 pa.c 1
420 IF K=Ó9 THEN 380430 PRINT440 PRINT450 CLS460 *DRJVE0470 PRINT480 PRINT SAMPLE SPECTRUM"490 PRINT500 a=OPEMN"START INPUT#a, Start 510 b=OPENIN"END" INPUT#b,End 520 c=OPENIN"Inc" INPUT#c,Inc 530 CLOSE#0540 PRINT Starting wavelength "Start 550 PRINT560 PRINTFimshing wavelength "End 570 PRINT580 PRINTIncremental rate "Inc 590 P=(End-Start)/Inc+l 600 PRINT610 INPUT Do you want to change wavelength range y/n” 620 IF GETS="Y" THEN PROCINIHAL 630 MODE4640 DIM Y(2505) DIM K (l)650 PROCwave 660 PROCADC 670 PROCDATA 680 PROCSAVE690 INPUT TAB(0,8)’ Do you want a copy on chart recorder700 IF GET$="Y" THEN PROCDAC710 PROCDRAW720 PROCLABLE730 * DIUVE0740 END750 DEF PROCINITIAL 760 PRINT PRINT PRINT 770 INPUTS tailing wavelength ".Start 780 PRINT790 INPUTFimsh wavelength "JEnd 800 PRINT810 INPUT Incremental rate "Jnc 820 P=(End-Start)/Inc+l 830 ENDPROC 840850 DEF PROCDATA 860 X=0870 Al=Startb=l d=&FCC0 7(d+3)=128880 CLS M=1890 FOR D=1 TO P900 PROCAVERAGE903 IF CHS="A" THEN GOTO 910905 IF CHS="B" THEN PROCSTEP2906 GOTO 920 910 PROCSTEP920 PRINTTAB(5,5)A1930 MOVE X,Y(D)/2 DRAW X,Y(D)/2940 X=X+1200/P950 A1=A1+Inc
960 NEXT970 ENDPROC980 DEF PROCDRAW990 MOVE 0,0 DRAW 0,9001000 DRAW 1200 900 DRAW 1200,01010 DRAW 0,01020 VDL51030 MOVE 250 1000 PRINT’Intensiry vs Wavelength1040 MOVE -10,910 PRINT 'I" MOVE 590,910 PRINTT MOVE 1190,910 PRINT I"1050 ENDPROC1060 DEF PROCLABLE1070 MOVE -150,950 PRINTStart1080 MOVE 900,950 PRINTEnd1090 VDU41100 ENDPROC1110 DEF PROCDAC1120 Al=Start1130 FOR D=1 TO P1140 V=2048-(Y (D))1150 d?b=(V)DrV161160 <T2=((V)MOD 16)* (1+16*b)1170 PRINTTAB(5,5)A1 1180 A1=A1+Inc 1190 FOR 1=1 TO 200 NEXT 1200 NEXTD 1210 ENDPROC 1220 12301240 DEF PR OC ADC 1250 A=&FCF0 1 2 6 0 ,>(A+11)=&C0 1270 ?(A+2)=&70 1280 ?(A+4)=6 1290 ’(A+5)=0 1300 ENDPROC 1310 DEF PROCSAVE1320 INPUT TAB(0,6)" Do you want to save y/n"1330 IF GETS='N" THEN ENDPROC 1340 INPUT TAB(5,8)”Name of file * BS 1350 Y=OPENOUT(BS)1360 PRINT#Y .StartJEndJnc 1370 FOR D=1 TO P 1380 PRINT# Y,Y(D)1390 NEXT 1400 CLOSE«)1410 ENDPROC1420 DEF PROCwave1430 a=OPENOUT" ST ART" PRINT#a,Start1440 b=OPENOUT’END" PRINT#b.End1450 c=OPENOUT"INC" PRINT#cJnc1460 CLOSE#01470 ENDPROC1480 DEF PROCAVERAGE1490 YD1=0-YD=01500 FOR Q=1 TO AV1510 ’A=161520 ?(A+12)=&EC
Appendix 1 Page 3
1530 , (A+12)=&CE1540 YD=B-('’(A+l)M6+', (A)MOD16)1550 YD1=YD1+YD1560 NEXT1570 Y(D)=YD1/AV1580 Y(D)=ABS Y(D)1590 ENDPROC1600 DEFPROCSTEP1610 '>&FE62=&031620 FOR L=1 TO IncMOO1630 ,,&FE60=11640 ”>&FE60=01650 NEXT1660 ENDPROC1670 DEF PROCSTEP21680 '>&FE62=&071690 FOR L= 1 TO Inc* 61700 XR=254 YR=2501710 '>&FE60=XR1720 FOR K=1 TO 50 NEXT K1730 , &FE60=YR1740 FOR K=1 TO 50 NEXT K1750 NEXT L1760 ENDPROC
Appendix 2 Programme Listings
Data Acquisition and Control Programme "Lifet"
This programme earned out all the lifetime measurements described in this report, saved the data and then called an analysis programme "Compstw",(See Appendix 3)
1020 REM DATA ACQUlSm ON PROGRAM3040 REM FOR SR400 PHOTON COUNTER.5060 REM Kevin Devlin 19/10/89 D C U70 MODE7 90 CLS »SHADOW100 PRINT TAB(5)"****************************"110 PRINT TAB(5)’’**DATA ACQUISITION PROGRAM**"120 PRINT TAB(5)"**FOR SR400 PHOTON COUNTER**"130 PRINT TAB(5)"***»************************" PRINT 140 PRINT "PRESS C TO CONTINUE" XS=GETS PRINT 150 IF XS="C" ELSE GOTO 90160 INPUTSPECTROMETER WAVELENGTH ",SWS PRINT170 INPUTSLIT WIDTH (nun) ’ .SL5.PRINT180 INPUT INPUT DATAFILE NAME TO BE STORED ON DISCOS PRINT190 X=OPENIN(" 2"+F$)200 IF X o O THEN PRINT**DATA FILE ALREADY EXISTS**" CLOSED PRINT ELSE 230 210 PRINTPRESS C TO CONTINUE OR ANY KEY TO RENAME’ X$=GETS 220 IF X$='C" THEN 230 ELSE 90 230 *DEEE240 cmd%=OPENIN("COMMAND")250 data%=OPENIN("DATA”)260 ESTRS=CHR$(13)+CHR$(10)270 PRINT#cmd%,"END OF STRING" JESTRS 280 PRINT#cmd%,"BBC DEVICE N0",0 290 PRINT#cmd%,"CLEAR"300 PRINT#cmd%,"REMOTE ENABLE"310 PRINT#cmd%,"UNLISTEN"320 photon%=OPENIN(’23")330340 REM *********INPUT OF INITIAL SETUP PARAMETERS********350360 PRINT#cmd%, "LISTEN",photon%,"EXECUTE"370 PRINT#data%,"CM,CI0;GD0,NP;DL0#W0;GY0,CP2"380 PRINT#cmd%,"UNLISTEN"390 PRINT#cmd%,’TALK",photon%400 INPUT#data%,CCM$,CCIO$,GGDOSJJNP$J>DLOS,GGWO$,GGYO$,CCP2S 410 PRINT#cmd%,"UNTALK"420 NNP=VAL(NNPS)425 DIM V(NNP+30)3(NNP+30),Q(NNP+30)430440 REM Display of parameters of significance to measurement of lifetimes 450460 CLS470 PRINT TAB(5)"**DATA ACQUISITION PROGRAM**"480 PRINT TAB(5)"**FOR SR400 PHOTON COUNTER**" PRINT
Appcrdix 2 D_;.' 1
490 PRINT DATA RLE "TAB(20),FS PRINT500 REM PRINT COUNTING MODE TAB(20),CCMS PRINT510 PRINT' NO OF TRIGGERS TAB(20),CCP2S PRINT520 PRINT NO OF POINTS"TAB(20),NNPS PRINT530 PRINT "A DISC LEVEL"TAB(20),DDL0S PRINT540 PRINT 'GATE A SCAN STEP TAB(20),GGY0S PRINT550 PRINT "GATE A WIDTHTAB(20),GGW0S PRINT560 PRINT "GATE A DELAY"TAB(20),GGD0S PRINT565 PRINTPress COM on SR400 and then ESCAPE to stop scan* PRINT570 TIME=0 REPEAT UNTIL TIME =500580 PRINT PRINT "AT POINT NUMBER" PRINT590 PRINT’""COUNTER READING""" PRINT600 REM*****»*»**»****************************” *****” ******610620 REM *********START OF DATA A C Q U ISm O N ***630640 r e m ******************************************************’650660 REM*****“ * ******* ****Clear counters.Start scan.**************' 670680 PRINT#cmd%,"LISTEN" ,photon%,"EXECUTE"690 PRINT#data%,"CR,CS"700 PRINT#cmd%,"UNLISTEN"710720 REM*******************PoII for data ready ********************730 SSSl=0-QQA=0QQB=O740 PRINT#cmd%,"LISTEN" ,photon%,"EXECUTE"750 PRINT#data%,"SSr 760 PRINT#cmd%,"UNLISTEN"770 PRINT#cmd%,"TALK’ ,photon%780 INPUT#data%,SSS 1S 790 PRINT#cmd%,"UNTALK"800 SSS1=VAL(SSS1$)810 IF SSS1=0 THEN 740 820830 REM **********»****»»»»****Read data value *****************840 FOR 1=1 TO NNP850 PRINT#cmd%,"LISTEN" ,photon%,"EXECUTE"860 PRINT#data%,"QA"+STR$(I)865 PRINT#data% ,"QB"+STR$(I)870 PRINT#cmd%,"UNLISTEN"880 PRINT#cmd%,"TALK".phoion%890 INPUT#data%,QQAS,QQBS 900 PRJNT#cmd%,"UNTALK"910 PRINTTAB(20,20), 1-1920 QQA=VAL(QQAS) QQB=VAL(QQBS)930 IF QQA=-1 THEN GOTO 850 940 D=I+9 V(D)=QQA B(D)=QQB 950 PRINT PRINT PRINT QQA 960 NEXT I970 PRINT#cmd%,"REMOTE DISABLE"980 CLOSE#photon%990 CLOSE#data%
1000 CLOSE#emd%1010 CLOSEM)1015 PROCDIVIDE 1020 PROCSAVE
Append \ 2 P^:. 2
1025 CHAIN"COMPSTW"1030 END 10401050 REM**»*************Save data to disk. 10601070 DEF PROCSAVE 1080 »DISK1090 Q(0)=VAL(CCMS)1100 Q{1)=VAL(CCI0S)1110 Q(2)=VAL(GGD0S)1120 Q(3)=VAL(NNPS)1130 Q(4)=VAL(DDL0S)1140 Q(5)=VAL(GGW0S)1150 Q(6)=VAL(GGY0$)1160 Q(7)=VAL(SWS)1170 Q(8)=VAL(SLS)1175 Q(9)=VAL(CCP2S)1180 PRINT PRINT PRINT 1190 X=OPENOUT(" 2 "+FS)1200 FOR 1= 0 TO (NNP+9)1210 PRINT#X,Q{I)1220 NEXT!1230 CLOSE#)1240 ENDPROC 12501260 REM*************‘ *Stop scan*******' 12651270 DEF PROCCLEAR 1280 PRINT#cmd%/LISTEN\photon%"EXECUTE 1290 PRINT#daia%,'CH^IE0ir 1300 PRINT#cmd%,’'UNLISTEN"1305 FOR 1=1 TO 1000.NEXT1310 ENDPROC13201330 REM*****************Calculate mie signal 13401350 DEF PROCDIVIDE1355 BMAX=-I001360 FOR 1=10 TO (NNP+9)1370 IF B(I)>BMAX THEN BMAX=B(I)1380 NEXT1390 FOR 1=10 TO (NNP+9)1400 B(I)=B(I)/BMAX 1410 Q(D=V(I)/B(I)1420 NEXT 1430 ENDPROC
Appendix 3 Programme Listing
Data Analysis Programme "Compstw"
This programme analysed the decay curves using a weighted least squares semi-log plot
10 REM ***20 REM *** ****30 REM *** 1 Weighted Least square fit of decay curve ****40 REM *** semi-log plot. ****
50 REM *** ****
55 REM *** 2. Component stripping for two component ****56 REM *** lifetimes. **#*
57 REM *** ****
60 REM 1 * '80 CLEAR90 »DRIVE2
100 MODEO110 DIM V(12)120 *
130 PRINT PRINT.PRINT 140 INPUTName of data file" 3 $150 L=OPENIN(B$)160 FOR 1=0 TO 9 170 INPUT#L,V(I)180 NEXT 190 CLS200 CM=V(0) CI=V(1) GD=V(2) NP=V(3) DL=V(4) GW=V(5)-GY=V(6)210 N=NP ume=GY 220 DIM Y(N),Y1(N),Y2(N)230 FOR i=l TO N -l INPUT#L,Y(i) NEXT CLOSESO 240 B=0250 PROCCALCULATE PROCDRAW^ROCINTENSITY.PROCRESETPROCDUMP260 END270280 DEF PROCCALCULATE REM Calculates max290 YMAX=0-YMIN=100 REM & mm values of300 FOR i=l TO N -l REM decay curve310 IF Y(i)>YMAX THEN YMAX=Y(i)320 IF Y(i)<=YMIN THEN YMIN=Y(i)330 NEXT i 340 ENDPROC 350360 DEF PROCDRAW _REM Plots decay370 X=100 .REM curve on380 FOR 1=1 TON-1 REM monitor390 REM Y(7)=Y(7)-YMIN400 MOVE X,(Y(I)*900/YMAX) DRAW X,(Y(I)*900/YMAX)410 X=X+1200/N NEXT 430 ENDPROC 440450 DEF PROGNTENSITY 460 VDU4 VDU 29,50:950; X=50
A ppendix 3 Page 1
470 Ylmax=-100 Ylmin=100480 PROCCALC2490 FOR 1=1 TO N-l500 Y=Yl(I)*-900/Ylmin510 MOVE X+2.Y+2 DRAW X-2 Y-2520 MOVE X 2,Y+2 DRAW X+2.Y-2530 X=X+1200/N NEXT I540 PROCZOOM550 STA=S FIN=F560 T=STA*ume P=FDM -STA P=P+1570 w=0 wl=0 w2=0 w3=0 w4=0580 REM SLOPE OF SLOW COMPONENT590 FOR 0=STA TO FIN600 PROCSUM T=T+time NEXT O610 PROCSLOPE PROCEQ620 w=0 wl=^) w2=0 w3=0 w4=0630 PROCCALCULATE2640 T=0 X=50"FOR 0 = 2 TO N650 Y1(0>=LN(Y2(0)/Iinax)660 Y=Y1(0)*-900/Ylmm MOVEX.Y DRAW X.Y670 P=N PROCSUM T=T+nme680 X=X+1200/N NEXT O PROCSLOPE690 w=0 w l=0 w2=0 w3=0 w4=0700 PROCZOOM710 STA=S.FIN=F T=(Ume)»STA720 FOR 0 = STA TO FIN730 Y1(0KY(0)-Y2(0))740 IF Y1(0)<=0 THEN GOTO 770 750 Y1 (0)=LN(Y 1 (0)/(YMAX-Imax))760 PROCSUM770 T=T+nme.NEXT O780 PROCSLOPE PROCEQ ENDPROC790800 DEF PROCSUM805 WEIGHT=(1/(Y1(0)*(-1)))860 w=w+WEIGHT REM sum w870 wl=wl+WEIGHT*T*Yl(0) .REM sum t*y 880 w2=w2+WE!GHT*T REM sum l 890 w3=w3+WEIGHT*Yl(0) REM sum y 895 w4=w4+WEIGHT*T*T REM sum sqr t 900 ENDPROC 910920 DEF PROCSLOPE935 SIope=((w*wl)-<w2*w3))/((w*w4)-(w2*w2))940 Iniercepi=((w4*w3)-(w2*wl))/((w*w4)-(w2*w2))950 PRINTTAB(0,20)Slope 960 LIFT=-1/S lope 970 PRINTTAB(0,25)LIFT 980 ENDPROC 990
1000 DEF PROCEQ 1010 T1=0 X=50 FOR p=l TO N 1020 Yl(p)=Tl*Slope+IntercepcY=Yl(p)*-900/Ylmm 1030 MOVE X.Y DRAW X.Y X=X+1200/N Y2(p)=EXP(Yl(p))*YMAX 1040 Tl=Tl+ume NEXT p 1050 ENDPROC 1060
Appendix 3 Pj^e 2
1070 DEF PROCZOOM 1080 *FX4,11090 C=400 hold=0 M=0 UZ=0 1100 MOVE C,50 PLOT 6.C.-900 1110 PRINT TAB(0,0),"1120 PRINT TAB(0,0), Slow [ ,CHRS(200), 1 CHRS(201),"] Fasi[<>] HOLD(tt) EXPAND (E) REMOVE
(R>\1130 XS=GETS1140 IF XS=CHRS(136) THEN PROCBAR(-1200/N)1150 IF XS=CHRS(137) THEN PRC)CBAR(1200/N)1160 IF XS=nH" THEN PROCHOLD1170 IF XS=">" ORXS=" " THEN PROCBAR(10*1200/N)1180 IF XS="<" ORXS=Y THEN PROCBAR(- IO* 1200/N)1190 IF XS="R" THEN PROCREMOVE 1200 IF XS="E" THEN PROCEXPAND 1210 IF M=1 THEN GOT01230 1220 GOTO 1130 1230 ENDPROC 12401250 DEF PROCBAR0)1260 MOVE C.50 PLOT 6.C.-900 1270 C=C+I1280 IF 0 1 2 5 0 THEN C=50 1290 IF C<50 THEN C=1250 1300 MOVE C^O-PLOT 6.C.-900 1310 ENDPROC 13201330 DEF PROCHOLD 1340 PRINTTAB(0,0)*1350 IF hold =1 THEN PRINT TAB(0,0),"Pomt already held press R to remove " XS=GETS GOTO 1450 1360 UZ=1200/N POINT=((C-50)/UZ)1370 F=POINT 1380 VDU5 1390 PLOT 4.C.-900 1400 PLOTO.2,-4 1410 PRINT CHRS(202),1420 VDU4 1430 hold=l1440 O C+UZ MOVE C.50 PLOT 6.C.-9001450 ENDPROC14601470 DEF PROCREMOVE 1480 IF hold=0 THEN GOTO 1570 1490 J=C1500 C=INT(POINT)1510 hold=01520 GCOL4.1 PROCHOLD1530 MOVE C.50 PLOT 6.C.-900 C=C+UZ.MOVE C,50J>LOT 6.C.-9001540 hold=01550 C=J1560 GCOLO.l1570 ENDPROC15801590 DEF PROCEXPAND 1600 PRINTTAB(0,0),"1610 D=((C-50)/UZ)1620 S=D
A p p e n d i x 3 P ^ 2t 3
1630 IFS>F THEN TEMP=S S=F F=TEMP 1640 PRINT S J 1650 M=1 1660 W=1 1670 EVDPROC 16801690 DEF PROCRESET 1700 *FX4,0 1710 ENDPROC 17201730 DEF PROCCALC2 1740 FOR 1=1 TO N -l 1750 IF Y(I>c=0 THEN 1790 1760 Y1(I)=LN((Y(I))/YMAX)1770 IF Yl(I)>Ylmax THEN Ylmax=Yl(I) 1780 IF Yl(I)<=Ylmin THEN Ylmin=Yl(I) 1790 NEXT I 1800 ENDPROC 18101820 DEF PROCDUMP1830 DS=GETS IF D$="D" THEN CALL D%1840 ENDPROC18501860 DEF PROCCALCULATE21870 Iraax=-100 Inun=1001880 FOR i= l TO N1890 IF Y2(i) > Imax THEN Imax=Y2(i)1900 IF Y2C0 <= Imin THEN Imin=Y2(i) 1910 NEXT I.ENDPROC
' ppcndix 3 Pa
Appendix 4 Programme Listing
Programme Listing "H a lf of 84"
This programme analysed the decay curve data, to determine an average lifetime, in two ways Numerical Integration and Simpsons Rule
10 »SHADOW11 REM***********..........12 REM***** *****13 REM***** THIS PROGRAM CALCULATES THE LIFETIME BY TWO *****14 REM***** SEPERATE METHODS *****15 REM***** *****16 REM***** 1 NUMERICAL INTEGRATION *****17 REM***** 2 AREA UNDER THE CURVE SIMPSONS RULE *****18 REM***** GER ENNIS, D C U 1991 *****19 r e m ***********************************************************20 CLEAR 30 *DRIVE0 40 MODEO 50 DIM V(12)6 0 *70 PRINT PRINT PRINT 80 INPUTName o f data file’ 3 $90 L=OPENIN(BS)
100 FOR 1=0 TO 9 110 INPUT#L,V(I)120 NEXT 130 CLS140 CM=V(0) CI=V(1) GD=V(2) NP=V(3) DT=V(4) GW=V(5)-GY=V(6)150 N=NP160 nme=GY170 DIM Y(N)J(N),K(N)180 FOR i= l TO N -l INPUT#L,Y(i) NEXT CLOSE«)190 B=0191 r e m ***********************************************************192 REM***** *****193 REM***** PROC THE PROGRAMS "FUNCTIONS’ *****194 REM***** *****195 REM***********............200 PROCCALCULATE PROCDRAW PROCBACKGROUND-PROCZOOM ST=F EN=K 205 PROCMEANLEFE PROCMEANLIFE1 ST2=FJEN2=K PROCSELPHO PROCSILPHOl PROCINFO 210 PROCSILPHO PROCSILPHOl PROCINFO 220 END224 r e m **********************************************************225 REM***** *****226 REM***** PROCCALCULATE MAX+MIN VALUES *****227 REM***** *****228 REM********************......................230 DEF PROCCALCULATE240 YMAX=0 YMDs-100
Appendix - Pw.e I
250 FOR i=l TO N-l260 IF Y(i)>YMAX THEN YMAX=Y(i)270 IF Y(i)<=YMIN THEN YMIN=Y(i)280 NEXT i290 EVDPROC2V4 K_tM -----------------------------------295 REM **** ***»
2% REM **** PROCDRAW DRAW ON SCREEN *****297 REM ****300 DEF PROCDRAW310 X=50320 FOR 1=1 TON-1330 REM Y(I)=Y(I)-YMIN340 MOVE X,(Y(I)*900A'MAX) DRAW X,(Y(I)*900/YMAX)350 X=X+I200/N NEXT360 ENDPROC370 REM***************************380 REM**** ***♦
390 REM**** PROCEEDURE TO CALCULATE LIFETIMES STARTS HERE400 REM**** ♦ »**410 REM***************************420 REM430 REM440 REM441 REM **************************442 REM **** ****
443 REM ***• PROCMEANLIFE »*•*
444 REM **** ****445 REM **************************450 DEF PROCMEANLIFE460 K1=0470 FOR C=ST TO EN480 J(C)=Kl*Y(Q*ume490 Kl=K l+am e500 NEXT510 FOR G=ST TO EN520 X = J(G)530 XI =X1+X540 NEXT G570 MEAN =X1580 ENDPROC590 REM600 REM610 REM620 REM **************************630 REM **** »»*»
640 REM **** PROCMEANLIFE 1 ****650 REM **** *»**651 REM **************************652 REM653 REM660 DEF PROCMEANLIFE 1670 FOR C=ST TO EN680 J(C)=Y(C)*urae690 NEXT700 FOR H=ST TO EN710 H1=H1+J(H)
-ifpe - \ - Pj . v
720 NEXT H740 MEAN 1=H1750 PRINT PRINT PRINT760 REM THESE ARE THE TWO SUMS NEEDED************ 780 PRINT PRINT 800 PRINT 810 ENDPROC820 DEF PROCBACKGROUND 830 Ql=NP-30 B=0840 FOR 1=1 TO 20 B=B+Y(I+Q1) NEXT850 B=B/20860 FOR 1=1 TO NP870 IF Y(1)<=B THEN GOTO 890880 NEXT890 NP=I900 ENDPROC910 DEF PROCCHECK920 I1=YMAX/EXP1930 FOR 1= 1 TO NP940 IF Y(I) <11 THEN GOTO 960950 NEXT960 EPl=I*ume PRINT 1/EXP1 ",EP1970 PRINT980 I2=YMAX/EXP2990 FOR 1=1 TO NP1000 IF Y(I)<12 THEN GOTO 10201010 NEXT1020 EP2=I*tune PRINT "1/EXP2 ".EP21030 PRINT1040 I3=YMAX/EXP31050 FOR 1=1 TO NP1060 IF Y(I>cI3 THEN GOTO 10801070 NEXT1080 EP3=I*tune PRINT 1/EXP3 " iP 3 1090 ENDPROC1095 REM************************************************1096 REM ***** ***1097 REM ***** REM DEF PROCZOOM1098 REM ***** ***'1099 REM************************************************1100 DEF PROCZOOM 1110 *FX4,11120 C=50 HOLD=0 M=0 UZ=0 1130 MOVE C,0 PLOT 6.C.900 1140 PRINT TAB(0,0),"1160 XS=GETS1170 r e m ************************************************1171 REM***** ***'1180 REM SELECTION OF GRAPH POINTS BEGINS HERE1181 REM***** ***' 1190 REM************************************************1200 IF XS=CHR$(136) THEN PROCBAR(-l200/N)1210 IF X$=CHR$(137) THEN PROCBAR(l200/N)1220 IF XS="H” THEN PROCHOLD1230 IF XS=">" OR XS=\" THEN PROCBAR(10*1200/N)1240 IF XS="<" OR XS=\" THEN PROCBAR(-10*1200/N)1260 IF XS="E" THEN PROCEXPAND
1270 IF M=1 THEN GOTO 12901280 GOTO 11601290 ENDPROC1295 REM .............. . . » ................. ..12% REM»****1310 REM DEFINITION OF PROCBAR 1320 REM *****1330 REVi********.......................................................................1340 DEF PROCBAR(I)1350 MOVE C,0 PLOT 6,C,900 1360 C=C+I1370 IF 0 1 2 5 0 THEN C=50 1380 IF C<50 THEN C=1250 1390 MOVE C,0 PLOT 6,C,900 1395 POINT= ( (C-50)*N/1200)1400 PRINT TAB(O.O),"POINT N O " POINT 1410 ENDPROC1420 REM***********************************************1421 REM ***** **«1430 REM SETTING THE CURSOR 1440 REM SETTING UP THE LINEHOLD1444 REM ***** **<1445 REM***********************************************11446 DEF PROCHOLD 1450 PRINT.PRINTPRINT1470 UZ=1200/NK)INT=((C-50)/UZ)1480 F=POINT 1500 PLOT 4,C,900 1510 PLOT 0^,-41550 C=C+UZ MOVE C,0 PLOT 6.C.900 1560 ENDPROC1565 REM***............1566 REM ***** **•1567 REM ***** PROCEXPAND- THE SECOND NUMBER.1568 REM ***** ***1569 REM************************************************1570 DEF PROCEXPAND 1580 K=((C-50)*N/1200)1590 PRINT FJC1591 @%=&202071592 PRINT Y(F), Y(K)1595 M=11600 ENDPROC1601 REM**********************************.......... •***••*••1602 REM ***** ***1603 REM ***** PROCINFO PRINTS THE ANSWERS1604 REM ***** ***1605 REM************************************************ 1610 DEF PROCINFO1620 PRINT TAB(56,0)"FTLENAME "3$1630 PRINT TAB(59,1)"1635 @%=101636 PRINT TAB(56,2)"NUMERICAL INT’N",1640 PRINT TAB(56,4)"LIFETIME= \X1/H1 1650 ENDPROC1655 REM************************************************1656 REM ***** ***'
V'7." J'\ -I Pj.e -
1657 REM ***** PROCSILPHO SIMPSONS METHOD1658 REM ***** *****1659 REM*******.............................................. .....................................................1660 DEF PROCSILPHO 1670 Kl=01680 FOR C=ST2 TO EN2 1690 J(C)=Kl*Y(C)*ume 1700 Kl=Kl+ume 1710 NEXT1720 S=ume FL=J(ST2) LF=J(EN2) ER1=0- RE 1=0- MEAN=0 1730 FOR Z=(ST2+1) TO (EN2-2) STEP 2 1740 ER=J(2)1750 ER1=ER1+ER 1760 NEXT Z1770 FOR B=(ST2+2) TO (EN2-1) STEP 21780 RE=J(B)1790 RE1=RE1+RE1800 NEXT B1810 MEAN=(S/3)*((FL+LF>+(4*ER 1)+(2*RE 1))1820 ENDPROC1821 REM*************............ ***...........*...........**•**•**•***••»***•**.1822 REM ***** *****1823 REM***** PROCSILPHOl SECOND SIMPSON NUMBER1824 REM ***** *****1825 r e m ******************************************************1 1830 DEF PROCSILPHOl1840 FOR O S T 2 TO EN2 1850 J(Q=Y(Q*ume 1860 NEXT1870 S=time FL=J(ST2) LF=J(EN2) ER1=0- RE 1=0- MEAN1=0 1880 FOR Z=(ST2+1) TO (EN2-2) STEP 2 1890 ER=J(Z)1900 ER1=ER1+ER 1910 NEXT Z1920 FOR B=(ST2+2) TO (EN2-1) STEP 21930 RE=J(B)1940 RE1=RE1+RE1950 NEXT B1960 M E A N 1 = (S /3 )*((F L + L F > + (4 *E R 1 M 2 *R E 1 ))1966 @%=101%7 PRINT TAB(56,8)"SIMPSONS MTH’D",1968 PRINT TAB(56,10)"LIFETIME =", MEAN/MEAN1 1970 ENDPROC
Appcnci n -