132
STRUCTURAL MAPPING OF OLKARIA DOMES GEOTHERMAL FIELD USING GEOCHEMICAL SOIL GAS SURVEYS, REMOTE SENSING AND GIS Samuel Kinyua Munyiri Faculty of Earth Sciences University of Iceland 2016

STRUCTURAL MAPPING OF OLKARIA DOMES
GEOTHERMAL FIELD USING GEOCHEMICAL
SOIL GAS SURVEYS, REMOTE SENSING AND
GIS
Samuel Kinyua Munyiri
Faculty of Earth Sciences University of Iceland
2016


Structural Mapping of Olkaria Domes Geothermal Field using Geochemical Soil Gas
Surveys, Remote Sensing and GIS
Samuel Kinyua Munyiri
60 ECTS thesis submitted in partial fulfillment of a Magister Scientiarum degree in Geology
Advisors Dr. Björn S. Harðarson
Gunnlaugur M. Einarsson
Faculty Representative Prof. Þorvaldur Þórðarson
Faculty of Earth Sciences School of Engineering and Natural Sciences
University of Iceland Reykjavik, May 2016


Structural Mapping of Olkaria Domes Geothermal Field using Geochemical Soil Gas
Surveys, Remote Sensing and GIS
60 ECTS thesis submitted in partial fulfillment of a Magister Scientiarum degree in
Geology
Copyright © 2016 Samuel Kinyua Munyiri
All rights reserved
Faculty of Earth Sciences
School of Engineering and Natural Sciences
University of Iceland
Sturlugata 7
101, Reykjavik
Iceland
Telephone: 525 4000
Bibliographic information:
Munyiri S. K., 2016, Structural Mapping of Olkaria Domes Geothermal Field using
Geochemical Soil Gas Surveys, Remote Sensing and GIS, Master’s thesis, Faculty of Earth
Sciences, University of Iceland, pp. 104.
Munyiri S. K., 2016, Kortlagning jarðlaga og höggunar við Doma Olkaria háhitasvæðisins í
Keníu útfrá mælingum jarðvegsgasa og fjarkönnun, Master’s thesis, Faculty of Earth
Sciences, University of Iceland, pp. 104.
Printing: Háskólaprent, Fálkagata 2, 107 Reykjavík, Iceland, May 2016.


Abstract
Olkaria Geothermal field is a high temperature geothermal system located on the eastern
arm of the East African Rift System. It is placed within the Central Kenya Rift Valley and
is dominated by late Quaternary rhyolitic volcanism. Basalts, tuffs and trachytes occupy the
subsurface with the latter forming the reservoir rock. Normal faulting mapped during this
study is prominent in the Domes field with dips ranging from 20° to 80° to the west and the
east. Fault strikes vary from north-south, northwest-southeast, northeast-southwest and
east-west. The oldest faults strike northwest and coincide with the initiation of the Kenyan
rift system while the youngest are the North striking and are thought to have formed during
a distinct period of dyking that took place along the Ol Njorowa Gorge. East-west striking
faults were discovered to the east of Domes field and are inferred to have been formed
during a period of transform faulting. Thrust faulting is rare throughout the field but
portrays brief periods of crustal compression. Geothermal manifestations were observed as
key indicators of permeable zones that gave indication of faults and fractures which may
have been obscured by recent pyroclastic deposits. Soil gas surveys indicate an E-W
orientation of anomalies along the south of Domes field. Digital Elevation Models show
step normal faulting to be dominant forming steep shoulder faults along the Central
Kenyan rift. Regional faults exhibit near vertical dips to the east and west, forming a
graben which is approximately 45km wide. Transform faulting is evidenced along the
Central Kenyan rift and may have been responsible for sudden changes in the strike of the
rift faults. A cauldron with four arcs was observed south of Lake Naivasha where Olkaria
and Longonot calderas occur on its periphery while Suswa caldera is located at its centre. It
forms a structure similar to a knee joint along the rift where all shoulder rift faults are
arcuate. Magnetic data shows existence of a shallow anomaly which may signify presence
of a shallow magma reservoir at a depth of about 15km.


Útdráttur
Olkaria háhitasvæðið er staðsett á austur armi Afríku gliðnunarbeltis (African Rift System).
Það er innan miðhluta gliðnunarbeltis Keníu og einkennist af rhýólít eldvirkni frá
kvartertíma. Basalt, túff og trakýt mynda jarðlagastaflann á svæðinu. Olkaría eldstöðin
hefur enga skýra öskju en afmarkast af bogalaga syrpu hraungúla í austri, suðri og suðvestri
sem hefur verið notuð til að skýra tilvist grafirnar öskju. Jarðhitasvæðið (þ.e. leyfis svæðið)
er skipt í sjö undir svæði en þau eru; Olkaria austur, Olkaria norðaustur, Olkaria miðsvæði,
Olkaria norðvestur, Olkaria suðvestur, Olkaria suðaustur og Olkaria Domes. Höggun á
Domes sæðinu hefur halla frá 20° til 80° til vesturs og austurs. Strikstefna misgengja er
norður-suður, norðvestur-suðaustur, norðaustur-suðvestur og austur-vestur. Elstu
misgengin stefna norðvestur og tengjast upphafi gliðnunar á sigdældinni (Kenyan Rift) en
yngstu brotin hafa norðlæga stefnu og eru talin tengjast innskota og gangna virkni við Ol
Njorowa gilið. Misgengi með austur-vestur stefnu koma fram austan við Domes svæðið og
eru talin hafa myndast þegar þverbrot (transform faulting) eða víxlgengi voru ráðandi.
Þrýstimisgengi eru sjaldgæft en þó má sjá stutt tímabil þar sem samþjöppun á
jarðskorpunni hefur átt sér stað. Yfirborðsvirkni jarðhitans var skoðuð en hún gefur
vísbendingu um lekt á svæðum þar sem misgengi eru hulin með nýlegum gjóskuflóðum.
Gasflæði mælingar (CO2) um jarðveg benda til austur-vestur stefnu meðfram suðurhluta
Domes svæðisins, sérstaklega í nágrenni við hring strúktúrinn (þ.e. öskju brotið). Miðhluti
gliðnunarbeltis Keníu sýnir spennu breytingu sem veldur breytingum á stefnu misgengja frá
norðvestri yfir í norðaustur. Landhæðarlíkön (DEM) sýna að misgengisstallar (normal
faults) eru ríkjandi meðfram sigdældinni. Misgengin sýna nærri lóðrétt fall bæði austan og
vestan megin, sem mynda sigdæld sem er um það bil 45 km breið. Ummerki
þverbrotabeltis má sjá meðfram gliðnunarbelti Keníu sem getur skýrt breytingar á
strikstefnu á misgengjum í gliðnuninni. Stór sigdæld kemur fram sunnan við Naivasha vatn
þar sem Olkaria og Longonot öskjurnar liggja í jaðri þess að norðan, með Suswa öskjuna í
miðju. Myndunin myndar bogalaga lægð í miðju gliðnunarbeltisins sem er um 30 km
sinnum 50 km að umfangi. Segulmælingar sýna grunnstæða lægð, sem hugsanlega mætti
túlka sem grunnstætt kvikuhólf. Kjúrípunktur (GPD) er á um 15 km dýpi styður og fellur
vel að þessari sigdæld. Fjöldinn allur af basalt göngum sem koma fram við Kijabe gætu átt
uppruna sinn úr grunnstæðu kvikuhólfi sem skýrir fjölda jarðhitastaða meðfram austur
hluta gliðnunarinnar. CO2 gas mælingar sýna einnig kviku afgösun frá grunnstæðu
kvikuhólfi.

Dedication
This work is dedicated to my parents, the late Eng. Lawrence Munyiri Ruthuthi and Rose
Nyaguthii Munyiri for their passion of impacting the love for knowledge in me. To my wife
Judy Nyaguthii Kinyua for taking care of my family. Finally, to the lovely kids who look at
me as their role model including Tess Nyaguthii for giving new meaning to life.


xv
Table of Contents
List of Figures .................................................................................................................. xvii
List of Tables ..................................................................................................................... xix
Abbreviations ..................................................................................................................... xx
Acknowledgements .......................................................................................................... xxii
1 Introduction ..................................................................................................................... 1
1.1 Morphology of the Kenyan Rift System .................................................................. 2
1.2 Geographical Setting of the Study Area .................................................................. 6
1.3 History of Geothermal Development at Olkaria Geothermal Field....................... 10
1.4 Aim and Scope of the Research Project ................................................................ 13
2 Geology and Structural Provenance of Olkaria Geothermal Field .......................... 15
2.1 Structural Geology ................................................................................................. 19
2.2 Tectonic Activity ................................................................................................... 21
2.3 Hydrogeology ........................................................................................................ 24
3 Methodology .................................................................................................................. 25
3.1 Desktop Studies ..................................................................................................... 25
3.2 Preliminary Data Analysis ..................................................................................... 25
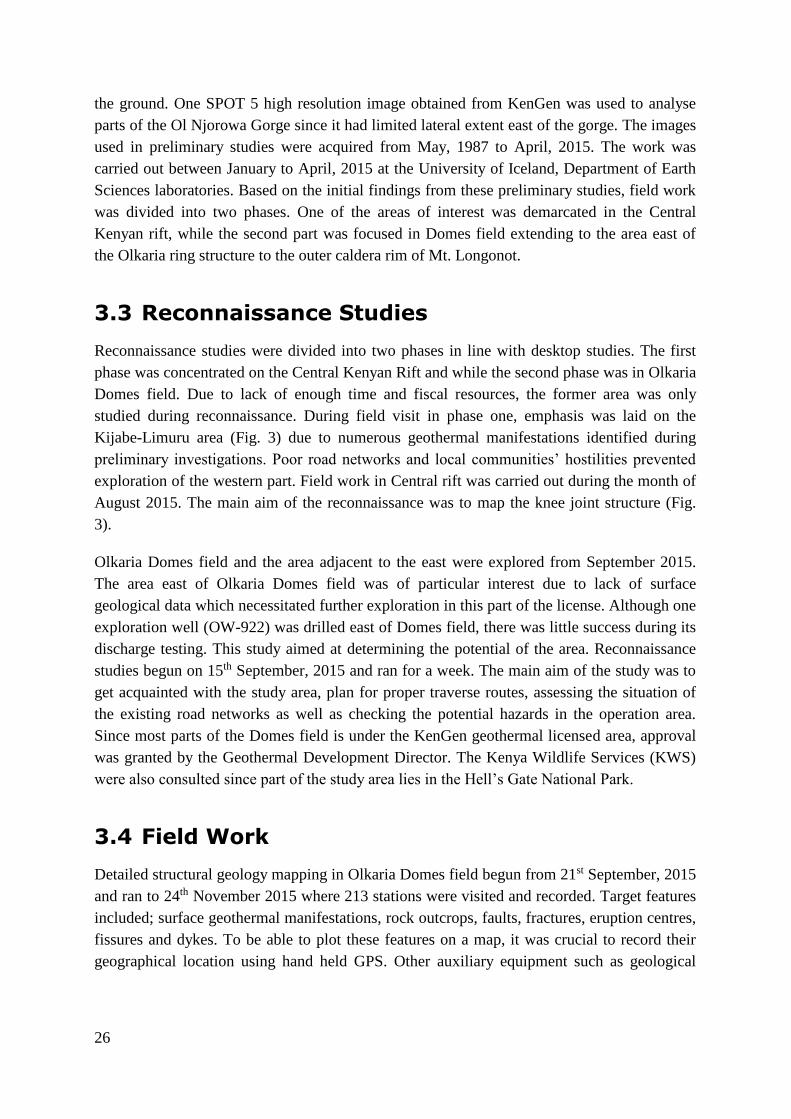
3.3 Reconnaissance Studies ......................................................................................... 26
3.4 Field Work ............................................................................................................. 26
3.5 Data Analysis and Synthesis .................................................................................. 27
3.6 Geochemical Exploration ...................................................................................... 28
3.6.1 Measurement of Carbon Dioxide (CO2) ...................................................... 30
3.6.2 Radon Gas Measurements ............................................................................ 32
4 Results ............................................................................................................................ 33
4.1 Surface Geology .................................................................................................... 33
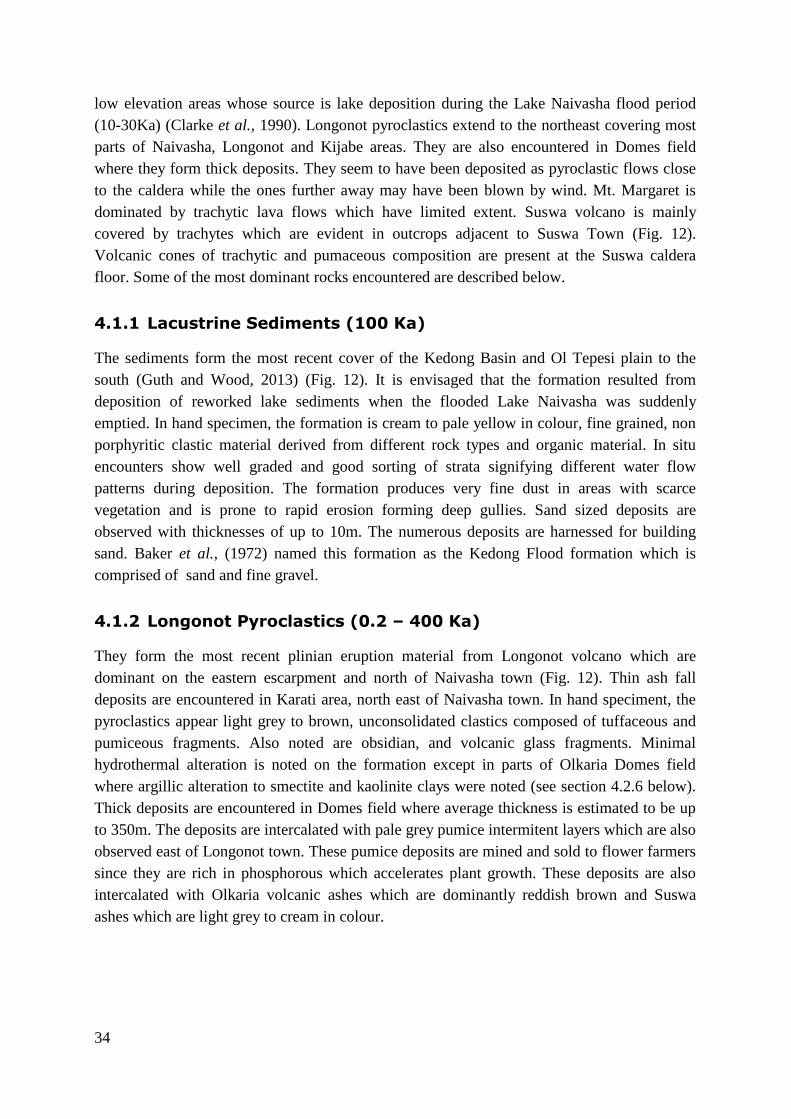
4.1.1 Lacustrine Sediments (100 ka) ..................................................................... 34
4.1.2 Longonot Pyroclastics (0.2 – 400 ka) .......................................................... 34
4.1.3 Kinangop tuffs (3.4 – 3.7 Ma)...................................................................... 35
4.1.4 Trachytes ...................................................................................................... 35
4.2 Structures in the Central Kenyan Rift Segment..................................................... 38
4.3 Olkaria Domes Field ............................................................................................. 44
4.3.1 Fractures ....................................................................................................... 44
4.3.2 Faults ............................................................................................................ 48
4.3.3 Calderas ........................................................................................................ 52
4.3.4 Dykes ........................................................................................................... 55
4.3.5 Folds ............................................................................................................. 58
xvi
4.3.6 Altered Ground ............................................................................................ 59
4.3.7 Hot Springs .................................................................................................. 63
4.3.8 Volcanic Plugs and Eruption Centres .......................................................... 65
4.4 Geochemical Soil Gas Survey Results ................................................................... 67
4.4.1 CO2 Gas Survey ........................................................................................... 67
4.4.2 Radon Gas Survey ....................................................................................... 69
5 Discussion ....................................................................................................................... 71
5.1 Updated Structural Map of Olkaria Domes Geothermal Field .............................. 71
5.2 Olkaria Conceptual Model ..................................................................................... 74
5.3 The Knee Joint Structure ........................................................................................ 77
6 Conclusion ...................................................................................................................... 81
7 Recommendations .......................................................................................................... 83
xvii
List of Figures
Figure 1: Digital Elevation Model of northeast Africa, showing the plate boundaries. ....... 4
Figure 2: Simplified map of the Kenyan rift showing location of geothermal
prospects and fields ............................................................................................ 5
Figure 3: Figure showing the Central Kenyan rift with location of Olkaria, Longonot
and Suswa volcanoes. ......................................................................................... 8
Figure 4: Map showing relative location of Olkaria geothermal sectors and the study
area ..................................................................................................................... 9
Figure 5: Resource map showing numerous wells drilled in different geothermal
sectors ............................................................................................................... 12
Figure 6: Summarised representation of the upper Olkaria volcanic sequences ............... 18
Figure 7: Map showing the surface geology and the structures in Olkaria ........................ 20
Figure 8: InSAR data from Mt. Longonot show vertical movement of up to 9 cm .............. 22
Figure 9: Geodetic activity detected at volcanic centers in the Kenyan rift. ...................... 23
Figure 10: Map showing the distribution of geochemical sampling points ........................ 29
Figure 11: Image of an Orsat aparatus used in measuring CO2 ........................................ 31
Figure 12: Geological map of Kijabe area showing the dominant rock types and
structural trends. .............................................................................................. 37
Figure 13: Map showing the transform zones that led to the changes in rift
orientations. ...................................................................................................... 39
Figure 14: DEM of the Kenyan Rift System showing the general orientation of the
rift ..................................................................................................................... 41
Figure 15: Map showing variation in Curie Point Depth (CPD) along the Kenyan rift
system. ............................................................................................................... 43
Figure 16: Plate showing one of the NW-SE fractures located on the ridge. ..................... 46
Figure 17: Map showing location and strike of mapped fractures ..................................... 47
Figure 18: Normal faulting depicted by the white ash deposits .......................................... 50

xviii
Figure 19: Plate showing normal faulting along Ol Njorowa Gorge. ............................... 50
Figure 20: Map showing structural trends in Olkaria Domes field. .................................. 51
Figure 21: Image of a thrust fault observed along the ridge structure east of Domes
field. .................................................................................................................. 52
Figure 22: Map showing Olkaria ring structure and both outer and inner Longonot
caldera rims. ..................................................................................................... 54
Figure 23: Figure illustrating conditions for dyke propagation......................................... 56
Figure 24: Plate showing dykes extrusion along the Ol Njorowa Gorge ........................... 58
Figure 25: Plate showing folding along the ring structure. ............................................... 59
Figure 26: Map of the study area showing spatial distribution of altered grounds ........... 61
Figure 27: Altered grounds showing different levels of alteration. .................................... 62
Figure 28: Map showing location of hot springs along Ol Njorowa Gorge. ..................... 64
Figure 29: Map of the study area showing volcanic plugs and eruption centers ............... 66
Figure 30: Soil gas map of CO2 gas survey carried out in Domes field. ............................ 68
Figure 31: Map of radon gas values measured in Domes field .......................................... 70
Figure 32; Updated structural map of Olkaria Domes field .............................................. 73
Figure 33: Schematic Geological Conceptual Model of Olkaria ....................................... 76
Figure 34: The schematic model of the knee joint structure located on the Central
Kenyan rift ........................................................................................................ 79

xix
List of Tables
Table 1; Current geothermal installed capacity for geothermal power in Kenya. ............... 1
Table 2; Work breakdown structure .................................................................................... 14

xx
Abbreviations
AMMP Africa Magnetic Mapping Project
Bp Before present
CPD Curie Point Depth
EARS East African Rift System
GOGA Greater Olkaria Geothermal Area
GOVC Greater Olkaria Volcanic Complex
ISOR Iceland GeoSurvey
Ka Thousand years
KenGen Kenya Electricity Generating Company
km kilometres
m metres
Ma Million years
a.s.l meters above sea level
bgl meters below ground level
MWe Megawatts electric energy
MWt Megawatts thermal energy
OW Olkaria Well
UNU-GTP United Nations University Geothermal Training Programme
XRD X-ray diffractometry

xxi
xxii
Acknowledgements
I wish to sincerely thank the Icelandic Government the United Nations University
Geothermal Training Programme (UNU-GTP) and the Kenya Electricity Generating
Company Ltd (KenGen) for awarding the scholarship for this study; am greatly indebted to
the University of Iceland, Iceland GeoSurvey (ISOR) and any other institution that ensured
success in my M.Sc. studies.
My appreciation goes to the KenGen management, Olkaria Geothermal Project, for
facilitating the study program and providing the sabbatical leave. The role played by
Geology, Geophysics and Geochemistry sections in data acquisition and processing is
much valued.
Gratitude goes to my advisors Prof. Þorvaldur Þórðarson, Dr. Björn S. Harðarson and
Gunnlaugur M. Einarsson for their role in enlightening, valuable discussion and impacted
knowledge in structural geology and GIS. It is through them that some of the fundamental
problems relating to the project were satisfactorily answered and I particularly cherish their
support and advice. Special thanks go to Dr. Björn S. Hardarson who supervised the field
work and greatly assisted in collecting data; am indebted to Gunnlaugur M. Einarsson for
his tireless work, great skills and guidance in producing the structural geology map of the
study area. Sigurður Kristinsson was also instrumental in reviewing my work. Thank you
all.
To my colleagues, friends and the other UNU-GTP fellows who encouraged and facilitated
the success of this work in any way, I wish to thank you for your devotion. I reach out to
my family who waited patiently while I was away on studies and encouraged me through
out. Thank you all for your support for you taught me everything that has a beginning must
have an end.
Finally, I give all glory and honour to the Almighty Lord for the successful completion of
the entire programme.

1
1 Introduction
Kenya’s current installed geothermal electric power capacity is 658.3 MWe (Table 1) and an
extra 560 MWe is being developed in Olkaria geothermal field (KenGen, 2015; Kenya Power,
2015; Ormat, 2015; Omenda and Simiyu, 2015). An additional 105 MWe is proposed for
development in Menengai geothermal field (Omenda, 2014). The aim is to increase the
renewable energy output to meet the current national peak demand of 1,468 MWe and ensure
a base load reserve of close to 600 MWe (Kenya Power, 2015). The country has put a major
focus on geothermal expansion in order to reduce over-reliance on non-renewable electricity
resources. For the sake of environmental conservation, the Government has committed to
develop cheaper, cleaner, more reliable and green energy, from renewable sources, mainly
from geothermal, wind and solar (MOE, 2015).
Table 1; Current geothermal installed capacity versus effective capacity for all geothermal
power plants in Kenya.
Geothermal Power
plant
Installed
capacity
(MW)
Effective
capacity
(MW)
Data source
Olkaria I Units 1,2 & 3 45 44 KenGen (2015), Kenya
Power (2015)
Olkaria I Units 4 & 5 150.5 140 KenGen, 2015; Kenya
Power, 2015
Olkaria II 105 101 KenGen, 2015; Kenya
Power, 2015
Olkaria III 140 140 Ormat, 2015
Olkaria IV 149.8 140 KenGen, 2015; Kenya
Power, 2015
Wellheads 64 64 KenGen, 2016
Oserian 1 & 2 4 3 Omenda and Simiyu, 2015
Total 658.3 632
Although the Kenyan Rift system has an estimated geothermal capacity of approximately
10,000 MWe, less than 10% of the potential has been utilised (Omenda, 2014). To accelerate
geothermal development, Government policies reforms have been initiated and fast tracked.
Vision 2030 is an ambitious government policy geared towards developing Kenya to a middle
2
level economy on the global stage by the year 2030. In this policy, energy is considered as one
of the key pillars for economic growth. It is estimated that 33,000 MWe are required for
powering Kenya’s industrial and domestic sectors (Omenda et al., 2014). The current
Government has put in place ‘the 40 months challenge’ (extracted from Vision 2030), with
the objective of fast tracking development of 5,000 Mwe from alternative and renewable
energy resources. Major consumers of this additional power generation will be smelting
industries, The Lamu Port Southern Sudan-Ethiopia Transport project (LAPPSET) & ICT
industrial Parks, which are estimated to consume 4,196 MWe of this new electrical power
(Kenya Power, 2015 and KenGen, 2015).
The Kenya Electricity Generating Company Limited (KenGen) is the largest power producer
in Kenya, with a market share of 73%. It has taken on the task of developing geothermal
resources in Olkaria geothermal field (KenGen, 2015). An additional 280 MWe was
commissioned between September 2014 and early 2015. KenGen is currently developing
additional power plants with an installed capacity of 560 MWe. These will be constructed in
two phases to be completed by the year 2030. The first phase runs from 2015 to 2019 where
KenGen should install an additional 350 MWe of geothermal power to the national grid. The
second phase runs from 2019 to 2030 with additional 210 MWe (KenGen, 2015).
To achieve these goals, KenGen has pledged to increase its human resource capacity and
expand its knowledge base. This study program is one of the initiatives under the capacity
development that is focused on structural geology of the less explored Olkaria Domes field
and East of Domes field. This report presents results from the structural geology and surface
mapping of geothermal manifestations in Olkaria domes field. Desktop studies of the Central
Kenyan rift are also briefly described.
1.1 Morphology of the Kenyan Rift System
The Kenyan rift is part of the East African Rift System (EARS) which was formed due to
continental breakup of the Nubian and Somalia plate boundaries (Fig. 1). The rift extends
from Ethiopia to Mozambique with rifting of relatively high-degree of tectonic maturity in the
North that decreases southwards. The Western branch passes through Uganda, Democratic
Republic of Congo and Rwanda (Marco et al., 2005) (Fig. 1).
Suess (1891) came up with the concept of the East African rift fracture after a brief period of
exploration. Gregory (1896) also named it the Great Rift Valley of East Africa and described
it as a sunken graben system forming a basin that hosts the Red Sea and Dead Sea. Smith
(1931), McCall (1957), McConnel (1959) and Harkin (1960) carried out geological mapping
within selected parts of the rift and documented near vertical step faulting along the rift
shoulders. Regional studies were later carried out by Mohr (1962), Harris (1969) and
Wohlenberg (1969) who modeled the EARS as an active rift with the driving force being
provided by convecting asthenospheric mantle, based on the fact that the regional volcanism
preceded the major rift faulting events. The theory of upwelling magma plumes, namely, Afar
and Kenyan plumes as the main sources of tectonic and volcanism was then born and has
been continuously used to explain the constant pressure source Baker (1970), Mohr (1970),
Baker et al., (1971) and McKenzie et al., (1972) (Fig. 1). The Kenyan plume also resulted in

3
up-doming effect forming three rift arms at the Nyanzian triple junction. The north and
southern arms continued spreading while the third arm (Nyanzian rift) died out (Fig. 2).
When the Ethiopian segment of the rift approaches Kenya, at the latitude 5° N, it bifurcates
into the Eastern and Western branches as it bends around the Tanzania craton, following the
Late Proterozoic sutures on either side of the craton (Smith and Mosley, 1993) (Fig. 1). The
Eastern branch of the rift is known as the Kenya rift and is older and has more active
volcanicity than the Western branch, that contains the Albert–Tanganyika-Malawi rifts (Smith
and Mosley, 1993). The Eastern Rift has also been subjected to more vigorous geothermal
exploration, although the success rate has been highly variable Mungania (1999), Muchemi
(2000), Simiyu (2010).
The Kenyan rift began its development during the late Oligocene at approximately 30 Ma.
Magma resurgence created weak points in the crust which later transformed to major volcanic
landforms (Baker et al., 1971; Muchemi, 1992). The relatively shallow level of the
lithosphere-asthenosphere boundary and Moho beneath the EARS is responsible for the high
heat flow and geothermal gradient (200°C/km) within the rift (Wheildon et al., 1994 and
Simiyu and Keller, 1997). Quaternary volcanic activity was focused along the central axis of
the rift and crustal thinning may have been responsible for formation of the key volcanic
centres, including Eburru, Olkaria, Longonot and Suswa (Mohr, 1970; Mungania, 1999;
Chorowicz, 2005). Explosive extrusions also created caldera volcanoes (Simiyu, 2010; Wood
and Guth, 2015). Development of shallow magma chambers of intermediate to silicic
composition formed the most important geothermal prospects (Fig. 2). The volcanoes include
Suswa, Longonot, Olkaria, Eburru, Menengai, Korosi, Paka, Silali, Emuruangogolak and
Barrier (Clarke et al., 1990; Muchemi, 2000; Omenda, 2014) (Fig. 2). The Greater Olkaria
Geothermal Complex is one of the resultant volcanic edifice showing highly evolved rock
sequencing (Omenda et al., 2014).

4
Figure 1: Digital Elevation Model of northeast Africa, showing the plate boundaries, and the
dome-like regional structures associated with the EARS. The domes are interpreted
to have been produced by upwelling mantle plumes. Also shown are the largest rift-
related lakes in East Africa (Wood and Guth, 2015).
5
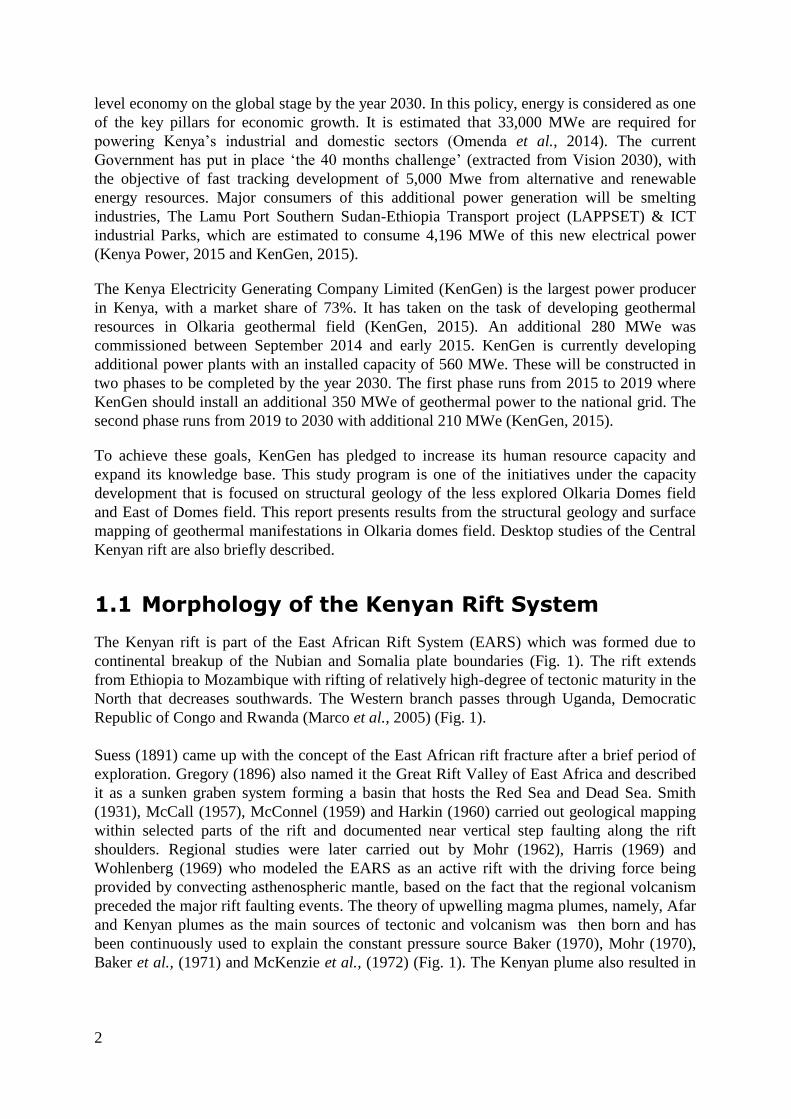
Figure 2: Simplified map of the Kenyan rift showing location of geothermal prospects and
fields. The three arms of the Kenyan rift are shown at the Nyanzian tripple junction
which caused segmentation of the rift. The North, Central and South rift segments
are indicated by the dashed brown lines (modified from Clarke et al., 1990 and
Simiyu 2010 )
North Rift
Central Rift
South Rift

6
1.2 Geographical Setting of the Study Area
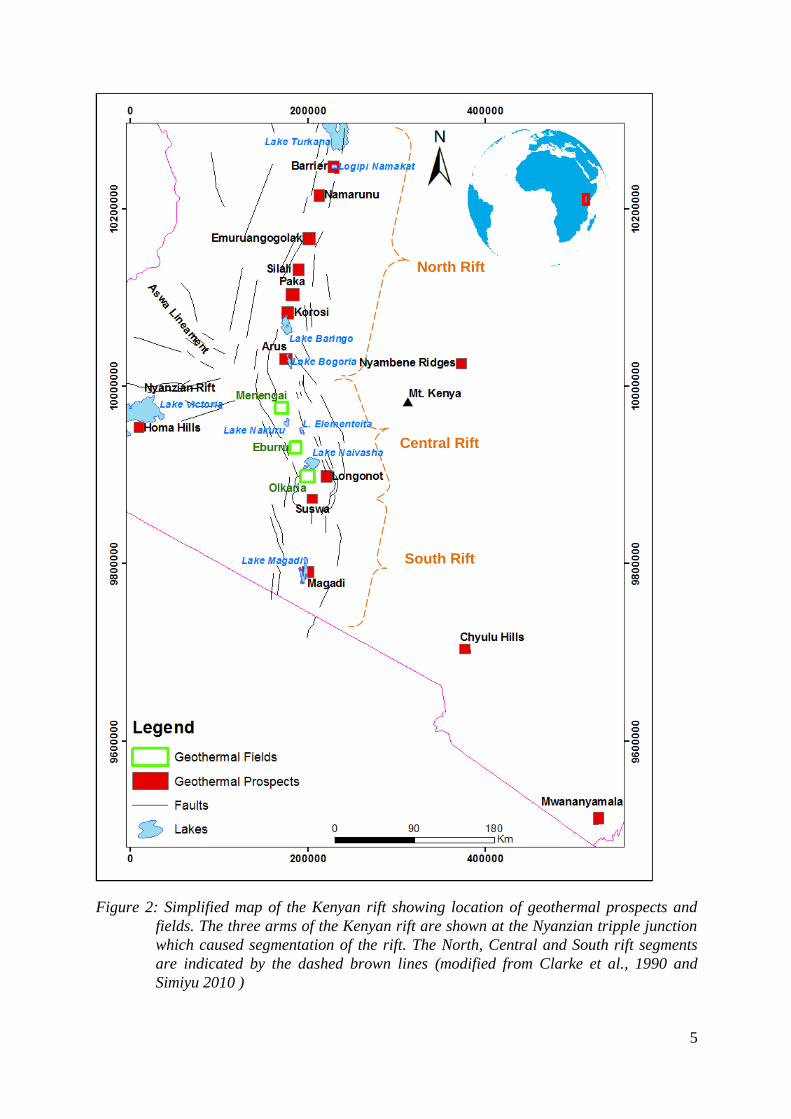
The study area is approximately 1500 km2 and runs from the southern tip of Lake Naivasha to
Ndeiya area (Fig. 3). The area is characterized by regional faulting with arcuate fault scarps
that define a cauldron circular structure that measures approximately 50 by 30 km in diameter.
The bounding fault scarps are up to 800m high, implying a down faulting of similar
magnitude. Olkaria, Longonot and Kijabe volcanoes are placed along the periphery of the
circular structure (as if they form nested calderas), while Suswa caldera volcano lies in its
centre (Fig. 3). The floor of the circular structure is relatively flat due to infill of lacustrine
sediments formed by catastrophic floods from Lake Naivasha, which occurred at about 10-30
Ka Bp. Mt. Margaret is a trachytic volcanic cone located northeast of Suswa volcano and has
also been demarcated as a potential geothermal site (Clarke et al., 1990). The eastern rift
scarp hosts numerous geothermal manifestations around Kijabe area (Fig. 3), which were
studied during field work.
Thompson (1964) carried out geological studies in the study area and described the eastern
scarp as complex systems of down faulted blocks that are variably tilted. Subsequent
pyroclast-producing eruptions have modified and dampened the topographic relief, although
the tectonic fabric is still evident. Kinangop tuffs are the dominant pyroclastic formation
along the eastern margins, forming about 10m thick strata extending throughout the central
region towards Suswa volcano (Baker et al., 1971). The Kinangop tuffs are quarried and sold
as building stones to the local population. Trachytes mainly occur as extrusions at Longonot,
Suswa and Mt. Margaret areas (Guth and Wood, 2013). En Echelon faulting is evident on the
south of Suswa and the faults run sub-parallel to each other with a north-south orientation
(Baker et al., 1970). Numerous scoria cones occupy the basin forming topographic highs
some of which are not discernible from the Digital Elevation Model (DEM).
Ignimbrite deposits are widespread in Suswa and Longonot region and especially in
association with Kedong Valley tephra formation, which signifies a period of violent
explosive eruption in an association with caldera formation. Basaltic dykes and lava flows
have been identified along the eastern margin. Kijabe area hosts numerous basaltic dykes
while Kijabe hill is a basaltic cone (Clarke et al., 1990). The western arc of the circular
structure exposes the approximately 0.6 Ma Mau Ashes formation, which is commenditic and
blankets the western part of the structure (Guth and Wood, 2013). Steeply inclined shoulder
faults forming co-linear ridges typify this region.
Olkaria Geothermal Field (OGF) sits within the Central Kenyan Rift and is one of the late
Quaternary central volcanoes with proven geothermal potential (Mwangi, 1986; Clarke et al.,
1990; Muchemi, 1992; Ofwona, 2002; Lagat, 2004; Omenda et al., 2014; Musonye, 2015).
Olkaria geothermal field is located in Nakuru County, about 120 km North West of capital
Nairobi (Fig. 3). The surface geology is dominated by commenditic rhyolites which are
present as scattered lava flow fields throughout the OGF (Lagat, 2004). Volcanic ashes,
pumaceous deposits, and trachytes are also present along with rare lacustrine sediments in the

7
vicinity of Lake Naivasha. In the subsurface, the rocks consist of basalts, trachytes, rhyolites
lavas and tuffs of ages ranging from Pliocene to Holocene.
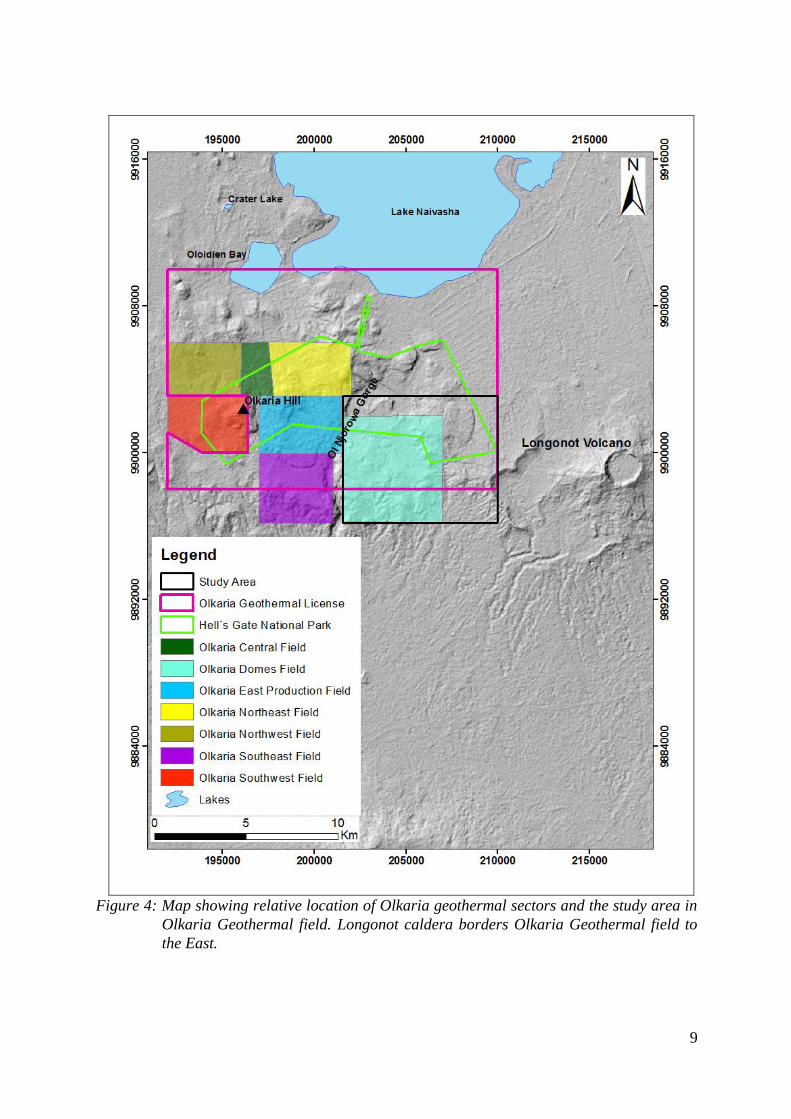
The Olkaria geothermal license area is situated immediately south of Lake Naivasha. It´s
divided into seven subfields for ease of geothermal development (Fig. 4). These include;
Olkaria Central, Olkaria East, Olkaria North East, Olkaria North West, Olkaria South East,
Olkaria Domes field and Olkaria South West. Olkaria Domes field is located to the southeast
of Olkaria hill and lies on the periphery of the fields licensed to KenGen (Fig. 4). The field is
bounded by the Ol Njorowa Gorge to the west, Olkaria ring structure to the east and the Gorge
Farm fault to the North. Longonot caldera is located to the east of Domes field (Fig. 4). It is
also bounded by Northings 969380 to 99035m and Eastings 201500 to 208500m. This report
largely focuses on the Olkaria Domes field and the area between Domes and Longonot
caldera. The field work was carried out from September to December 2015.
8
Figure 3: Figure showing the Central Kenyan rift with location of Olkaria, Longonot and
Suswa volcanoes. Local place names are also shown.
9
Figure 4: Map showing relative location of Olkaria geothermal sectors and the study area in
Olkaria Geothermal field. Longonot caldera borders Olkaria Geothermal field to
the East.
10
1.3 History of Geothermal Development at Olkaria Geothermal Field
Geothermal exploration began in the 1950’s with much emphasis being laid on Olkaria East,
Central and West fields. Two exploration wells were drilled in Olkaria in 1956 which proved
existence of a geothermal reservoir. Exploration work began in 1960 and was extended
significantly by work carried out by Furgerson (1972), Sweco-Virkir (1976), VIRKIR
Consulting Group (1980), Browne (1984), Odongo (1984), Mwangi (1986), Onacha (1989),
Dimitrios (1989), Simiyu et al., (1995), Onacha (1999), Lichoro (2009) and Wanjohi (2014).
Most of the research was carried out between Lake Bogoria and Olkaria where several low
resistivity zones were identified. However, results indicated Olkaria geothermal field to be the
most promising of all detected anomalies (Muchemi, 1998).
Geological mapping of surface geothermal manifestations and other geological features was
carried out in Olkaria geothermal field. Naylor (1972) identified the Olkaria ring structure
marked by arcuate rhyolitic domes running from the east to the south eastern part of the
volcanic complex and have been used to invoke the presence of a buried caldera. Geothermal
surface manifestations were mapped by Baker et al., (1971). Intense fumerolic activities
mostly follow linear trends which were presumed to indicate permeable fault zones.
Temperature measurements collected showed boiling conditions in fumeroles in Olkaria East
and Central fields.
This exploration culminated in drilling of production wells in most of the geothermal
segments. The first geothermal power plant (Olkaria I) was set up in June 1981 with a
capacity of 15 MWe (Ouma, 2009). The second was commissioned in November 1982 and
the third in March 1985 totaling the capacity to 45 MWe. Browne (1984) and Odongo (1984)
analysed cores and cuttings from initial wells and established that the litho-stratigraphic
succession of the area featured at least 2600m of sub-aerial rhyolitic, trachytic and basaltic
lava and associated pyroclastic rocks.
After proving the geothermal potential in Olkaria, the Government of Kenya through the
Ministry of Energy (MOE) contracted the British Geological Survey (BGS), to undertake
more exploration in the region (Clarke et al., 1990). BGS carried out extensive regional
exploration of geothermal energy in the Kenyan rift. This included geological mapping of
Longonot Volcano, Greater Olkaria Volcanic Complex (GOVC) and the adjacent areas. Their
findings identified several potential areas for harnessing geothermal energy. Among them was
the Domes field, which was to be considered for further exploration. Mt. Margaret was also
delineated as a potential geothermal prospect (Clarke et al., 1990).
Exploration drilling in Olkaria Domes field began at the turn of the 20th Century when three
exploration wells were drilled i.e. OW-901, OW-902 and OW-903. Lagat (2004) carried out
detailed lithological and alteration mineralogy analysis and found alteration zoning to depict

11
high temperature geothermal reservoir conditions. Further geological work in Domes field
was carried out by Omenda (1998) and geophysical analysis was done by Lichoro (2009).
They identified structural controls and potential upflow zones controlling geothermal fluid
movement at the central part of Domes field which formed drilling targets. Several appraisal
wells were later drilled in the upflow zones and were quite productive.
The exploration company West-JEC (2009) carried out optimisation studies and advised on
the best drilling practises for both production and re-injection wells for Olkaria geothermal
field. Domes field was considered a prime area for production drilling and recommendations
for intensive drilling issued. A geothermal well drilling contract was signed between KenGen
and Great Wall Drilling Company (GWDC) of China and saw accelerated drilling of 80 wells
in Domes field and subsequent steam production that culminated in the construction of
Olkaria IV powerplant in 2014. MANNVIT et al., (2011) have been carrying out field
monitoring exploration and optimisation studies. They identified four major heat sources in
Olkaria geothermal field based on geophysical and reservoir data. The research has updated
the conceptual model and recommended several measures to ensure sustainable steam
production.
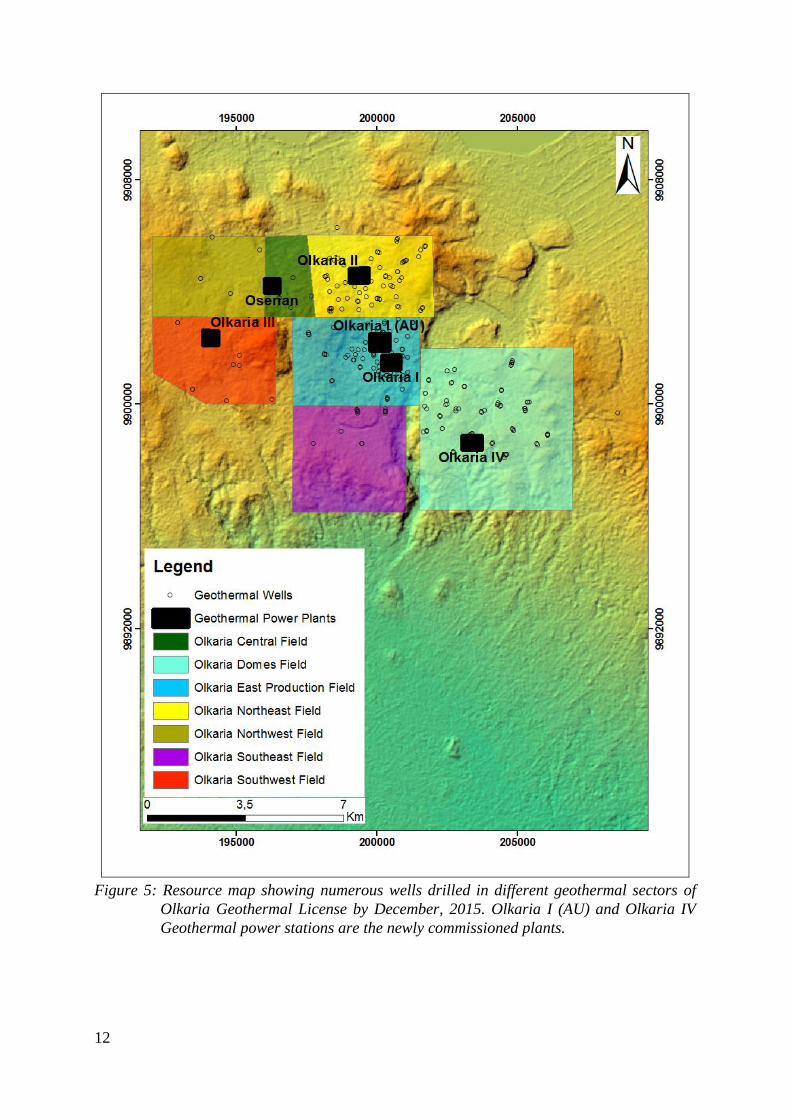
By December, 2015, KenGen had drilled 281 wells in Olkaria Geothermal field with an
estimated geothermal output of more than 600 Mwe (KenGen, 2015) (Fig. 5). Domes field
with more than 70 wells, has an estimated total production capacity of more than 350 Mwe.
Most of the geothermal fields have also been explored and their potential proven. Olkaria
Domes is one of the most recently drilled fields where work is still ongoing. A single flash
geothermal power plant known as Olkaria IV was commissioned in November 2014. It has a
peak production of 140 MWe from its two turbines. A second power plant, Olkaria I
Additional Unit (AU) with a capacity of 140 MWe was also constructed in the East field to
cater for excess steam produced (Fig. 5).
The area East of Domes only has a single well, OW-922, which was drilled in August 2014
(Fig. 5). The South East field has not been fully explored although several wells have been
drilled, showing different degrees of success. More research will be carried out in future to
prove its productive potential. Olkaria Central and North West fields were explored and show
significant geothermal potential.
12
Figure 5: Resource map showing numerous wells drilled in different geothermal sectors of
Olkaria Geothermal License by December, 2015. Olkaria I (AU) and Olkaria IV
Geothermal power stations are the newly commissioned plants.

13
1.4 Aim and Scope of the Research Project
The current structural map of Olkaria Domes (Fig. 7) puts strong emphasis on the Olkaria
Ring Structure and the Ol Njorowa Gorge as being the prominent structures for subsurface
movement of geothermal fluids (Karingithi 1999; Ouma 2009; Wamalwa 2014). However, it
is likely that other, yet to be discovered, structures may act as strong water passage zones and
hence would be potential drill targets. For example, the area east of the Ring Structure has not
yet been explored comprehensively compared to areas west of Ol Njorowa Gorge and the
stand-alone exploration well OW-922, drilled in 2014, unfortunatley did not reveal as much
information as was expected.
The aim of this study is to improve our understanding of the geology and geothermal
prospects of Olkaria Domes area through geological mapping and soil gas geochemical
survey. This project is carried out in partial fulfilment of a Master’s Degree in geology at the
University of Iceland. To achieve the full expectations of this project, the following key
objectives are identified:
To identify the major structural patterns controlling fluid movement in the Olkaria
Domes geothermal field.
To establish the localities, strikes and dips of geological structures in the Olkaria Domes
geothermal field.
To map all geothermal surface manifestations and relate their occurrence to the fault
systems.
To collect soil gas geochemistry data that will assist in determining the structural
controls in the study area.
To achieve these objectives within the given scope, the work was divided into several tasks
each with specific deadlines (Table 1). A preview of existing geothermal data was also done
and knowledge gaps established. These gaps would be addressed in the report during
compilation.

14
Table 2; Work breakdown structure
Time frame
Activity
February March April May June July August September to
November
Planning
Desktop studies
Reconnaissance
Field mapping
and geochemical
survey
The implementation of the project aims was focused on mapping geological structures within
central Kenyan rift and Olkaria Domes field, which in part have surface manifestation via
geothermal activity. Remote sensing and GIS were used in preparatory desktop studies. The
structural mapping in the field was carried out from August to November 2015 and was
largely focused on the Domes field. Field work also involving geochemical soil gas surveys
was carried out in Domes field, where geothermal surface manifestations and bed rock
exposures are poor due to thick pyroclastic overburden. The gas surveys were carried out to
determine surface permeability of the Domes Field. Laboratory-based analysis and synthesis
of field data and samples was subsequently carried out in the period December 2015 to May
2016. The results of this work are presented in this report.
(2015)

15
2 Geology and Structural Provenance of the Greater Olkaria Volcanic Complex
The Greater Olkaria Volcanic Complex (GOVC) was formed about 22-20 Ka Bp. It occurs
along the East African rift which was formed due to tectonism involving lithospheric
spreading, fracturing and eventually faulting (Marco et al., 2005; Biggs, 2009; Corti et al.,
2007; Corti, 2011). The continental spreading was initiated by the collision between the
Archean Tanzania craton and Proterozoic orogenic belts. Volcanic uplift resulted from
upwelling of two upper mantle plumes in Afar and Kenya with dimensions of thousands of
kilometers (Macdonald et al., 2008; Smith and Mosley, 1993). Both plumes are characterised
by extrusion of flood basalts whose isotopic analysis indicate a deep mantle origin for the
Afar plume and a shallow origin for the Kenyan plume (Baker et al., 1971). It has been
suggested that the upper mantle immediately beneath the rift may contain reservoirs of
magma generated at greater depth (Marshall et al., 2009). Crustal thicknesses along the rift
axis decrease from 35 km in the Naivasha-Nakuru area to 20 km in the north near lake
Turkana (KRISP, 1991).
GOVC hosts numerous volcanic centres of Quaternary age, most of which contain
commenditic lavas (Baker and Williams, 1972 and Lagat, 2004). The volcanic edifice hosts
an inferred caldera rim which is not very conspicuous. It is characterised by numerous domes
and craters which are rhyolitic in composition with their relative positions forming a loci to
the east, south and southwestern parts (Omenda, 1998). These domes have been interpreted to
be remnants of the buried caldera and have been obscured by recent pyroclastic ash falls from
neighbouring Longonot volcano (Naylor, 1972 and Omenda, 2000).
Omenda et al., (1998) carried out extensive petrological research to identify the lithological
succession in the GOVC and identified six lithological sequences based on deep drilling rock
sampling, namely;
(1) The upper Olkaria volcanics (commenditic lavas and pyroclastics, basalts and trachytic
intercalations, volcanic ashes from Longonot and Suswa). Most of these rocks have surface
exposures and their relative lithology is summarised based on carbon dating (Fig. 6),
16
(2) Olkaria basalts occuring from 500m to approximately 1000m below ground level (bgl).
This rock suit is dominated by basaltic flows with trachytes and minor pyroclastics and hosts
the geothermal cap rock in Olkaria geothermal field (Ambusso and Ouma, 1991).
(3) The plateau trachytes are the third succession occuring from 1000m to approximately
2600m bgl. This series is dominated by trachytes and minor encounters of basalts, tuffs and
rhyolites. Thickness varies throughout the field but they are deepest in the East field where
they form the geothermal reservoir (Omenda, 1998). These rocks are believed to be related to
fissure eruptions along the rift,
(4) Mau tuffs occur in this zone and are mostly widespread in the Olkaria west field beyond
the Olkaria caldera (MacDonald et al., 2008). They are believed to be the oldest exposed rock
units in Olkaria. The tuffs have been well consolidated by the rock overburden and have an
ignimbritic texture,
(5 & 6) The other two units may be very deep beneath hence not encountered during drilling.
They are however encountered along the southern flanks of the Kenyan rift and are mostly
composed of trachytes (Musonye, 2015).
The upper Olkaria volcanics exposed in surface outcrops were mapped and dated by Baker et
al., (1971), Clarke et al., (1990) and Marshall et al., (2009) using the 14C method and showed
that the volcanic suit must have been formed during different time periods and stages which
have been summarised below (Fig. 6);
Stage 1; The extrusion of Olkaria trachytes and Maiella pumice during the initial pre-caldera
formation (20-12±120 Ka) (Baker et al., 1971; Marshall et al., 2009).
Stage 2; Olkaria caldera collapse forming a depression of 11 km x 7.5 km across (Clarke et
al.., 1990). The collapsed caldera initiated plinian like eruptions of welded
pyroclastics of the Ol Njorowa Pantellerite Formation (O1), the Lower Comendite
Formation (O2) signifies further eruption that occured during the post-caldera activity
linked to the eruption of peralkaline rhyolitic lavas and pyroclastic rocks (Op2)
(MacDonald et al., 2008; Clarke et al., 1990).
Stage 3; The Lower Comendite Member of the Olkaria Comendite Formation (O2/Op2) were
extruded after the caldera collapse. Rhyolite lavas and pyroclastics, dated at
>9150±110 BP by the 14C method dominate this stage (MacDonald et al., 2008).
Stage 4; Further extrusion of the Middle Comendite Member (O3/Op3) mainly composed of
rhyolites formed ring domes. Thick pyroclastic deposits were also produced between
>9150±110 and >3280±120 BP (MacDonald et al., 2008).

17
Stage5; The collapse of the caldera floor and the formation of thick lava flows that resulted in
the Upper Comendite Member (O4/Op4) was experienced in the fifth stage (5650 –
3280 ± 120) (MacDonald et al., 2008).
Stage 6; Stage six signified the last flows of very thick comendite lava from a north–south
fissure system. The youngest lava flow, Ololbutot Comendite (O5/Op5) was date
180±50 BP (MacDonald et al., 2008; Marshall et al., 2009; Clarke et al., 1990) (Fig.
6).

18
Figure 6: Summarised representation of the upper Olkaria volcanic sequences showing the
stratigraphic column of the GOGA. Units O1 to O5/Op5 and the Olkaria trachyte
are from the Olkaria complex; LP1 to LP8 units are Longonot pumice falls. The
arrowed 14C dates come from palaeosols immediately beneath the LP5 and LP8
units (Marshall et al., 2009).

19
2.1 Structural Geology
Geothermal fluid flow along the Kenyan rift system is greatly influenced by the system of
normal faulting, En echelon rift shoulder faulting and the rift floor basin. The faults may
facilitate geothermal fluid flow by providing channels of high permeability or they may create
barriers to flow by offsetting areas of high permeability (Muchemi, 2000 and Chorowicz,
2005). The domal uplift caused by the Kenyan dome also created high hydraulic gradient from
recharge areas to the rift floor where most of the geothermal fields are located. The formation
of water catchment areas in Aberdare Ranges and Mau escarpments has ensured a constant
fluid supply to the geothermal areas. GOVC is characterised by a series of structural controls
which depict different tectonic successions (Fig. 7). The most dominant faults include; N-S,
NW-SE, NE-SW, ENE-WSW and a loci of rhyolitic domes which are distinctly visible in
satellite images (Muchemi, 2000 and Omenda, 1998).
The young N-S oriented faults represent the most recent tectonic activity on the rift floor.
Although most of the faults are buried by recent lava flows, their outlines are signalled by
fracturing of the lavas in a E-W direction due to minimum stress action (Muchemi 1998).
Fumerolic activities are also magnified along their profiles. The Ololbutot fracture zone (Fig.
7) is one of the best examples with fumaroles enriched with high sulphur depositions and
temperatures indicative of boiling conditions. According to MANNVIT et al., (2011), the
Ololbutot fault presents an outflow channel that separates the eastern and the western parts of
the geothermal system. Isotope studies from Olkaria fluids show two types of flows; 50% or
more of the fluids originate from deep Rift Valley water oriented N-S, while shallower cold
fluids flow from the western flanks of the escarpment (Wambugu, 1995 & 1996; Karingithi,
1999).
The Olkaria fault zone signifies another set of faulting that runs ENE-WSW from north of
Olkaria hill but is buried by the Quaternary volcanics. The surface manifestations along this
old rejuvenated fault are very distinct and seem to cover a width of about 50-100m where
intense sulphur encrustation and silicification is present. Its estimated surface displacement is
about 5m with a downthrow to the north (Omenda, 1998). Suswa fault has a NE-SW
orientation and occurs on the SW part of the Olkaria geothermal license. It cuts through the
Pleistocene Plateau Trachytes and is visible at its intersection with the NNW regional rift
faults and on the area SE of Suswa volcano (Omenda, 1994).
The ring structure which marks the outer caldera rim of Olkaria is also an important structure
in Olkaria. It is outlined by arcuate alignment of rhyolitic domes which may have been
formed by resurgence of magma due to overpressurised magma chamber after piston collapse
(Naylor, 1972; Clarke et al., 1990; Mungania, 1999). Temperature measurements from
fumaroles and altered grounds indicate high temperature zones to the western segment, along
the Ol Njorowa Gorge and to the South West of Olkaria. The distribution of surface
geothermal manifestations trending in the same direction as the main fault systems suggests

20
that the geothermal system is structurally controlled, as a result indicating permeability and a
possible connection to a heat source (Otieno et al., 2014).
Figure 7: Map showing the surface geology and the structures in the Greater Olkaria
geothermal area (modified from Clarke et al., 1990).
21
2.2 Tectonic Activity
The East African rift is a mobile volcanic belt under constant motion. The movement causes
deformation of the lithosphere resulting in propagation of fractures and faults, reactivation of
buried inactive faults and in some cases, arrest or closure of previously active geological
structures. The deviatoric stress causes strain and deformation along crustal discontinuities
and this has direct effect on groundwater movement (Dzurisin, 2007). This effect may have
partial influences in Lake Naivasha water levels and may be contributing to observed
fluctuations (Awange et al., 2013).
Using Advanced Synthetic Aperture Radar (ASAR) obtained from the European Space
Agency‘s Envisat (Environmental Satellite), it has been possible to monitor slight changes in
elevation along different active volcanic centres in the rift. These measurements have shown
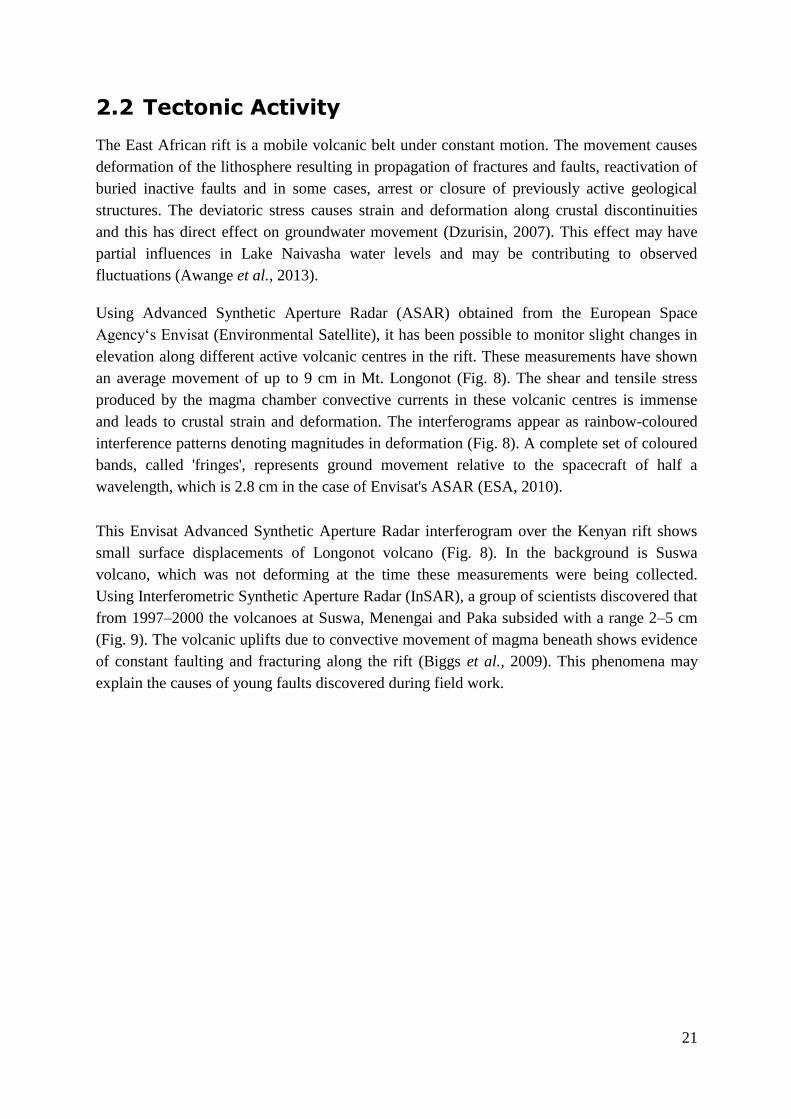
an average movement of up to 9 cm in Mt. Longonot (Fig. 8). The shear and tensile stress
produced by the magma chamber convective currents in these volcanic centres is immense
and leads to crustal strain and deformation. The interferograms appear as rainbow-coloured
interference patterns denoting magnitudes in deformation (Fig. 8). A complete set of coloured
bands, called 'fringes', represents ground movement relative to the spacecraft of half a
wavelength, which is 2.8 cm in the case of Envisat's ASAR (ESA, 2010).
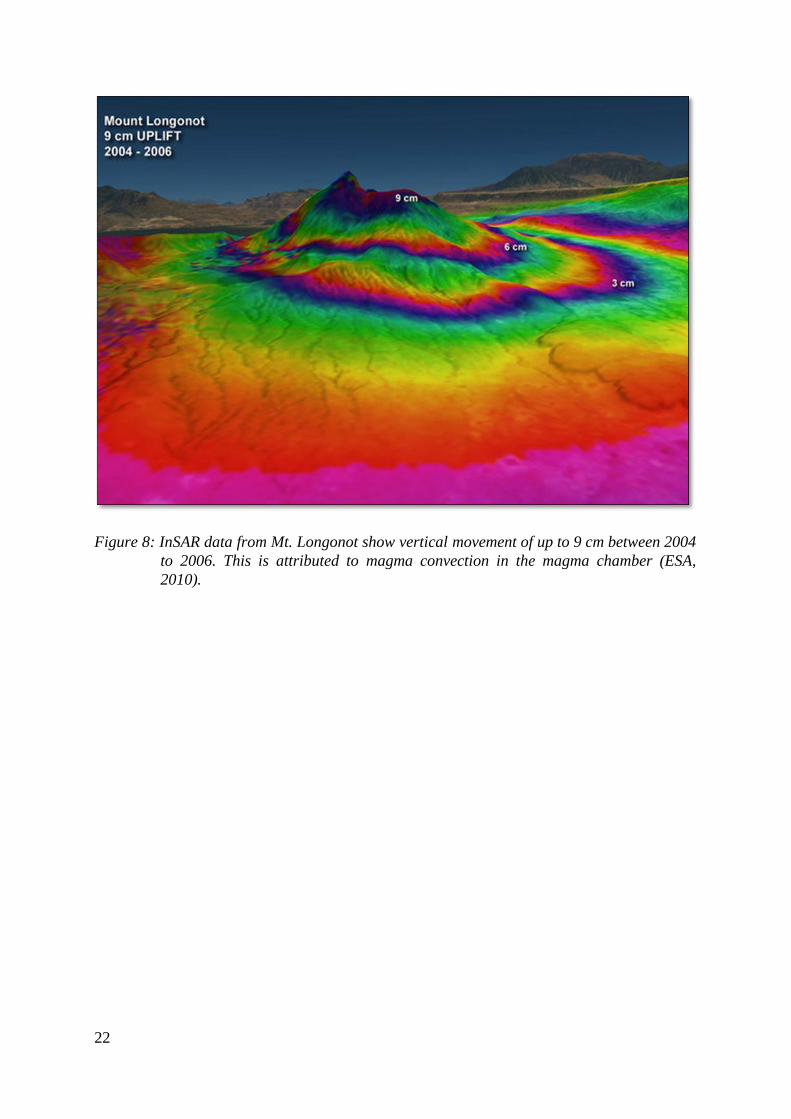
This Envisat Advanced Synthetic Aperture Radar interferogram over the Kenyan rift shows
small surface displacements of Longonot volcano (Fig. 8). In the background is Suswa
volcano, which was not deforming at the time these measurements were being collected.
Using Interferometric Synthetic Aperture Radar (InSAR), a group of scientists discovered that
from 1997–2000 the volcanoes at Suswa, Menengai and Paka subsided with a range 2–5 cm
(Fig. 9). The volcanic uplifts due to convective movement of magma beneath shows evidence
of constant faulting and fracturing along the rift (Biggs et al., 2009). This phenomena may
explain the causes of young faults discovered during field work.
22
Figure 8: InSAR data from Mt. Longonot show vertical movement of up to 9 cm between 2004
to 2006. This is attributed to magma convection in the magma chamber (ESA,
2010).
23
Figure 9: Geodetic activity detected at volcanic centers in the Kenyan rift. A: Location map.
B: Chart summarizing the observations at each volcano during each of the three
time periods initially surveyed (1997–2000, 2003–2006, 2006–2008). Red circles—
subsidence; blue circles—uplift; gray circles—no displacement; empty circles—no
observation due to data gaps or lack of coherence. C: Paka in 2006–2008 (stack of
three interferograms). D: Menengai in 1997–2000. E: Longonot in 2003–2006
(stack of seven interferograms). F: Suswa in 1997–2000. Footprint of geodetic
signature for all four volcanoes is the diameter of the trachytic shields, rather than
the smaller caldera and postcaldera morphology. (Biggs et al., 2009)

24
2.3 Hydrogeology
Groundwater flux ensures steady steam supply to maintain geothermal production in any
geothermal field. It is therefore very important to understand mechanisms enabling movement
of groundwater from the recharge zone to and out of the reservoir system. Geothermal fluids
originate from groundwater which moves through complex geological structural channels to
reach the hot reservoir rocks (Awange et al., 2013). However the modes and mechanisms of
flow of both steam and groundwater are different due to their changes in physical state and
pressure (Todd and Larry, 2005).
Groundwater flow is dependent on hydraulic gradient and intrinsic permeability of the
transmitting medium, assuming uniform viscosity. Groundwater moves through rocks which
contain different transmissivity and porosity values that directly affect their water retention
and transmission capacities respectively. Many faults and fractures have been buried by either
clastic sedimentary material or have been filled up during subsequent eruptions, reducing their
transmissivities. The burying material always reduces the hydraulic conductivity causing
ground water to move very slowly as compared to surface water. Aquifereous strata may be
offset by fault systems making them barriers or channels of groundwater flow (Ralph, 1983).
The Aberdare Ranges located to the east of Central Kenya rift form the main recharge
channels to the floor of the rift. Additional groundwater is received from the Mau catchment
region to the west of the rift. Water movement is mainly through underground channels
formed by enhanced permeability of the regional faults. The main source of fluids in Olkaria
geothermal system is therefore considered to be meteoric in origin (Karingithi, 1999).
Movement of groundwater along the rift basin varies considerably since the lake waters range
from fresh to highly alkaline in their chemistry. Two main flow regimes affecting the
Naivasha basin were identified, namely (1) the fresh underground discharge flow of Lake
Naivasha surrounded by the cold and shallow groundwater table; and (2) the deep, highly
alkaline brines of geothermal origin emanating from deep geothermal reservoirs. Further
piezometric and isotopic studies show that deep groundwater flux occurs both axially along
the rift and laterally from the bordering highlands into the rift. The main outflow of the
shallow groundwater is to the south towards Suswa where these shallow aquifers form a
significant conduit for the southerly flow (Darling et al., 1995).
25
3 Methodology
GIS and remote sensing were integrated in this study and aided in identifying the prospect
areas through a combination of digital data analysis methods. This is due to their capacity to
display various spatial data in one platform for easier correlation. Establishment of
relationships between neighbouring features is key in geothermal mapping. Therefore, by
using these tools, it was possible to overlay data from different exploration methods to create
maps of desired features.
3.1 Desktop Studies
The desktop studies were carried out as part of course work for the MSc degree in Geology at
the University of Iceland beginning from September 2014. Courses in Remote Sensing and
GIS were completed under the program with end of semester reports focusing on preliminary
studies of Central Kenyan rift segment and Olkaria Domes field. The work involved
downloading satellite images from different open source sites and basic image processing to
extract meaningful data. It also entailed compilation of previous geological work done in the
study area and determination of knowledge gaps that needed to be addressed. Older maps
were georeferenced and geological and structural features digitised using ArcGIS. A
geodatabase was created comprising of all feature classes and raster data obtained from
previous maps.
3.2 Preliminary Data Analysis
The remote sensing tool involves use of spatial data obtained by space orbiting vessels that
record radiation properties of different features on the earth´s surface without being in
physical contact (Jian and Philippa, 2009; Michael et al., 2015). The features are
distinguished by their backscattering properties which vary depending on abilities to absorb,
reflect or transmit radiation at different wavelengths of the electromagnetic spectrum
(Lillesand and Kiefer, 2004).
Remote sensing and GIS were used to analyze and interpret some of the surface geology
features with surface footprint with considerable lateral extent to be visible on the satellite
images. Image analysis and enhancement was carried out using ArcGIS software. Mapping of
the volcanic and tectonic landforms was carried out using open source satellite imagery,
complemented by ground truthing during field mapping. Satellite images used in the report
were downloaded from ASTER Global Digital Elevation Models (GDEM), Landsat, Sentinel
Data hub and ASTER Volcanic Archives (AVA) were used to infer other surface features on
26
the ground. One SPOT 5 high resolution image obtained from KenGen was used to analyse
parts of the Ol Njorowa Gorge since it had limited lateral extent east of the gorge. The images
used in preliminary studies were acquired from May, 1987 to April, 2015. The work was
carried out between January to April, 2015 at the University of Iceland, Department of Earth
Sciences laboratories. Based on the initial findings from these preliminary studies, field work
was divided into two phases. One of the areas of interest was demarcated in the Central
Kenyan rift, while the second part was focused in Domes field extending to the area east of
the Olkaria ring structure to the outer caldera rim of Mt. Longonot.
3.3 Reconnaissance Studies
Reconnaissance studies were divided into two phases in line with desktop studies. The first
phase was concentrated on the Central Kenyan Rift and while the second phase was in Olkaria
Domes field. Due to lack of enough time and fiscal resources, the former area was only
studied during reconnaissance. During field visit in phase one, emphasis was laid on the
Kijabe-Limuru area (Fig. 3) due to numerous geothermal manifestations identified during
preliminary investigations. Poor road networks and local communities’ hostilities prevented
exploration of the western part. Field work in Central rift was carried out during the month of
August 2015. The main aim of the reconnaissance was to map the knee joint structure (Fig.
3).
Olkaria Domes field and the area adjacent to the east were explored from September 2015.
The area east of Olkaria Domes field was of particular interest due to lack of surface
geological data which necessitated further exploration in this part of the license. Although one
exploration well (OW-922) was drilled east of Domes field, there was little success during its
discharge testing. This study aimed at determining the potential of the area. Reconnaissance
studies begun on 15th September, 2015 and ran for a week. The main aim of the study was to
get acquainted with the study area, plan for proper traverse routes, assessing the situation of
the existing road networks as well as checking the potential hazards in the operation area.
Since most parts of the Domes field is under the KenGen geothermal licensed area, approval
was granted by the Geothermal Development Director. The Kenya Wildlife Services (KWS)
were also consulted since part of the study area lies in the Hell’s Gate National Park.
3.4 Field Work
Detailed structural geology mapping in Olkaria Domes field begun from 21st September, 2015
and ran to 24th November 2015 where 213 stations were visited and recorded. Target features
included; surface geothermal manifestations, rock outcrops, faults, fractures, eruption centres,
fissures and dykes. To be able to plot these features on a map, it was crucial to record their
geographical location using hand held GPS. Other auxiliary equipment such as geological
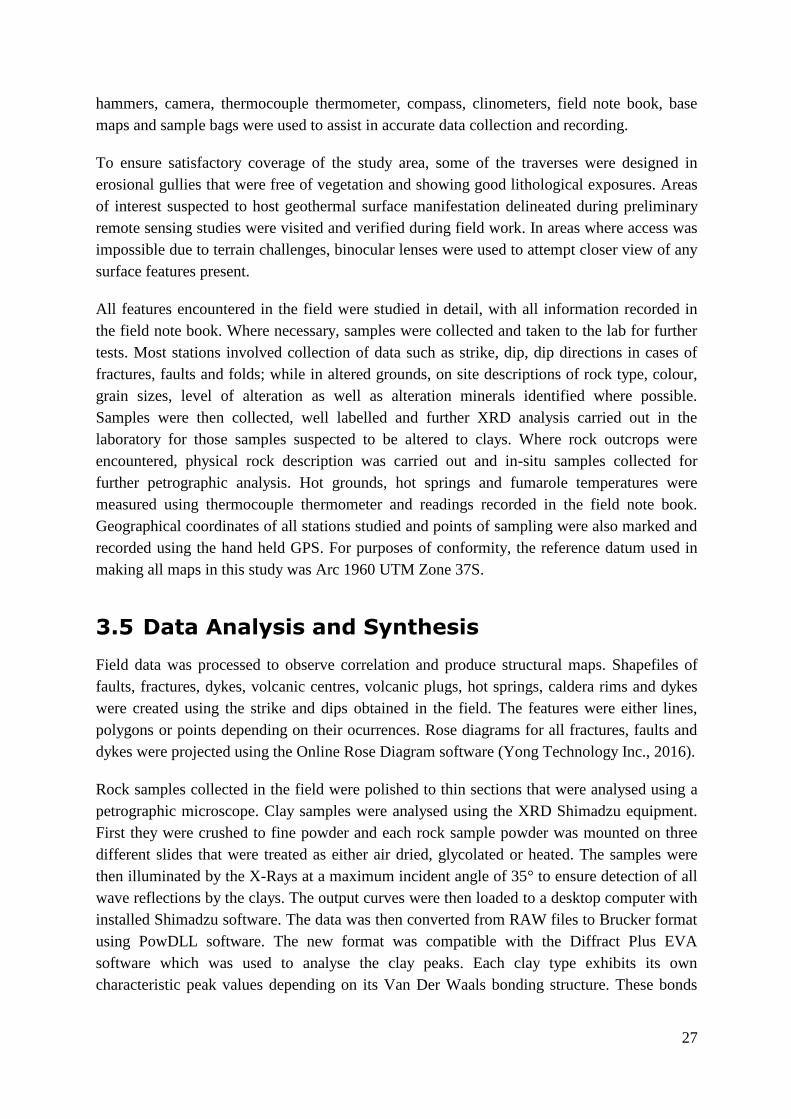
27
hammers, camera, thermocouple thermometer, compass, clinometers, field note book, base
maps and sample bags were used to assist in accurate data collection and recording.
To ensure satisfactory coverage of the study area, some of the traverses were designed in
erosional gullies that were free of vegetation and showing good lithological exposures. Areas
of interest suspected to host geothermal surface manifestation delineated during preliminary
remote sensing studies were visited and verified during field work. In areas where access was
impossible due to terrain challenges, binocular lenses were used to attempt closer view of any
surface features present.
All features encountered in the field were studied in detail, with all information recorded in
the field note book. Where necessary, samples were collected and taken to the lab for further
tests. Most stations involved collection of data such as strike, dip, dip directions in cases of
fractures, faults and folds; while in altered grounds, on site descriptions of rock type, colour,
grain sizes, level of alteration as well as alteration minerals identified where possible.
Samples were then collected, well labelled and further XRD analysis carried out in the
laboratory for those samples suspected to be altered to clays. Where rock outcrops were
encountered, physical rock description was carried out and in-situ samples collected for
further petrographic analysis. Hot grounds, hot springs and fumarole temperatures were
measured using thermocouple thermometer and readings recorded in the field note book.
Geographical coordinates of all stations studied and points of sampling were also marked and
recorded using the hand held GPS. For purposes of conformity, the reference datum used in
making all maps in this study was Arc 1960 UTM Zone 37S.
3.5 Data Analysis and Synthesis
Field data was processed to observe correlation and produce structural maps. Shapefiles of
faults, fractures, dykes, volcanic centres, volcanic plugs, hot springs, caldera rims and dykes
were created using the strike and dips obtained in the field. The features were either lines,
polygons or points depending on their ocurrences. Rose diagrams for all fractures, faults and
dykes were projected using the Online Rose Diagram software (Yong Technology Inc., 2016).
Rock samples collected in the field were polished to thin sections that were analysed using a
petrographic microscope. Clay samples were analysed using the XRD Shimadzu equipment.
First they were crushed to fine powder and each rock sample powder was mounted on three
different slides that were treated as either air dried, glycolated or heated. The samples were
then illuminated by the X-Rays at a maximum incident angle of 35° to ensure detection of all
wave reflections by the clays. The output curves were then loaded to a desktop computer with
installed Shimadzu software. The data was then converted from RAW files to Brucker format
using PowDLL software. The new format was compatible with the Diffract Plus EVA
software which was used to analyse the clay peaks. Each clay type exhibits its own
characteristic peak values depending on its Van Der Waals bonding structure. These bonds
28
which form flat interbedded layers are responsible for reflecting the X-Ray waves. The
synthesised data is discussed in the next chapter and the clay graphs with the peaks are
displayed as appendages.
3.6 Geochemical Soil Gas Surveys
The soil gas surveys were carried out in this study to identify areas of anomalously high gas
concentrations in the soil. The main objective of the soil gas survey in this study was to
determine the existence of buried geological structures in areas with thick pyroclastic
overburden. It is highly recommended in areas with poor surface geothermal manifestations
like the area east of Olkaria Domes field. CO2 and Radon gas sampling were carried out along
grid lines with a separation distance of 500m and stations placed in each sampling point (Fig.
10). Magmatic intrusions are known to release gases from craters, fumaroles or flanks by
diffuse degassing of gaseous species such as carbon dioxide, radon and helium. The gases
move through the easiest routes where rock strata have experienced fracturing and faulting. It
is the distribution and concentration of such gases that information on permeability can be
obtained. It is their high mobility that makes them the best pathfinders for hidden geothermal
resources.

29
Figure 10: Map showing the distribution of geochemical sampling points and their respective
station numbers where soil gas sampling was carried out. The wells are used as
references for ease of navigating the map.

30
3.6.1 Measurement of Carbon Dioxide (CO2)
Soil gas CO2 measurements were also carried out in this study using a Fischer Type Orsat
apparatus (Fig. 11). The soil gas was hand pumped from a depth of about 1m below ground
surface via a hole made using a steel spike with jacket. Once the spike was removed, the outer
jacket was left inside the hole to allow for sampling by fixing a stopper and a horse pipe onto
the mouth of the jacket. The hand pump was used to drive the soil gas from the ground, to the
absorbing pippets of the Orsat apparatus. These vessels measured 100cm3 of gas and
contained 40% potassium hydroxide (KOH) solution that absorbed the acidic carbon dioxide
gas. The corresponding changes in volume in the absorption vessels represented the amount
of CO2 gas as a percentage volume of the total gas. Therefore, by quantitative analysis, the
volume of CO2 dissolved was determined. This method assumed that no other gas apart from
CO2 was dissolved or lost during the measurement.

31
Figure 11: Image of an Orsat aparatus used in measuring relative CO2 abundance in soil.
(courtesy of EEE Ltd, 2016)

32
3.6.2 Radon Gas Measurements
The radon radioactivity levels were measured using a portable radon detector also known as
the emanometer. The measurements were done using the spike as used for CO2 sampling
above where a stopper attached to a flexible tube was fixed to the mouth of the outer jacket
and gas sniffed by a radon detector using an inbuilt meter pump. The soil gas sample hosting
radon gas was pumped into a decay chamber of the emanometer consisting of a cylindrical
copper can, whose walls were coated with zinc sulphide where the radon decays into other
radio-nuclides by emitting alpha particles. The readings were recorded in real time as counts
per minutes (cpm). Three background readings were taken at three minute intervals prior to
the introduction of the sample into the emanometer. Once the sample was introduced, three
more readings were taken at three minute intervals to give the total radon count.
All the data was recorded in a field note book together with GPS waypoints to enable plotting
it on a map. Soil temperatures in every station was also recorded.

33
4 Results
When rocks are subjected to hydrothermal alteration in geothermal areas, changes in
mineralogy occur as a result of hot fluid and rock interaction. In some instances, the mineral
alteration reaches the surface due to enhanced permeability caused by structures such as faults
and fractures. These fluids alter the ground surface to show evidence of geothermal activity
beneath. Hydrothermal fluids also form secondary minerals which are precipitated on the
surface due to reduction in pressure and temperature conditions (Tole, 1996).
Freek et al., (2014) classified the above changes either as direct or indirect. The direct
changes are those affected and linked directly to geothermal activities while indirect changes
are those that require further inferencing and interpretation leading to effects of geothermal
activities. Direct changes may include formation of features such as calderas, faults, hot
springs, steaming grounds, and fumaroles. Surface manifestations mostly occur in a
structurally controlled manner to depict preferred permeability zones. This linearity was easily
detected during this study by use of remote sensing techniques.
Indirect changes are those interpreted changes based on scientific observations and testing of
crustal materials. For example, zones with elevated CO2 soil gas may be as a result of shallow
seated intrusions which are degassing during periods of cooling. Radon gas may be a product
or radioactive decay of Uranium from magmatic sources. Due to its short half life, its
detection near the surface would signify high speed transient times, likely to signify
movement in fractured or faulted paths. Presence of geothermal grass on the surface maybe
interpreted to be caused by hydrothermal alteration.
Fratures, faults, surface temperature, soil gas variations and alteration mineralogy can
therefore be directly or indirectly linked to geothermal activities on the surface of a
geothermal field. Using ArcGIS, it was possible to place these features on a map and analyse
their trends.
4.1 Surface Geology
The main rock types encountered throughout the Central rift region and Olkaria Domes were;
volcanic ashes, trachytes, rhyolites, basalts, tuffs brecciated materials and lacustrine deposits.
Rhyolites are predominant in Olkaria volcanic complex while basalts lava flows occur at the
south western side of Olkaria, immediately outside the caldera rim. Basalts dominate Kijabe
hill and are also observed in dykes around Kijabe town. Lacustrine deposits are dominant in
34
low elevation areas whose source is lake deposition during the Lake Naivasha flood period
(10-30Ka) (Clarke et al., 1990). Longonot pyroclastics extend to the northeast covering most
parts of Naivasha, Longonot and Kijabe areas. They are also encountered in Domes field
where they form thick deposits. They seem to have been deposited as pyroclastic flows close
to the caldera while the ones further away may have been blown by wind. Mt. Margaret is
dominated by trachytic lava flows which have limited extent. Suswa volcano is mainly
covered by trachytes which are evident in outcrops adjacent to Suswa Town (Fig. 12).
Volcanic cones of trachytic and pumaceous composition are present at the Suswa caldera
floor. Some of the most dominant rocks encountered are described below.
4.1.1 Lacustrine Sediments (100 Ka)
The sediments form the most recent cover of the Kedong Basin and Ol Tepesi plain to the
south (Guth and Wood, 2013) (Fig. 12). It is envisaged that the formation resulted from
deposition of reworked lake sediments when the flooded Lake Naivasha was suddenly
emptied. In hand specimen, the formation is cream to pale yellow in colour, fine grained, non
porphyritic clastic material derived from different rock types and organic material. In situ
encounters show well graded and good sorting of strata signifying different water flow
patterns during deposition. The formation produces very fine dust in areas with scarce
vegetation and is prone to rapid erosion forming deep gullies. Sand sized deposits are
observed with thicknesses of up to 10m. The numerous deposits are harnessed for building
sand. Baker et al., (1972) named this formation as the Kedong Flood formation which is
comprised of sand and fine gravel.
4.1.2 Longonot Pyroclastics (0.2 – 400 Ka)
They form the most recent plinian eruption material from Longonot volcano which are
dominant on the eastern escarpment and north of Naivasha town (Fig. 12). Thin ash fall
deposits are encountered in Karati area, north east of Naivasha town. In hand speciment, the
pyroclastics appear light grey to brown, unconsolidated clastics composed of tuffaceous and
pumiceous fragments. Also noted are obsidian, and volcanic glass fragments. Minimal
hydrothermal alteration is noted on the formation except in parts of Olkaria Domes field
where argillic alteration to smectite and kaolinite clays were noted (see section 4.2.6 below).
Thick deposits are encountered in Domes field where average thickness is estimated to be up
to 350m. The deposits are intercalated with pale grey pumice intermitent layers which are also
observed east of Longonot town. These pumice deposits are mined and sold to flower farmers
since they are rich in phosphorous which accelerates plant growth. These deposits are also
intercalated with Olkaria volcanic ashes which are dominantly reddish brown and Suswa
ashes which are light grey to cream in colour.

35
4.1.3 Kinangop tuffs (3.4 – 3.7 Ma)
The tuffs originated from Kinangop flank eruptions during formation of Aberdare Ranges.
They are exposed in most parts of the eastern escarpment where various artisan quarrying is
ongoing (Fig. 12). The deposits are between 20 to 40m thick. The tuffs were formed by
consolidation of ash and volcanic material that was airlifted, transported away from the vent
and deposited. The tuffs can also be categorised to three distinct series which are
distinguishable by their physical properties as follows below.
Non homogeneous tuff being the most recent, appears as dark grey, poorly consolidated, non
porphyritic rock composed of ash matrix cementing different light grey to brown clastic
sediments composed of volcanic bombs and gravels. They are locally known as Githunju and
forms the upper parts of most quarries along the eastern flanks of the Central rift.
Homogeneous tuff is also grey in colour but moderately consolidated. It is composed of
volcanic material including pumice which are cemented by fine grained ash. This is more
preferrred by masons since its compact and easier to shape. It is locally known as Grey.
Lithic tuffs are widely variant in colour from light grey to brown and cream colour. They are
well sorted, fine grained highly consolidated with no crystallinity in their structure. The rock
is highly compact and is a nightmare to masons due to its heavy weight compared to the
previous two but its only advantage is that it exhibits near perfect brittle fracture. This makes
it easy to blast the outcrops with explosives. This formation is locally known as Curve since
they produce straight face blocks after curving.
4.1.4 Trachytes (0.1 Ka - 6.9 Ma)
The rocks are characterised by a dark grey to black colour, fine grained, moderately
porphyritic with euhedral crystals of sanidine feldspar. In thin section, the rocks are fine
grained, porphyritic with abundant sanidines, pyroxenes, biotite and mafic minerals observed.
Sanidines are distinguished by the prismatic shape, simple twinning and euhedral perfect
crystal faces along 001. Pyroxene group is divided into ortho and clinopyroxenes which can
be optically distinguished since orthopyroxenes have maximum interference colours of upper
first order, while clinopyroxenes range to upper second order colours. Extinction angle were
also used to differentiate between the two pyroxenes, as orthopyroxenes have parallel
extinction and clinopyroxenes have inclined extinction. Both types were found to exhibit
good cleavage intersections of 90°.
The rock is relatively fresh in most encountered outcrops but slight to moderate weathering
and oxidation phenomena are rarely observed. Trachytes are a common and characteristic
occurence in high altitude areas. This may be due to their erosion resistance nature compared
to the more prone pyroclastic and tuff counterparts. In some parts, they are exposed along

36
deeply eroded rift shoulder faults while in other circumstances, they form volcanic cones as
well as recent episodes of extrusions in edifice geometries.
Trachytes were encountered in Mt. Longonot, southwest of Olkaria caldera, Kamuyu hills
located along the east rift escarpment in Mirera area, along the eastern rift scarp near Kijabe
where the rocks are exposed along a stream profile, at view point section along Kamandura –
Mai Mahiu road, Mt. Longonot trachyte flows observed on the flanks and summit of this hill
and in Suswa volcano (Fig. 12). Numerous cinder cones around Suswa and Duka moja area
are trachytic in composition.
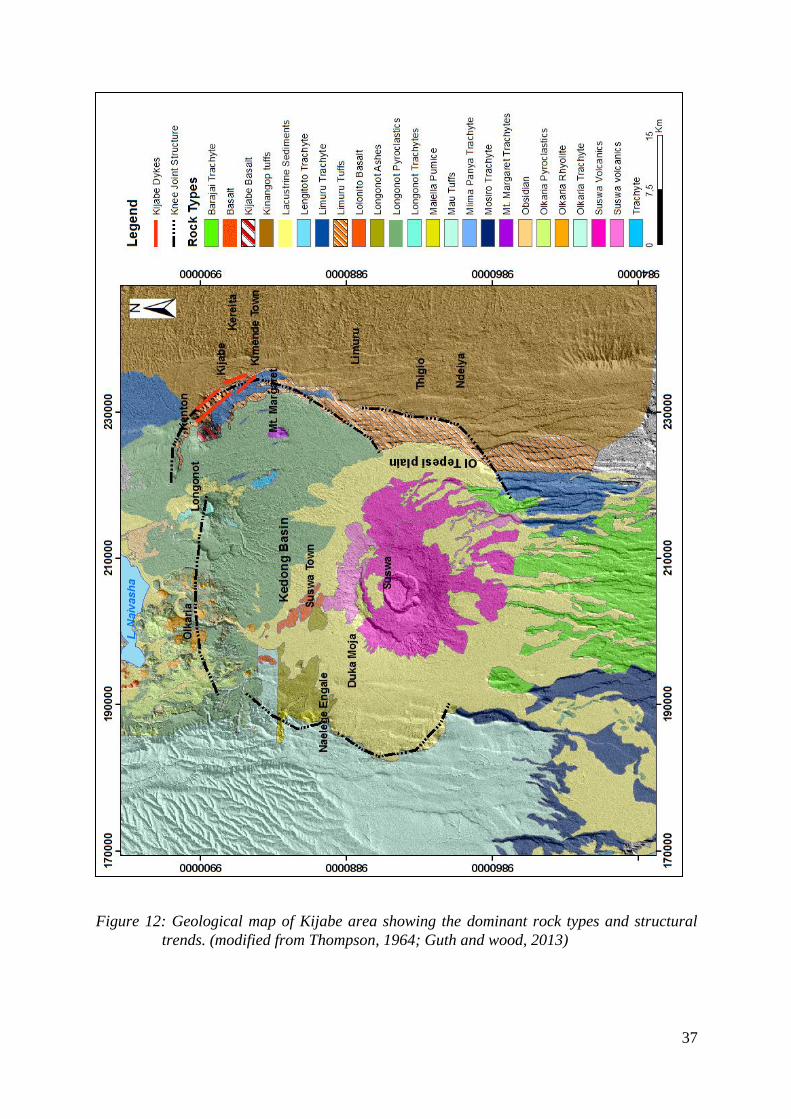
37
Figure 12: Geological map of Kijabe area showing the dominant rock types and structural
trends. (modified from Thompson, 1964; Guth and wood, 2013)
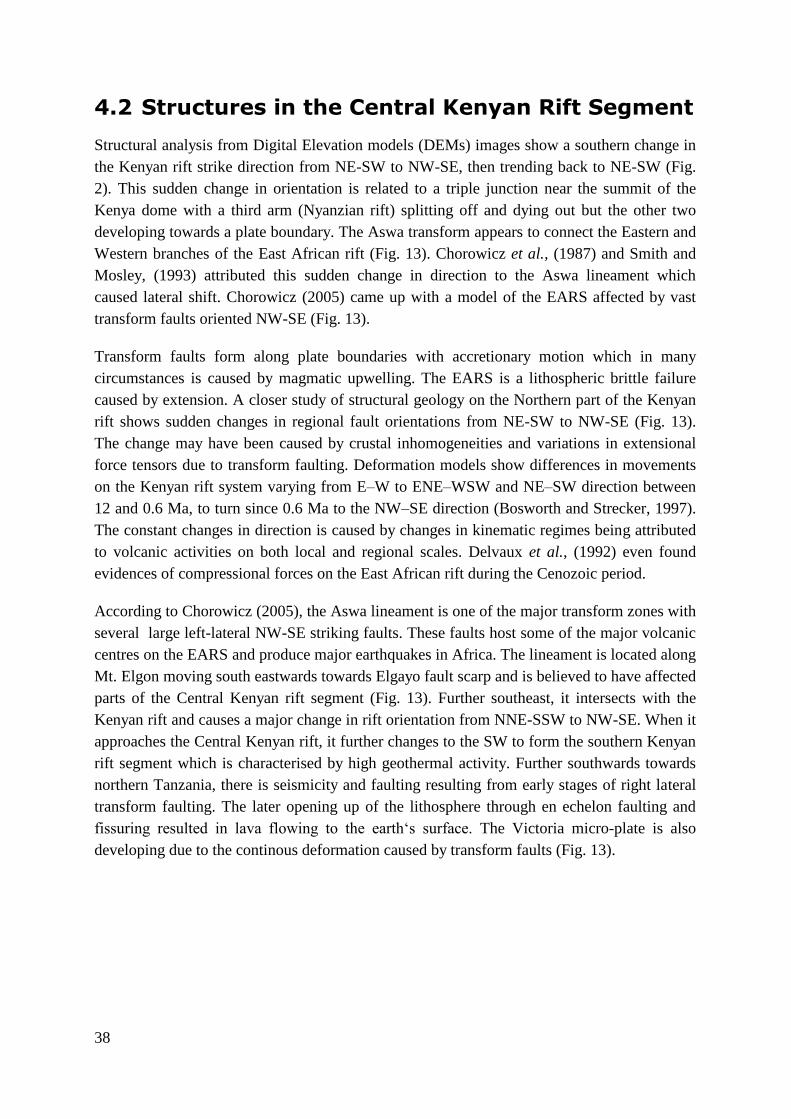
38
4.2 Structures in the Central Kenyan Rift Segment
Structural analysis from Digital Elevation models (DEMs) images show a southern change in
the Kenyan rift strike direction from NE-SW to NW-SE, then trending back to NE-SW (Fig.
2). This sudden change in orientation is related to a triple junction near the summit of the
Kenya dome with a third arm (Nyanzian rift) splitting off and dying out but the other two
developing towards a plate boundary. The Aswa transform appears to connect the Eastern and
Western branches of the East African rift (Fig. 13). Chorowicz et al., (1987) and Smith and
Mosley, (1993) attributed this sudden change in direction to the Aswa lineament which
caused lateral shift. Chorowicz (2005) came up with a model of the EARS affected by vast
transform faults oriented NW-SE (Fig. 13).
Transform faults form along plate boundaries with accretionary motion which in many
circumstances is caused by magmatic upwelling. The EARS is a lithospheric brittle failure
caused by extension. A closer study of structural geology on the Northern part of the Kenyan
rift shows sudden changes in regional fault orientations from NE-SW to NW-SE (Fig. 13).
The change may have been caused by crustal inhomogeneities and variations in extensional
force tensors due to transform faulting. Deformation models show differences in movements
on the Kenyan rift system varying from E–W to ENE–WSW and NE–SW direction between
12 and 0.6 Ma, to turn since 0.6 Ma to the NW–SE direction (Bosworth and Strecker, 1997).
The constant changes in direction is caused by changes in kinematic regimes being attributed
to volcanic activities on both local and regional scales. Delvaux et al., (1992) even found
evidences of compressional forces on the East African rift during the Cenozoic period.
According to Chorowicz (2005), the Aswa lineament is one of the major transform zones with
several large left-lateral NW-SE striking faults. These faults host some of the major volcanic
centres on the EARS and produce major earthquakes in Africa. The lineament is located along
Mt. Elgon moving south eastwards towards Elgayo fault scarp and is believed to have affected
parts of the Central Kenyan rift segment (Fig. 13). Further southeast, it intersects with the
Kenyan rift and causes a major change in rift orientation from NNE-SSW to NW-SE. When it
approaches the Central Kenyan rift, it further changes to the SW to form the southern Kenyan
rift segment which is characterised by high geothermal activity. Further southwards towards
northern Tanzania, there is seismicity and faulting resulting from early stages of right lateral
transform faulting. The later opening up of the lithosphere through en echelon faulting and
fissuring resulted in lava flowing to the earth‘s surface. The Victoria micro-plate is also
developing due to the continous deformation caused by transform faults (Fig. 13).

39
Figure 13: Map showing the transform zones that led to the changes in rift orientations. The
Aswa transform zone is located west of the Kenyan rift and is believed to be the
host of the Aswa lineament. Lateral spreading has formed the Victoria micro-plate.
Black lines indicate existing major rift faults while the white arrows represent the
direction of relative crustal movement (Chorowicz, 2005).
Victoria
micro-plate

40
Analysis of DEMs show evidence of lateral shift of faults along the Central Kenyan rift
shoulders (Fig. 14 where left lateral movement was observed. Transforms of regional scale
can be noted from the Nyanzian Triple junction to Olkaria-Longonot axis where the rift
orientation temporarily changes to NW-SE but later reverts to its normal NE-SW course (Fig.
14). There is significant lateral shift resulting to formation of E-W loading zones and
subsequent displacement of the N-S regional rifting. The E-W oriented faults have been
previously observed in Eburru where dyke systems may have been extruded to form volcanic
edifice (Mwania et al., 2014). The Eburru massif is also oriented in the E-W direction
depicting great influence of these structures in it´s plumbing system.
Local transform faulting is also suspected in the area between Domes field and the outer
caldera rim of Mt. Longonot where similar E-W fault trends were observed. The zone has
characteristic ridges aligned in an E-W direction. The ridges show recent tectonic movements
imprinted by folding and normal faulting on younger pyroclastics. Structural mapping results
also show changes in fault orientations from the general N-S strikes to E-W trends further
supporting the theory of transform faulting. The detailed account of these findings is
documented in the next section. This transform zone may be connected to the Aswa transform
zone (Fig. 20).
The Central Kenyan rift hosts an arc like axial rift scarp south of Lake Naivasha forming a
circular structure (referred as cauldron or knee joint structure) with Suswa volcano being at its
centre (Fig. 14). These arcs may have been a result of subsidence caused by panache ductile
failure of the lithosphere during a period of low pressure in a magma chamber beneath the
circular structure. Circular subsidence patterns have been modeled using the Mogi point
source model and proven that surface deformation patterns are influenced by subsurface
pressure changes caused by magma movement (Mogi 1958, Dzurisin 2007). Magma
chambers are assumed to be fluid-pressurized ellipsoidal cavities in an elastic crust of infinite
length and uniform elasticity (elastic half-space). Considering any particular source depth and
geometry, the surface deformation is proportional to the ratio of the cavity pressure change to
the half-space elastic modulus (6.P/G), and to a lesser extent with Poisson's ratio (elastic
properties of the crust) (Dzurisin, 2007). Emptying of a magma chamber results in spheroidal
surface deformation whose magnitude of deformation depends on the size of the magma
cavity. The size of the cavity is the key factor between the pressure and volume change. Large
eruptions that are within the elastic limit of the crust require large magma cavities (Dzurisin,
2007).
41
Figure 14: DEM of the Kenyan Rift System with the black lines showing the general
orientation of the rift. The blue lines are indicative of areas affected by transform
faulting while the black arrows show direction of lateral movement.
42
Kuria et al., (2010) showed evidence of a shallow magma source in the circular structure from
magnetic surveys carried out along the Kenyan Rift. He used aeromagnetic data acquired
using the African Magnetic Mapping Project (AMMP) to estimate the Curie Point Depth
(CPD) of subsurface rocks. The main aim was to study the crustal thermal regime of the
Kenyan rift and identify it´s potential for geothermal resources. The data has a spatial
resolution of 2 km and flight direction of 90° running in W-E direction at a flight height of
2896 m above mean sea level. His results discovered a shallow CPD with dimensions of 52
km by 37 km coinciding with the knee joint structure with an estimated diameter of 50km by
30km. Other smaller and shallow CPDs throughout the Kenyan rift also correlate very well to
the known central volcanoes with shallow magma chambers which hold geothermal potential.
(Kuria et al., 2010) (Fig. 15).
Kuria et al., (2010) attributed occurrence of part of the shallow CPD to Olkaria Geothermal
field and validated his assumption using temperature logs from deep drilled wells in Olkaria
Geothermal Field but did not envisage presence of the knee joint structure. However,
according to previous geophysical studies carried out in Olkaria geothermal field, it is
apparent that the shallow magma chamber which forms the main heat source does not extend
outside the Olkaria caldera (Simiyu and Keller 1997, Simiyu et al., 1995). The depth of
Olkaria magma chamber has been estimated to be 6 km deep, which is much shallower than
the estimated CPD of 15 km. This data was therefore used to infer presence of a larger magma
source for the c. The magma cavity may have formed shallow magma chambers that supply
Olkaria, Longonot and Suswa volcanoes. This theory is still in its infancy and requires more
research.
Numerous basaltic dykes observed along the eastern escarpment from Kijabe area may have
also originated from the big magma chamber. The dykes have a N-S orientation and depict
recent volcanic activity. They may be heating shallow groundwater to form hotsprings at
Kinari forest with temperatures of 44.5°C (Clarke et al., 1990). The dykes indicate presence
of a shallow heat source in contact with the groundwater table or a mix of upflowing
hydrothermal fluids with meteoric waters. Fumerolic activities were also observed in Mt.
Margret with temperatures ranging from 65°C to 89°C (Clarke et al., 1990).
The shallow magma chamber may further be responsible for elevated CO2 gas around Kerita
area (Darling et al., 1995). The gas has been harnessed by Carbacid Ltd for more than five
decades. The company has drilled several wells about 2 km east of Kimende township where
the gas is collected, purified and sold to beverage industries as a preservative. According to
previous sampling done by Darling et al., (1995), the wells appear to derive most of their CO2
from a gas spring of inorganic crustal source. However, there is need to carry out detailed
petrochemical and geophysical research to determine the paragenesis of this feature and
determine its mode of formation.

43
Figure 15: Map showing variation in Curie Point Depth (CPD) along the Kenyan rift system.
The red bold lines show the regional fault systems which also mark the rift
boundary. The map shows a local shallow CPD around Suswa, Longonot and
Olkaria, south of Lake Naivasha which is marked by a dark blue colour (Kuria et
al., 2010).

44
4.3 Olkaria Domes Field
Phase two of the study was concentrated in Olkaria Domes field and the area East of Domes.
The total area of study is approximately 60 km2. Vegetation cover and rough terrain in some
parts were serious hinderances to the mapping exercise. Dense vegetation made it very
difficult to delineate geological features from satellite images and necessitated field
excursions. Most of the structures observed are detailed below;
4.3.1 Fractures
Fracture formation precedes faulting in an extensional stress field. During periods of volcanic
unrest, they are initiated by magma resurgence and are driven open to the earth’s surface
(Galland et al., 2014). Rock fractures were the most common stress indicators in the field.
Their sizes varying from micro-cracks that dissect small rock grains to veins and huge cracks.
Veins and veinlets are micro-fractures infilled with hydrothermal fluid precipitates. These
have been identified in numerous drill cuttings from wells drilled in Olkaria geothermal field.
When rocks are subjected to pressure, displacement also occurs resulting to varying degrees
of openings. In an active rift zone, the displacement is mostly heterogeneous and
discontinuous.
Formation of fractures is mainly attributed to increased stress along areas of weakness in the
crust. When fractures are subjected to vertical displacements in active tectonic environments,
they form normal, reverse, thrust or strike slip faults. The stress which is a driving force may
originate from over pressurized magma chambers or due to other plate tectonic forces. Some
rocks may behave as plastics when critical stress is reached and result in formation of folds.
Since the resultant plastic deformation is permanent, the rock strata do not regain their
original shape even after the removal of the stress. Other rocks easily fracture when subjected
to an external force. These rocks are said to exhibit brittle properties (Giordano et al., 2013).
Fractures are the main avenues of fluid movement in Olkaria geothermal reservoir. They may
be responsible for bulk fluid transport, especially where they form a system of interconnected
clusters. This condition of cluster existence is commonly known as the percolation threshold
(Tsang and Neretnieks, 1998). The permeability associated with this threshold is dependent
on regional and local fracture trends.
Fractures were dominantly found in consolidated pyroclastics that lie beneath volcanic ashes
and pumice deposits (Fig. 16). The fracture patterns showed varying orientation, but mainly
NW-SE, NE-SW and NNW-SSE directions (Rose diagram Fig. 17). Some of the fractures
conform to the general rift orientation, although they might be significantly younger than the
rifting process. This may be a clear indication of continued stress conditions, probably due to
continued rifting processes or caused by subsequent recent volcanic re-activation. Most of the
fracture systems with NW-SE strike were mostly noted along the Ol Njorowa Gorge (Fig. 17).
They may have been formed during the dyke extrusion period, where rhyolitic material was
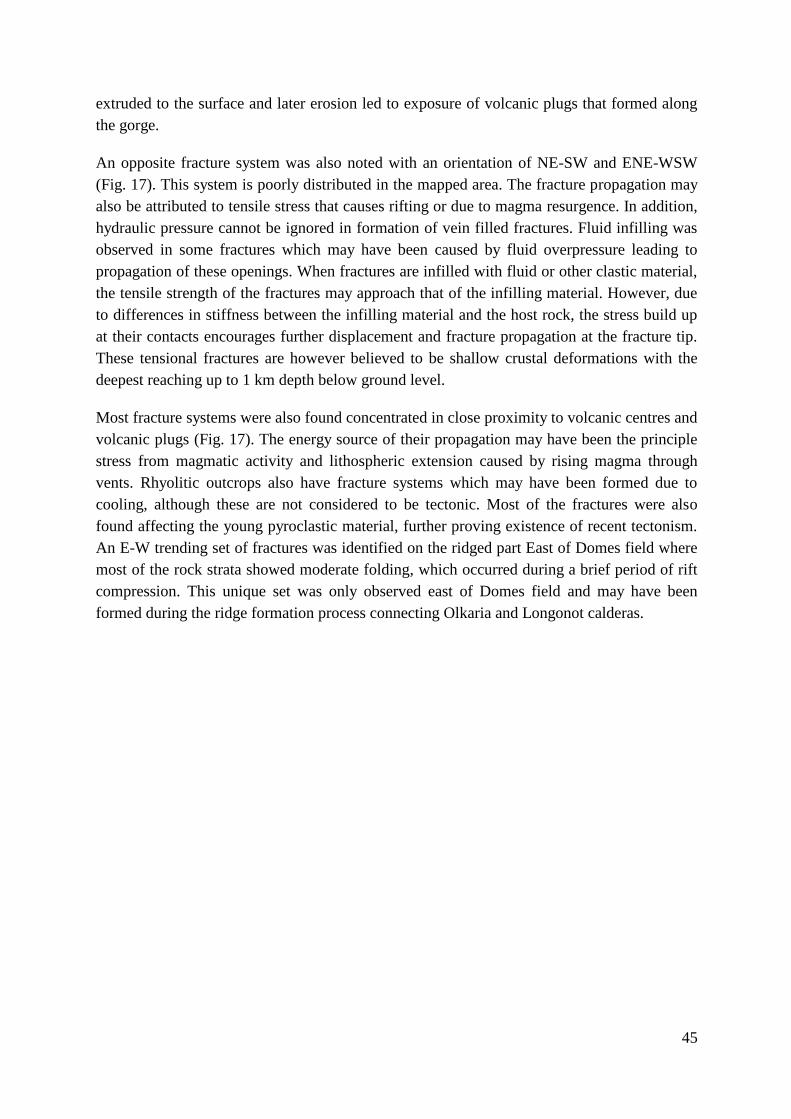
45
extruded to the surface and later erosion led to exposure of volcanic plugs that formed along
the gorge.
An opposite fracture system was also noted with an orientation of NE-SW and ENE-WSW
(Fig. 17). This system is poorly distributed in the mapped area. The fracture propagation may
also be attributed to tensile stress that causes rifting or due to magma resurgence. In addition,
hydraulic pressure cannot be ignored in formation of vein filled fractures. Fluid infilling was
observed in some fractures which may have been caused by fluid overpressure leading to
propagation of these openings. When fractures are infilled with fluid or other clastic material,
the tensile strength of the fractures may approach that of the infilling material. However, due
to differences in stiffness between the infilling material and the host rock, the stress build up
at their contacts encourages further displacement and fracture propagation at the fracture tip.
These tensional fractures are however believed to be shallow crustal deformations with the
deepest reaching up to 1 km depth below ground level.
Most fracture systems were also found concentrated in close proximity to volcanic centres and
volcanic plugs (Fig. 17). The energy source of their propagation may have been the principle
stress from magmatic activity and lithospheric extension caused by rising magma through
vents. Rhyolitic outcrops also have fracture systems which may have been formed due to
cooling, although these are not considered to be tectonic. Most of the fractures were also
found affecting the young pyroclastic material, further proving existence of recent tectonism.
An E-W trending set of fractures was identified on the ridged part East of Domes field where
most of the rock strata showed moderate folding, which occurred during a brief period of rift
compression. This unique set was only observed east of Domes field and may have been
formed during the ridge formation process connecting Olkaria and Longonot calderas.

46
Figure 16: Plate showing one of the NW-SE fractures located on the ridge. Fracture
deflection, shown by the white line while the black dotted line shows layer
contacts with a displacement of a few centimeters.
Layer 1
Layer 2
Rock boundary

47
Figure 17: Map showing location and strike of mapped fractures as observed in the field with
varying orientations as shown by the rose diagram on the lower right. The black
lines labeled ás existing fractures show previously mapped fractures on the
Southeast field while the blue lines show the fractures mapped during this study.

48
During geothermal drilling in Olkaria, fractures have always been observed in rock cuttings
where most infilling minerals are secondary in origin. They are sometimes referred to as
mineral veins, micro fractures or veins. Most of the productive wells have recorded high
numbers of fractured strata at depth. These veins are partly or completely filled with
secondary quartz, calcite, zeolites, clays, epidote, prenhite, actinolite among others. The
alteration minerals are useful indicators of formation temperature and reservoir conditions
during drilling. Fractures completely filled with secondary minerals like calcite, may
sometimes form barriers to fluid flow. Some of them are tips of bigger fracture or fault zones
that may be located much deeper where geothermal fluids formed pathways (Sæmundsson,
2007). However, due to their small sizes and reduced fluid velocities, saturated fluids tend to
settle in and precipitate the secondary minerals depending on temperature and pressure
conditions in the reservoir. Where the network of fractures is well connected, they form
fracture-parallel permeability, which may be enhanced by alteration of minerals in the host
rock.
4.3.2 Faults
Formation of faults requires two types of forces that act on a plane in a rock; they include
body forces and surface forces. Body forces act directly on the particles of the rock and are
given as force per unit mass or per unit volume and a good example is gravitational force.
Surface forces act across crustal surfaces and can further be categorized as compressive or
tensile forces; a good example is tectonic forces associated with plate movements (Peacock et
al., 1999). In rift systems, the most common surface force is tensile stress. Existing fault
systems are very significant bulk fluid transport channels. They create high permeable zones
for fluid movement, hydrothermal mineralisation and tectonic activity avenues (Hutchinson et
al., 2015). Understanding regional rift faults gives insight to evolution of rift zones and
magma movement. Faults also act as important carriers for gases from magmatic sources and
bring them to the surface. They may however be affected by near surface permeability
variations due to changes in lithology and topography.
In the current study, extensional deformation patterns were mainly identified and gave some
background information regarding the recent tectonic activity in the area. Although most
extensional faults in a rift environment are believed not to be more than one kilometer deep
(Gudmundsson, 2011), their presence, especially in geothermal areas, is vital for fluid
movement. They are good channels for infiltrating meteoric water to the deeper geothermal
reservoirs, especially where magmatic activities have caused rejuvenation of older faults.
They are responsible for increasing the surface area to volume ratio for fluid to interact with
hot rocks. Different types of faults were encountered in the study area depicting different
modes of formation.

49
4.3.2 (a) Normal Faults
In most cases, normal faulting dominated the study area. The faults were observed along
erosional gullies as lithological displacements. From the plotted Rose diagram, most faults
were oriented NW-SE, NNW-SSE, ENE-WSW and NE-SW while a few of the faults had E-
W and N-S orientations (Fig. 20). Others appear on the surface greatly influencing the
topography with their throws ranging from 5m to 50m and dips from 40° to 90°. Dip directions
range from NE to NW. Faults with the highest displacements were mostly located along the
Ol Njorowa Gorge and are clearly observed in satellite images. Their strike ranges from NW-
SE to NE-SW and have highly influenced the orientation of the gorge. The normal faults form
mini-grabens along the gorge with throws of up to 50m (Fig. 19). Other extensional faults
were encountered East of Domes with their orientations ranging from NE-SW, SW-NE,
WNW-ESE and ENE-WSW (Fig. 20). Their orientation is in line with the general rift
direction and may have formed during the continous rifting process. The N-S faults are the
most recent with resultant dyke emplacements mainly along the gorge. These faults have
undifferenciated pyroclastic and tuff material that is brecciated and deposited along the fault
planes (Fig. 20).
The E-W features are limited in extent and may be attributed to transform faulting that formed
the E-W oriented ridges between Longonot outer caldera and Olkaria caldera rim (Fig. 20). A
clear relationship could not be conceived at this stage due to defficient subsurface data which
is required to understand the stratigraphic sequence of this area. They range in displacement
from 2m to 10m. These faults acted on the recent pumaceous and pyroclastic deposits. The
faults are therefore presumed to be younger than the thick pyroclastic deposits from Mt.
Longonot by relative dating. This is further evidence of constant crustal deformation caused
by volcanic and tectonic activities in an active rift system.
Some gullies have been formed by the process of erosion along fault planes which are crustal
weak point. Continued erosion continuously deepens the gullies and sometimes form seasonal
stream channels and flash flood channels. Deep gullies along these fault lines expose
lithological sequences displaying lithological displacement between the valley walls (Fig. 18)
with the brown volcanic ash layer showing a relative throw of about 5m. The white ash was
only visible on the right hand side of the photo but its buried to the left. In these
circumstances, it was difficult to determine the dip of the fault but the general orientation was
identified to be NW-SE. The grey ash that has covered the valley walls was deposited by wind
or water erosion reducing the exposure.

50
Figure 18: Normal faulting depicted by the white ash deposits exposed on the right side of the
valley with no trace of the deposit on the left, a clear indication of displacement.
Figure 19: Normal faulting along Ol Njorowa Gorge. The ‘stand alone’ rock column in the
basin is the Fischer´s Tower.
Possible fault axis
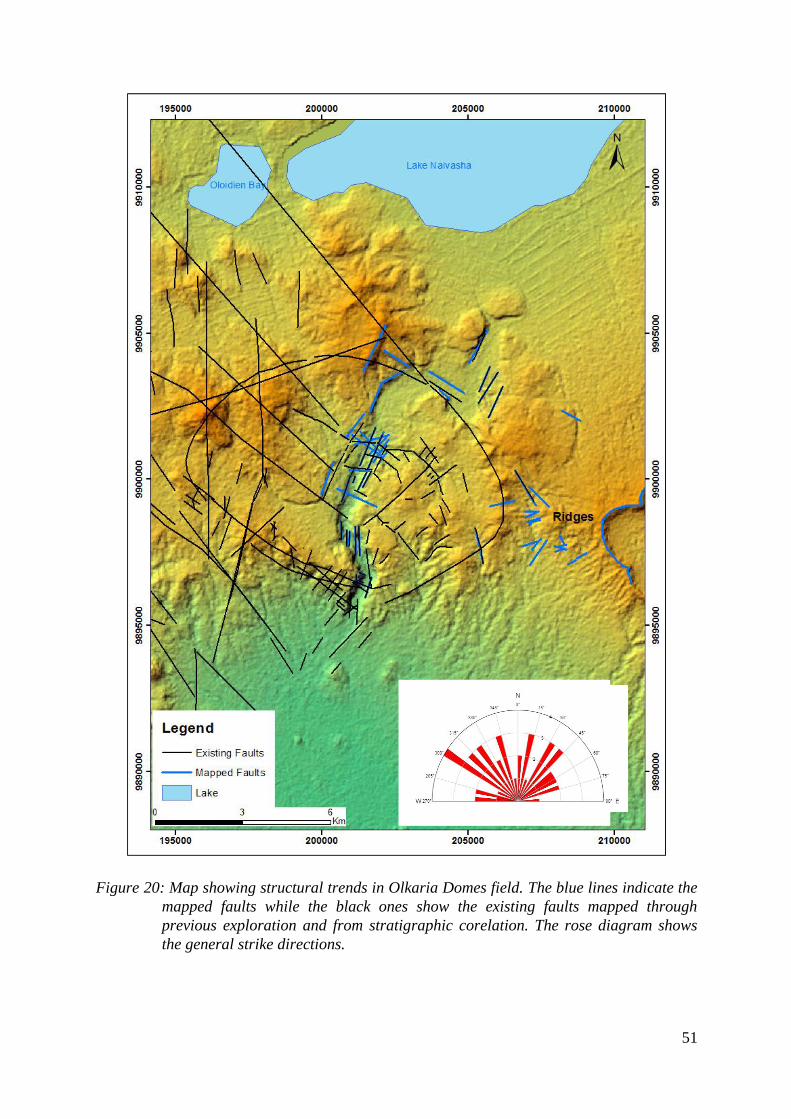
51
Figure 20: Map showing structural trends in Olkaria Domes field. The blue lines indicate the
mapped faults while the black ones show the existing faults mapped through
previous exploration and from stratigraphic corelation. The rose diagram shows
the general strike directions.
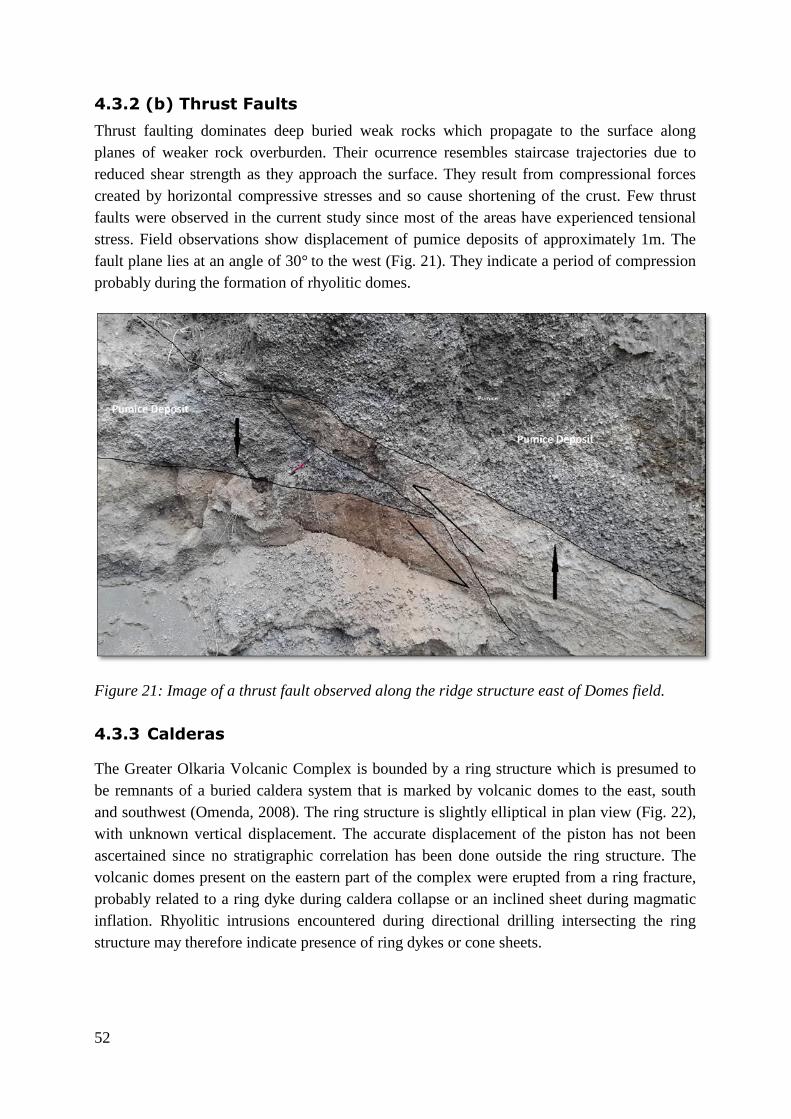
52
4.3.2 (b) Thrust Faults
Thrust faulting dominates deep buried weak rocks which propagate to the surface along
planes of weaker rock overburden. Their ocurrence resembles staircase trajectories due to
reduced shear strength as they approach the surface. They result from compressional forces
created by horizontal compressive stresses and so cause shortening of the crust. Few thrust
faults were observed in the current study since most of the areas have experienced tensional
stress. Field observations show displacement of pumice deposits of approximately 1m. The
fault plane lies at an angle of 30° to the west (Fig. 21). They indicate a period of compression
probably during the formation of rhyolitic domes.
Figure 21: Image of a thrust fault observed along the ridge structure east of Domes field.
4.3.3 Calderas
The Greater Olkaria Volcanic Complex is bounded by a ring structure which is presumed to
be remnants of a buried caldera system that is marked by volcanic domes to the east, south
and southwest (Omenda, 2008). The ring structure is slightly elliptical in plan view (Fig. 22),
with unknown vertical displacement. The accurate displacement of the piston has not been
ascertained since no stratigraphic correlation has been done outside the ring structure. The
volcanic domes present on the eastern part of the complex were erupted from a ring fracture,
probably related to a ring dyke during caldera collapse or an inclined sheet during magmatic
inflation. Rhyolitic intrusions encountered during directional drilling intersecting the ring
structure may therefore indicate presence of ring dykes or cone sheets.

53
Numerical and analogue models combined with laboratory testing on field data have proven
that ring faults and dykes are generated by shallow sill-like magma chambers in a volcanic
field subject to doming, tension or both (Gudmundsson and Nielsen, 2006). The presence of a
shallow magma chamber is evident from resistivity, gravity and seismic studies carried out in
Olkaria (Onacha, 1989; Simiyu et al., 1995; Simiyu and Keller, 1997). However, the lack of a
complete loci of domes around the entire volcanic system has not been explained. The
western and northern segments of the volcanic complex do not show arcuate domes or
remnants of caldera ring faults.
Lipman (1997) classified different types of calderas based on their geometry and morphology.
The classifications include piecemeal, trapdoor, downsag and funnel calderas. The trap door
caldera is bounded by a hinged structure and a partial ring structure caused by incomplete
piston collapse. The formation of trap door calderas may be attributed to smaller eruptions, an
asymmetrical magma chamber, or regional tectonic influences. Lipman (1997) also observed
that many pre-Holocene calderas are filled by tuffs and other younger lava flows from other
vents or from neighbouring volcanic centres. Caldera formation is usually in response to
explosive eruptions that lead to deposition of tuffaceous material. These flows obscure the
primary volcanic structures which cause difficulties in surface structural mapping.
Olkaria volcanic system may be classified as a trap door system formed due to asymmetrical
geomorphology of the magma chamber or smaller magma chambers forming numerous
sources of eruptions. During the initial periods of volcanic eruptions, the emptying of the
magma chamber may have been irregular, resulting in an uneven collapse of the eastern and
southern segments which shows the arcuate ring structure. The northwestern part acted as the
hinge and had less deformation. Due to intense deformation on the east and south, subsequent
magma chamber depressurisation led to formation of ring dykes along the ring faults but due
to the high viscosity of the magma, most of it was arrested to form the numerous domes along
the ring structure. The shallow magma chamber and higher deformation on the east, and south
fields led to formation of more hydrofractures that eventually led to thermal conduction and
hydrothermal alteration at shallower depth.
Part of Longonot outer caldera rim was mapped during the field work. The outer caldera of
Mt. Longonot is however structurally well visible and one of its arcuate tips lies in the Olkaria
geothermal license (Fig. 22). The Northeastern part of the caldera is however poorly exposed
and may have been covered by younger trachytic lava flows. The Longonot inner caldera is
conspicuous in satellite images and shows a central vent system with a symmetrical ellipse of
about 2km in diameter.
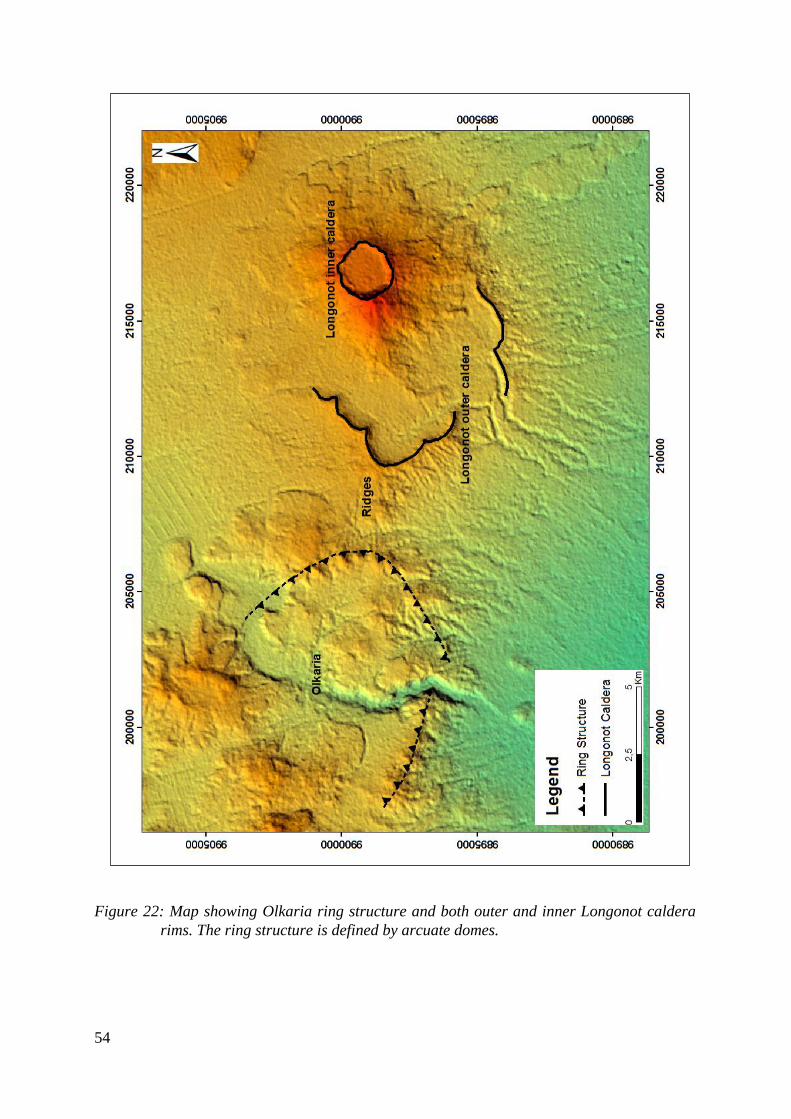
54
Figure 22: Map showing Olkaria ring structure and both outer and inner Longonot caldera
rims. The ring structure is defined by arcuate domes.

55
4.3.4 Dykes
Dykes are important magma movement channels that are formed when magma chamber
overpressure results in uprising of magma towards Earth’s surface. Magma moves through
fractured crustal surfaces due to their weak resistance. Dykes that reach Earth’s surface are
known as feeder dykes while those that are arrested along the way are known as non feeder
dykes. During extrusion in active volcanism, magma moves to the surface as dykes that
propagate in fractured zones. They normally propagate parallel to principle stress trajectories.
Therefore, those dykes ejected from circular magma chambers move in a steeply vertical
direction or as inclined cone sheets until encountering an arresting point. Dyke arrest is
caused by changes in rock shear strength due to differences in composition. The arrested dyke
would either end there or change it´s direction to horizontal and move along bedding planes
of strata to form a sill (Gudmundsson, 2011). Studying propagation of dykes is important in
geothermal research since dykes encourage rejuvenation of older buried faults, which enhance
permeability. They also act as potential heat sources in geothermal systems that form upflow
zones of hydrothermal fluids. Since dykes intrude younger strata, their rate of cooling has
been proven to be low (Tsang and Neretnieks, 1998). During well siting, they are key targets
to tap their heat and enhanced permeability.
Factors Influencing the Propagation of Dykes and Sheets
The plumbing system of Olkaria volcanic complex is different from most volcanic centres
along the rift system. The volcanic system does not display a caldera depicting that the
magma chamber may have been emptied via feeder dykes mainly occurring along the ring
structure. The Olkaria ring structure may have been more porous towards the east and south
hence the existence of numerous volcanic domes. Dykes play a critical role in the plumbing
system and are therefore important in this study. Gudmundsson (2011) refers to dykes as
hydrofractures and they propagate depending on fracture regimes of host rocks. There are
three main factors that influence dyke behaviour as detailed below.
(i) Stress Barriers
Tensile stress variations between the dyke and host rocks may lead to successful dyke
propagation. The dyke tensile strength should largely exceed the rock strength of between 0.5-
6 MPa (Gudmundsson, 2011). The direction of propagation will always be parallel to the
trajectories of the principle stress, σ1 and perpendicular (or normal) to σ3. However, if the
dykes reach a stress barrier, the dykes may be forced to change orientation or halt at the
intersection with the stress barrier. The stress barrier is defined as a layer or unit where the
local stress field is unfavorable for the propagation of a particular type of fracture
(Gudmundsson, 2011) (Fig. 23).
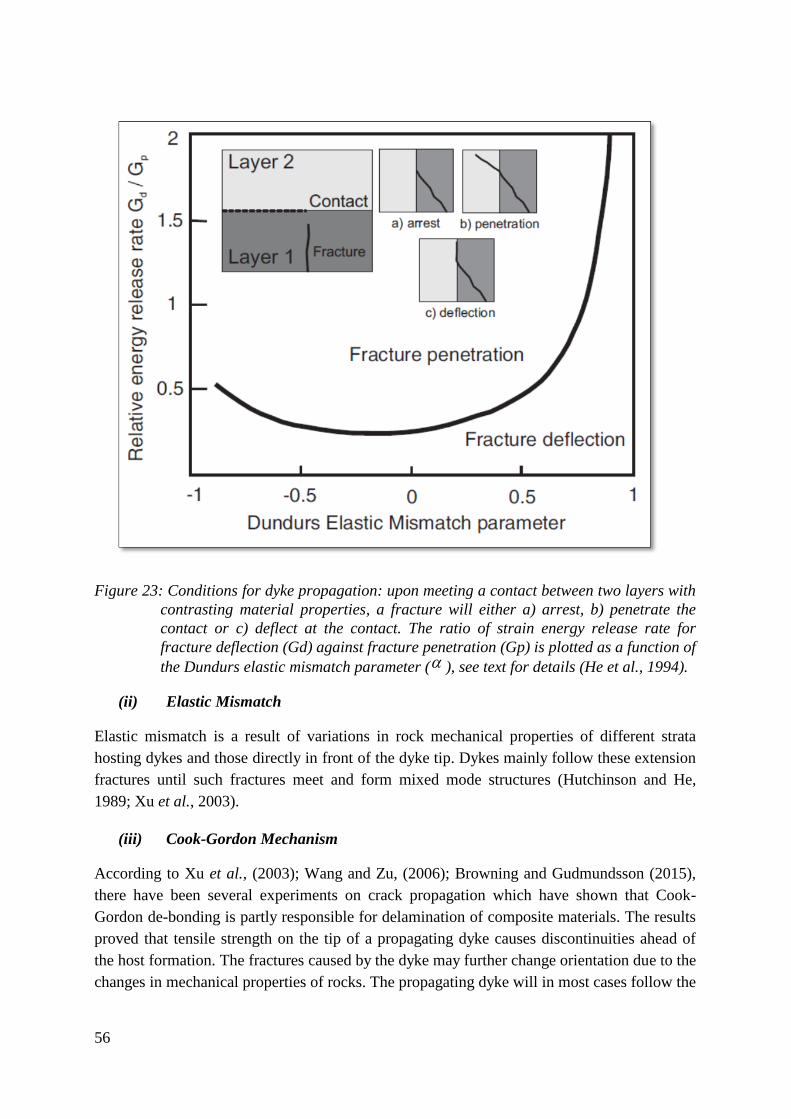
56
Figure 23: Conditions for dyke propagation: upon meeting a contact between two layers with
contrasting material properties, a fracture will either a) arrest, b) penetrate the
contact or c) deflect at the contact. The ratio of strain energy release rate for
fracture deflection (Gd) against fracture penetration (Gp) is plotted as a function of
the Dundurs elastic mismatch parameter ( ), see text for details (He et al., 1994).
(ii) Elastic Mismatch
Elastic mismatch is a result of variations in rock mechanical properties of different strata
hosting dykes and those directly in front of the dyke tip. Dykes mainly follow these extension
fractures until such fractures meet and form mixed mode structures (Hutchinson and He,
1989; Xu et al., 2003).
(iii) Cook-Gordon Mechanism
According to Xu et al., (2003); Wang and Zu, (2006); Browning and Gudmundsson (2015),
there have been several experiments on crack propagation which have shown that Cook-
Gordon de-bonding is partly responsible for delamination of composite materials. The results
proved that tensile strength on the tip of a propagating dyke causes discontinuities ahead of
the host formation. The fractures caused by the dyke may further change orientation due to the
changes in mechanical properties of rocks. The propagating dyke will in most cases follow the
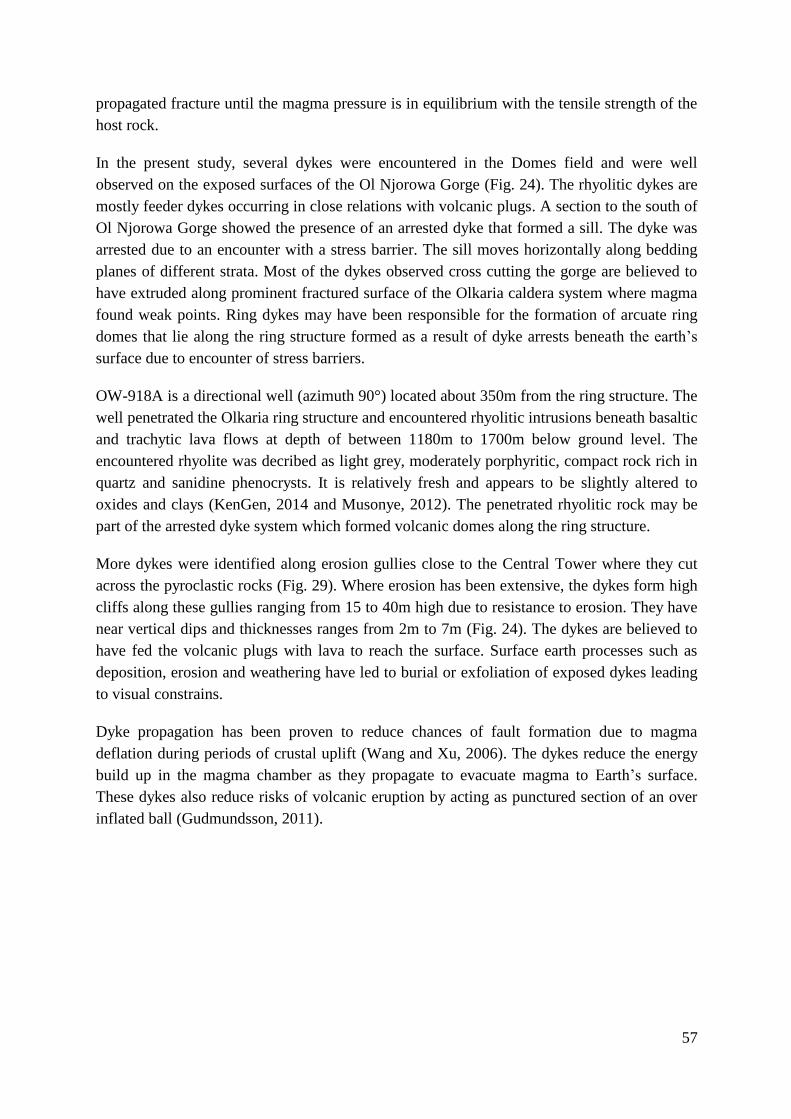
57
propagated fracture until the magma pressure is in equilibrium with the tensile strength of the
host rock.
In the present study, several dykes were encountered in the Domes field and were well
observed on the exposed surfaces of the Ol Njorowa Gorge (Fig. 24). The rhyolitic dykes are
mostly feeder dykes occurring in close relations with volcanic plugs. A section to the south of
Ol Njorowa Gorge showed the presence of an arrested dyke that formed a sill. The dyke was
arrested due to an encounter with a stress barrier. The sill moves horizontally along bedding
planes of different strata. Most of the dykes observed cross cutting the gorge are believed to
have extruded along prominent fractured surface of the Olkaria caldera system where magma
found weak points. Ring dykes may have been responsible for the formation of arcuate ring
domes that lie along the ring structure formed as a result of dyke arrests beneath the earth’s
surface due to encounter of stress barriers.
OW-918A is a directional well (azimuth 90°) located about 350m from the ring structure. The
well penetrated the Olkaria ring structure and encountered rhyolitic intrusions beneath basaltic
and trachytic lava flows at depth of between 1180m to 1700m below ground level. The
encountered rhyolite was decribed as light grey, moderately porphyritic, compact rock rich in
quartz and sanidine phenocrysts. It is relatively fresh and appears to be slightly altered to
oxides and clays (KenGen, 2014 and Musonye, 2012). The penetrated rhyolitic rock may be
part of the arrested dyke system which formed volcanic domes along the ring structure.
More dykes were identified along erosion gullies close to the Central Tower where they cut
across the pyroclastic rocks (Fig. 29). Where erosion has been extensive, the dykes form high
cliffs along these gullies ranging from 15 to 40m high due to resistance to erosion. They have
near vertical dips and thicknesses ranges from 2m to 7m (Fig. 24). The dykes are believed to
have fed the volcanic plugs with lava to reach the surface. Surface earth processes such as
deposition, erosion and weathering have led to burial or exfoliation of exposed dykes leading
to visual constrains.
Dyke propagation has been proven to reduce chances of fault formation due to magma
deflation during periods of crustal uplift (Wang and Xu, 2006). The dykes reduce the energy
build up in the magma chamber as they propagate to evacuate magma to Earth’s surface.
These dykes also reduce risks of volcanic eruption by acting as punctured section of an over
inflated ball (Gudmundsson, 2011).
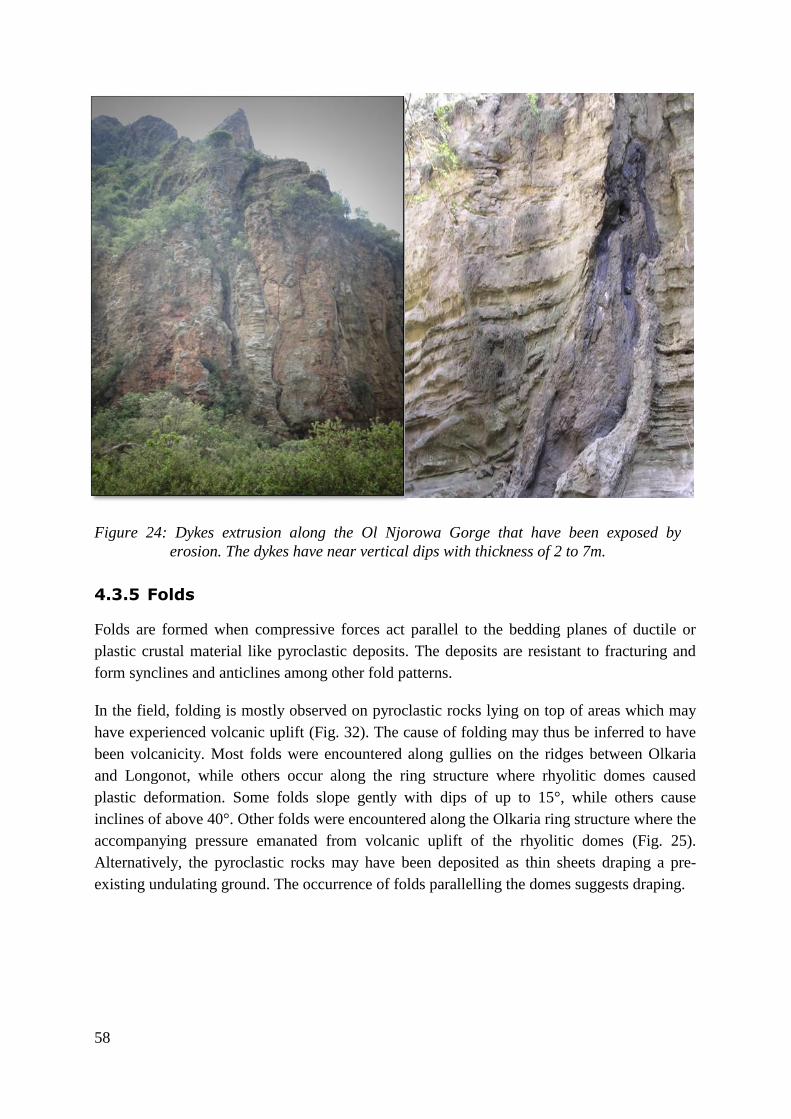
58
Figure 24: Dykes extrusion along the Ol Njorowa Gorge that have been exposed by
erosion. The dykes have near vertical dips with thickness of 2 to 7m.
4.3.5 Folds
Folds are formed when compressive forces act parallel to the bedding planes of ductile or
plastic crustal material like pyroclastic deposits. The deposits are resistant to fracturing and
form synclines and anticlines among other fold patterns.
In the field, folding is mostly observed on pyroclastic rocks lying on top of areas which may
have experienced volcanic uplift (Fig. 32). The cause of folding may thus be inferred to have
been volcanicity. Most folds were encountered along gullies on the ridges between Olkaria
and Longonot, while others occur along the ring structure where rhyolitic domes caused
plastic deformation. Some folds slope gently with dips of up to 15°, while others cause
inclines of above 40°. Other folds were encountered along the Olkaria ring structure where the
accompanying pressure emanated from volcanic uplift of the rhyolitic domes (Fig. 25).
Alternatively, the pyroclastic rocks may have been deposited as thin sheets draping a pre-
existing undulating ground. The occurrence of folds parallelling the domes suggests draping.
59
Figure 25: Plate showing folding along the ring structure. This may have been caused by
volcanic intrusion of rhyolitic domes after dyking events.
4.3.6 Altered Ground
Hydrothermal alteration is a result of hydrothermal fluid contact with surface rocks. The hot
rock-fluid interaction leads to chemical reactions that alter primary minerals. Since
geothermal fluids have elevated temperatures, they easily dissolve primary minerals and
transport them towards areas of lower pressure. The fluids move through preferred zones of
permeability and tend to follow geological structures. Minerals saturated in hydrothermal
fluids are later precipitation as secondary minerals when temperature and pressure conditions
are lowered. The implication is that the fluids form very distinct alteration mineral
assemblages with depth. Various alteration mineral assemblages appear in equilibrium and
depict different temperature and pressure conditions. Precipitates that are deposited on the
Earth´s surface mark zones of alteration, which may experience elevated temperatures
compared to the surrounding environment. Geothermal fluids also alter the surface rocks to
form alteration minerals which are further evidences of subsurface interaction.
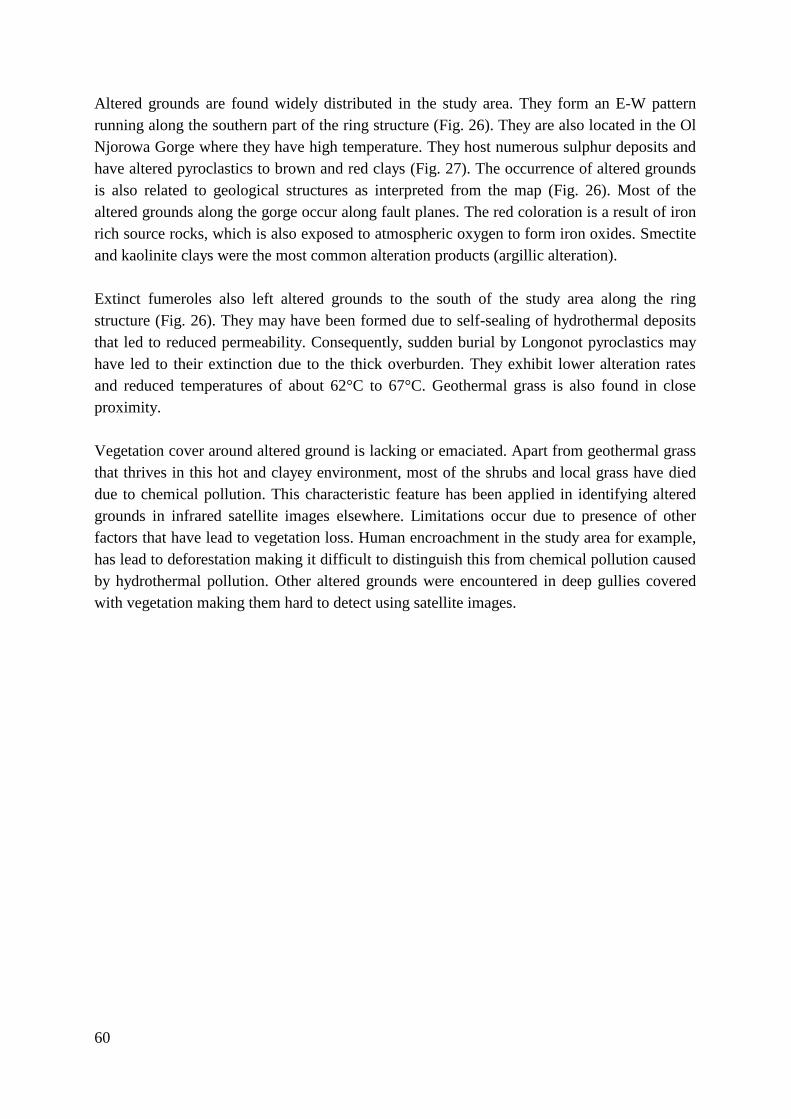
60
Altered grounds are found widely distributed in the study area. They form an E-W pattern
running along the southern part of the ring structure (Fig. 26). They are also located in the Ol
Njorowa Gorge where they have high temperature. They host numerous sulphur deposits and
have altered pyroclastics to brown and red clays (Fig. 27). The occurrence of altered grounds
is also related to geological structures as interpreted from the map (Fig. 26). Most of the
altered grounds along the gorge occur along fault planes. The red coloration is a result of iron
rich source rocks, which is also exposed to atmospheric oxygen to form iron oxides. Smectite
and kaolinite clays were the most common alteration products (argillic alteration).
Extinct fumeroles also left altered grounds to the south of the study area along the ring
structure (Fig. 26). They may have been formed due to self-sealing of hydrothermal deposits
that led to reduced permeability. Consequently, sudden burial by Longonot pyroclastics may
have led to their extinction due to the thick overburden. They exhibit lower alteration rates
and reduced temperatures of about 62°C to 67°C. Geothermal grass is also found in close
proximity.
Vegetation cover around altered ground is lacking or emaciated. Apart from geothermal grass
that thrives in this hot and clayey environment, most of the shrubs and local grass have died
due to chemical pollution. This characteristic feature has been applied in identifying altered
grounds in infrared satellite images elsewhere. Limitations occur due to presence of other
factors that have lead to vegetation loss. Human encroachment in the study area for example,
has lead to deforestation making it difficult to distinguish this from chemical pollution caused
by hydrothermal pollution. Other altered grounds were encountered in deep gullies covered
with vegetation making them hard to detect using satellite images.

61
Figure 26: Map of the study area showing spatial distribution of altered grounds mapped
during this study (red polygons) in the study area. The orange polygons indicate
the pteviously mapped altered grounds to the southwest of Olkaria. Note the E-W
trend from the ridges to the Ol Njorowa Gorge shown by the light blue dashed
line.
62
Figure 27: Altered grounds showing different levels of alteration. Plate A was taken on
altered pyroclastic rock outcrop to the south of Olkaria ring structure where the
ground temperatures were 67°C, while in plates B and C, there were no elevated
temperatures. The dominant clays were smectite and kaolin altered from
pyroclastics and rhyolites.

63
4.3.7 Hot Springs
Hot springs are formed when groundwater is heated by Earth´s natural heat. They spring to
the surface where permeability allows and pressure conditions are higher than the atmospheric
pressure. Due to interaction with hot rocks beneath, their temperatures are higher than the
surroundings and sometimes reach boiling (Otieno et al., 2014). The elevated temperatures
are also responsible for increased pressure. Hot springs may also emanate from contact with
convective magmatic fluids that conduct heat to shallow groundwater. The groundwater
becomes highly mineralised and reaches the surface where the water table intersects the
surface due to topographic lows. A good example of this is along the Ol Njorowa Gorge
where erosion has formed deep gullies.
Hot springs were observed along the Ol Njorowa Gorge where they discharge hot fluids (Fig.
28). The fluid temperatures range from 56°C to 96°C along the upper part of the gorge. The
springs are structurally controlled and occur linearly along the NE-SW oriented normal faults.
Their characteristics vary as to the amount of fluid they discharge and their temperatures.
Some also occur on the valley floor where cooler water is flowing, making it difficult to
measure their precise temperatures. Others occur along valley walls where the fluid is
contaminated with meteoric water.

64
Figure 28: Map showing location of hot springs along Ol Njorowa Gorge with elevated
temperatures. The hot springs are aligned along NE-SW faults.
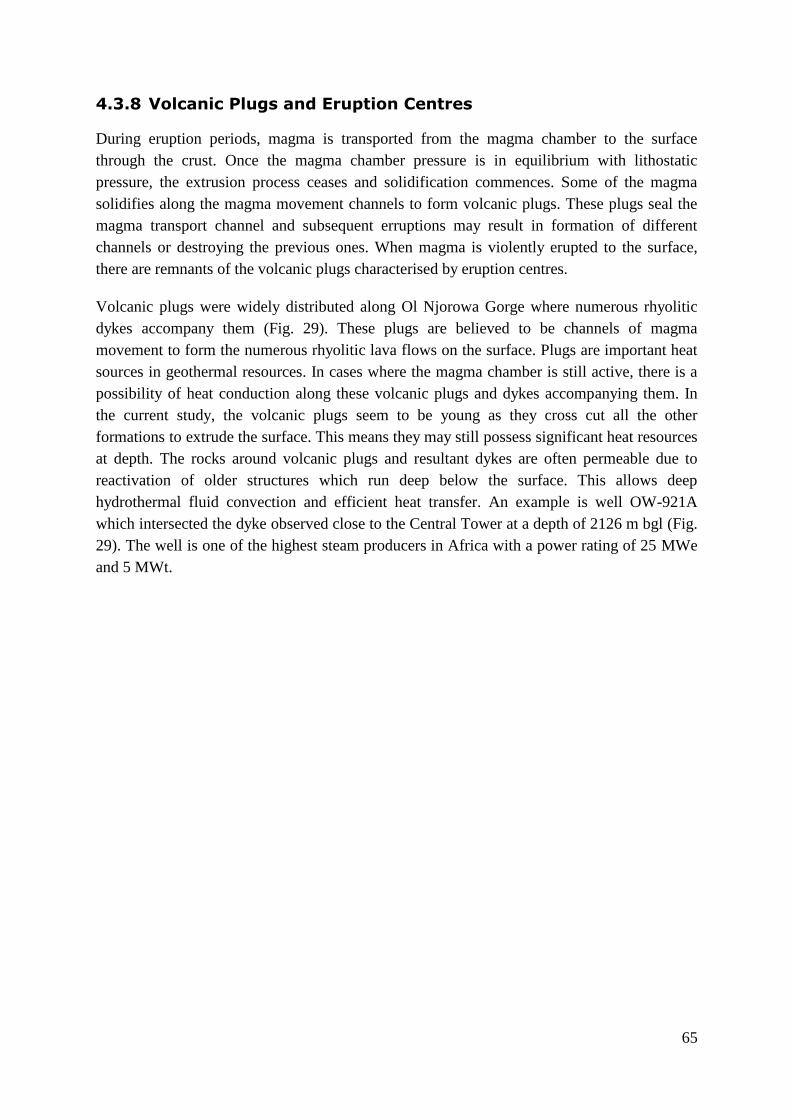
65
4.3.8 Volcanic Plugs and Eruption Centres
During eruption periods, magma is transported from the magma chamber to the surface
through the crust. Once the magma chamber pressure is in equilibrium with lithostatic
pressure, the extrusion process ceases and solidification commences. Some of the magma
solidifies along the magma movement channels to form volcanic plugs. These plugs seal the
magma transport channel and subsequent erruptions may result in formation of different
channels or destroying the previous ones. When magma is violently erupted to the surface,
there are remnants of the volcanic plugs characterised by eruption centres.
Volcanic plugs were widely distributed along Ol Njorowa Gorge where numerous rhyolitic
dykes accompany them (Fig. 29). These plugs are believed to be channels of magma
movement to form the numerous rhyolitic lava flows on the surface. Plugs are important heat
sources in geothermal resources. In cases where the magma chamber is still active, there is a
possibility of heat conduction along these volcanic plugs and dykes accompanying them. In
the current study, the volcanic plugs seem to be young as they cross cut all the other
formations to extrude the surface. This means they may still possess significant heat resources
at depth. The rocks around volcanic plugs and resultant dykes are often permeable due to
reactivation of older structures which run deep below the surface. This allows deep
hydrothermal fluid convection and efficient heat transfer. An example is well OW-921A
which intersected the dyke observed close to the Central Tower at a depth of 2126 m bgl (Fig.
29). The well is one of the highest steam producers in Africa with a power rating of 25 MWe
and 5 MWt.

66
Figure 29: Map of the study area showing volcanic plugs and eruption centers marked with
red triangles. Some directional wells are displayed to show position and azimuth
of well OW-921A. The well may have intersected the dyke or volcanic plug at the
Central Tower. Wells OW-917, 918 and 734 are also shown as vertical wells in
the map
Rose diagram – dyke strike

67
4.4 Geochemical Soil Gas Survey Results
4.4.1 CO2 Gas Survey
The CO2 soil gas analyses were carried out during this study in Olkaria Domes field. They
were compared to the background values of 0.03% and results showed spatial variations in
soil gas concentrations. High CO2 concentrations were interpreted as sections of greater
permeability causing accelerated gas diffusion from crustal magmatic sources. There is an E-
W trend of high gas concentrations marked by the red dashed line, consistent with the
occurrence of altered grounds (Fig. 30). The trend runs from the ridge to the gorge at the
southern part of the study area. Gas values range from 0.55 to 1.25% volume of the total gas
phase. Some parts of the caldera floor show significantly lower CO2 flux of 0.05% probably
due to thick pyroclastics burial of their sources. CO2 degassing of the soil along the E-W
trending zone may have either been sourced from deep volcanic origin or from a shallow
organic sources. However, an anomaly occurs at the southern part of caldera floor with values
of about 1% volume, which may be indicative of deep seated faults, eruption centres or
shallow magmatic bodies (marked with a red dashed line in Fig. 30). This appears cognate to
the altered ground mapped close to the same area (Fig. 26). The anomaly may be attributed to
presence of fault intersections which may have been reactivated to allow partial permeability.
Alternatively, the anomaly may be in close proximity to an upflow zone.
The area south of the ring structure has the highest CO2 concentrations with values of 1.35%
in volume (Fig. 30). This zone hosts the major upflow zone in Domes field. This shows high
level of permeability to the surface with a localised radial extent. A similar high anomaly is
present to the southeast outside the ring structure but no wells have been drilled there to prove
the extent of the geothermal resource.
Buffalo Circuit lies to the North east of the study area. It shows relatively low values
compared to the rest of the field. The circuit is relatively flat with a thick pyroclastic cover. It
is assumed to harbour limited geological structures due to its poor permeability. There is only
one rhyolitic lava flow exposed at the Obsidian Caves tourist site (Fig. 30). The rhyolite
eruption centre may be the source of the CO2 anomaly observed at these caves (Fig. 30).
Correlation of thermal and diffuse degassing anomalies should be approached cautiously due
to influences from gases emanating from magmatic bodies in the crust.
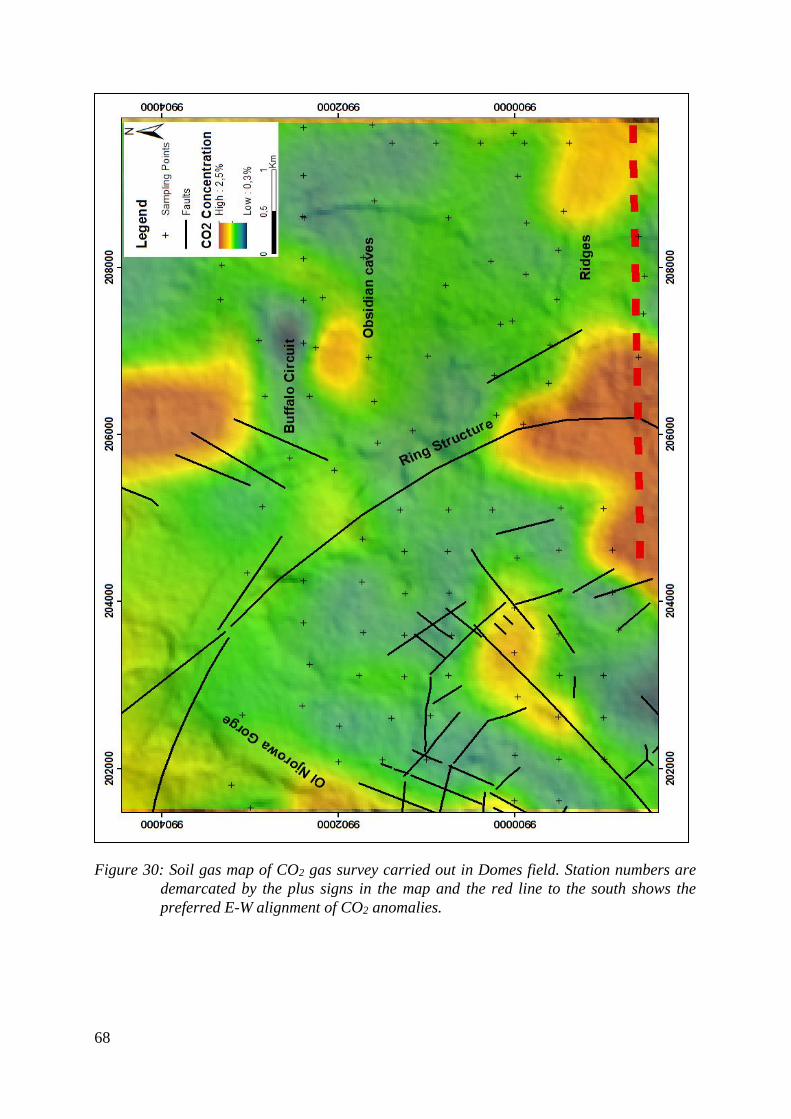
68
Figure 30: Soil gas map of CO2 gas survey carried out in Domes field. Station numbers are
demarcated by the plus signs in the map and the red line to the south shows the
preferred E-W alignment of CO2 anomalies.
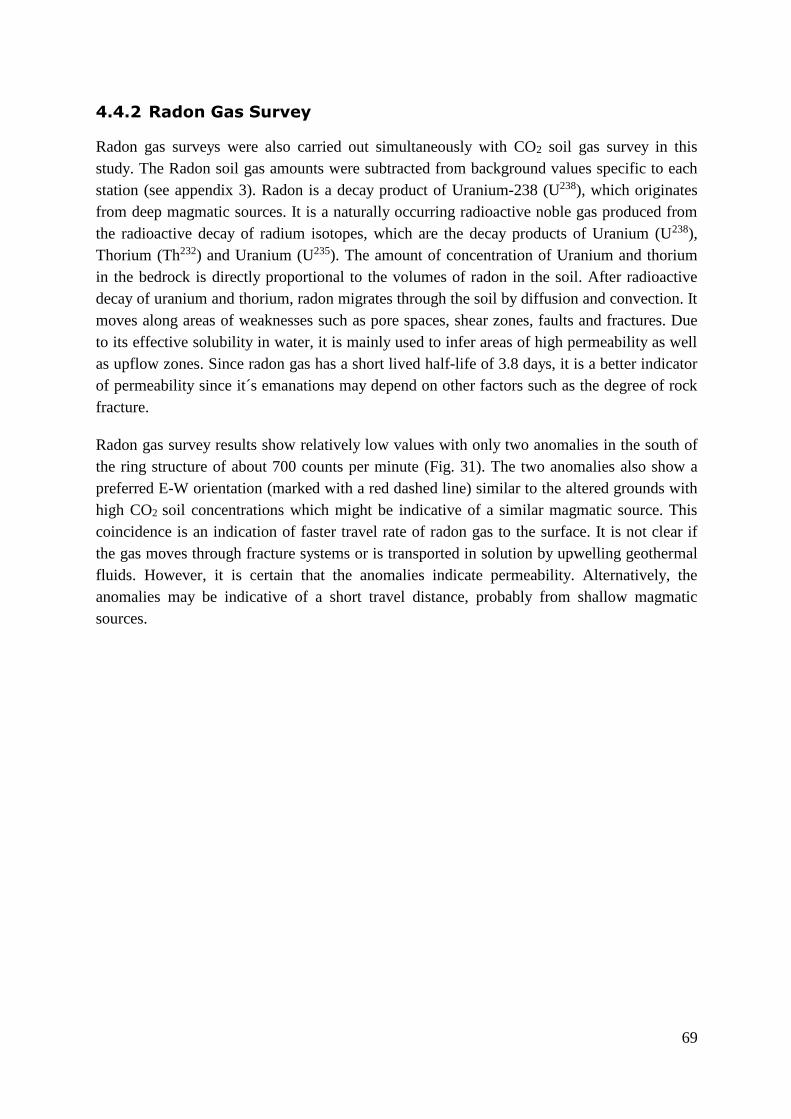
69
4.4.2 Radon Gas Survey
Radon gas surveys were also carried out simultaneously with CO2 soil gas survey in this
study. The Radon soil gas amounts were subtracted from background values specific to each
station (see appendix 3). Radon is a decay product of Uranium-238 (U238), which originates
from deep magmatic sources. It is a naturally occurring radioactive noble gas produced from
the radioactive decay of radium isotopes, which are the decay products of Uranium (U238),
Thorium (Th232) and Uranium (U235). The amount of concentration of Uranium and thorium
in the bedrock is directly proportional to the volumes of radon in the soil. After radioactive
decay of uranium and thorium, radon migrates through the soil by diffusion and convection. It
moves along areas of weaknesses such as pore spaces, shear zones, faults and fractures. Due
to its effective solubility in water, it is mainly used to infer areas of high permeability as well
as upflow zones. Since radon gas has a short lived half-life of 3.8 days, it is a better indicator
of permeability since it´s emanations may depend on other factors such as the degree of rock
fracture.
Radon gas survey results show relatively low values with only two anomalies in the south of
the ring structure of about 700 counts per minute (Fig. 31). The two anomalies also show a
preferred E-W orientation (marked with a red dashed line) similar to the altered grounds with
high CO2 soil concentrations which might be indicative of a similar magmatic source. This
coincidence is an indication of faster travel rate of radon gas to the surface. It is not clear if
the gas moves through fracture systems or is transported in solution by upwelling geothermal
fluids. However, it is certain that the anomalies indicate permeability. Alternatively, the
anomalies may be indicative of a short travel distance, probably from shallow magmatic
sources.

70
Figure 31: Map of radon gas values measured in Domes field showing the distinct red
anomaly on the south of the study area.The red dashed line shows an E-W
preferred orientation.

71
5 Discussion
The Greater Olkaria Volcanic Complex is a high temperature geothermal system with proven
potential of more than 600 MWe (KenGen, 2015). The geothermal license lies within the
Greater Olkaria Volcanic Complex. The current study was focused on Olkaria Domes
geothermal field, which is the most recently developed field supplying bulk steam for
electricity production. Olkaria IV geothermal power plant was commissioned in 2014 with a
total installed capacity of 149.8 MWe (KenGen, 2015). An additional 140 MWe Olkaria V
power plant is proposed to be constructed in the Domes field. The geology of the Olkaria
Volcanic Complex is dominated by Pleistocene and Holocene lava flows and more recent
pyroclastic deposits, mainly composed of ash falls from Longonot caldera (Woodhall, 1987
and Marshall et al., 2009). The topography is dotted by at least 80 volcanic centres of
Quaternary age forming steep sided domes formed as thick lava piles with limited lateral flow
(Marshall et al., 2009). Ololbutot commenditic lava is the youngest, erupted at 180 50 yr BP
(Clarke et al., 1990).
5.1 Updated Structural Map of Olkaria Domes Geothermal Field
Faults in the Greater Olkaria Volcanic Complex are categorised under five types based on
their strikes. They are; N-S, NE-SW, NW-SE, NNW-SSE and E-W. Fault average
displacements range from 5-50m. Ol Njorowa Gorge has a high density of NE-SW and NNE-
SSW faults. Faults mapped during this study are mainly oriented NW-SE, NNW-SSE and
NNE-SSW (Fig. 32). Normal faults are the most dominant in Domes field dipping to the west,
while compressional faults are rare depicting limited periods of crustal compression. Normal
faults were formed by tensional forces during periods of rift spreading. There is a unique set
of E-W faults along the ridges east of the Olkaria ring structure (Fig. 32). The faults may have
been formed by lateral movement of the lithosphere. They cut across pyroclastic layers and
were observed along gullies east of Domes field.
Bosworth and Strecker (1997) dated the E–W and ENE–WSW oriented faults along the
Kenyan rift and reported that they were formed between 12 and 0.6 Ma, while the NE–SW
faults date back to 0.6 Ma. The constant changes in direction is caused by changes in
kinematic regimes being attributed to volcanic activities on both local and regional scales.
Delvaux et al., (1992) found evidences of compressional forces on the East African rift during
the Cenozoic period. The Aswa lineament is one of the major transform zones with several
NW-SE striking faults. These faults host some of the major volcanic centres on the EARS and
produce major earthquakes in Africa (Chorowicz, 2005).

72
Left-lateral strike slip of rift shoulder faults was observed from DEMs affecting most parts of
the Central Kenyan rift. The lateral movement is connected to the Aswa lineament which
connects the Eastern and Western rifts to form the Victoria micro-plate (Chorowicz, 2005).
Faults occur in close association with tectonic fractures. They show evidence of recent
tensional forces whose sources are tectonic and volcanic in origin along the Kenyan rift
system. They are formed due to negative principal compressive stress, σ3, making them
prominent only within the uppermost 1km of the earth’s crust (Gudmundsson, 2011). Many
fractures in Olkaria geothermal field therefore arise from tensile stress related to the Olkaria
domal uplift. Both faults and fractures form good permeability when they are interconnected.
Meteoric fluids move through these openings to recharge the geothermal reservoir.
Eruption centres and volcanic plugs were widely distributed in Domes field (Fig. 32). They
are sources of lava formed when magma conduits have successfuly penetrated Earth´s surface.
Some eruption centres formed craters erupted under water along the ring structure due to
flooding of Lake Naivasha (Omenda, 1998). Other eruption centres within domes field occur
linearly and are believed to have been extruded along fault planes (Clarke et al., 1990) (Fig.
32). Volcanic plugs were observed along the Ol Njorowa Gorge. They form volcanic vertical
elliptical pipes.
Altered grounds mainly occur along the Ol Njorowa Gorge and along the ring structure.
Slightly altered grounds were also observed along the ridges where geothermal grass was
noted. They are a result of surface alteration by hydrothermal fluid. Occurence of surface
alteration is closely associated with near surface permeability that encourages fluid
movements. They are also indicative of an upflow region where hot hydrothermal fluids reach
to near surface and cause argillic alteration, responsible for higher CO2 and radon soil gas
concentrations. The hot fluids may also come into contact with shallow groundwater to form
hot springs found along the Ol Njorowa gorge (Fig. 32). Their lateral distribution may be
interpreted to show buried structures.

73
Figure 32; Updated structural map of Olkaria Domes field showing all features mapped
during this study

74
5.2 Olkaria Conceptual Model
Attempts have been made to improve understanding of the Olkaria geothermal system and
create an accurate Olkaria Conceptual Model based on geology, geophysics and geochemistry
data (SWECO and Virkir, 1976; Ofwona, 2002; West-JEC, 2009; MANNVIT et al., 2011).
Reservoir characterisitics over long time periods have also helped build the model by showing
upflow and downflow zones (Ambusso and Ouma, 1991 and Ofwona, 2002). This
information has been key in developing and sustaining production from the geothermal
reservoir.
Exploration of the geothermal potential began in 1956 when geological mapping and
geophysical studies were carried out (Odongo, 1984). Deep drilling commenced in 1973 when
two exploration wells were drilled. A basic conceptual model showing a boiling geothermal
reservoir overlain by a steam zone capped by tuffaceous caprock was presented by SWECO
and Virkir (1976). Feasibility studies carried out in 1976 proved that geothermal development
in Olkaria was feasible. This decision led to the construction of the first geothermal power
plant with a capacity of 15 MWe in 1981 (Ouma, 2009). Continued drilling increased the
levels of understanding and the conceptual model extended towards the east covering Olkaria
East Production field and extended eastwards to the Gorge Farm fault (Ofwona, 2002).
Optimisation studies were carried out by West-JEC (2009), where the conceptual model was
also revised to incorporate even more recent surface and subsurface data. The report
recommended geothermal expansion towards the Olkaria Domes field. More recent studies
have been carried out by MANNVIT et al., (2011), where a more updated conceptual model
has been constructed.
Despite many studies carried out in the last 40 years, there is still a challenge in understanding
the Greater Olkaria Volcanic Complex. None of the proposed models confirm the presence of
a caldera system in Olkaria geothermal field. The only evidence showing the presence of a
caldera is the ring structure. The Greater Olkaria Volcanic Complex is bound by a ring
structure formed by arcuate rhyolitic domes to the east, south and south west (Omenda, 1998)
(Fig. 32). This ring structure is presumed to represent remnants of a buried caldera that was
later intruded by younger rhyolitic rocks (Naylor, 1972). Lack of sufficient subsurface data
outside the ring structure has been a major setback in unearthing the evidence of a caldera
system. However, an attempt to correlate the stratigraphic information outside the ring
structure has been made using lithological logs from well OW-922 which was drilled about
2km east of the Domes field (Musonye, 2015). Rhyolites are lacking in the upper stratigraphic
column outside the ring structure. This may imply that most of the commenditic lavas were
post-caldera extrusions (Mashall et al., 2009), which could not flow outside Olkaria volcanic
complex, probably due to presence of a depression formed by the uneven collapsed slab.
According to Lipman (1997), uneven slab collapse may be caused by an asymmetrical
morphology of a magma chamber that results to variations in lithostatic pressure. Evidence of

75
uneven slab collapse in Olkaria would be ascertained by lack of a system of rhyolitic ring
domes or a ring structure towards the northeast and east segments of the proposed caldera
system. Deformation may be interpreted to be significantly higher to the east (towards
Longonot) than to the west (towards Olkaria Hill) of Olkaria volcanic complex. This
assumption is based on presence of shallow heat sources towards Olkaria East and Northeast
production fields of the volcanic complex that are at minimum to the west of Olkaria hill
(MANNVIT et al., 2011). Increased NE-SW faulting, dyking and fracturing episodes along Ol
Njorowa Gorge and in Domes field may also be interpreted to mean more deformation, which
may have been caused by greater subsidence to the east. This kind of uneven subsidence is
categorised as trapdoor collapse where the west part forms a hinge of a door and the east is
the panel that opens or subsides like a trapdoor (Lipman, 1997).
The Greater Olkaria Volcanic Complex has vast networks of faults that were formed during
different tectonic episodes. The oldest faults are NW-SE and WNW-ESE which are related to
formation of the Kenyan rift system (Mungania, 1999). The NE-SW are much younger and
are related to the caldera collapse (Omenda, 1998). Their frequency is significantly high along
the Ol Njorowa Gorge and in Domes field (Fig. 32). They are also dominant along the south
western arm of the ring structure (Otieno et al., 2014). They are poorly distributed to the west.
Most of the caldera faulting is also towards the east consistent with the deformation patterns
forming the trapdoor collapse slab.
Dykes have a N-S trend and are exposed along the Ol Njorowa Gorge. They are associated
with most recent N-S and NNE-SSW faulting and attest to the recent fault rejuvenation
forming numerous fumeroles and craters along Ololbutot fault and at the gorge (Lagat, 2004;
Musonye, 2015). Since dyke propagation is dependent on rock tensile strength, they were
extruded when magma pressure superceded lithostatic pressure (Gudmundsson, 2011). The
faults along the Ol Njorowa Gorge created weak points along fault planes. The young dykes
form important heat sources as well as good permeability. When the dykes are intersected at
deeper depths during geothermal drilling, they improve steam production. During drilling of
well OW-921A, a dyke was intersected at a depth of 2126 m bgl (KenGen, 2014). This may
have improved the productivity of the well making it one of the biggest producers in Africa.
76
Figure 33: Schematic Geological Conceptual Model of Olkaria showing relative locations of
mapped faults east of Domes field. The figure is not drawn to scale.
3 km
12.5 km
77
5.3 The Knee Joint Structure
Preliminary structural geology study of the Central Kenyan rift was carried out by analysing
Digital Elevation Models from ASTER GDEM. Regional normal fault trends depict periods
of extensional deformation leading to lithostatic brittle failure (Corti, 2012). Deformation was
initiated by the Kenyan plume whose origin is the upper mantle. Tensional forces favoured
formation of normal faulting with near vertical inclinations. Regional transform faulting
affected the Kenyan rift leading to changes in rift orientation from NW-SE to NE-SW. The
lateral shift introduced the E-W oriented faults mapped east of Olkaria Domes field and
Eburru massif (Mwania et al., 2014). Study of DEMs led to the discovery of the knee joint
structure which is a circular depression of 50 by 30 km similar to a collapsed caldera. It may
have been formed during the period of lateral transform faulting leading to a brittle piston
collapse. The subsidence resulted in dyke intrusions within Kijabe area, along the eastern
scarp of the rift. Kijabe hill may have also been formed during this process. The shallow high
density basaltic intrusions may be responsible for gravity reversals noted in several parts of
Kenton area during field work, where localised negative gravity anomalies were experienced.
Hot rock-water interactions are believed to form hot springs along the rift escarpment in
Kijabe area.
Magnetic survey data from the Africa Magnetic Mapping Project (AMMP) analysed by Kuria
et al., (2010) was used to estimate the Curie Point Depth (CPD) of magnetic rocks in this
region. Results show a shallow CPD on the Central Kenyan rift, immediately south of Lake
Naivasha (Fig. 14). These findings correspond to our observations in DEMs which envisages
presence of a collapsed slab forming the knee joint structure. The shallow CPD may explain
the heat source fueling geothermal manifestations along the eastern escarpment. This magma
reservoir may be the source of the peralkaline rocks dominating Olkaria and Longonot
volcanoes (Fig. 33). However, the differences in rock evolution may be due to presence of
localised magma chambers for both Olkaria and Longonot which may have encouraged
different degrees of magma fractionation and anatexis. More sub-surface data is required to
ascertain this theory.
Mogi (1958) studied volcanic eruptions in Japan and concluded that primary volcanic
landforms are created by the ascent and eruption of magma. The ascending magma displaces
and interacts with surrounding rock and fluids as it creates new pathways. It causes
propagation of cracks or conduits, vesiculates, and accumulates in underground reservoir
cavities. The formation of new pathways and pressure changes within existing conduits and
reservoirs is responsible for causing stress build up and deforming the surrounding rock.
Dzurisin (2007) also studied many volcanic edifices in other parts of the World and carried
out volcanic eruption simulations in controlled laboratory environments. Results show that
surface deformation depends on the shape and size of the pressure source, pressure increment,
and the elastic properties of the medium. For any particular source depth and geometry, the
surface deformation scales with the ratio of the cavity pressure change to the half-space elastic

78
modulus, and to a lesser extent with Poisson’s ratio. Mathematical models are then created
representing the Earth’s crust as an ideal semi-infinite elastic body, known as an elastic half-
space that is materially homogeneous and mechanically isotropic and it obeys Hooke’s law.
The models created are used to estimate surface deformation caused by changes in magma
chamber pressure during periods of volcanic unrest. The magma chambers are conceptualised
as fluid pressurised ellipsoidal cavities that cause ellipsoidal surface deformation in an elastic
half space.
The current study concludes that the knee joint structure is an ellipsoidal deformed structure
that may have been formed by pressure changes in the magma cavity beneath. Presence of a
magma chamber have been confirmed by the shallow CPD observed by Kuria et al., (2010).

79
Figure 34: The schematic model of the knee joint structure located on the Central Kenyan rift
showing an expression of its geometry. The figure is not drawn to scale.

80

81
6 Conclusion
Olkaria Domes field is a high temperature geothermal system with a proven potential of more
than 650 MWe. The geothermal potential is enhanced by interconnected fracture and fault
networks creating a percolation threshold that sustains hydrothermal fluid flux. The faults are
classified under five types based on their strikes. They include; N-S, NE-SW, NW-SE, NNW-
SSE and E-W. Fault average displacements range from 5-50m based on field measurements.
The N-S faults are located along the Ol Njorowa Gorge and Ololbutot fault. They were
formed by young magma resurgence evidenced by dykes, volcanic plugs and eruption centres
erupted less than 3280±120 Bp.
The ring structure may have a system of rhyolitic dykes and cone sheets which may have fed
the shallow rhyolitic domes at shallow depths. The ring dykes may act as barriers preventing
cold fluids from infiltrating Olkaria Domes field from the east. Olkaria geothermal complex
may be classified as a trap door volcanic system formed due to asymmetrical geomorphology
of it´s magma chamber. During the pre-caldera volcanic eruptions, the emptying of the
magma chamber may have been uneven, resulting in a larger collapse of the southeast and
southwest parts and formed the arcuate ring structure. The north and west parts may have
acted as the hinges where less deformation and lack of ring faults was observed.
The geothermal potential of the ridges east of Domes field has not yet been proven.
Subsurface data along the ridge is lacking since no deep drilling has been carried out. An
exploratory well, OW-922, was drilled a few kilometers north of the ridge but it did not
sustain discharge upon testing. Based on geophysical resistivity profiles, the ridge may
contain a localised intrusion which may form a localised heat source. The envisaged
intrusions may have originated from either Olkaria or Longonot peripheral eruptions. The
company should manage their expectations while investing capital resources to explore this
region.
The Central Kenyan Rift may have been subjected to transform faulting during the rifting
process. Left lateral strike slip movement was observed in DEMs along rift shoulder faults.
The knee joint structure may have been formed by piece meal type subsidence of a piston due
to underpressurised shallow magma cavity at a depth of about 15.9 km bgl. Extrusion of
basaltic dykes along Kijabe area may have resulted to emanation of hot springs and CO2 rich
grounds which form prominent surface geothermal manifestations in Kenton and Kereita
areas.

82
83
7 Recommendations
The area east of domes field has not been explored fully. Geophysical data is scarce and only
one well has been drilled. There is need to carry out additional interdesciplinary scientific
work in the area to understand the geothermal potential.
Volcanology and geodetic research of the Greater Olkaria Geothermal Complex is required to
monitor reservoir pressure changes. GPS deformation measurements as well as InSAR studies
will assist in observing surface deformation caused by magma chamber pressure changes and
contribute in creating more precise deformation models based on Mogi point source
modelling method. The surveys could also be used to determine pressure reduction in the
geothermal reservoir due to mass abstraction of steam in Olkaria geothermal field. The
geodetic surveys can be complemented by gravity measurements which can also show density
reduction due to mass geothermal fluid abstraction. Trace element and isotope studies of all
volcanic rocks penetrated during drilling in Olkaria would considerably improve
understanding of magma sources and process involved in magma movement.
The knee joint structure was discovered during this study but there is insufficient data to
classify it to a caldera. Intensive geophysical measurements should be done to confirm the
existence of the shallow magma source as well as local intrusions in the Kijabe area that may
host geothermal potential. Bulk rock petrochemistry and trace element analysis of subsurface
rocks which may be obtained during deep drilling in Longonot, Suswa and Mt. Margaret
needs to be carried out in the long term to determine any relation of magma evolution
processes.

84
85
References
Ambusso, W.J., and Ouma, P.A., 1991: Thermodynamic and permeability structure of Olkaria
Northeast field: Olkaria fault. Geothermal Resource Council Transactions, 15, 237-242.
Awange J.L., E. Forootan, J. Kusche, J.B.K. Kiema, P.A. Omondi, B. Heck, K. Fleming, S.O.
Ohanya, R.M. Gonçalves, 2013; Understanding the decline of water storage across the
Ramser-Lake Naivasha using satellite-based methods, SciVerseScienceDirect, Advances in
Water Resources 60 (2013) 7–23.
Baker, B.H., 1970. The structural pattern of the Afro-Arabian rift system in relation to plate
tectonics. Philosophical Transactions, Royal Society of London Series A 267, 383–391.
Baker, B.H., Williams, L.A.J., Miller, J.A., Fitch, F.J., 1971. Sequence and geochronology of
the Kenya rift volcanics. Tectonophysics 11, 191–215.
Baker B. H. and Wohlenberg, J. 1971; Structure and evolution of the Kenya rift valley. Nature
229, 538-542.
Baker B.H., Mohr, P.A., and Williams, L.A.J., 1972: Geology of the Eastern Rift System of
Africa. Geological Society of America, Special Paper 136, 1-67.
Biggs J., E.Y. Anthony and C.J. Ebinger, 2009; Multiple inflation and deflation events at
Kenyan volcanoes, East African Rift, USA, Geological Society of America, Vol. No. 37; no.
11; p. 979–982
Bosworth W., Strecker, M.R., 1997; Stress field changes in the AfroArabian rift system
during the Miocene to recent period. Tectonophysics 278, 47–62.
Browne P.R.L., 1984; Subsurface stratigraphy and hydrothermal alteration of the eastern
section of the Olkaria geothermal field, Kenya; Proceedings of the 6th New Zealand
Geothermal workshop, Geothermal Institute, Auckland, 33-41.
Browning J. and Gudmundsson A., 2015; Caldera faults capture and deflect inclined sheets:
An alternative mechanism of ring-dyke formation, Bulletin of Volcanology, 77-889
Chorowicz Jean, 2005; The East African rift system, Journal of African Earth Sciences,
Volume 43, Issues 1–3, Pages 379–410.
Chorowicz Jean, Le Fournier J., and Vidal, G., 1987; A model for rift development in Eastern
Africa. In: Bowden, P., Kinnaird, J. (Eds.), African Geology Reviews. Geological Journal 22
(Thematic Issue), 495–513.
Clarke, M.C.G., Woodhall, D.G., Allen, D., and Darling, G., 1990; Geological,
volcanological and hydrogeological controls of the occurrence of geothermal activity in the
area surrounding Lake Naivasha, Kenya; Ministry of Energy report, Kenya.

86
Corti G., 2012; Evolution and characteristics of continental rifting: Analog modelling inspired
view and comparison with examples from the East African Rift System, Tectonophysics (522-
523, 1-33), doi: 10.1016/j.tecto.2011.06.010.
Corti G., 2011; Evolution and characteristics of continental rifting: Analog modelling-inspired
view and comparison with examples from the East Africa Rift System, Tectonophysics,
doi:10.1016/j.tecto.2011.06.010
Corti Giacomo, Jolante van Wijk, Sierd Cloetingh and Chris K. Morley, 2007; Tectonic
inheritance and continental rift architecture: Numerical and analogue models of the East
African Rift system, TECTONICS, VOL. 26, TC6006, doi:10.1029/2006TC002086, pp .
Darling W. G., Griesshaber E., Andrews J. N., Armannsson H., and O‘Nions R. K., 1995;
The origin of hydrothermal and other gases in the Kenya Rift Valley, Geochimica el
Cosmochimica Acta. Vol. 59, No. 12, pp. 2501-2512
Delvaux D., Levi K., Kajara R. and Sarota, J., 1992; Cenozoic paleostress and kinematic
evolution of the Rukwa-North Malawi rift valley (East African rift system). Bulletin des
Centres de Recherche Exploration Production Elf-Aquiaine 16 (2), pp 383–406.
Dimitrios, G., 1989: Magnetotelluric studies in geothermal areas in Greece and Kenya. Ph.D.
Thesis, University of Edinburgh.
Dzurisin Daniel, 2007; Volcano Deformation Geodetic Monitoring Techniques, Springer and
Praxis publishing, Chichester, United Kingdom, pp 435.
European Space Agency (ESA), 2010;
http://www.esa.int/Our_Activities/Observing_the_Earth/Living_Planet_Symposium/Volcanic
_uplift, accessed on 15th April, 2015
Eternal Engineering Equipment (EEE) Ltd, 2016;
http://www.eeepune.com/images/thr15big.gif, accessed on 13th February, 2016.
Freek van der Meer, Christoph Hecker, Frank van Ruitenbeek, Harald van der Werff,
Charlotte de Wijkerslooth and Carolina Wechsler, 2014; Geologic remote sensing for
geothermal exploration: A review, International Journal of Applied Earth Observation and
Geoinformation, pp 15.
Furgerson R.B., 1972: Electrical Resistivity Survey of the Olkaria project, Kenya. East
African Power & Lighting Co. Ltd. Geothermal Exploration Project report.
Galland O., S. Burchardt, E. Hallot, R. Mourgues, C. Bulois, 2014; Dynamics of dykes versus
cone sheets in volcanic systems, Journal of Geophysical Research, 119, doi: 10.1002/2014 JB
011059.
Giordano, G., Pinton, A., Cianfarra, P., Baez, W., Chiodi, A., Viramonte, J., Norini,
G.,Groppelli, G., 2013; Structural control on geothermal circulation in the CerroTuzgle-
Tocomar geothermal volcanic area (Puna plateau, Argentina). J. Volcanol.Geotherm. Res.
249, pp 77–94.
87
Gregory, J.W., 1896. The Great Rift Valley. John Murray, London, 422p.
Gudmundsson A., 2011; Rock Fractures in Geological Processes, New York: Cambridge.
Gudmundsson A. And Nielsen K., 2006; Ring-faults in composite volcanoes: structures,
models and stress fields associated with their formation, Geological Society of London,
Special Publications, 269:83-108,doi:10.1144/GSL.SP.2006.269.01.06
Guth A. and Wood J., 2013; Geological map of the Southern Kenyan Rift, The geological
Society of America, Colorado.
Harris, R.P., 1969. Basalt type and African Rift valley tectonism. Tectonophysics 8 (4–6),
567–577.
Harkin, P.A., 1960. The Rungwe volcanics at the northern end of lake Nyasa. Memoir
Geological Survey of Tanganyika 2, 172.
He M.Y., A.G. Evans, J.W. Hutchinson, 1994; Crack deflection at an interface between
dissimilar elastic materials: role of residual stresses, Int. J. Solids Struct., 31 (1994), pp.
3443–3455
Hutchison William, Tamsin A. Mather, David M. Pyle, Juliet Biggs, and GezahegnYirgu,
2015, Structural controls on fluid pathways in an active rift system: A case study of the Aluto
volcanic complex, Geosphere, published online on 2 April 2015 as doi:10.1130/GES01119.1
Hutchison J.W. and He M.Y., 1989; Crack deflection at an interface between dissimilar
elastic materials, Int. J. Solids Struct., 25 (1989), pp. 1053–106
Jian Guo Liu and Philippa J. Mason, 2009; Image Processing and GIS for Remote Sensing,
Wiley Blackwell publication, John Wiley and Sons Ltd.
Karingithi C. W., 1999; Olkaria Domesgeochemical model. The Kenya Electricity Generating
Company Ltd, Internal report, pp 30.
KRISP Working Group, 1991; The Kenya Rift: pure shear extension above a mantle plume.
Nature 345, pp 223–227.
KenGen Ltd, 2016, Geothermal Projects Status, April 2016, Unpublished report, KenGen
internal report.
KenGen Ltd, 2015; Audited Annual Results for the Year Ending June 2015; published by
Kenya Electricity Generating Company Ltd, Kenya,
(http://www.kengen.co.ke/sites/default/files/financial-
reports/2015%20KenGen%20Annual%20Report%20%26%20Accountsxxx9_011215.pdf)
accessed on 18th April, 2016.
KenGen, 2014; Stratigraphy logs for well OW-918A and OW-921A, internal report
unpublished.
88
Kenya Power and Lighting Company Ltd, 2015; Annual report and financial statements for
financial year ended 30 June 2015,
(http://kplc.co.ke/img/full/jSsYVq47rObE_KENYA%20POWER%20ANNUAL%20REPOR
T%202015%20-%20FOR%20WEB.pdf), accessed on 12th April, 2016
Kuria Z.N., Woldai T., van der Meer, F.D., Barongo, J.O., 2010; Active fault segmentsas
potential earthquake sources: Inferences from integrated geophysical mapping of the Magadi
fault system, southern Kenya Rift. J. African Earth Sci. 57 (4), pp 345–359.
Lagat J.L., 2004; Geology, hydrothermal alteration and fluid inclusion studies of Olkaria
Domes geothermal field, Kenya; University of Iceland, MSc thesis, UNU-GTP, Iceland,
report 2, pp 71.
Lichoro C.M., 2009; Joint 1-D inversion of TEM and MT data from Olkaria domes
geothermal area, Kenya. Report 16 in: Geothermal training in Iceland 2009. UNU-GTP,
Iceland, pp 289-318.
Lipman P.W., 1997; Subsidence of ashflow calderas: relation to caldera size and magma
geometry, USA, Springer-Verlag, pp 21.
Lillesand T. M. & Kiefer, R. W., 2004; Remote sensing and image interpretation, 4th Edition,
USA, Wiley publishers.
Marco Bonini, Giacomo Corti, Fabrizio Innocenti, Piero Manetti, Francesco Mazzarini,
Tsegaye Abebe, and Zoltan Pecskay, 2005; Evolution of the Main Ethiopian Rift in the frame
of Afar and Kenya rifts propagation, Wiley, TECTONICS, VOL. 24, TC1007,
doi:10.1029/2004TC001680, 2005.
Marshall A. S. l., Macdonald R., Rogers N. W., Fitton. J. G., Tindle, A. G. N., Nejbert, K.,
and Khinton, R. W., 2009; Fractionation of peralkaline silicic magmas: The Greater Olkaria
volcanic complex, Kenya Rift valley J. Petrol., 50, pp 323-359.
Macdonald R., Belkin, H.E., Fitton, J.G., Rogers, N.W., Nejbert, K., Tindle, A.G., and
Marshall, A.S. 2008; The roles of fractional crystallization, magma mixing, crystal mush
remobilization and volatile-melt interactions in the genesis of a young basalt-peralkaline
rhyolite suite, the Greater Olkaria Volcanic Complex, Kenya rift valley. J. Petrology, 49, pp
1515-1547
MANNVIT/ÍSOR/Vatnaskil/Verkís Consortium, 2011: Consultancy services for
geothermal optimization study of the Greater Olkaria Geothermal Fields, Report 3:
Revision of the conceptual model of the Greater Olkaria Geothermal System – Phase
I. Mannvit/ÍSOR/Vatnaskil/Verkís, Reykjavík, November 2011, 100 pp.
McCall, G.J.H., 1957. The Menengai caldera, Kenya Colony. In: 20th International
Geological Congress, Section I 1, pp. 55–69.
McConnel, R.B., 1959. Outline of the geology of the Ruwenzori Mountains. Colonial
Geological Mining Research 7, 245–268.
89
McKenzie, D.P., Davies, D., Molnar, P., 1972. Plate tectonics of the Red Sea and East Africa.
Nature 224, 125–133.
Michael Abrams, HirojiTsu, Glynn Hulley, Koki Iwao, David Pieri, Tom Cudahy, Jeffrey
Kargel, 2015; The Advanced Spaceborne Thermal Emission and ReflectionRadiometer
(ASTER) after fifteen years: Review of global products, Elsevier, pp 292-301.
Ministry of Energy and Petroleum (MOE), 2015, Draft National Energy and Petroleum
Policy, Kenya Government Press,
http://www.erc.go.ke/images/docs/National_Energy_Petroleum_Policy_August_2015.pdf,
accessed on 15th April, 2016.
Mogi Kiyoo, 1958, Relations between the eruption of various volcanoes and the deformations
of the ground surfaces around them, Earthquake research institute, Vol. 36 (1958), pp 99-134
Mohr, P.A., 1970. The Afar triple junction and sea-floor spreading. Journal of Geophysical
Research 75, 7340–7352.
Mohr, P.A., 1962. The Ethiopian rift system. Bulletin of the Geophysical Observatory Addis
Ababa 5, 33–62.
Muchemi G.G., 1998; Geothermal exploration in the Kenyan rift, UNU-GTP, Reykjavik,
Iceland, pp 121-130.
Muchemi G.G., 2000; Conceptual model of Olkaria geothermal field, KenGen, Kenya,
KenGen internal report.
Muchemi G.G., 1992; Structural map of Olkaria geothermal field showing inferred ring
structures, Kenya Power Company internal report.
Mungania J., 1999: Geological report of well OW-714. Kenya Power Company internal
report
Musonye S.X., 2015; Sub-surface petrochemistry, stratigraphy and hydrothermal alteration of
the domes area, Olkaria geothermal field, Kenya, University of Iceland, MSc Thesis report.
Musonye S.X., 2012; Borehole Geology and Alteration Mineralogy of Well OW-914A,
Domes Area, Olkaria Geothermal Field, Central Kenya Rift, UNU-GTP, Iceland, Report No.
23, pp 40.
Mwangi, M.N., 1986: Interpretation of additional sounding data at Olkaria, Kenya. Kenya
Power Company internal report.
Mwania Michael, Risper Kandie, Rose Kubai and Emily Oketch, 2014; Structural mapping of
Eburru geothermal field, 5th May-20th July 2014, 46pp, KenGen internal report
(unpublished).
Naylor W.I., 1972; Geology of the Eburru and Olkaria prospects. U.N. Geothermal
Exploration Project, report.
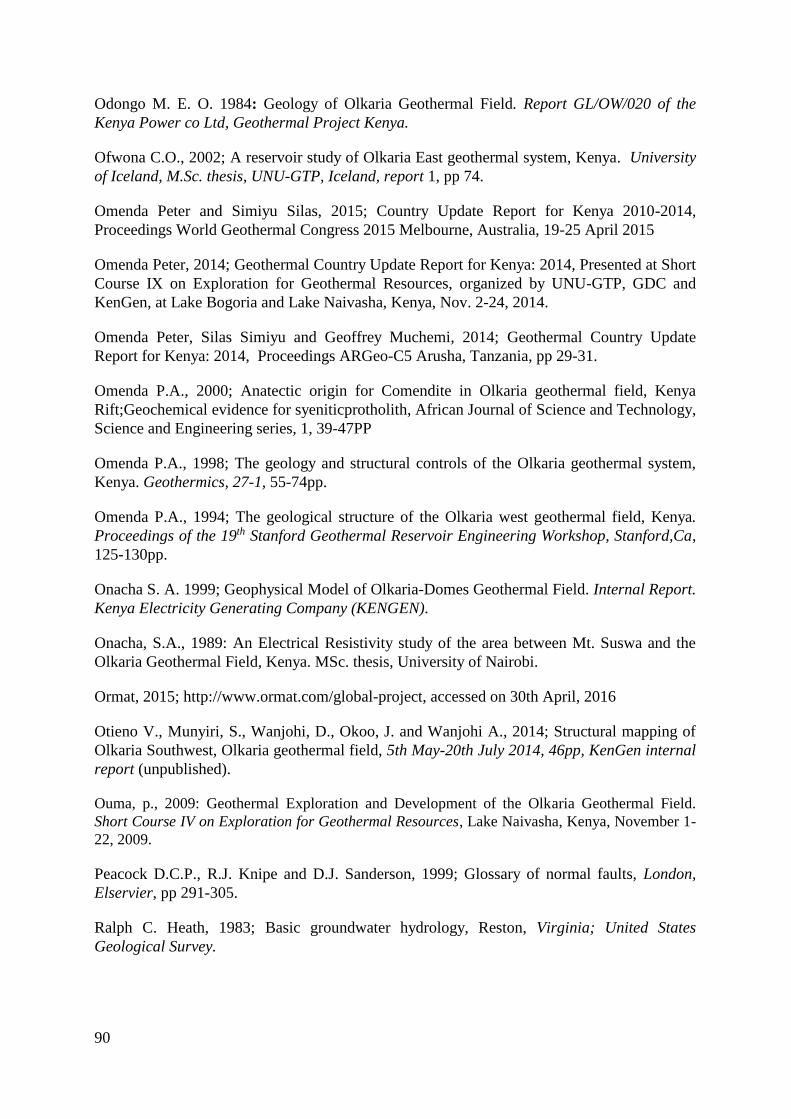
90
Odongo M. E. O. 1984: Geology of Olkaria Geothermal Field. Report GL/OW/020 of the
Kenya Power co Ltd, Geothermal Project Kenya.
Ofwona C.O., 2002; A reservoir study of Olkaria East geothermal system, Kenya. University
of Iceland, M.Sc. thesis, UNU-GTP, Iceland, report 1, pp 74.
Omenda Peter and Simiyu Silas, 2015; Country Update Report for Kenya 2010-2014,
Proceedings World Geothermal Congress 2015 Melbourne, Australia, 19-25 April 2015
Omenda Peter, 2014; Geothermal Country Update Report for Kenya: 2014, Presented at Short
Course IX on Exploration for Geothermal Resources, organized by UNU-GTP, GDC and
KenGen, at Lake Bogoria and Lake Naivasha, Kenya, Nov. 2-24, 2014.
Omenda Peter, Silas Simiyu and Geoffrey Muchemi, 2014; Geothermal Country Update
Report for Kenya: 2014, Proceedings ARGeo-C5 Arusha, Tanzania, pp 29-31.
Omenda P.A., 2000; Anatectic origin for Comendite in Olkaria geothermal field, Kenya
Rift;Geochemical evidence for syeniticprotholith, African Journal of Science and Technology,
Science and Engineering series, 1, 39-47PP
Omenda P.A., 1998; The geology and structural controls of the Olkaria geothermal system,
Kenya. Geothermics, 27-1, 55-74pp.
Omenda P.A., 1994; The geological structure of the Olkaria west geothermal field, Kenya.
Proceedings of the 19th Stanford Geothermal Reservoir Engineering Workshop, Stanford,Ca,
125-130pp.
Onacha S. A. 1999; Geophysical Model of Olkaria-Domes Geothermal Field. Internal Report.
Kenya Electricity Generating Company (KENGEN).
Onacha, S.A., 1989: An Electrical Resistivity study of the area between Mt. Suswa and the
Olkaria Geothermal Field, Kenya. MSc. thesis, University of Nairobi.
Ormat, 2015; http://www.ormat.com/global-project, accessed on 30th April, 2016
Otieno V., Munyiri, S., Wanjohi, D., Okoo, J. and Wanjohi A., 2014; Structural mapping of
Olkaria Southwest, Olkaria geothermal field, 5th May-20th July 2014, 46pp, KenGen internal
report (unpublished).
Ouma, p., 2009: Geothermal Exploration and Development of the Olkaria Geothermal Field.
Short Course IV on Exploration for Geothermal Resources, Lake Naivasha, Kenya, November 1-
22, 2009.
Peacock D.C.P., R.J. Knipe and D.J. Sanderson, 1999; Glossary of normal faults, London,
Elservier, pp 291-305.
Ralph C. Heath, 1983; Basic groundwater hydrology, Reston, Virginia; United States
Geological Survey.
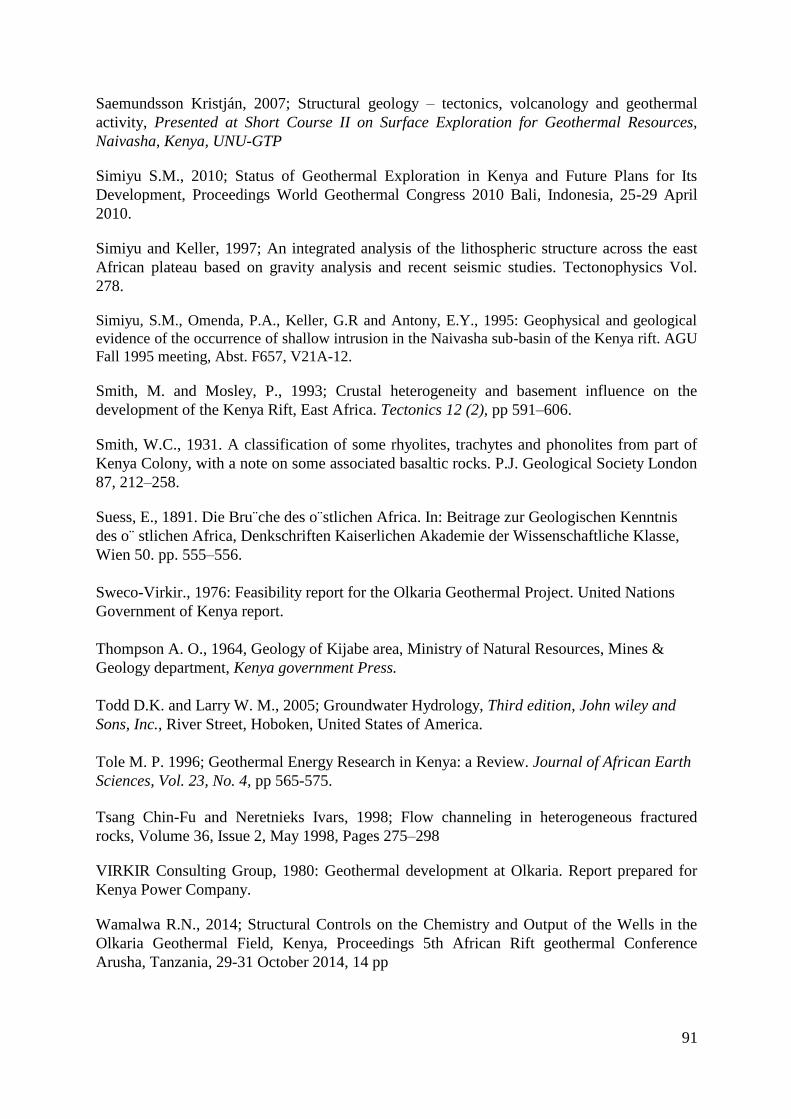
91
Saemundsson Kristján, 2007; Structural geology – tectonics, volcanology and geothermal
activity, Presented at Short Course II on Surface Exploration for Geothermal Resources,
Naivasha, Kenya, UNU-GTP
Simiyu S.M., 2010; Status of Geothermal Exploration in Kenya and Future Plans for Its
Development, Proceedings World Geothermal Congress 2010 Bali, Indonesia, 25-29 April
2010.
Simiyu and Keller, 1997; An integrated analysis of the lithospheric structure across the east
African plateau based on gravity analysis and recent seismic studies. Tectonophysics Vol.
278.
Simiyu, S.M., Omenda, P.A., Keller, G.R and Antony, E.Y., 1995: Geophysical and geological
evidence of the occurrence of shallow intrusion in the Naivasha sub-basin of the Kenya rift. AGU
Fall 1995 meeting, Abst. F657, V21A-12.
Smith, M. and Mosley, P., 1993; Crustal heterogeneity and basement influence on the
development of the Kenya Rift, East Africa. Tectonics 12 (2), pp 591–606.
Smith, W.C., 1931. A classification of some rhyolites, trachytes and phonolites from part of
Kenya Colony, with a note on some associated basaltic rocks. P.J. Geological Society London
87, 212–258.
Suess, E., 1891. Die Bru¨che des o¨stlichen Africa. In: Beitrage zur Geologischen Kenntnis
des o¨ stlichen Africa, Denkschriften Kaiserlichen Akademie der Wissenschaftliche Klasse,
Wien 50. pp. 555–556.
Sweco-Virkir., 1976: Feasibility report for the Olkaria Geothermal Project. United Nations
Government of Kenya report.
Thompson A. O., 1964, Geology of Kijabe area, Ministry of Natural Resources, Mines &
Geology department, Kenya government Press.
Todd D.K. and Larry W. M., 2005; Groundwater Hydrology, Third edition, John wiley and
Sons, Inc., River Street, Hoboken, United States of America.
Tole M. P. 1996; Geothermal Energy Research in Kenya: a Review. Journal of African Earth
Sciences, Vol. 23, No. 4, pp 565-575.
Tsang Chin-Fu and Neretnieks Ivars, 1998; Flow channeling in heterogeneous fractured
rocks, Volume 36, Issue 2, May 1998, Pages 275–298
VIRKIR Consulting Group, 1980: Geothermal development at Olkaria. Report prepared for
Kenya Power Company.
Wamalwa R.N., 2014; Structural Controls on the Chemistry and Output of the Wells in the
Olkaria Geothermal Field, Kenya, Proceedings 5th African Rift geothermal Conference
Arusha, Tanzania, 29-31 October 2014, 14 pp

92
Wambugu J.M., 1996: Assessment of Olkaria North East geothermal reservoir, based on well
discharge chemistry. Kenya Power Company internal report
Wambugu J.M., 1995: Geochemical update of Olkaria West geothermal field. Kenya Power
Company, Ltd., internal report, 40 pp.
Wanjohi A. W., 2014: Geophysics report of the Great Olkaria Geothermal Area. KenGen
Internal Report.
Wang P. and. Xu L.R, 2006; Dynamic interfacial debonding initiation induced by an incident
crack Int. J. Solids Struct., 43 (2006), pp. 6535–6550
West-JEC, 2009: The Olkaria Optimization Study (Phase II) – Final reservoir analysis report.
West Japan Engineering Consultants, Inc., 301 pp.
Wohlenberg, J., 1969. Remarks on the seismicity of East Africa between 4 _N–12 _S and 23
_E–40 _E. Tectonophysics 8 (4/6), 567–577.
Woodhall D. J., 1987; Geology of Longonot Volcano, The Greater Olkaria Volcanic Complex
and adjacent areas; British Geological Survey Report No BGSGENKEN/5, 15-16pp.
Wood James and Alex Guth; 2015, East Africa's Great Rift Valley: A Complex Rift System,
Michigan Technological University, accessed at http://geology.com/articles/east-africa-
rift.shtml on 31st March, 2016.
Whieldon et al. (1994). Heat flow in the Kenya Rift zone. In Crustal and Upper Mantle Structure
of the Kenya Rift. Tectonophysics, 236, 131-149 pp.
Xu Wen, Rongzhang Zheng, Wentao Ma, Fangming Song and Guihua Yu, 2003; Pattern of
latest tectonic motion and its dynamics for active blocks in Sichuan-Yunnan region, China,
Science in China Series D: Earth Sciences, Volume 46, Supplement 2, pp 210-226
Yong Technology Inc. (2016), http://www.yongtechnology.com/yong-lab/online-rose-
diagram/, accessed on 10th February, 2016.

93
Appendix
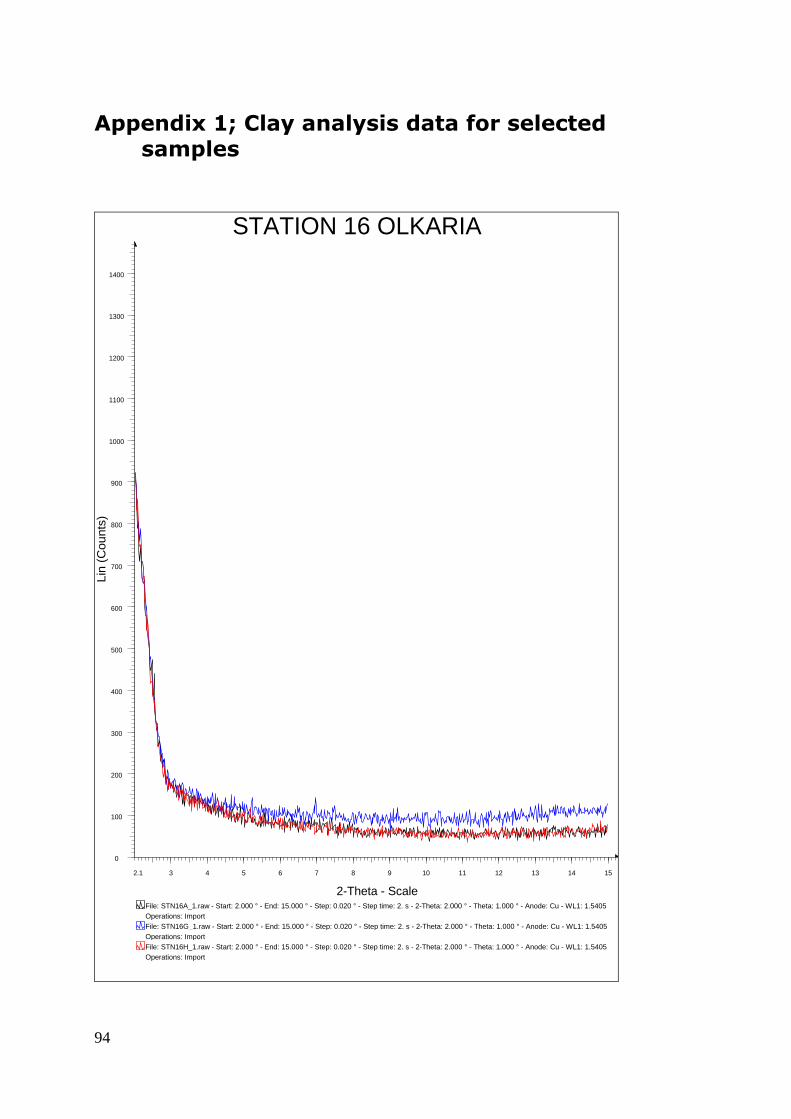
94
Appendix 1; Clay analysis data for selected samples
STATION 16 OLKARIA
Operations: Import
File: STN16H_1.raw - Start: 2.000 ° - End: 15.000 ° - Step: 0.020 ° - Step time: 2. s - 2-Theta: 2.000 ° - Theta: 1.000 ° - Anode: Cu - WL1: 1.5405
Operations: Import
File: STN16G_1.raw - Start: 2.000 ° - End: 15.000 ° - Step: 0.020 ° - Step time: 2. s - 2-Theta: 2.000 ° - Theta: 1.000 ° - Anode: Cu - WL1: 1.5405
Operations: Import
File: STN16A_1.raw - Start: 2.000 ° - End: 15.000 ° - Step: 0.020 ° - Step time: 2. s - 2-Theta: 2.000 ° - Theta: 1.000 ° - Anode: Cu - WL1: 1.5405
Lin
(C
ou
nts
)
0
100
200
300
400
500
600
700
800
900
1000
1100
1200
1300
1400
2-Theta - Scale
2.1 3 4 5 6 7 8 9 10 11 12 13 14 15
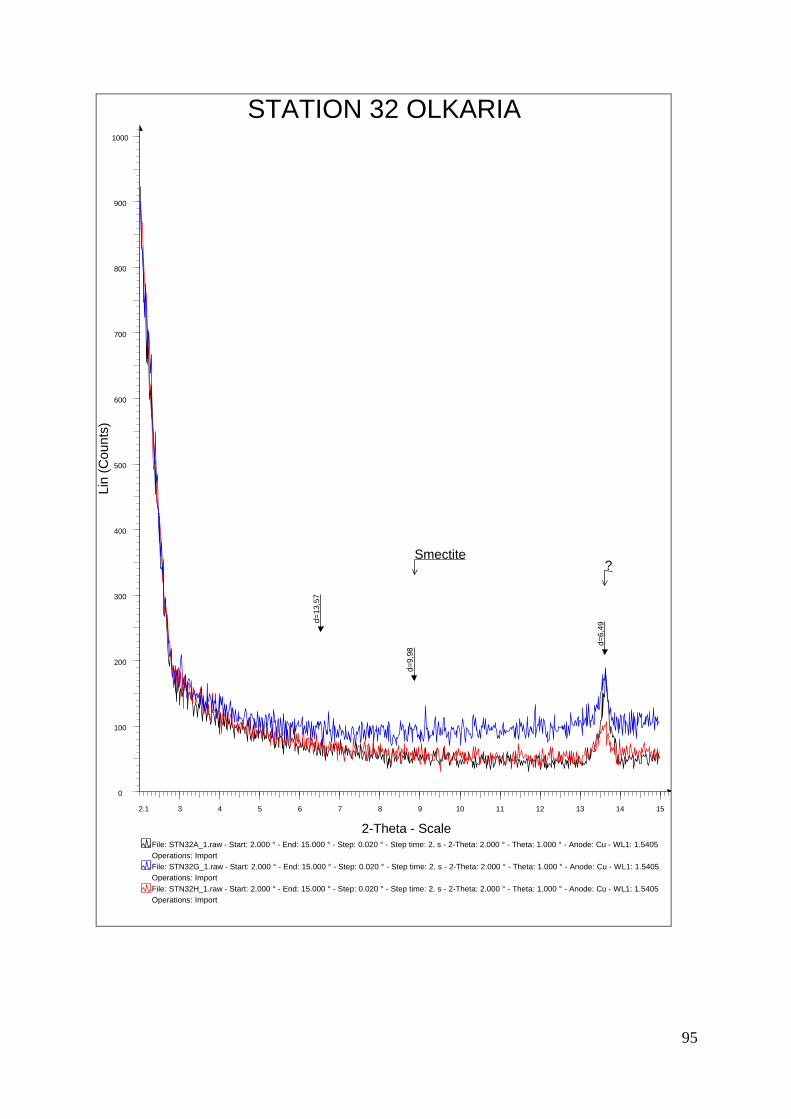
95
STATION 32 OLKARIA
Operations: Import
File: STN32H_1.raw - Start: 2.000 ° - End: 15.000 ° - Step: 0.020 ° - Step time: 2. s - 2-Theta: 2.000 ° - Theta: 1.000 ° - Anode: Cu - WL1: 1.5405
Operations: Import
File: STN32G_1.raw - Start: 2.000 ° - End: 15.000 ° - Step: 0.020 ° - Step time: 2. s - 2-Theta: 2.000 ° - Theta: 1.000 ° - Anode: Cu - WL1: 1.5405
Operations: Import
File: STN32A_1.raw - Start: 2.000 ° - End: 15.000 ° - Step: 0.020 ° - Step time: 2. s - 2-Theta: 2.000 ° - Theta: 1.000 ° - Anode: Cu - WL1: 1.5405
Lin
(C
ou
nts
)
0
100
200
300
400
500
600
700
800
900
1000
2-Theta - Scale
2.1 3 4 5 6 7 8 9 10 11 12 13 14 15
d=
6,4
9
d=
9,9
8
d=
13,5
7
?Smectite
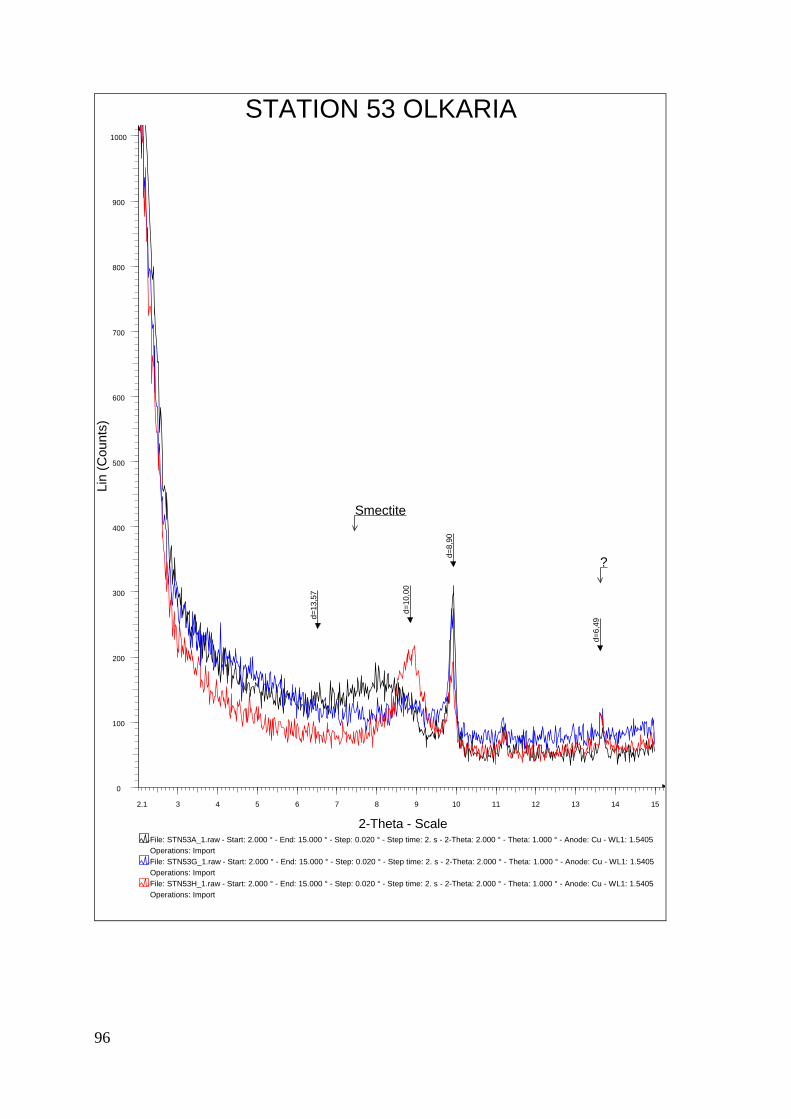
96
STATION 53 OLKARIA
Operations: Import
File: STN53H_1.raw - Start: 2.000 ° - End: 15.000 ° - Step: 0.020 ° - Step time: 2. s - 2-Theta: 2.000 ° - Theta: 1.000 ° - Anode: Cu - WL1: 1.5405
Operations: Import
File: STN53G_1.raw - Start: 2.000 ° - End: 15.000 ° - Step: 0.020 ° - Step time: 2. s - 2-Theta: 2.000 ° - Theta: 1.000 ° - Anode: Cu - WL1: 1.5405
Operations: Import
File: STN53A_1.raw - Start: 2.000 ° - End: 15.000 ° - Step: 0.020 ° - Step time: 2. s - 2-Theta: 2.000 ° - Theta: 1.000 ° - Anode: Cu - WL1: 1.5405
Lin
(C
ou
nts
)
0
100
200
300
400
500
600
700
800
900
1000
2-Theta - Scale
2.1 3 4 5 6 7 8 9 10 11 12 13 14 15
d=
6,4
9
d=
10,0
0
d=
13,5
7
d=
8,9
0
?
Smectite

97
STATION 69 OLKARIA
Operations: Import
File: STN69H_1.raw - Start: 2.000 ° - End: 15.000 ° - Step: 0.020 ° - Step time: 2. s - 2-Theta: 2.000 ° - Theta: 1.000 ° - Anode: Cu - WL1: 1.5405
Operations: Import
File: STN69G_1.raw - Start: 2.000 ° - End: 15.000 ° - Step: 0.020 ° - Step time: 2. s - 2-Theta: 2.000 ° - Theta: 1.000 ° - Anode: Cu - WL1: 1.5405
Operations: Import
File: STN69A_1.raw - Start: 2.000 ° - End: 15.000 ° - Step: 0.020 ° - Step time: 2. s - 2-Theta: 2.000 ° - Theta: 1.000 ° - Anode: Cu - WL1: 1.5405
Lin
(C
ou
nts
)
0
100
200
300
400
500
600
700
800
900
1000
2-Theta - Scale
2.1 3 4 5 6 7 8 9 10 11 12 13 14 15
d=
7,2
0
d=
10,0
0
d=
13,5
7
Smectite
Kaolinite

98
STATION 70 OLKARIA
Operations: Import
File: STN70H_1.raw - Start: 2.000 ° - End: 15.000 ° - Step: 0.020 ° - Step time: 2. s - 2-Theta: 2.000 ° - Theta: 1.000 ° - Anode: Cu - WL1: 1.5405
Operations: Import
File: STN70G_1.raw - Start: 2.000 ° - End: 15.000 ° - Step: 0.020 ° - Step time: 2. s - 2-Theta: 2.000 ° - Theta: 1.000 ° - Anode: Cu - WL1: 1.5405
Operations: Import
File: STN70A_1.raw - Start: 2.000 ° - End: 15.000 ° - Step: 0.020 ° - Step time: 2. s - 2-Theta: 2.000 ° - Theta: 1.000 ° - Anode: Cu - WL1: 1.5405
Lin
(C
ounts
)
0
100
200
300
400
500
600
700
800
900
1000
2-Theta - Scale
2.1 3 4 5 6 7 8 9 10 11 12 13 14 15
d=
10,0
0
d=
13,5
7
d=
6,4
8?
Smectite
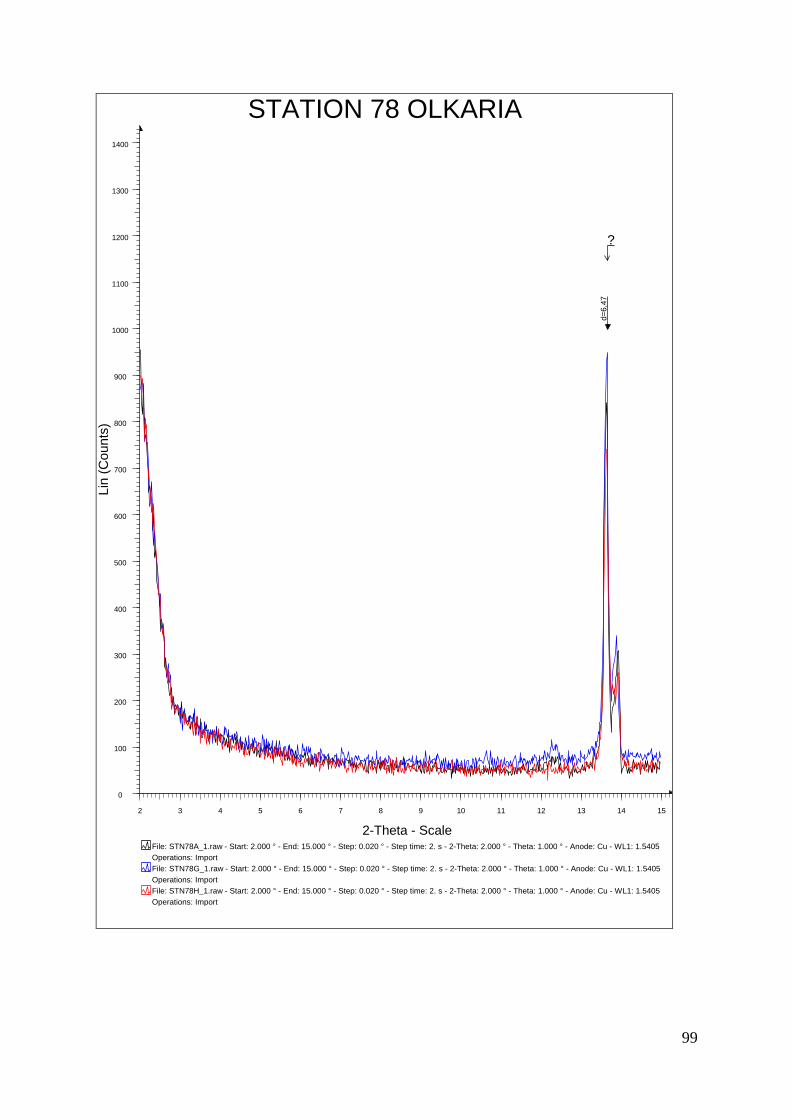
99
STATION 78 OLKARIA
Operations: Import
File: STN78H_1.raw - Start: 2.000 ° - End: 15.000 ° - Step: 0.020 ° - Step time: 2. s - 2-Theta: 2.000 ° - Theta: 1.000 ° - Anode: Cu - WL1: 1.5405
Operations: Import
File: STN78G_1.raw - Start: 2.000 ° - End: 15.000 ° - Step: 0.020 ° - Step time: 2. s - 2-Theta: 2.000 ° - Theta: 1.000 ° - Anode: Cu - WL1: 1.5405
Operations: Import
File: STN78A_1.raw - Start: 2.000 ° - End: 15.000 ° - Step: 0.020 ° - Step time: 2. s - 2-Theta: 2.000 ° - Theta: 1.000 ° - Anode: Cu - WL1: 1.5405
Lin
(C
ou
nts
)
0
100
200
300
400
500
600
700
800
900
1000
1100
1200
1300
1400
2-Theta - Scale
2 3 4 5 6 7 8 9 10 11 12 13 14 15
d=
6,4
7
?

100
STATION 83 OLKARIA
Operations: Import
File: STN83H_1.raw - Start: 2.000 ° - End: 15.000 ° - Step: 0.020 ° - Step time: 2. s - 2-Theta: 2.000 ° - Theta: 1.000 ° - Anode: Cu - WL1: 1.5405
Operations: Import
File: STN83G_1.raw - Start: 2.000 ° - End: 15.000 ° - Step: 0.020 ° - Step time: 2. s - 2-Theta: 2.000 ° - Theta: 1.000 ° - Anode: Cu - WL1: 1.5405
Operations: Import
File: STN83A_1.raw - Start: 2.000 ° - End: 15.000 ° - Step: 0.020 ° - Step time: 2. s - 2-Theta: 2.000 ° - Theta: 1.000 ° - Anode: Cu - WL1: 1.5405
Lin
(C
ou
nts
)
0
100
200
300
400
500
600
700
800
900
1000
1100
1200
1300
1400
2-Theta - Scale
2.1 3 4 5 6 7 8 9 10 11 12 13 14 15
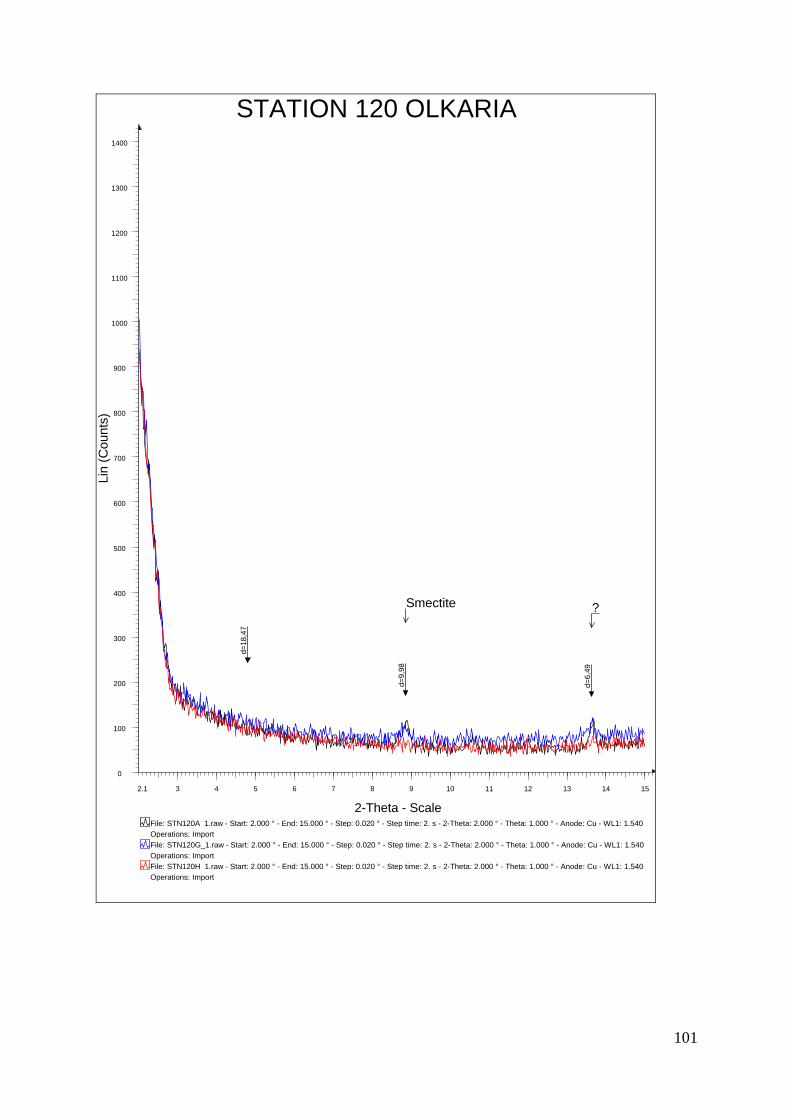
101
STATION 120 OLKARIA
Operations: Import
File: STN120H_1.raw - Start: 2.000 ° - End: 15.000 ° - Step: 0.020 ° - Step time: 2. s - 2-Theta: 2.000 ° - Theta: 1.000 ° - Anode: Cu - WL1: 1.540
Operations: Import
File: STN120G_1.raw - Start: 2.000 ° - End: 15.000 ° - Step: 0.020 ° - Step time: 2. s - 2-Theta: 2.000 ° - Theta: 1.000 ° - Anode: Cu - WL1: 1.540
Operations: Import
File: STN120A_1.raw - Start: 2.000 ° - End: 15.000 ° - Step: 0.020 ° - Step time: 2. s - 2-Theta: 2.000 ° - Theta: 1.000 ° - Anode: Cu - WL1: 1.540
Lin
(C
ou
nts
)
0
100
200
300
400
500
600
700
800
900
1000
1100
1200
1300
1400
2-Theta - Scale
2.1 3 4 5 6 7 8 9 10 11 12 13 14 15
d=
6,4
9
d=
9,9
8
d=
18,4
7
?Smectite

102

103
Appendix 2; Sampling stations
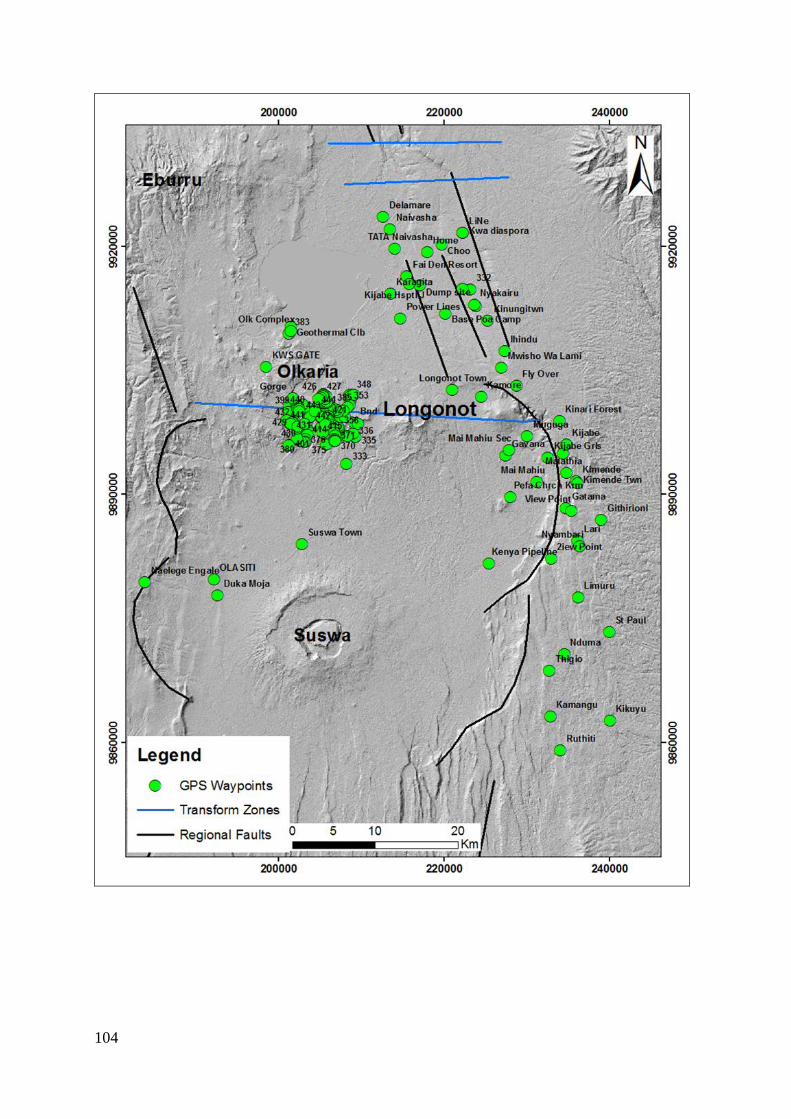
104
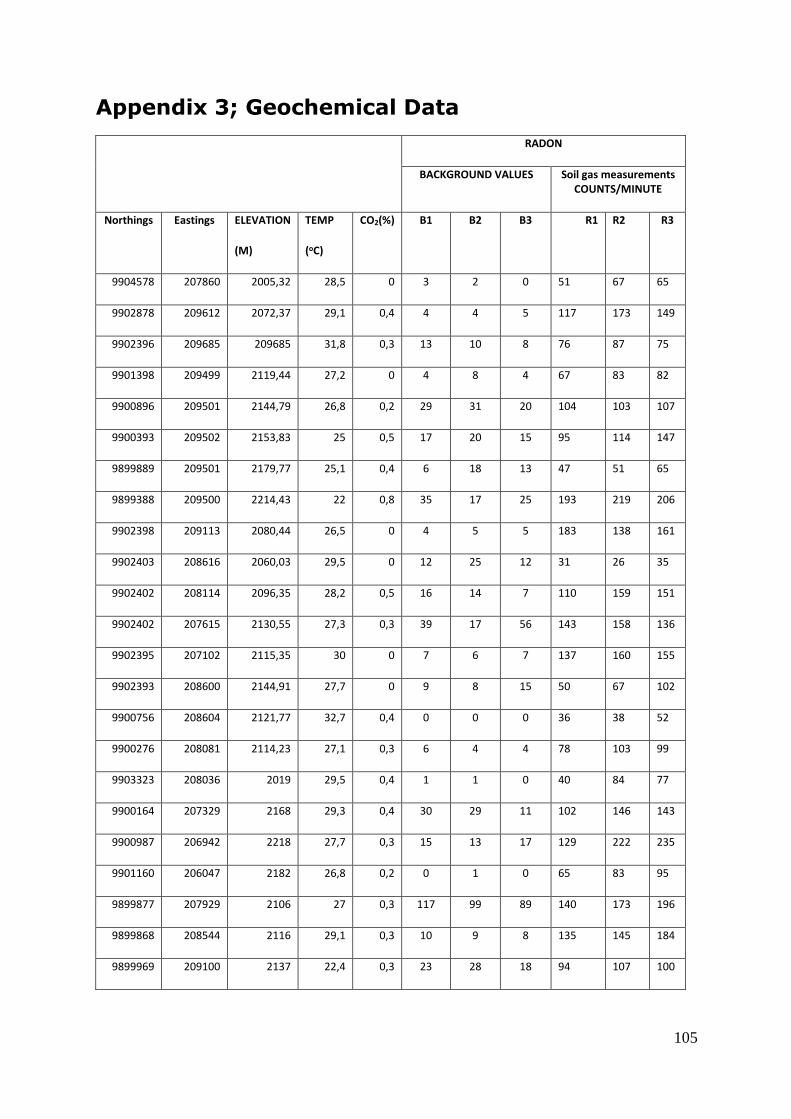
105
Appendix 3; Geochemical Data
RADON
BACKGROUND VALUES Soil gas measurements COUNTS/MINUTE
Northings Eastings ELEVATION
(M)
TEMP
(oC)
CO2(%) B1 B2 B3 R1 R2 R3
9904578 207860 2005,32 28,5 0 3 2 0 51 67 65
9902878 209612 2072,37 29,1 0,4 4 4 5 117 173 149
9902396 209685 209685 31,8 0,3 13 10 8 76 87 75
9901398 209499 2119,44 27,2 0 4 8 4 67 83 82
9900896 209501 2144,79 26,8 0,2 29 31 20 104 103 107
9900393 209502 2153,83 25 0,5 17 20 15 95 114 147
9899889 209501 2179,77 25,1 0,4 6 18 13 47 51 65
9899388 209500 2214,43 22 0,8 35 17 25 193 219 206
9902398 209113 2080,44 26,5 0 4 5 5 183 138 161
9902403 208616 2060,03 29,5 0 12 25 12 31 26 35
9902402 208114 2096,35 28,2 0,5 16 14 7 110 159 151
9902402 207615 2130,55 27,3 0,3 39 17 56 143 158 136
9902395 207102 2115,35 30 0 7 6 7 137 160 155
9902393 208600 2144,91 27,7 0 9 8 15 50 67 102
9900756 208604 2121,77 32,7 0,4 0 0 0 36 38 52
9900276 208081 2114,23 27,1 0,3 6 4 4 78 103 99
9903323 208036 2019 29,5 0,4 1 1 0 40 84 77
9900164 207329 2168 29,3 0,4 30 29 11 102 146 143
9900987 206942 2218 27,7 0,3 15 13 17 129 222 235
9901160 206047 2182 26,8 0,2 0 1 0 65 83 95
9899877 207929 2106 27 0,3 117 99 89 140 173 196
9899868 208544 2116 29,1 0,3 10 9 8 135 145 184
9899969 209100 2137 22,4 0,3 23 28 18 94 107 100

106
9900019 209617 2154 24,6 0,5 6 2 3 84 113 115
9900033 207363 2109 25,3 0,4 6 6 14 67 104 110
9900238 206711 2138 25,4 0,3 2 5 15 118 130 151
9900208 206238 2142 26,7 0,5 7 11 17 49 74 70
9901616 209719 2091 25 0,3 3 1 2 66 125 95
9901599 208806 2052 23,9 0,2 2 2 0 49 63 56
9901724 208129 2091 26,2 0,2 7 10 13 59 84 102
9900783 207797 2155 26,8 0,4 4 3 4 49 61 95
9898600 208377 2137 23,3 0,3 4 1 4 118 141 138
9898526 207906 2152 28,8 0,4
9898542 207454 2074 25,5 0,3
9898285 207180 1992 26 0,4
9898600 206933 2074 27,5 1,5
9899445 208684 2129 24,4 0,8 1 0 0 76 99 118
9899512 208218 2111 27,2 0,3 6 6 6 125 142 159
9899523 207620 2095 24,6 0,4 15 7 2 78 96 103
9899605 207077 2103 28,4 0,5 13 13
9899619 206618 2125 31,7 0,6
9899908 206128 2224 31,7 1,2
9903338 207624 2065 28 0,4 0 1 0 43 65 78
9902905 207136 2068 23,9 0,3 27 12 10 94 117 124
9902837 206466 2050 27,3 0,4 34 24 26 34 63 61
9902553 205725 2001 28,8 0,4 33 35 33 119 157 176
9902866 205143 1931 27,8 0,3 33 15 33 70 92 124
9902183 207648 2032 25 0,5 48 36 19 105 173 144
9902261 207044 2041 27,6 0,6 20 14 24 104 142 116
9902328 206460 2115 28,6 0,3 24 17 20 54 67 60
9902045 205573 2056 27 0,5 19 8 17 189 212 256
9903035 204345 1906 31,8 0,5 26 26 20 64 98 88

107
9903093 202642 1896 26,5 0,4 0 0 0 20 12 12
9902998 201525 2034 27,6 0,4 0 0 0 14 10 6
9903214 201799 2017 27 0,6 11 2 9 74 78 78
9901660 206930 2195 29,1 0,6
9901597 206400 2181 31,5 0,5
9901560 205901 2110 30,2 0,2
9902412 202749 1928 29,1 0,3
9902327 203249 1976 25,1 0,3 202614
9902396 203749 1999 25,1 0,3 202114
9902400 204250 1986 25,4 0,4
9901727 204747 2017 28,7 0,5
9901736 204236 2011 24,6 0,1 0 0 0 71 117 141
9901724 203633 1980 25,9 0,1 18 15 11 87 115 125
9901771 203114 1950 29,7 0,4 0 0 0 110 129 128
9901993 202508 1937 25,5 0,1 0 0 3 113 131 149
9902000 202083 1883 26,7 0,5 20 30 22 116 161 191
9901299 205102 1986 24,3 0,2 37 38 40 97 138 142
9901251 204600 2025 24,1 0,3 24 30 21 108 174 176
9901250 204100 2075 27,5 0,3 19 22 21 57 83 89
9901251 203600 1990 25,2 0,1 16 23 21 93 122 132
9901251 203100 1963 26 0,4 23 20 21 90 131 137
9901400 202602 1926 28,3 0,2 15 20 21 116 119 139
9901500 202100 1898 24,5 0,3 6 5 5 74 142 156
9901002 202100 1903 28 0,1 19 16 11 94 159 193
9900958 202634 1905 32,5 0,2 70 46 38 119 146 161
9900754 203118 1963 28 0,3 41 38 31 156 201 236
9900715 203596 1964 31,4 0,1 34 37 44 53 88 151
9900751 204101 1997 26 0,1 32 25 25 124 192 182
9900760 204601 1996 26,5 0,1 3 6 2 39 56 48

108
9900754 205101 2017 26,7 0,3 6 8 9 107 113 149
9900254 205103 2002 27,1 0,2 13 13 22 93 152 165
9899981 204525 1989 28,1 0,4 1 0 1 65 105 108
9900005 203927 1955 30,2 0,8 27 19 14 55 68 84
9900009 203386 2018 27,2 1,1 16 17 13 94 143 153
9899973 202860 2045 26,8 0,8 0 3 2 121 206 220
9900002 202160 2000 28,4 0 12 30 17 52 149 161
9900009 201616 1950 25,2 0,6 17 21 15 45 63 66
9899500 201615 1966 26 0 16 17 16 102 136 113
9899500 202115 1999 29,3 0,3 16 16 19 119 165 170
9899508 202615 2016 23,6 0,9 1 5 6 307 511 533
9899498 203115 2060 24 0,4 34 30 27 261 407 524
9899500 203615 2018 30,2 0,5 65 83 80 159 204 245
9899499 204116 1984 26,1 0,4 79 68 65 151 160 187
9899500 204615 2014 31,6 0,1 55 61 46 159 216 211
9899480 205125 2005 21,1 0,3 8 3 6 69 99 130
9898995 205114 2039 20,4 0,81 11 13 1 176 297 321
9898898 204615 2086 22 1,4 22 27 38 354 524 603
9898898 204115 2075 21,4 0,1 65 60 59 217 350 428
9898823 203657 2031 22,1 0,3 64 62 52 157 228 256
9899000 203113 2055 24,6 0,1 8 9 7 273 515 733
9899000 202613 2031 25,2 0,2 259 201 144 294 351 383
9898990 202110 1962 28,5 0,5 158 120 148 208 228 242


