Guidance Notes on Structural Monitoring Using Acoustic Emissions GUIDANCE NOTES ON STRUCTURAL MONITORING USING ACOUSTIC EMISSIONS OCTOBER 2016 American Bureau of Shipping Incorporated by Act of Legislature of the State of New York 1862 2016 American Bureau of Shipping. All rights reserved. ABS Plaza 16855 Northchase Drive Houston, TX 77060 USA
Transcript
Guidance Notes on Structural Monitoring Using Acoustic Emissions
GUIDANCE NOTES ON
STRUCTURAL MONITORING USING ACOUSTIC EMISSIONS
OCTOBER 2016
American Bureau of Shipping Incorporated by Act of Legislature of the State of New York 1862
2016 American Bureau of Shipping. All rights reserved. ABS Plaza 16855 Northchase Drive Houston, TX 77060 USA
F o r e w o r d
Foreword Ship and offshore structures continue to become larger and more complex, requiring operators to have a more in-depth knowledge of structural integrity. There is a need for non-intrusive, real-time monitoring technique for monitoring structural health while the vessel is in operation.
Acoustic Emission Testing (AET) is a passive nondestructive examination technology that has been successfully applied to the detection and monitoring of crack propagation, corrosion activity, cavitation erosion, and leaking in structures constructed of steel, aluminum, composite and other materials. AET has found increasingly wider applications in many industries as a feasible technique for detection and health monitoring of storage tanks, suspension bridges, nuclear plants, pressure vessels, LNG tanks, mooring chains, airplanes, etc.
ABS first accepted AET in the Guide for Vessels Intended to Carry Compressed Natural Gases in Bulk (2005) as a feasible tool for real-time monitoring of sub-critical structural flaws. The IACS UR Z17 Procedural Requirements for Service Suppliers (2016) accepts AET for leak testing in gas carriers, and requires documented procedures based upon recognized standards.
These Guidance Notes on Structural Monitoring Using Acoustic Emissions provide best practices for planning and conducting AET in the maritime and offshore oil and gas industries. Descriptions are given to the roles of owner, class and AET service provider, and how they shall collaborate.
These Guidance Notes focus on steps to be performed rather than on the methodology of conducting AET. It is not possible for the current Guidance Notes to cover every application, because each AET application depends on several factors including vessel type, flaws to be monitored, vessel condition, and hazardous areas.
Sections 1 to 7 describe best practices for conducting AET on a ship or other floating structures. Appendices 1 to 6 provide additional background information, including codes and standards, and example applications.
These Guidance Notes become effective on the first day of the month of publication.
Users are advised to check periodically on the ABS website www.eagle.org to verify that this version of these Guidance Notes is the most current.
We welcome your feedback. Comments or suggestions can be sent electronically by email to [email protected].
Terms of Use
The information presented herein is intended solely to assist the reader in the methodologies and/or techniques discussed. These Guidance Notes do not and cannot replace the analysis and/or advice of a qualified professional. It is the responsibility of the reader to perform their own assessment and obtain professional advice. Information contained herein is considered to be pertinent at the time of publication, but may be invalidated as a result of subsequent legislations, regulations, standards, methods, and/or more updated information and the reader assumes full responsibility for compliance. This publication may not be copied or redistributed in part or in whole without prior written consent from ABS.
ii ABS GUIDANCE NOTES ON STRUCTURAL MONITORING USING ACOUSTIC EMISSIONS . 2016
1 General ............................................................................................... 1 3 Scope of These Guidance Notes ........................................................ 2 5 Information to be Submitted ................................................................ 2 7 Alternatives ......................................................................................... 3 9 Terminology and Abbreviations .......................................................... 3
SECTION 2 Application of Acoustic Emission in the Marine and Offshore
Industry ................................................................................................... 5 1 General ............................................................................................... 5 3 Test Modes and Overall Process ........................................................ 5 5 Equipment and System ....................................................................... 5 7 Roles of Owner/Operator, Acoustic Emission Test Team and
Classification Society (CS).................................................................. 7 9 Qualification of Acoustic Emission Testing Personnel ........................ 8
9.1 AET Trainee .................................................................................... 8 9.3 AET Level 1 ..................................................................................... 8 9.5 AET Level 2 ..................................................................................... 8 9.7 AET Level 3 ..................................................................................... 9
11 AET Procedures and Techniques ....................................................... 9 FIGURE 1 Periodic Inspection Using AET ................................................ 6 FIGURE 2 Continuous Monitoring Using AET ........................................... 6 FIGURE 3 Acoustic Emission Testing: Lead Responsibilities and
1 Responsibilities and Task Planning .................................................. 10 3 Development, Approvals, and Use of the Test Procedure ............... 10 5 Acceptance Standards of Planning ................................................... 10 TABLE 1 Task Planning Table ............................................................... 11
ABS GUIDANCE NOTES ON STRUCTURAL MONITORING USING ACOUSTIC EMISSIONS . 2016 iii
SECTION 4 Installation and Checks ....................................................................... 12 1 General ............................................................................................. 12 3 Installation of Sensors and Equipment ............................................. 12 5 Systems Checks ............................................................................... 12 7 Acceptance Standards of Installation and System Checks .............. 13
SECTION 5 Data Acquisition and Analysis ............................................................ 14
1 General ............................................................................................. 14 3 Data from Vessel Owner/Operator ................................................... 14 5 Data from Sensors ............................................................................ 14 7 Hull Structure Stress Analysis........................................................... 14 9 Analysis of Acoustic Emission Signals ............................................. 15 11 Warning Levels ................................................................................. 15 FIGURE 1 Procedure for Data Analysis ................................................... 15
1 Acoustic Emission Test Report ......................................................... 16 3 Acceptance Standards of Report ...................................................... 17
SECTION 7 Follow-up Inspection ............................................................................ 18 APPENDIX 1 An Introduction to Acoustic Emission ............................................... 19
1 Acoustic Emission Sources ............................................................... 19 3 Structural Loading and Acoustic Emission Source Activity .............. 21 5 The Signal Formation Chain ............................................................. 24 FIGURE 1 Schematic of the Acoustic Emission Process ......................... 19 FIGURE 2 Emission Instability .................................................................. 22 FIGURE 3 Emission on Repeated Loading .............................................. 23 FIGURE 4 Indication of Crack Face Rubbing ........................................... 24 FIGURE 5 The Signal Formation Chain ................................................... 25
APPENDIX 2 Test Procedure ..................................................................................... 26
1 Content and Format .......................................................................... 26 3 Monitoring Area ................................................................................. 26 5 Loading ............................................................................................. 27 7 Equipment Setup .............................................................................. 27
7.1 Specification of the Equipment ...................................................... 27 7.3 Layout of Sensors and Location Techniques ................................. 27 7.5 Equipment Settings ........................................................................ 28 7.7 System Performance Checks and Maintenance ............................ 28 7.9 Recording and Data Storage ......................................................... 29
iv ABS GUIDANCE NOTES ON STRUCTURAL MONITORING USING ACOUSTIC EMISSIONS . 2016
11 Data Acquisition and Recording ....................................................... 29 13 Data Interpretation and Evaluation ................................................... 30 15 Reporting .......................................................................................... 30
APPENDIX 3 Data Acquisition and Analysis ............................................................ 31
1 General Requirements for Data Acquisition ..................................... 31 1.1 Data from Vessel Owner/Operator ................................................ 31 1.3 Data from the Sensors................................................................... 31 1.5 Data Acquisition Graphs ................................................................ 32 1.7 Data Storage and Transfer ............................................................ 32 1.9 Test Log ........................................................................................ 32
5 Data Analysis .................................................................................... 35 5.1 Data Quality – Correlation between Stress and Acoustic
Emission ........................................................................................ 35 5.3 Data Quality – Signature Recognition ........................................... 36 5.5 Data Filtering During Analysis ....................................................... 37 5.7 Source Location ............................................................................ 37
7 Recent Advances in Data Processing .............................................. 39 FIGURE 1 Procedure for Data Analysis ................................................... 35 FIGURE 2 An Example of the Energy vs. Amplitude Cross Plot .............. 37 FIGURE 3 Source Location Cluster Formed During Ocean Voyage ....... 38
APPENDIX 4 Acoustic Emission Testing Systems and Performance
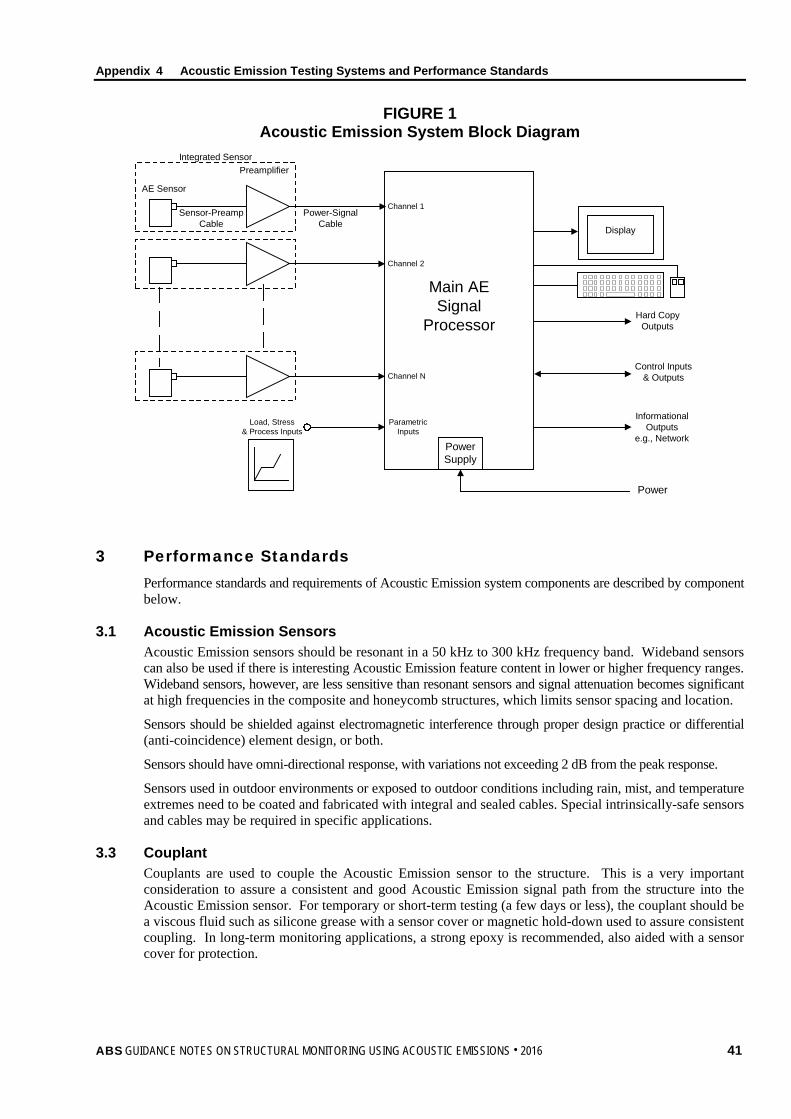
Standards .............................................................................................. 40 1 General Acoustic Emission System Description ............................... 40 3 Performance Standards .................................................................... 41
3.1 Acoustic Emission Sensors ........................................................... 41 3.3 Couplant ........................................................................................ 41 3.5 Signal Cable .................................................................................. 42 3.7 Preamplifier ................................................................................... 42 3.9 Power-Signal Cable ....................................................................... 42 3.11 Acoustic Emission Processor Power Supply ................................. 42 3.13 Main Signal Processor................................................................... 42 3.15 Number of Acoustic Emission Channels........................................ 43 3.17 System Environmental Requirements ........................................... 43
5 Calibration and Verification ............................................................... 43 7 Software ............................................................................................ 43 9 Need for Current Equipment ............................................................. 43 FIGURE 1 Acoustic Emission System Block Diagram ............................. 41
ABS GUIDANCE NOTES ON STRUCTURAL MONITORING USING ACOUSTIC EMISSIONS . 2016 v
APPENDIX 5 Codes and Standards ........................................................................... 44 1 Acoustic Emission in ASTM Standards ............................................ 44
1.1 Standards Specific to Acoustic Emission Testing .......................... 44 1.3 Standards Closely Related/Relevant To Acoustic Emission .......... 44
3 Acoustic Emission in ASME Codes .................................................. 45 5 Regulatory Code Variances and Exemptions ................................... 45 7 Acoustic Emission Personnel Qualification and Certification ........... 45 9 Acoustic Emission Codes and Standards – Overseas ..................... 46
APPENDIX 6 Example Test Procedure ...................................................................... 47
1 Scope and Purpose .......................................................................... 48 2 Referenced Documents .................................................................... 48 3 Safety ................................................................................................ 48 4 Containership Sample and Monitoring Areas to be Examined ......... 48 5 Locations of Discontinuities Known from Previous Inspections ........ 49 6 Loading to be Applied ....................................................................... 49
6.1 General Description ....................................................................... 49 6.2 Concurrent Load Measurements ................................................... 49 6.3 Previous Loading History of the Monitoring Areas ......................... 49
7 Equipment to be Used ...................................................................... 51 8 Noise ................................................................................................. 51
8.1 Potential Sources ........................................................................... 51 8.2 Precautions to be Taken ................................................................ 51
9 Sensor Mounting Method, Configuration and Source Location Techniques to be Used ..................................................................... 52
10 System Settings ................................................................................ 52 10.1 General Settings ............................................................................ 52
11 System Performance Checks ........................................................... 53 12 Acoustic Emission Test Forms .......................................................... 53
13 Data Acquisition and Recording ....................................................... 55 13.1 Data Storage ................................................................................. 55 13.2 Setting Changes ............................................................................ 55 13.3 Noise Contingencies ...................................................................... 55
14 Data Interpretation and Evaluation ................................................... 56 14.1 Check Data Quality – Correlation between Stress and Acoustic
vi ABS GUIDANCE NOTES ON STRUCTURAL MONITORING USING ACOUSTIC EMISSIONS . 2016
TABLE 1 Sensor Performance Check Form .......................................... 53 TABLE 2 System Performance Check ................................................... 54 TABLE 3 Acoustic Emission Test Log – General Information ................ 54 TABLE 4 Acoustic Emission Test Log – Detail Information ................... 55 TABLE 5 Parametric Setup Table .......................................................... 55 FIGURE 1 Typical Design Focus Areas for Containerships ..................... 48 FIGURE 2 Selected Areas That May be Prone to Cracking ..................... 49 FIGURE 3 Arrangement of Strain Gauges for Hull Monitoring System .... 50 FIGURE 4 Sample Recordings of Strain at Port Main Deck
(Raw Data) .............................................................................. 50 FIGURE 5 Sample Recordings of Strain at Port Main Deck (Extreme
Value in 5 Minutes) ................................................................. 50 FIGURE 6 Layout of Acoustic Emission Sensors and Computers ........... 51 FIGURE 7 Correlation between Stress and Acoustic Emission ............... 56 FIGURE 8 Cross plot: Number of Acoustic Emission Hits versus
Amplitude ................................................................................ 57 FIGURE 9 Cross Plot: Energy and Amplitude versus Channels .............. 57 FIGURE 10 Cross Plot: Energy and Duration versus Amplitude ................ 58 FIGURE 11 Clusters in the Zonal Source Location .................................... 58
ABS GUIDANCE NOTES ON STRUCTURAL MONITORING USING ACOUSTIC EMISSIONS . 2016 vii
This Page Intentionally Left Blank
S e c t i o n 1 : I n t r o d u c t i o n
S E C T I O N 1 Introduction
1 General Ships and offshore oil and gas platforms continue to become larger, more complex, and optimized, requiring an in-depth knowledge of structural integrity. This knowledge includes technologies for structural health examination and monitoring. For example, the ABS Guide for Vessels Intended to Carry Compressed Natural Gases in Bulk allows for Acoustic Emission (AE) to be used to monitor shipboard gas cylinders for potential failure.
ABS has published the Guide for Hull Condition Monitoring Systems that covers hull monitoring systems used for motion monitoring, stress monitoring, and voyage data monitoring. Most current hull condition monitoring systems rely on strain gauges, accelerometers, wave radar, etc., which provide information about structural response (strain). However, these systems are generally not suitable for monitoring localized areas of the hull structure.
There are circumstances when a system monitors a local area for crack growth. This may include known problem areas which need to be monitored in case a crack reoccurs or a crack continues to grow, perhaps threatening structural integrity. In this regard, acoustic emission technology shows promise as a monitoring method in ship and offshore structures. Acoustic emission techniques have been applied successfully in other industries (bridge, dam, storage tank, aerospace, nuclear plant, etc.). For the marine/offshore industry, these techniques can also apply the following applications:
• Machinery
• Auxiliary equipment
• Pressure vessel
• Pipe system
• Mooring chain (potential application)
• Subsea structures (potential application)
Acoustic emissions are sounds associated with stress waves generated by cracks and flaws in structures. These sounds of stress are in the form of elastic waves generated by the rapid release of energy from sources within a material. These elastic waves are detected by electronic monitoring devices to reveal the activity of cracks and flaws and to point to their location. Two distinctive features of the method are:
i) It is the active growth of the cracks and flaws that produce Acoustic Emissions.
ii) An array of Acoustic Emission sensors can monitor a substantial area and localize flaw sources if the Acoustic Emission data is acquired and analyzed properly.
Because of these features, the method is very well suited for structural health monitoring, integrity management, and early warning of failure.
ABS GUIDANCE NOTES ON STRUCTURAL MONITORING USING ACOUSTIC EMISSIONS . 2016 1
Section 1 Introduction
Acoustic Emission Technology has the following benefits:
• It offers real time monitoring of crack propagation, corrosion activities, and cavitation erosion under the applied stress
• It detects the growth of defects in the material rather than the presence of a nonconformity
• It covers a range up to 4.75 m (15 ft) for most marine/offshore applications
• It can locate defects (acoustic emission source) by the triangulation method
• It has an accuracy of approximately 0.15 m (0.5 ft), subject to the complexity of the structure
• It is intrinsically safe and is able to monitor critical areas in hazardous zones
• Watertight Acoustic Emission equipment has been developed to monitor underwater and subsea structures
• It provides limited or no disturbance to operations
Acoustic Emission technology can be used for monitoring during the stages of:
• Welding process
• Initial proof test
• Requalification test
• In-service/monitoring
• Leak detection
3 Scope of These Guidance Notes The purpose of these Guidance Notes is to make available an ABS document that contains information related to the use of Acoustic Emission technology for monitoring the structural health of the hull or other structures. These Guidance Notes address:
• Acoustic Emission application in marine environment (Sections 1 through 7)
• Background of acoustic emission testing (Appendices 1 through 6)
Sections 1 through 7 briefly introduce the technology, outline the test process, and identify the roles and responsibilities of the several parties involved in staging an Acoustic Emission project. By outlining the test process, it material for checklists to the AE test team, Owner, and ABS with that he can use to perform his assigned oversight role. Appendices 1 through 6 gives more technical detail about the Acoustic Emission method for those who wish to understand it in greater depth.
Through the application of Acoustic Emission as a condition-monitoring technique, owners/managers/operators should be able to expect improved structural reliability onboard their vessels or other marine installations.
5 Information to be Submitted The following plans and information are to be submitted to ABS for review:
• Testing Plan, including structural plan and analysis appropriate to the purpose of the monitoring, locations of acoustic emission sensors, strain gauges and other sensors/meters
• A block diagram and description illustrating the operation of the system
• Details of the sensor accuracy, range, frequency response, and any Type Approvals of the sensors
• Procedure for installing the cables, sensors
• Procedure for testing the sensors and AET software
• Description of the method and capability of the data recording system
• The Operations Manual for the Acoustic Emission system
2 ABS GUIDANCE NOTES ON STRUCTURAL MONITORING USING ACOUSTIC EMISSIONS . 2016
Section 1 Introduction
Plans are generally to be submitted in triplicate (to the Owner, AE specialist team, and ABS). In some cases, ABS may request the submission of additional information when it is considered necessary to review particular features of Acoustic Emission system.
7 Alternatives ABS will consider arrangements which can be shown to be effective in meeting the overall standards of these Guidance Notes.
9 Terminology and Abbreviations The terms used in this technology are presented in this Section in an alphabetical order
Acoustic Emission: Elastic waves generated by the rapid release of energy from sources within a material.
Acoustic Emission (AE) Activation: The onset of Acoustic Emission due to the application of a stimulus such as force, pressure, heat, etc.
Acoustic Emission (AE) Activity: A measure of the emission quantity, usually in the cumulative energy count, event count, ringdown count, or the rates of change of these quantities.
Acoustic Emission (AE) Amplitude: The largest voltage peak in the Acoustic Emission signal waveform; customarily expressed in dBAE (decibels referred to 1 microvolt at the sensor output, before any amplification).
Acoustic Emission (AE) Channel: A single Acoustic Emission sensor and the related equipment components for transmitting, conditioning, detecting, and measuring the signals that come from it.
Acoustic Emission (AE) Detection: Recognition of the presence of a signal (typically accomplished by the signal crossing the detection threshold).
Acoustic Emission (AE) Event: A local material change giving rise to acoustic emission.
Acoustic Emission (AE) Hit: The detection and measurement of an Acoustic Emission signal on a channel.
Acoustic Emission (AE) Intensity: A measure of the level of the emission signals detected, such as the average amplitude, average Acoustic Emission energy, or average counts.
Acoustic Emission (AE) Sensor: A device containing a transducing element that converts Acoustic Emission wave motion into an electrical voltage.
Acoustic Emission (AE) Signal: The electrical signal coming from the transducing element and passing through subsequent signal conditioning equipment (e.g., amplifiers, frequency filters, etc.).
Acoustic Emission (AE) Signal Strength: The strength of the absolute value of a detected Acoustic Emission signal.
Amplitude Distribution: A display of the number of Acoustic Emission hits at (or greater than) a particular amplitude, plotted as a function of amplitude.
Attenuation: Loss of amplitude with distance as the wave travels through the test structure.
Burst Emission: A qualitative description of the discrete signal related to an individual emission event occurring within a material. These signals have clear beginnings and endings.
Calibration: Adjustment of a device to a standard and/or comparison to a known standard.
Continuous Emission: A qualitative description of the sustained signal level produced by rapidly occurring acoustic emission events.
Counts: The number of times the Acoustic Emission signal crosses the detection threshold. Also known as “ringdown counts” or “threshold crossing counts”.
Defect: A flaw whose aggregate size, shape, orientation, location, or properties do not meet specified acceptance criteria and is thus rejectable. (ASTM E 1316-07)
ABS GUIDANCE NOTES ON STRUCTURAL MONITORING USING ACOUSTIC EMISSIONS . 2016 3
Section 1 Introduction
Discontinuity: A lack of continuity or cohesion; an intentional or unintentional interruption in the physical structure of a material or component. (ASTM E 1316-07)
Duration: The time from an Acoustic Emission signal’s first threshold crossing to its last.
Evaluation: Determination of whether a relevant indication is cause to accept or to reject a material or component. (ASTM E 1316-07)
Extraneous Noise: Non-relevant indications; signals produced by causes other than Acoustic Emission, or by Acoustic Emission sources that are not relevant to the purpose of the test.
False Indication: An NDT indication that is interpreted to be caused by a condition other than a discontinuity or imperfection. (ASTM E 1316-07)
Felicity Effect: (Breakdown of the Kaiser effect) The presence of Acoustic Emission at stress levels below the maximum previously experienced.
Flaw: An imperfection or discontinuity that may be detectable by nondestructive testing and is not necessarily rejectable. (ASTM E 1316-07)
Guard Sensors: Sensors whose primary function is the elimination of extraneous noise based on arrival time differences.
Indication: The response or evidence from a nondestructive examination. (ASTM E 1316-07).
Interpretation: The determination of whether indications are relevant, non-relevant or false. (ASTM E 1316-07).
Kaiser Effect: The absence of detectable Acoustic Emission at a fixed sensitivity level, until previously applied stress levels are exceeded.
Nondestructive Testing (NDT): The development and application of technical methods to examine materials or components in ways that do not impair future usefulness and serviceability in order to detect, locate, measure, and evaluate flaws; to assess integrity, properties, and composition; and to measure geometrical characteristics.
Non-relevant Indication: An NDT indication that is caused by a condition or type of discontinuity that is not rejectable. False indications are non-relevant. (ASTM E 1316-07).
Parametric Inputs: Environmental variables (e.g., load, pressure, temperature, etc.) that can be measured and stored as part of the Acoustic Emission hit description.
Pencil Lead Break (PLB): A technique in which a mechanical pencil (typically 0.3 mm or 0.5 mm, 2H lead) is used to simulate an Acoustic Emission source for purposes of performance check, wave propagation measurements, or velocity estimates.
Performance Check: Confirmation that a device, instrument or installed system functions to a specified standard(s).
Relevant Indication: An NDT indication that is caused by a condition or type of discontinuity that requires evaluation (ASTM E 1316-07).
Risetime: The time from an Acoustic Emission (AE) signal’s first threshold crossing to its peak.
Signal Features: Measurable characteristics of the Acoustic Emission signal, such as amplitude, Acoustic Emission energy, duration, counts, rise time, etc., that can be stored as part of the Acoustic Emission hit description.
Source Location: Relating to the use of multiple Acoustic Emission sensors for determining the relative positions of the Acoustic Emission sources.
Zone Radius: The maximum distance a Pencil Lead Break (PLB) is detected by instrumentation.
4 ABS GUIDANCE NOTES ON STRUCTURAL MONITORING USING ACOUSTIC EMISSIONS . 2016
Sect ion 2 : App l i ca t ion o f Acous t i c Emiss ion i n the Mar ine and Of fshore Indus t ry
S E C T I O N 2 Application of Acoustic Emission in the Marine and Offshore Industry
1 General Acoustic Emission testing is a nondestructive testing method that has successfully been applied in the petrochemical industry since the early 1980s with several well-proven codes and standards. In the shipping industry this NDT method has been applied successfully in oil tankers and containerships. As with any NDE method, it is important to create a uniform technique that has been tried and proven. These Guidance Notes establish a repeatable and reliable technique for the early detection of structural flaws in critical areas, which include fatigue critical structural details, non-redundant structural elements, and any important structure that is not ordinarily available for close-up visual inspection. Also, Acoustic Emission Testing can monitor a known fault while awaiting repair. This would provide the vessel owner with a planning tool to arrange the drydocking and repairs, thus reducing the risk of sea damage to the cargo and/or loss of cargo.
3 Test Modes and Overall Process Acoustic Emission can be applied in either of two test modes:
• Periodic Inspection. Data is taken on specific occasions or under specific conditions (for example, a specific voyage or a specific port loading process). Typically, there would be several years between successive inspections. This can be considered as part of the vessel’s NDT program.
• Continuous Monitoring. Equipment is installed on a permanent or semi-permanent basis and the critical area is monitored for an extended length of time. The equipment is in data gathering mode during a substantial part of the normal duty cycle. This mode can be considered as part of a structural health monitoring program.
The overall process for the Acoustic Emission test is shown in Section 2, Figures 1 and 2, for periodic inspection and continuous monitoring, respectively. The individual steps are discussed in later sections, as indicated.
5 Equipment and System Acoustic Emission equipment comes in three physical forms:
• Wired Acoustic Emission System. Traditional equipment has sensors with their preamplifiers at the monitoring area, with cabling from each individual sensor to an input connector on the main instrument at a central location. Cables can be long (hundreds of feet). Installing the cabling can be a substantial and physically arduous part of the work involved in the test, especially on structures such as ships where access to the test area is not always easy.
• Wireless Acoustic Emission System. In recent years, wireless components have been introduced into Acoustic Emission system architecture with the goal of reducing the effort and cost involved in handling cables during Acoustic Emission field tests. Wireless technology can be used in several ways, and Acoustic Emission system architecture is evolving to take advantage of this. Wireless technology has its limitations, but clear advantages are already being realized in practical testing through ongoing technical developments and the buildup of operating experience. Some wireless systems transmit the same data that would be transmitted by a full-featured wired system. Others are lower-cost systems designed to transmit only limited types of data.
ABS GUIDANCE NOTES ON STRUCTURAL MONITORING USING ACOUSTIC EMISSIONS . 2016 5
Section 2 Application of Acoustic Emission in the Marine and Offshore Industry
• Portable Acoustic Emission System. Small hand-held, battery-operated Acoustic Emission systems are also available. Typically, these have only two channels and are used by an operator working close to the sensor. They can therefore be very convenient for tasks such as noise surveys, attenuation measurements, or checks on sensor coupling and mounting.
FIGURE 1 Periodic Inspection
Using AET
FIGURE 2 Continuous Monitoring
Using AET
Plan the Test(Section 3)
Install Equipment(Section 4)
Collect AE Data(Section 5)
Analyze AE Data(Section 5)
Take DownEquipment
Create Test Report(Section 6)
Follow-up Inspection(Section 7)
Plan the Test(Section 3)
Install Equipment(Section 4)
Collect AE Data(Section 5)
Analyze AE Data(Section 5)
Interim Test Report(Section 6)
Follow Up Inspection(Section 7)
Take DownEquipment
Final Report(Section 6)
Follow-up Inspection(Section 7)
6 ABS GUIDANCE NOTES ON STRUCTURAL MONITORING USING ACOUSTIC EMISSIONS . 2016
Section 2 Application of Acoustic Emission in the Marine and Offshore Industry
7 Roles of Owner/Operator, Acoustic Emission Test Team and Classification Society (CS) Acoustic Emission testing requires cooperation between several parties. The level of interaction is deeper than that required for typical NDT activities. The Acoustic Emission test does not disclose the size and shape of discontinuities; it goes directly to the material’s response to stress and thus to structural integrity. For this reason, the Acoustic Emission test team needs to include not only Acoustic Emission specialists, but also a naval architect who is familiar with the history, design, and operation of the specific vessel and can focus the Acoustic Emission examination on the most pertinent parts of the vessel.
If the test involves strain gauges, the Acoustic Emission test team must also include personnel who are competent to install and check them.
The follow-up inspection is conducted by inspectors skilled in other NDT methods, either made available by the Acoustic Emission test team, or contracted separately by the vessel owner.
The distinct roles of the main parties to the project are as follows.
i) The role of the vessel’s owner/operator is to:
• Provide information to the Acoustic Emission test team (naval architect and Acoustic Emission specialists) about the structural conditions, history, operation, and design of the vessel
• Approve logistical aspects of the test plan
ii) The role of the Acoustic Emission specialists is to:
• Prepare the plan of Acoustic Emission testing or monitoring
• Conduct the test following these Guidance Notes and recognized Acoustic Emission standards
• Analyze the test results, prepare the test report, and make recommendations based on the test results
iii) The role of the naval architect is to:
• Advise on the monitoring area
• Approve the test plan
• Participate in the formulation of follow-up plans and in the assessment of the significance of Acoustic Emission sources after they have been followed up with other NDT methods
iv) The role of the classification society (CS) is to:
• Witness tests and check the test procedure to the satisfaction of the attending ABS Surveyor
• Review test report to the satisfaction of the attending ABS Surveyor
These responsibilities and roles are summarized in Section 2, Figure 3.
FIGURE 3 Acoustic Emission Testing: Lead Responsibilities and Roles
ABS GUIDANCE NOTES ON STRUCTURAL MONITORING USING ACOUSTIC EMISSIONS . 2016 7
Section 2 Application of Acoustic Emission in the Marine and Offshore Industry
9 Qualification of Acoustic Emission Testing Personnel The attending ABS Surveyor is to be satisfied that personnel responsible for conducting Acoustic Emission tests are thoroughly familiar with the equipment being used and that the technique and equipment used are suitable for the intended application. Acoustic Emission specialists are to be qualified by training and experience and certified to perform the necessary calibrations and tests and to interpret and evaluate indications in accordance with the terms of the specification. Personnel certified in accordance with the International Standard ISO 18436, Requirements for Training and Certification of Personnel, shall be classified in any one of the following three levels. Personnel who have not attained certification may be classified as trainees.
The requirements of other recognized international/national certifying programs (e.g., ASNT CP-189, SNT-TC-1A, etc.) will be specially considered.
9.1 AET Trainee A trainee is an individual who works under the supervision of certified personnel but who does not conduct any tests independently, does not interpret test results, and does not write reports on test results. This individual may be registered as being in the process of gaining appropriate experience to establish eligibility for qualification to Level 1 or for direct access to Level 2.
9.3 AET Level 1 An individual certified to AET Level 1 may be authorized to:
i) Apply a specified Acoustic Emission measurement procedure
ii) Set up and verify operation of equipment for basic Acoustic Emission data collection
iii) Verify the integrity of collected data and prevent or control poor data
iv) Perform basic Acoustic Emission analysis
v) Record and categorize the results in terms of written criteria
vi) Maintain a database of results or trends
vii) Evaluate and report test results in accordance with instructions, and highlight areas for further investigation
An individual certified to Level 1 is not to be responsible for the choice of the test method or technique to be used.
9.5 AET Level 2 An individual certified to AET Level 2 may be authorized to perform and direct Acoustic Emission testing in accordance with established or recognized procedures. This may include:
i) Select the appropriate Acoustic Emission technique
ii) Define the limitations of the application
iii) Specify the appropriate hardware and software for both portable and permanently installed systems
iv) Set up and verify equipment settings
v) Measure and perform diagnosis of Acoustic Emission signals
vi) Measure, interpret, and analyze Acoustic Emission data
vii) Recommend appropriate corrective actions
viii) Verify the calibration of Acoustic Emission measurement systems
ix) Prepare reports on testing results
x) Provide instruction, supervision, and technical direction to AET Level 1
8 ABS GUIDANCE NOTES ON STRUCTURAL MONITORING USING ACOUSTIC EMISSIONS . 2016
Section 2 Application of Acoustic Emission in the Marine and Offshore Industry
9.7 AET Level 3 An individual certified to AET Level 3 may be authorized to direct any operation in the Acoustic Emission testing, including:
i) Applying Acoustic Emission theory and techniques, including measurement and interpretation of survey results
ii) Understanding and performing data analysis, including limitations
iii) Determining the Acoustic Emission signature of systems and component assemblies
iv) Usage of non-standard techniques for Acoustic Emission and fault diagnosis
v) Recommending all generally recognized types of corrective actions
vi) Supervising and providing guidance to AET Levels 1 and 2
vii) Interpreting and evaluating Standards, Codes, specifications, and procedures
viii) Establishing Acoustic Emission programs including determination of the requirement for periodic/ continuous monitoring, frequency of testing, etc.
ix) Establishing acceptance and severity criteria
x) Preparing reports on test results
11 AET Procedures and Techniques Procedures and techniques shall be established and approved by personnel certified to AET Level 3. Techniques shall be prepared in accordance with the requirements stated in these Guidance Notes.
Acoustic Emission Testing (AET) shall be performed by certified AET Level 1, 2, or 3 personnel. Initial interpretation and evaluation of testing results can be performed by personnel certified to AET Level 2. However, final interpretation and evaluation of testing results is to be performed by personnel certified to AET Level 3.
ABS GUIDANCE NOTES ON STRUCTURAL MONITORING USING ACOUSTIC EMISSIONS . 2016 9
S e c t i o n 3 : P l a n n i n g
S E C T I O N 3 Planning
1 Responsibilities and Task Planning Test planning is critical to the success of the Acoustic Emission test. Planning normally starts several months before the test. The planning effort required depends largely on how familiar the vessel owner is with Acoustic Emission testing. Since the test requires installation of monitoring equipment, it requires much more planning than, for example, a simple visual inspection.
Use of the Task Planning Table (Section 3, Table 1) is recommended to aid cost-effective planning and implementation of an Acoustic Emission test or monitoring program. This table indicates the typical levels of engagement of the four involved parties (owner/operator, naval architect, Acoustic Emission specialists and classification society) in 16 detailed tasks of the project process.
Some of the tasks indicated in the table may be assigned differently in practice. For example, the table suggests that the naval architect (being an expert in stress) would be responsible for the hands-on strain gauge work, but this task might equally well be undertaken by the Acoustic Emission specialists if they were properly trained and qualified for that task.
3 Development, Approvals, and Use of the Test Procedure For each project, a written test procedure should be developed with clearly stated revision numbers and dates, and should eventually be issued with suitable review and approval signatures. The review and approval process are decided upon within the authoring organization, having regard also to the needs of its clients/customers, regulatory bodies, etc. Some local process should be in place to verify that the procedure is prepared by suitably qualified individuals and supported by sufficient administrative/management authority.
The possibility of further revision may be allowed for in the procedure itself.
A well-thought-out and well-integrated document should lead to a successful test outcome, or failing that, at least to a solid learning process and ongoing improvement. For these benefits to be realized, it is important that the test procedure be followed. However, a test procedure is all too easily undermined by a careless inspection team or by an overriding management driven by considerations other than the technical success of this test. If these things happen, the chances of test success are much reduced.
Detailed guidance on the technical content of the test procedure is offered in Appendix 2.
5 Acceptance Standards of Planning It is incumbent upon the Engineer to be satisfied that AET personnel (AET Level 3) are qualified and certified to create the Acoustic Emission testing plan. A typical planning, shown in Section 3, Table 1, is considered acceptable.
10 ABS GUIDANCE NOTES ON STRUCTURAL MONITORING USING ACOUSTIC EMISSIONS . 2016
Section 3 Planning
TABLE 1 Task Planning Table
Item Action Owner/ Operator
AE Test Team CS † Naval
Architect AE
Specialists ADMINISTRATIVE
1 Selection of a suitably qualified project team *** *** *** * 2 Detailed work plan preparation and approval * *** *** * 3 Communication and training with the vessel’s crew *** *** *
PLANNING – (1) STRUCTURE 4 Study of structural history and loads and resultant stresses *** *** ** 5 Selection of critical areas for monitoring *** *** **
PLANNING – (2) AE SYSTEM & EQUIPMENT 6 Selection of AE equipment *** 7 Selection of onboard locations for the AE system and displays *** ***
PLANNING – (3) SENSORS 8 Visual inspection and access to the AE sensor and strain gauge sites ** *** *** * 9 Selection of AE and strain gauge sites *** ***
11 Software selection and customization if needed (including integration of strain gauge data) * ***
12 Communications: satellite, data download options * *** 13 Set-up of warning levels and definition of responses * ***
EXECUTION AND REPORTING 14 Installation, system checks, commissioning * *** ** 15 Review of system checks *** * 16 Collection and evaluation of AE data ** *** 17 Reporting *** *** *** ***
† CS = Classification Society
*** Fully anticipate test procedure (plan and perform)
** Partially anticipate test procedure (review and evaluate)
* Monitor test procedure (witness and approve)
ABS GUIDANCE NOTES ON STRUCTURAL MONITORING USING ACOUSTIC EMISSIONS . 2016 11
S e c t i o n 4 : I n s t a l l a t i o n a n d C h e c k s
S E C T I O N 4 Installation and Checks
1 General This Section is used by the Surveyor as a checklist for witnessing the test. Acoustic Emission specialists should also be aware of these checklists.
3 Installation of Sensors and Equipment Consideration is to be given to:
5 Systems Checks The Acoustic Emission specialists establish initial setups and install as follows:
• Acoustic Emission sensors positions/spacing compatible with attenuation measurements
• Preamplifiers of Acoustic Emission sensors with band pass filters suppressing or removing unwanted noise
• Acoustic Emission equipment sensitivity, bandwidth, timing parameters, front end filters, parametrics multipliers, waveform parameters (sampling rate/pre-trigger/duration), etc., compatible with test procedure
• Computer layout files compatible with test procedure
• Strain gauges
• Other equipment (accelerometers, other available parametrics) calibrated and working
Performance checks on Acoustic Emission channels are made during and/or after the initial setup and installation:
• Pencil Break Test (PLB) for Acoustic Emission sensor coupling/mounting (during or after installation). The example test procedure given in Subsection A6/11 has extensive details on the PLB test.
• AST (Automatic Sensor Test) and/or Punch Test (promptly after installation and then from time to time during the rest of the project)
12 ABS GUIDANCE NOTES ON STRUCTURAL MONITORING USING ACOUSTIC EMISSIONS . 2016
Section 4 Installation and Checks
7 Acceptance Standards of Installation and System Checks It is incumbent upon the Surveyor to be satisfied that AET personnel (AET Levels 1, 2 and 3) are qualified and certified to perform the installation of sensors, wires, the Acoustic Emission system and system checks. The typical works of installation and system check, shown in Appendices 2 and 4, are considered acceptable.
In general, all electrical systems and components and electrical installations in watertight, tank boundary, and hazardous areas are to comply with Section 4-8-4 of the ABS Rules for Building and Classing Steel Vessels (Steel Vessel Rules), Section 4-3-3 of the ABS Rules for Building and Classing Mobile Offshore Drilling Units (MODU Rules), or other applicable ABS Rules or Guides.
The surveys for installation of acoustic emission testing system are to be in accordance with the applicable requirements as contained in the ABS Rules for Survey After Construction (Part 7), Part 7 of the MODU Rules, or other applicable ABS Rules or Guides.
ABS GUIDANCE NOTES ON STRUCTURAL MONITORING USING ACOUSTIC EMISSIONS . 2016 13
S e c t i o n 5 : D a t a A c q u i s i t i o n a n d A n a l y s i s
S E C T I O N 5 Data Acquisition and Analysis
1 General This Section summarizes the nature of the data collected and the analysis performed. Further details are shown in Appendix 3.
3 Data from Vessel Owner/Operator The following data regarding the voyage is needed:
• Vessel operations
• Route and sea environment
• Ship motions
Further details are shown in A3/1.1.
5 Data from Sensors Sensor types include Acoustic Emission, vibration, strain gauge and others.
• System is set to facilitate transfer and storage of data.
• Acoustic Emission graphs are shown on computer screen real-time, in addition to data being stored.
• A data log is kept, typically on a Word file on the system computer. The log entries include date and time, writer, and transcribed information and/or commentary.
Further details are shown in A3/1.3.
7 Hull Structure Stress Analysis Hull structure stress is to be collected and presented for study and correlation to Acoustic Emission signal strength. The total stress shows the total of the static (cargo and ballast-induced) and dynamic (wave-induced) stresses. The stress analysis covers:
• Loading/Unloading condition
• Sea state
• Strain information
• Statistics of Acoustic Emission signal strength
14 ABS GUIDANCE NOTES ON STRUCTURAL MONITORING USING ACOUSTIC EMISSIONS . 2016
Section 5 Data Acquisition and Analysis
9 Analysis of Acoustic Emission Signals The normal process of Acoustic Emission data analysis, including its integration with follow-up inspection, is shown in Section 5, Figure 1 below. The process involves graphing and filtering techniques that are discussed at greater length in Appendix 3.
Key steps of the analysis are:
• Correlating the resultant stress with the Acoustic Emission as an aid to distinguishing genuine Acoustic Emission from noise
• Categorizing the Acoustic Emission through its intensity relative to the potential flaw areas, as a lead to follow-up inspection.
FIGURE 1 Procedure for Data Analysis
Assemble AE data
Check AE data quality
- Correlation between stress and AE
- Signature recognition
Filter the noise
Identify high AE activity
Find source locations
Recommendations
AE − amplitude, energy, etc.
Stress − strain, stress, wave direction, waveheight, cargo loading, etc.
AE signal wave form or frequency features(frequnecy controid, etc.)
Used figure − energy vs. amplitude vs. hits, etc.
Filter factors − rise time, amplitude, energy, duration, etc.
Graphic filter - strain, etc.
Indentification of high amplitude and high energy hitsduring high strain period on each cluster
Usage of figures − Amplitude vs. time and energy vs. time
− Energy vs. amplitude vs. hits
Usage of quantitative data − energy, hits, ... ...etc.
Report
Planar (2D) or LInear (1D)
Cluster analysis for 2D source locations
Merging of continued data file, time order,test log, etc.
Length of merging data file decided by a voyage orfixed calendar time (weekly or monthly)
11 Warning Levels Warning level settings are to be submitted for approval along with the criteria used in determining settings.
ABS GUIDANCE NOTES ON STRUCTURAL MONITORING USING ACOUSTIC EMISSIONS . 2016 15
S e c t i o n 6 : R e p o r t i n g D o c u m e n t a t i o n
S E C T I O N 6 Reporting Documentation
1 Acoustic Emission Test Report The Acoustic Emission test report distributed by the testing company to the naval architect, vessel owner and classification society should contain the following information and references:
• Name, age and identification of the vessel being tested
• Detail work plan
• Date and time of testing
• Testing personnel (including certificates) and testing company
• Location of test
• Procedure used
• Type and make of equipment used, number of sensors and type
• Date of last equipment calibration
• Locations and areas monitored
• Sources of stresses
• Parametric input (strain gauges, etc.)
• Data test logs, file names listing
• Conditions during the test
• Signature analysis method used
• Results of the test
• Follow-up inspection recommendations
A sample “TABLE OF CONTENTS” of report is shown as follows and described below:
TABLE OF CONTENTS 1. Scope and Purpose
2. Referenced Documents
3. Safety
4. Containership Sample, and Inspection Areas to be Examined
5. Locations of Discontinuities Known from Previous Inspections
6. Loading to be Applied
7. Equipment to be Used: (Type, Number of Acoustic Emission channels, Other measurements such as load transducers, strain gauges, etc.)
8. Noise: (Potential sources of background noise; specific measurements, precautions and discrimination techniques to be applied before and during data acquisition)
16 ABS GUIDANCE NOTES ON STRUCTURAL MONITORING USING ACOUSTIC EMISSIONS . 2016
Section 6 Reporting Documentation
9. Sensor Mounting Method, Configuration, and Source Location Techniques to be Used
10. System Settings (both system performance checks and main data acquisition)
11. System Performance Checks
12. Acoustic Emission Test Forms
13. Data Acquisition and Recording (including data storage, setting changes, noise contingencies, etc.)
14. Data Interpretation and Evaluation
15. Reporting
16. Verification of Acoustic Emission Results during Inspection
3 Acceptance Standards of Report It is incumbent upon the Surveyor and Engineer to be satisfied that AET personnel (AET Level 3) is qualified to create a report. This Acoustic Emission testing report is filed for record which confirms the health of structure/ equipment and is to be to the satisfaction of the attending ABS Surveyor. The typical report contents, shown in Subsection 6/1, are considered acceptable.
All non-conforming Acoustic Emission activity indications are to be brought to the attention of the Surveyor. In addition to the Acoustic Emission test, the Surveyor may, at his/her discretion, require follow-up supplementary nondestructive testing, such as ultrasonic inspection, to verify the adequacy of the health of structure/equipment.
ABS GUIDANCE NOTES ON STRUCTURAL MONITORING USING ACOUSTIC EMISSIONS . 2016 17
S e c t i o n 7 : F o l l o w - u p I n s p e c t i o n
S E C T I O N 7 Follow-up Inspection
In addition to the Acoustic Emission testing, a confirmatory nondestructive testing is required with the Surveyor’s discretion to verify the adequacy of the health of structure/equipment. These NDT methods include, but are not limited to, the following methods.
• Close visual inspection
• Liquid penetrant inspection
• Magnetic particle inspection
• Ultrasonic inspection
• Other approved methods
The non-confirming Acoustic Emission activity indications should be noted in the report and the future inspection plan.
18 ABS GUIDANCE NOTES ON STRUCTURAL MONITORING USING ACOUSTIC EMISSIONS . 2016
ABS GUIDANCE NOTES ON STRUCTURAL MONITORING USING ACOUSTIC EMISSIONS . 2016 19
A p p e n d i x 1 : A n I n t r o d u c t i o n t o A c o u s t i c E m i s s i o n
A P P E N D I X 1 An Introduction to Acoustic Emission
The Acoustic Emission process is depicted in Appendix 1, Figure 1. It begins with forces acting on a body that result in changes in the stress field and localized deformation(s) at defect sites and microstructural imperfections. These localized deformations produce Acoustic Emissions, elastic waves that travel outward from the source, echoing through the body until they arrive at a remote sensor. The elastic waves manifest themselves as in-plane and out-of-plane displacements that cause the sensor to produce an electrical signal, which is passed to electronic equipment for further processing.
FIGURE 1 Schematic of the Acoustic Emission Process
Electronics
Sensor
Stimulus(Force)
Source Wave Propagation
Signal
Stimulus(Force)
1 Acoustic Emission Sources As mentioned above, the Acoustic Emission process begins with stress. Stress is a familiar concept to the engineer and the naval architect. Stress is like an internal force field in the vessel that transmits and balances the forces imposed by cargo, wind and wave. Depending on its directional properties, stress is described as tensile or compressive, bending, shear or torsional. Stress is measured in pounds per square inch or psi. To calculate tensile stress, the force (pounds) is divided by the area that carries it (square inches).
Stress can be imagined as a three-dimensional field having different components in different directions at each point on the structure. In response to stress, the material of the vessel, platform, or other structure changes slightly in shape. This change in shape is called “strain”. The material deforms elastically, and if the stress is high enough, plastically as well. “Plastic” in this context means “permanent”. Plastic deformation involves a permanent change in the relative positions of the atoms in the material.
On a small scale, plastic deformation involves the sliding of atomic planes over one another through the agency of atomic-scale irregularities known as dislocations. The movement of dislocations is the microscopic mechanism that underlies the gross changes in shape that we recognize as yielding, buckling, denting, etc. Acoustic Emission from the movement of dislocations has been extensively studied with special laboratory techniques.
Appendix 1 An Introduction to Acoustic Emission
Other kinds of permanent deformation take place when materials break and new surfaces are created. On a microscopic scale inside a piece of steel, the materials most likely to break are specks of sulfide, oxide, carbide and other nonmetallic materials. The smallest of these items are the carbide “precipitates” scattered within the metal grains, microscopic plates of iron carbide only a few hundred atoms thick distributed in “pearlite colonies”. These precipitates play a big part in governing the steel’s mechanical properties. On a larger scale, there are nonmetallic “inclusions” lying between the metal grains, manganese sulfide “stringers” formed during the rolling of the steel plate and slag inclusions introduced during welding. There may also be nonmetallic corrosion products intimately connected to the metal surface. All these nonmetallic components are less ductile than the metallic matrices in which they are embedded, so they break more easily when the metal is strained. The breaking of these nonmetallic components is the main source of the Acoustic Emission observed when crack-free metals are deformed.
When the metal is cracked, a different kind of Acoustic Emission source is created, and this one is the most important for nondestructive testing. A crack jumping forward with the sudden creation of a new surface is a major threat to the structure’s integrity and is also the best-recognized source of high-amplitude Acoustic Emission. Detection of emission from growing cracks has been the most common single goal in the many applications of Acoustic Emission technology.
When a surface-breaking crack grows, the whole structure opens up a little in response to the applied forces. This is a more far-reaching process than, say, the breaking of an inclusion which would tend to have only a local effect. Therefore, cracks tend to give larger-amplitude signals that are more readily detectable.
As well as giving large-amplitude Acoustic Emission waves as they jump forward, cracks produce small-amplitude Acoustic Emission waves from material deformation at the crack tip. Emission can also be produced from the rubbing of crack surfaces as they open and close and grind in response to changing seas. This emission can be enhanced by corrosion products forming on the crack surfaces, which make cracks even more emissive.
When material deforms in response to changing forces, the deformation tends to relieve and smooth out the local stresses. This means that after an Acoustic Emission event has taken place, the elastic energy stored in the stress field has been reduced and released. The energy released from the stress field is used to create new surfaces, to deform and warm the material, and to produce the Acoustic Emission. In other words, the source of the Acoustic Emission energy is the energy in the elastic stress field produced by the action of cargo, wind, and waves on the vessel.
Acoustic Emission is produced at the source as a short pulse of elastic and kinetic energy that travels through the material as an elastic wave. The theory of frequency spectra says that being a short impulse, it carries energy at all frequencies from zero up to some high upper limit, on the order of 1000 kHz. High sensitivity is most easily achieved by using contact sensors in the upper part of this frequency range, between 100 kHz and 500 kHz.
The same emissions can also detected, if they are large enough, by the human ear which responds to much lower frequencies, from 50 Hz to 15 kHz. This confirms the concept that the energy of Acoustic Emissions is spread over a very wide frequency range. The theory that Acoustic Emission carries frequencies all the way down to zero is evidenced by the largest Acoustic Emissions of all, earthquakes, which shake people and buildings a hundred miles away at frequencies of a few Hz and less. Finally, the zero-frequency component itself is identical to the permanent change in the stress field created by the action of the source event.
The amount of Acoustic Emission energy released and the amplitude of the resulting wave depend on the size and the speed of the source event. A big crack jump produces a larger signal than a small crack jump; the theory is that emission amplitude is proportional to the area of new surface created. A sudden, discrete crack jump will give much more signal than a slow, creeping advance of the crack tip over the same distance. The theory is that emission amplitude is proportional to the crack velocity.
The association between Acoustic Emission and crack growth has been intensively studied. Processes involving some form of embrittlement, such as hydrogen-induced cracking and stress corrosion cracking, are generally among the better emitters. Ductile processes such as slow fibrous fracture are generally quieter. Weldments are more emissive than parent metal.
20 ABS GUIDANCE NOTES ON STRUCTURAL MONITORING USING ACOUSTIC EMISSIONS . 2016
Appendix 1 An Introduction to Acoustic Emission
It is useful to distinguish different classes of source activity:
• Primary activity from new, permanent changes in the originally fabricated material. This is typically due to local stresses higher than the material has seen before.
• Secondary activity from materials which were not part of the original fabrication, such as corrosion products.
• Secondary activity from repetitive processes such as crack surface rubbing (friction) that do not produce new, permanent changes in the material.
Secondary activity can be either helpful or a nuisance, depending on the way it is treated. Secondary emission is different from “noise”, which is always a nuisance.
“Noise” in Acoustic Emission testing means any unwanted signal. Noise is a major topic in Acoustic Emission technology. The chief types of acoustic noise sources are friction and impact, which can come from many environmental causes. Frictional sources are stimulated by wind and wave loads which cause movement at movable connectors and loose bolts. Impact sources include rain and flying objects.
An indispensable part of Acoustic Emission test technique is the ability to eliminate all these noise sources and to focus on what is relevant. Noise is addressed in three ways:
i) By selecting an appropriate test strategy and instrumentation setup
ii) By taking practical precautions on site to prevent noise sources as far as possible
iii) By recognizing and removing noise indications from the recorded data. This last process is the domain of data interpretation.
3 Structural Loading and Acoustic Emission Source Activity Materials emit at places where the local stress is high enough to cause fresh, permanent deformation. This often happens at stress concentrations, places where the stress is raised by local geometry. Stress concentrations exist at weld details, changes in section, and structural discontinuities in general. They also exist around cracks and flaws. The stress concentrations at weld details are the reason why fatigue cracks initiate at these locations.
When a material deforms and emits, the deformation tends to relieve the high local stresses. The load is often transferred onto some other parts of the structure. This has a stabilizing effect. If the structure is unloaded and then reloaded to the same level, the regions that deformed the first time tend to be stable the second time. Thus, the emission sources tend not to re-emit the second time around, unless the load exceeds the previous maximum.
When a material is loaded (stressed), it changes shape. It stretches, compresses, or shears. The technical term for this change in shape is “strain”. The strain has an elastic, reversible component and also (if the load is high enough) a plastic, permanent component.
The elastic component of the strain occurs immediately when the load is applied. The stress/strain field inside the material is quickly redistributed such that all the forces are balanced. This redistribution takes place at the speed of sound through the propagation of elastic waves. This is why a body vibrates if a shock force is suddenly applied.
Unlike the elastic component, the plastic component of the strain often takes considerable time to develop. Some of the deformation is immediate, but some of it is delayed. Steel is not usually thought of in this way, but delayed deformation of non-metallic materials is quite familiar. Given enough time, plastics creep and stretch, and wooden beams sag. Steel shows only a trace of this kind of behavior, but Acoustic Emission is a very sensitive indicator and reveals time-dependent behavior that would otherwise go unnoticed.
This is illustrated in Appendix 1, Figure 2, which shows the characteristic behavior pattern of a newly fabricated component. In this figure, load and Acoustic Emission are both plotted against time. The load is raised and held, then raised and held again. Acoustic Emission is generated during both load rises. During the first load hold, there is no emission, but during the second load hold, the stress is higher. The emission continues for some time into the second hold period, and then eventually the component stabilizes.
ABS GUIDANCE NOTES ON STRUCTURAL MONITORING USING ACOUSTIC EMISSIONS . 2016 21
Appendix 1 An Introduction to Acoustic Emission
FIGURE 2 Emission Instability
Time
Load
Cum
ulat
ive
Aco
ustic
Em
issi
on
Emission that continues during load holds is likely to indicate structurally significant defects. Many test procedures place particular emphasis on emission during load holds. Emission that occurs during a rising load on previously unloaded structures is less easy to interpret. It may come from defects, but good material will also emit during rising load the first time it is loaded. The interpretation of emission during load holds is more clear-cut.
Another characteristic of structurally significant defects is that they tend to emit on a second loading. If a second loading is carefully monitored, one often sees a little emission before the previous maximum load; not nearly as much as the first time, but not zero either. This emission can be an important indicator of structural instability.
This is illustrated in Appendix 1, Figure 3. Here, emission is plotted directly against load. In this scenario, the load is raised, lowered, raised again to a higher level, lowered, and finally raised to a higher level still. Emission is generated during the first load rise (AB), but as the load is lowered (BC) and raised again (CB), there is no more emission until the previous load maximum is exceeded. Emission continues as the load is raised further (BD), and stops as the load is lowered for the second time (DE). On raising the load for the last time, a different emission pattern is observed. The emission starts up before the previous maximum load is attained (F). Emission continues as the load is increased (FG).
The behavior observed at point B (no emission until previous maximum load is exceeded) is known as the Kaiser Effect. The behavior observed at point F (emission at a load below the previous maximum) is known as the Felicity Effect. Insignificant flaws tend to show the Kaiser Effect while structurally significant flaws tend to show the Felicity Effect. The Felicity Effect is usually characterized by the Felicity Ratio, which is equal to the load located at F divided by the load at D for this case. For unflawed material, the Felicity Ratio (FR) is equal to 1.
22 ABS GUIDANCE NOTES ON STRUCTURAL MONITORING USING ACOUSTIC EMISSIONS . 2016
Appendix 1 An Introduction to Acoustic Emission
FIGURE 3 Emission on Repeated Loading
Load
AE E
vent
s or
Cou
nts
Kaiser Effect
Felicity Effect
BC
DE F
G
A
For Acoustic Emission monitoring of marine structures, the main interest is structural fatigue. The emission behavior of growing fatigue cracks has been extensively studied. Classic laboratory data has studied both the crack length and the accumulated total of the emission detected. The emission began with crack initiation and then tracked rather closely with the growth of the crack, increasing rapidly as the crack propagated faster and faster towards failure.
The primary emission from growing fatigue cracks can come from two sources. First, there are emissive particles, typically non-metallic inclusions, in the stress-concentrated region near the crack tip. As the crack advances towards these particles, the local stress on them rises, and their fracturing produces primary emission. The other source is the movement of the crack tip itself. Crack tip movement is typically taking place in a mixed mode. Some of the new surface is created by dislocation activity and some of it is created by small-scale cleavage, a sudden separation of the material in a region of local weakness and/or exceptionally high stress. Crack tip movement by dislocation activity is typically not detectable, but cleavage is an abrupt and relatively gross mechanism that produces plenty of Acoustic Emission energy in the normally detectable range.
Secondary activity from crack face friction is also often observed in Acoustic Emission monitoring of fatigue cracks. In constant-cycle fatigue, this activity often produces just the same signal, cycle after cycle, at intermediate load levels. This secondary emission may continue for hundreds or thousands of cycles, then die out only to start again later in the test. The best explanation is that it is produced by rubbing at rough spots or “asperities” on the crack surface, as indicated in Appendix 1, Figure 4. It has also been suggested that the freshly created surfaces at the crack tip may stick together, and then break apart again as the crack tip opens and closes.
ABS GUIDANCE NOTES ON STRUCTURAL MONITORING USING ACOUSTIC EMISSIONS . 2016 23
Appendix 1 An Introduction to Acoustic Emission
FIGURE 4 Indication of Crack Face Rubbing
Friction Sources
Crack Face
Theoretical relationships between Acoustic Emission and crack propagation rates have been developed. Extensive research work has been done on Acoustic Emission from constant-cycle fatigue. Less work has been done on fatigue under the random loading conditions that are found offshore.
Distinguishing between primary and secondary emission is easy in the case of constant-cycle fatigue. In the case of random loading it is not so easy, and perhaps not so necessary either. Crack face movement, either friction or fresh growth, is an undesirable and probably deteriorating condition that should be corrected.
5 The Signal Formation Chain The signal shaping chain is shown in Appendix 1, Figure 5. It has four links: the source, the propagation of the wave, the sensor, and the signal conditioning electronics. Each link has a controlling influence on the size and shape of the measured signal. The final signal is drastically different in shape from the original motion at the source.
An important consideration in discussing the signal shaping chain is frequency content. All signals can be analyzed into their “sine wave” frequency components. This is the field of Fourier analysis, one of the most powerful tools in the science and technology of signal processing.
The word “frequency” refers to the repetition rate of an oscillation – the number of cycles per second. Anybody who has turned the knob to tune in a car radio has been selecting the frequency that he wants to receive. Each radio station broadcasts at a particular frequency. Turning the knob to tune in a station makes the receiver sensitive to the desired frequency.
24 ABS GUIDANCE NOTES ON STRUCTURAL MONITORING USING ACOUSTIC EMISSIONS . 2016
Appendix 1 An Introduction to Acoustic Emission
FIGURE 5 The Signal Formation Chain
Source Structure Sensor Amplifier/Filter
Frequency Response
Time Domain Response
An Acoustic Emission source, however, is not like a radio station radiating just one frequency. It is more like a lightning bolt. Driving through a thunderstorm, a car radio will pick up the lightning discharge anywhere on the AM band. This is called a “broadband” signal, in contrast to the “narrowband” radio station. Like lightning, the impulsive Acoustic Emission source radiates energy at essentially all frequencies.
The frequency response of Acoustic Emission sensors can be either broadband or narrowband (resonant). Broadband sensors offer higher fidelity, a more faithful rendering of the actual motion of the metal surface at the sensor location. Yet, in most practical nondestructive testing, narrowband sensors are preferred. There are several reasons for this. Resonant sensors are generally more sensitive and much less expensive than broadband types. They have the advantage of operating in a known and well-established frequency band, which can be chosen to optimize system performance in the face of wave attenuation and background noise. Broadband sensors have the potential to deliver extra information, but unfortunately, the best of this information is at the low end of the spectrum, just where the noise problems are worst. Thus, resonant sensors are recommended for most practical purposes. The most commonly used sensor has a peak resonant frequency of 150 kHz and operates between 100 kHz and 300 kHz.
Once the Acoustic Emission specialist has selected the sensor resonant frequency, the frequency band pass of the amplifier/filter combination in the Acoustic Emission instrument is normally set to match it. Thus, the last two links of the signal shaping chain are fixed. Now, the signal measurements will be altered only by changes in the first two links. The same kind of source event at different locations can give different signals, and different kinds of source events at the same location can give different signals. Both wave propagation and sensor response have a very important influence on the waveform of the detected signal.
Reference:
A. A. Pollock, “Inspection Bridges with Acoustic Emission,” Guidelines prepared for the U.S. Department of Transportation and Federal Highway Administration (FHWA), June 1995. Technical Report No. TR-103-12 6/95, Physical Acoustic Corp., Princeton Junction, NJ 08550.
ABS GUIDANCE NOTES ON STRUCTURAL MONITORING USING ACOUSTIC EMISSIONS . 2016 25
A p p e n d i x 2 : T e s t P r o c e d u r e
A P P E N D I X 2 Test Procedure
Before undertaking an Acoustic Emission test on a marine structure, it is necessary to draw up a test procedure for that specific test. This Appendix provides detailed guidance on the content and format of the test procedure for the specific test. An example of an actual test procedure is shown in Appendix 6.
The test procedure covers the technical (not logistical) aspects of the test. Its purpose is to lead the Acoustic Emission specialists through the test to a technically satisfactory, properly supported, well-documented outcome.
Often, test procedures are adapted from pre-existing documents. This is a good practical approach. However, care should be taken to prevent misuse. Every test is different in at least some respects. The pre-existing documents are to be scrutinized in detail during the adaptation process to ensure that the parts being used are valid for the new test being undertaken.
1 Content and Format In drawing up the procedure for any Acoustic Emission test, there are three elements that must be integrated into a good test of the structure: loading, equipment setup, and evaluation criteria. This is true of any Acoustic Emission test, not only tests in the marine environment. The three elements are discussed in Subsections A2/5, A2/7 and A2/11, respectively. A fourth, pervasive element is always under consideration, and this is background noise. Noise is addressed within the three elements and their interplay. It is addressed through specific countermeasures (see Subsection A2/9), and it is addressed in data interpretation (see Subsection A2/13).
Within this broad framework, there are many topics for detailed consideration. A listing of these topics with short expositions is shown in ASTM E 1932.
There are a wide choice of formats for the test procedure, rather than a single prescription:
• The test organization may already have its own preferred format from other contexts.
• There may be other documents that are good to emulate. An example test procedure is presented in Appendix 1 and may be convenient for this purpose.
• ASTM and ASME (Section V, Articles 12 and 13) test procedures are written in a standard format that has much to be commended.
3 Monitoring Area The monitoring area(s) must be clearly specified. This determination is made by the vessel owner, the naval architect, and the classification society working together during preliminary planning for the test. Depending on the nature of the test, there may be areas designated for wide-area coverage and/or smaller areas designated for local area monitoring with or without guard sensors. The test procedure defines these areas to a suitable degree of precision, with suitable drawings appended or referred to.
26 ABS GUIDANCE NOTES ON STRUCTURAL MONITORING USING ACOUSTIC EMISSIONS . 2016
Appendix 2 Test Procedure
5 Loading The test procedure must specify the loading conditions under which Acoustic Emission is to be monitored.
This could be an applied, controlled load (e.g., a pressure test) or it could be natural in-service loading (e.g., weather and subsequent wave loading during a sea voyage).
Either way, there are conditions under which Acoustic Emission is to be monitored and conditions under which it is not be monitored. If it is during a sea voyage, for example, the most useful data may be obtained at intermediate sea states. Severe sea states may provide additional Acoustic Emission from relevant sources but could also produce overwhelming noise. The test procedure states the criteria or basis for choosing which sea states are monitored and which are not. If it is a controlled-loading test, the loading schedule needs to be specified along with the times and load ranges when Acoustic Emission data actually are recorded and analyzed.
Loads must be measured and recorded. The test procedure ensures that the load measurements and recordings are sufficient to provide a good basis for data analysis. This includes a specification for keeping records of weather and its implications for structural loading (e.g., wind direction and force, vessel’s bearings/heading, sea state). It also includes specifications for electronic recording of load variables (“parametric inputs” from strain gauge) on the Acoustic Emission system.
Information on prior loading, especially recent high loading, is taken into account while drawing up this part of the test procedure.
• Layout of sensors on the test article or techniques for establishing them, including the source location and/or guard sensor techniques to be used
• The equipment settings or criteria/techniques for determining them
• Specifications for system performance check, recording and data storage/download/backup techniques to be used
• Details of recording and data storage
These five topics are discussed below.
7.1 Specification of the Equipment Selected equipment must be adequate for the job. ASTM E 1932 states that considerations should include the number of channels, the frequency range of the instrument’s filters, the real-time data processing rates, its location/guard/spatial filtering capabilities, the type of data being collected, and the compatibility of the system to monitor and record the applied load and other external signals (parametrics). Consideration should also be given to the data analysis, display, and replay capabilities of the equipment, as well as the resources to be used for data download, storage, and backup. Parametric inputs must be specified.
7.3 Layout of Sensors and Location Techniques Good selection and recording of sensor positions is critical to the Acoustic Emission test. This requires consideration of the nature and size of the monitoring area(s) as well as potential noise sources. It also requires attention to wave attenuation in the structure. This may be measured in a preliminary visit before the test, or it may be estimated on the basis of prior experience of similar structures, and/or it may be measured just before equipment setup. The monitoring area can be made of 1.5 times zone radius.
ABS GUIDANCE NOTES ON STRUCTURAL MONITORING USING ACOUSTIC EMISSIONS . 2016 27
Appendix 2 Test Procedure
Common criteria/strategies for sensor placement include:
• Emphasis on monitoring the highly stressed areas (to see if there are flaws present)
• Monitoring known flaws (to assist in the assessment of their severity)
• Wide area monitoring (to identify suspect areas that should be examined more closely with other NDT methods)
Fortunately, there is much flexibility in the use of source location techniques since different techniques can be applied post-test to the same set of data. For example, there is also some interchangeability at analysis time between guard sensor techniques and broad area monitoring. Again, it is possible to use zone location as a first line of analysis followed by computed location for more precise source identification.
Acoustic Emission standard test procedures almost invariably include a routine for determining the maximum sensor spacing using pencil lead breaks (PLB) to simulate the Acoustic Emission source that needs to be detected or located. Alternatively, some procedures specify a PLB-based way of determining a sensor’s area of coverage. Test procedures for marine applications use or emulate one or more of these techniques in order to provide objective evidence that adequate coverage/spacing is being used. Simplification is encouraged if emulating these standard techniques.
7.5 Equipment Settings Equipment settings that influence the actual recorded data are more critical than those that can be changed afterwards. Examples of the former are the type and level of the detection threshold, the timing parameters, and the front-end filters, if used. Examples of the latter are the source location arrangements, feature-based filtering, and graphical displays. The effects of different recording settings can be simulated to some extent after the test by drawing on the measured waveforms, but this kind of analysis cannot create data that was not recorded in the first place.
When selecting equipment, it is beneficial to have an instrument that stores the equipment setting information in the header of every data file. This allows this information to be retrieved for post-test analysis when comparing multiple date files.
During long periods of monitoring, changes to the equipment settings may be permissible, either to optimize a single recording approach or to add variety and different approaches. The test procedure specifies the more important settings such as bandwidth, detection threshold, timing parameters, and waveform recording parameters and states intentions for variation or ongoing improvement to the setup if it is to be a long test. As tests become more standardized and shorter in length, there will be a stronger tendency to run with a single predetermined set of equipment settings. It is very important to keep track of the changes in settings so that they can be re-set at analysis time. The test procedure should specify how this is to be done.
Sensor placement will be determined in some detail before the test and, if this is the case, the test procedure documents what has been determined. If the sensor placement is to be determined at installation time, the principles for determining it will be stated in the test procedure. These principles may include attenuation measurements and may draw on existing codes, standards, and procedures. In any case, it is necessary that the test procedure include a step for measuring/demonstrating the adequacy of the sensor layout for a particular monitoring area.
7.7 System Performance Checks and Maintenance At the time of sensor installation, system performance of each channel is checked by pencil lead break (or other technique of demonstrated equal effectiveness). The state of the installation, with all channels working properly, then is characterized by a global technique such as (spring loaded) center punch or Automatic Sensor Test (AST). The global technique is used to recheck the system performance at stated intervals during the monitoring. At the end of the monitoring period, a final system performance check is performed using the global technique, supplemented by repeat PLB to the extent specified. The test procedure should address measures to be taken for remediation and reporting in case of channel deterioration during monitoring.
28 ABS GUIDANCE NOTES ON STRUCTURAL MONITORING USING ACOUSTIC EMISSIONS . 2016
Appendix 2 Test Procedure
Fixed parameters of the pencil lead break technique are the hardness of the lead (2H), the length of the lead (2-3 mm (0.1 inch)) and the angle at which the pencil is to be held (30 degrees to the surface) unless the latter is not feasible for access reasons. The test procedure specifies the selectable parameters of the pencil lead break technique (0.3 or 0.5 mm lead, distance of lead break from center of sensor) and the acceptance criteria for channel-to-channel consistency. The acceptance criterion is typically stated either as an acceptable range of dBAE values or as a maximum tolerable deviation from the average of all channel responses.
7.9 Recording and Data Storage Forms for logging the progress of the test should be included or specified in the test procedure. The test procedure should also include any special instructions to be followed regarding controllable variables such as file length, file content and file naming. These instructions should address both the data files and the layout files that contain information on test setup variables. The purpose of these instructions would be to ensure that the data is acquired in a manageable, transferable, achievable, retrievable, analyzable form, especially when several different people or organizations are working with it.
9 Noise Countermeasures “Precautions” include measures such as tying down cables, stilling moving parts, and shielding monitoring areas from impact. The test procedure should include any known precautions to be taken against anticipated noise sources. It should also be recognized that many noise situations cannot be anticipated, but have to be dealt with based on the experience and skill of the on-site operators.
“Discrimination” techniques include time and load gating, and spatially-based and feature-based filtering. The test procedure should state whether and how these techniques will be used.
Many test procedures include explicit provisions for checking background noise before monitoring, even during equipment installation. There may be specific guidelines for how much background noise is acceptable (in terms of hit rate, energy rate, amplitude, etc.) within a certain monitoring time.
In tests on marine structures, there are likely to be major changes in background noise due to changes in weather (rain, wind, sea state). The test procedure should include instructions on how to handle this. This may include pausing/resuming the Acoustic Emission monitoring, changing parts of the equipment setup and/or file recording, log-keeping to assist data analysis, etc.
11 Data Acquisition and Recording The general duties of the Acoustic Emission specialist(s) during data acquisition and recording should be identified. These typically include monitoring the load, saving and downloading Acoustic Emission data, maintaining logs and other records, observation of Acoustic Emission ensuring that background noise remains acceptable, etc. (see also ASTM E 1932).
If some of the recording is to be made with front-end filtering, it is important to also make one or more recordings without the front-end filtering, but with other conditions the same (especially background noise). This is necessary to validate and assist interpretation of the front-end-filtered data. Front-end filters should only be used when the background noise is well-characterized and not excessive. They should not be used to reduce the data rate on channels that are constantly running too busy.
The Acoustic Emission channels should never be running too busy. When Acoustic Emission events and/or noise sources produce signals above the threshold too often, the signals overlap and the measurements are contaminated. This condition should be avoided as far as possible. If there are moments in the test when it happens (perhaps unavoidably), the consequences for data validity must be considered. Action is appropriate during data acquisition and/or during data analysis. This contingency should be considered in setting up the test procedure.
If the system is to be monitored and/or controlled remotely, the test procedure includes the conditions for this monitoring and the intentions for communication between the remote monitoring location and other parties.
The data acquisition is discussed at greater length in Subsection A3/1.
ABS GUIDANCE NOTES ON STRUCTURAL MONITORING USING ACOUSTIC EMISSIONS . 2016 29
Appendix 2 Test Procedure
13 Data Interpretation and Evaluation Interpretation is, according to the standard ASTM E 1316 definition, the separation of relevant indications from non-relevant indications. Stated in Acoustic Emission terms, this is the separation of legitimate Acoustic Emission from noise.
Interpretation is less easy to specify in advance than the other steps in the test. This is because the non-relevant indications tend to be unpredictable and test-specific. It is largely a matter of operator/analyst skill and experience to recognize them and filter them out. It becomes easier with time. As tests become more repetitive and predictable, so do their associated interpretive processes.
The interpretation step can be considered as a positive process of data validation. For example, if front-end filters have been used, the quality of the remaining data should be carefully checked. This can be done by examining hit rates and cumulative durations (busyness) in the control files that were made without the front-end filter. Source locations also need to be validated. High hit rates from background noise can generate false locations. Again, the precise techniques to be used are hard to specify in advance, but the test procedure should at least recognize the nature of the task. In particular, the distinction between interpretation and evaluation is valuable to keep in mind through the data analysis process.
Evaluation is performed on the relevant indications only after the removal of noise (Subsection A3/3). Evaluation criteria can be framed in various ways; so can the outcomes of the evaluation process. As a test is brought to maturity through repeated experience, the evaluation criteria become clearly defined. In the absence of explicit criteria, it is a matter of engineering judgment. In writing the evaluation section of the test procedure, the effort should be to make the criteria and their associated outcomes as explicit as possible under the circumstances. It is by committing to explicit criteria, following them, and working through the consequences that this part of the technology advances.
15 Reporting Effective reporting is very important to the success of the test and the satisfaction of the end-user/customer. As part of the test planning, the test agency and the end-user/customer need to have reached an agreement on how the test results are to be reported. For example, there may be oral reports and/or written reports at the end of the monitoring or even interim reports during monitoring. There is usually a final report some time after the end of the monitoring and analysis. The test procedure should outline what reports are to be provided and when.
There may be quality records and signoffs to be completed as the test proceeds. If so, consideration is to be given to whether these are to be called out in the test procedure or whether they are to be separate from it.
Report content, including the level of detail, should also be considered and is called out in the test procedure. For example, will all the system settings and system performance checks be included in the report for reference? The level of detail obviously affects the cost of the report. Probably the most critical component of the reporting is the recommendations for follow-up inspections. This should be stated in an Executive Summary at the beginning of the report as well as in the main body of the report following the presentation of results. The test procedure should cover how and when these are to be presented. Consideration should also be given to how much backup information is given to substantiate the follow-up recommendations.
One logical thing to document as part of the test report is any deviations from the test procedure that occur as the test is performed. These could be significant in post-mortem review of the successes and failures of the test.
30 ABS GUIDANCE NOTES ON STRUCTURAL MONITORING USING ACOUSTIC EMISSIONS . 2016
A p p e n d i x 3 : D a t a A c q u i s i t i o n a n d A n a l y s i s
A P P E N D I X 3 Data Acquisition and Analysis
Data acquisition and analysis is the core of the Acoustic Emission test. The purpose of this Appendix is to take a focused look at these central activities and to give additional technical information about some of the tools that can be used to make them successful.
1 General Requirements for Data Acquisition
1.1 Data from Vessel Owner/Operator Information on vessel operations is needed since these affect the noise environment. This is part of the routine communications to be established between the vessel’s crew and the Acoustic Emission test team. Furthermore, in some projects, vessel operations such as loading and unloading may actually be used as the stress stimulus for Acoustic Emission monitoring.
Quantitative Information route (bearing) and sea environment (wind, swell/wave) are needed because they affect both the background noise and the stresses in the area of interest during voyage monitoring. This information is a key to analysis of the Acoustic Emission data and might also be used for selective recording.
Alternatively, during the data acquisition, the onboard Acoustic Emission specialist can put a time mark with comments to describe the Acoustic Emission testing environments.
1.3 Data from the Sensors Current-generation systems record data from Acoustic Emission sensors, accelerometers, and strain gauges. Three kinds of records can be created: hit data, time-driven data, and streaming data. A hit is created when the signal from the Acoustic Emission sensor exceeds a preset detection threshold. Time-driven data is created at regular time intervals regardless of the presence or absence of acoustic signals. Streaming data comprises waveform samples taken at regular time intervals or when they are manually triggered.
Measurements are made and data is stored to the computer file using these three kinds of record as follows:
i) Hit Data Set: Amplitude, counts, duration, rise time, average signal level (ASL), energy and/or signal strength, absolute energy, average frequency, centroid frequency, peak frequency, partial powers (optional), parametric inputs, as appropriate (e.g., strain gauge outputs). A limited number of waveforms may also be recorded.
ii) Time Driven Data Set: Parametric inputs, as appropriate (e.g., strain gauge outputs, sampled at the moments the data is taken).
iii) Streaming Data: Waveforms from the Acoustic Emission sensors (long waveform samples taken at regular time intervals or when manually triggered).
The recording of data may be subject to voltage time gating and front-end filtering. Any use of these techniques must be clearly identified through the test log and through the documentation and retention of suitable layout files.
ABS GUIDANCE NOTES ON STRUCTURAL MONITORING USING ACOUSTIC EMISSIONS . 2016 31
Appendix 3 Data Acquisition and Analysis
1.5 Data Acquisition Graphs The viewing and appraisal of data graphs on the computer screen is a core activity for the NDT technician, especially for the Acoustic Emission data. The following is the minimum set of Acoustic Emission graphs to be used during data acquisition:
i) Historical
• Amplitude vs. time, point plot
• Accumulated energy vs. time per channel, histogram simple line
• Average signal level (ASL) vs. time per channel
ii) Distribution
• Hits vs. amplitude, histogram plot
iii) Location
• Energy vs. channel, histogram (bin sum)
• Y Position vs. X Position, point plot (may be colored by energy, etc.). One location graph per group of Acoustic Emission sensors; cluster groups in each location graph
iv) Cross plot
• Duration vs. amplitude, point plot
• Energy vs. amplitude, point plot
v) Other
• Amplitude vs. channel, point plot (may be colored by hits)
Graphical filtering can be used with any of the plots mentioned above to remove or restrict data that is being displayed on any graph. Graphical filtering does not affect the data collection or storage process.
1.7 Data Storage and Transfer The quantities of data generated during shipboard monitoring can be large, putting significant demand on the skills of the Acoustic Emission specialists. A balance needs to be struck between recording too little and recording too much. If too little is recorded, the subsequent analysis will be impoverished. If too much is recorded, data storage and transfer will require an unduly large part of the available time and equipment resources.
There are two keys to success in this area. One is to avoid recording large amounts of noise data that is too poor in quality to ever yield a successful analysis. The other is to be selective about the recording of waveforms, as each stored waveform occupies about a thousand times more space than the time and frequency domain features that are measured from it and stored in the hit record.
Standard practice is to program the equipment to restrict the size of each data file. As a data file reaches the preset size, it is closed and a new data file is started. Alternatively, the duration of data collection automatic data file closing and opening is based on a maximum of 24 hours data collection. In post-test analysis, these files can be linked together to form one continuous file.
1.9 Test Log A test log shall be kept during the full test period and shall record the following top-level information:
• Date of the test period
• Identity of the vessel being tested
• Location of the test
• Name of Acoustic Emission test crew leader
• Start and end times and duration of the test period
32 ABS GUIDANCE NOTES ON STRUCTURAL MONITORING USING ACOUSTIC EMISSIONS . 2016
Appendix 3 Data Acquisition and Analysis
More detailed information also to be included in the test log is:
• Layout file names and folders where they are kept on the computer
• Acoustic Emission sensor groups used for source location and the type of location used
• Data file names, times of starting and stopping recording
• In association with the data file name the following details may be tabulated:
- Hits, located events, total energy, and/or total counts at suitable times during the test.
- Whether front-end filtering was used and, if so, the settings and any changes to them
- Selective gating used, if any, to limit recording to particular times and/or loads
• Any noise incidents noted during the monitoring
3 Noise A key issue in data collection and analysis is noise. The magnitude of the noise problem, along with the way it is addressed, is possibly the largest single factor contributing to the success or failure of an Acoustic Emission test.
3.1 Noise Sources Noise waveforms in Acoustic Emission testing can be burst type or continuous type, or mixed or irregular types. Noise can be occasional, spasmodic, repetitive, or chronic. Noise sources of concern for shipboard monitoring include:
i) Environmental
• Rain and snow
• Wave breaking and spray
• Wind-related (movement of tethered items, impact of loose items)
ii) Vessel operating conditions
• Cargo movement (e.g., containers moving against cell guides/platform)
• Structural rubbing caused by wave-induced flexure of hull
• Loose equipment on deck
• Engine
• Machinery operation
iii) Specific vessel operations
• Power washing
• Bilge pumps
• Loading and unloading cargo
• Vessel crew working activity
- Dragging hatch crane on deck
3.3 Noise Countermeasures Noise countermeasures are available at several levels:
i) First, the Acoustic Emission technicians routinely take precautions such as taping down loose articles near the sensors, and arranging for controls on personnel movement in sensitive areas.
ABS GUIDANCE NOTES ON STRUCTURAL MONITORING USING ACOUSTIC EMISSIONS . 2016 33
Appendix 3 Data Acquisition and Analysis
ii) Second, there are techniques to minimize the amount of noise that gets onto the data file. These include:
• Common-sense measures such as suspending monitoring during rain or noisy vessel operations. As an alternative to suspending monitoring, the times when this is happening could be noted on the test log so that these times can be ignored in subsequent data analysis.
• Selective monitoring based on external inputs such as strain gauge outputs. By the use of a technique called voltage time gating, the system can be set up to record only at moments when a measured strain in the area of interest falls inside or outside preset limits.
• Front end filtering. With this technique, signals are only recorded if their measured features fall within prescribed limits. The intent is to discriminate against noise mechanisms such as electromagnetic interference and friction on the basis that they create significantly different signal waveforms. The different kinds of waveform are characterized by setting accept/reject limits on the measured features of the Acoustic Emission signals. Common practice is to discriminate against signals with extremely long risetimes or durations that are not likely to be genuine Acoustic Emission and against signals with very low energy that are not likely to be structurally significant.
• Guard sensors. This is a technique for discriminating between sources within the monitoring area and sources outside it. The monitoring area is covered with one or more “data” sensors, surrounded by an array of several “guard” sensors. Waves from outside the monitoring area create hits earlier on the guard sensors than on the data sensors, which causes the events to be ignored. Waves from inside the monitoring area create hits earlier on the data sensors than on the guard sensors, which causes the events to be registered. This technique may become very important to the success of shipboard monitoring because there are so many sources of acoustic noise.
iii) Third, if noise still gets onto the data file even after the above-described countermeasures, it is tackled during data interpretation, as discussed in the next section.
3.5 Excessive Noise ASTM E 1932 gives specific guidance based on experience in the Acoustic Emission community accumulated over many years. With reference to occasional or spasmodic noise, it says: “The times of any specific noise incidents and the effect of the noise of the Acoustic Emission examination shall be recorded”. It also says: “During Acoustic Emission examination, whenever circumstances allow, the noise at each sensor should be monitored periodically to ensure that background noise remains acceptable for continued Acoustic Emission examination”. In the worst case, noise can become simply too great, exceeding the abilities of filtering and analytical techniques. If this happens, the Acoustic Emission examination must be discontinued, either by suspending data collection or by discounting that part of the recording from the analysis.
If a channel is being overwhelmed by too much acoustic activity, the data it produces will be unreliable and should not be included in the analysis. The simplest indication that a channel is being overwhelmed is a continuously glowing indicator light. A second indication is the presence of hits with very long durations; this happens when events follow one another in such quick succession that the system treats them as if they were a single event. A quantitative technique for assessing data quality in the face of this kind of overload is “busyness analysis”.
Busyness analysis looks at the activity on a channel and asks the question: “For what fraction of the time is the channel busy handling signals?” This question is answered (for a given channel) by selecting a pertinent time interval and adding up the durations of all the hits within it, along with their associated dead times (hit definition times, hit lockout times). This “busy time” is divided by the time interval, and the resulting fraction is by definition the busyness B of the channel at that time. B serves as a measure of the quality of the signal measurements. In fact, a fraction B of the detectable events will be incorrectly measured, while a fraction (1 – B) will be correctly measured. Typically, if B is less than 5% one would not be too concerned, but if the busyness is greater than 20-30%, corrective action is needed. B must be assessed before, not after, any front end filtering.
34 ABS GUIDANCE NOTES ON STRUCTURAL MONITORING USING ACOUSTIC EMISSIONS . 2016
Appendix 3 Data Acquisition and Analysis
5 Data Analysis In NDT, there are two steps to data analysis: interpretation and evaluation. Interpretation is by definition the process of separating relevant from non-relevant indications. In Acoustic Emission terms, this can be called the separation of “genuine” Acoustic Emission from noise. Evaluation is the process of assessing the significance of the relevant indications. Evaluation leads to the bottom line decision from the inspection. This may be acceptance, rejection or some other kind of decision about what to do next with the structure or component that has just been inspected.
In accordance with this general principle, data analysis for Acoustic Emission in the marine environment follows the steps of Appendix 3, Figure 1 (previously shown in Section 5). The following Paragraphs give additional details of this process.
FIGURE 1 Procedure for Data Analysis
Assemble AE data
Check AE data quality
- Correlation between stress and AE
- Signature recognition
Filter the noise
Identify high AE activity
Find source locations
Recommendations
AE − amplitude, energy, etc.
Stress − strain, stress, wave direction, waveheight, cargo loading, etc.
AE signal wave form or frequency features(frequnecy controid, etc.)
Used figure − energy vs. amplitude vs. hits, etc.
Filter factors − rise time, amplitude, energy, duration, etc.
Graphic filter - strain, etc.
Indentification of high amplitude and high energy hitsduring high strain period on each cluster
Usage of figures − Amplitude vs. time and energy vs. time
− Energy vs. amplitude vs. hits
Usage of quantitative data − energy, hits, ... ...etc.
Report
Planar (2D) or LInear (1D)
Cluster analysis for 2D source locations
Merging of continued data file, time order,test log, etc.
Length of merging data file decided by a voyage orfixed calendar time (weekly or monthly)
5.1 Data Quality – Correlation between Stress and Acoustic Emission In checking on the quality of the recorded Acoustic Emission data, one of the first analytical approaches is to see whether the Acoustic Emission correlates with the constantly changing structural stresses. One of the ways genuine Acoustic Emission can be distinguished from noise is that genuine Acoustic Emission relates to stress in known, predictable ways, whereas noise is often quite unrelated to the stress in the monitoring area. An example of this is noise made by vessel’s crew activities such as power washing of the deck. Recognition of this kind of noise during data analysis will be greatly helped if the test log has been properly kept by an Acoustic Emission team that has been constantly alert for noise sources.
ABS GUIDANCE NOTES ON STRUCTURAL MONITORING USING ACOUSTIC EMISSIONS . 2016 35
Appendix 3 Data Acquisition and Analysis
In general, it has been found in shipboard monitoring that higher stress levels are associated with higher levels of acoustic activity. This raises the question whether the activity is relevant or non-relevant.
There are situations where the very stress stimulus that may be producing genuine Acoustic Emission is at the same time likely to produce noise. An example of this is the rolling of a ship that might at the same time produce bending stresses in a monitoring area, and shifting of containers against their guide rails. In cases like this, it will take source location techniques and advanced signature recognition techniques to tell whether the recorded data is relevant or non-relevant. The technique of graphic filtering can be used to filter out noise with identification of a relatively high strain period.
5.3 Data Quality – Signature Recognition It has been postulated for many years that the different mechanisms giving rise to Acoustic Emission hits would leave characteristic signatures – recognizable patterns – in the Acoustic Emission data. The first approach to “reading” these signatures involved amplitude distribution analysis and energy distribution functions. These were statistical distributions of Acoustic Emission features considered individually. Later, cross plots showing the inter-relationship between two Acoustic Emission features were introduced. These became a standard tool for Acoustic Emission data interpretation and noise filtering in the 1980’s. Later yet, pattern recognition techniques came into use. With these more advanced techniques, the analysis looks for clusters in a multi-dimensional space having the measured features (or derivatives of them) as axes. These techniques are powerful but it takes time and special skills to use them. Amplitude distribution and cross plots are simpler and yet efficient in performing pattern recognition.
Amplitude distributions are graphs of hits vs. amplitude. They can be presented in non-cumulative or max-min cumulative form, on linear or logarithmic y-axes. The logarithmic graphs often show a straight line for genuine Acoustic Emission or some kind of curve for noise or mixed mechanisms. The slope of the straight line (measured in decades per 20 dB) is often close to 1.0 for fatigue cracks detected in an Acoustic Emission overload test. Corrosion is characterized by a steeper slope.
The duration vs. amplitude (D/A) cross plot is a scatter plot, customarily set up with duration logarithmically scaled on the y-axis. The full-scale value of duration can conveniently be set to 100 ms (100,000 µs) while setting the maximum recordable duration to 99 ms. Cracks and legitimate flaws characteristically may show a banded appearance on this plot. Different kinds of noise give different signal shapes and therefore show their data at characteristically different places on this plot, namely:
• Leaks: A vertical band with amplitudes only a little above the detection threshold until the maximum recordable duration is reached, at which point the band becomes horizontal.
• Electromagnetic interference (EMI): Low-duration hits characteristically well below the crack band.
• Friction: hits above the crack band. The Swansong box, drawn on the D/A cross plot, encloses hits having durations longer than 2500 μs but amplitudes less than 10 dB above threshold. These hits are called “Swansong telltales” and indicate friction. The Swansong filter takes out all hits within a fraction of a second of any Swansong telltale, deeming them to be noise.
Another graph that has been much used is the energy vs. amplitude (E/A) cross plot. An example of this showing Pencil Lead Break data amid noise during an ocean voyage is shown in Appendix 3, Figure 2. Still other combinations of hit features can be devised that discriminate between particular signal shapes (e.g., between burst type and continuous type signals). These can all be used to guide the analysis. These methods are used to point the way to a section of the test data that is most suitable for analysis. They are used to actually remove individual hits or short time segments from the data files.
36 ABS GUIDANCE NOTES ON STRUCTURAL MONITORING USING ACOUSTIC EMISSIONS . 2016
Appendix 3 Data Acquisition and Analysis
FIGURE 2 An Example of the Energy vs. Amplitude Cross Plot
5.5 Data Filtering During Analysis If Acoustic Emission data is accumulated over a long period of time, the signal-to-noise ratio is probably better in some parts than in others. Changes in weather are one obvious reason for this. The most cost-effective analysis is the one which has:
• A sufficient number of relevant indications (genuine Acoustic Emission hits) to characterize the flaws being sought
• Or, alternatively, if there were actually no flaws in the monitoring area, a sufficient amount of loading to have stimulated them if they had been present
• The least amount of time and effort spent removing noise
The first kind of data filtering, therefore, is simply to select the most promising parts of the test record. For example, do not try to analyze a data file in which it was raining.
There are two other forms of filtering that can be applied when processing the selected data files. In the first form, known as graphical filtering, a filter can be applied to a graph so that only a specified subset of the total hit set contributes to the graph. In the second form, known as data file filtering, a completely new file is created that contains only a specified subset of the original file. Both forms of filtering can be used:
• To remove noise from view or from a data file
• Simply to focus on some subset of the data that may be of particular interest
5.7 Source Location Source location technology employs multiple sensors to determine where the Acoustic Emission is coming from. This has been a major part of Acoustic Emission technology since its early days. The technology can be applied at several levels of sophistication:
i) Zonal location. This phrase covers several techniques which give the approximate location of the Acoustic Emission activity. In one of these techniques, first hit zone location, the location analysis begins by identifying groups of hits on several sensors that all came from the same event. In the next step, only the first hit from each event is carried forward while the other “sympathetic” hits are discarded. In the subsequent analysis, only the first hits are considered. This technique has the beneficial effect of assigning each event to the zone in which it occurred (one zone surrounding each sensor). Use of this technique gives a quick overview of where the activity is coming from, overcoming the potential confusion that can be caused when large events are registered on many channels.
ABS GUIDANCE NOTES ON STRUCTURAL MONITORING USING ACOUSTIC EMISSIONS . 2016 37
Appendix 3 Data Acquisition and Analysis
ii) Linear location. This is the simplest form of “computed location” in which the software computes not just an approximate zone, but actual coordinates for the Acoustic Emission source activity. The source coordinates are computed from the differences between the arrival times of the wave at the different sensors. The wavespeed is also involved as a setup parameter for the computation. Linear location is designed for use on linear structures such as beams, bars, and pipes. Linear location algorithms report sources as lying on the straight line between the sensors.
iii) Planar location. This form of computed location is very widely used in structural testing. It is typically applied on plate-like structures. The computed source locations are usually shown as points on a map-like display (y position vs. x position), with the sensor positions and/or structural features displayed in the background. The computed locations can be seen on a line listing. It requires at least three sensors to compute the source location, that is two arrival time differences, along with the wavespeed, to compute two coordinates, x and y. Software is readily available for use on closed forms such as cylinders, cones, and spheres, as well as flat plates. The framed and partitioned structure of a ship can be represented to the software by declaring planar location setups for several groups of sensors.
An especially important extension of the source location concept is clustering. Active Acoustic Emission sources are likely to generate signals and signal sequences repeatedly, so that the reported source locations are very close together forming clusters of points on the display screen. When clusters of source locations are found, a meaningful source is indicated. Clusters on the display screen can be identified by eye and/or by automatic software routines. An example from a trans-ocean sea voyage is shown in Appendix 3, Figure 3. Clusters are often called out for visual inspection and follow-up NDT.
FIGURE 3 Source Location Cluster Formed During Ocean Voyage
Part of the power of source location technology is its versatility. While source locations are commonly displayed in real time, it is also possible to re-compute them in different ways in post-test analysis. This comes about because the source locations are calculated from the hits on the individual channels, which are stored as part of the permanent record.
Care needs to be taken to check that the apparent source locations displayed on the instrument screen are in fact genuine. There are several possible causes of false location indications:
• Instrument overload (high hit rate). If the events in the structure are occurring at a very high rate, hits from near-simultaneous events will be interlaced on the different channels. Unable to sort out the hits from near-simultaneous events, the source location algorithm may produce false locations.
• Incorrect sensor placement or location group setup. Misleading displays can be generated in planar location when the locating sensors are nearly collinear, or in linear location when the source is remote from the line joining the sensors.
38 ABS GUIDANCE NOTES ON STRUCTURAL MONITORING USING ACOUSTIC EMISSIONS . 2016
Appendix 3 Data Acquisition and Analysis
• Wave propagation which does not conform to the assumptions on which the source location algorithm is based. A common assumption is that the hit is initiated by a wave that travels at a single well-defined velocity and arrives at the sensor by a single (geodesic) path. Vagaries of wave propagation can invalidate this assumption and lead to false locations.
In summary, source location is a key part of Acoustic Emission technology. It is of the greatest value, so long as the Acoustic Emission specialist is aware of its limitations and is using it correctly.
7 Recent Advances in Data Processing Thanks largely to advances in computer technology, the following new Acoustic Emission capabilities have emerged in recent years:
• Remote data acquisition: Installations can be viewed and controlled from remote locations over the Internet, removing the need to have an Acoustic Emission expert constantly on hand during in-service monitoring projects.
• Filtering: Can be done much more quickly and easily than before.
• Signal classification: Supervised and unsupervised pattern recognition techniques applied to Acoustic Emission.
ABS GUIDANCE NOTES ON STRUCTURAL MONITORING USING ACOUSTIC EMISSIONS . 2016 39
Append ix 4 : Acous t i c Emiss ion Tes t ing Sys tems and Per fo rmance S tandards
A P P E N D I X 4 Acoustic Emission Testing Systems and Performance Standards
This Appendix describes requirements of the Acoustic Emission System for on-board testing and on-line, continuous monitoring.
1 General Acoustic Emission System Description An Acoustic Emission system block diagram is shown in Appendix 4, Figure 1. Following the figure, the Acoustic Emission system consists of one or more Acoustic Emission sensors (left side of the block diagram), each connected to a preamplifier (the preamplifier can be located inside or outside of the sensor). The output of the preamplifier is connected to an Acoustic Emission processor. The processor receives all the signals from the Acoustic Emission sensors/preamplifiers as well as signals from external parametric sensors or control inputs, which might be following the process or the stress (or load) being applied to the structure under test (note the parametric inputs and control inputs on block diagram). The job of the Acoustic Emission processor is to process these signal inputs together to form outputs indicative of the activity detected and correlated to the process or resultant stress. These waveforms and signals are digitized by the Acoustic Emission processor forming Acoustic Emission signal features and digitized waveforms, which are processed, displayed, and stored in tabular form. The signal processor outputs can be a Pass/Fail signal for control purposes or might be an indicator or set of graphical outputs. Outputs can illustrate trending, or the relationship of Acoustic Emission to the load or stress on the structure. The display might show plots of Acoustic Emission “locations” on a structure with a cluster analysis to help the operator determine areas of concern. In long-term testing and continuous monitoring, the processed data can be passed over the Internet for additional analysis or for alerting of impending damage.
Acoustic Emission system software is used to perform hardware configuration, diagnostics, data acquisition, frequency and data filtering, digitization, Acoustic Emission feature extraction, data processing, source location, location clustering and analysis, versatile data display and visualization, user control, automated analysis, data reporting, and data storage. The software is a key part of the system operation in any Acoustic Emission test.
40 ABS GUIDANCE NOTES ON STRUCTURAL MONITORING USING ACOUSTIC EMISSIONS . 2016
Appendix 4 Acoustic Emission Testing Systems and Performance Standards
FIGURE 1 Acoustic Emission System Block Diagram
Main AESignal
Processor
PowerSupply
Power
Hard CopyOutputs
Control Inputs& Outputs
InformationalOutputs
e.g., Network
Display
Power-SignalCable
Sensor-PreampCable
AE Sensor
Preamplifier
Channel 1
Channel 2
Channel N
ParametricInputs
Load, Stress& Process Inputs
Integrated Sensor
3 Performance Standards Performance standards and requirements of Acoustic Emission system components are described by component below.
3.1 Acoustic Emission Sensors Acoustic Emission sensors should be resonant in a 50 kHz to 300 kHz frequency band. Wideband sensors can also be used if there is interesting Acoustic Emission feature content in lower or higher frequency ranges. Wideband sensors, however, are less sensitive than resonant sensors and signal attenuation becomes significant at high frequencies in the composite and honeycomb structures, which limits sensor spacing and location.
Sensors should be shielded against electromagnetic interference through proper design practice or differential (anti-coincidence) element design, or both.
Sensors should have omni-directional response, with variations not exceeding 2 dB from the peak response.
Sensors used in outdoor environments or exposed to outdoor conditions including rain, mist, and temperature extremes need to be coated and fabricated with integral and sealed cables. Special intrinsically-safe sensors and cables may be required in specific applications.
3.3 Couplant Couplants are used to couple the Acoustic Emission sensor to the structure. This is a very important consideration to assure a consistent and good Acoustic Emission signal path from the structure into the Acoustic Emission sensor. For temporary or short-term testing (a few days or less), the couplant should be a viscous fluid such as silicone grease with a sensor cover or magnetic hold-down used to assure consistent coupling. In long-term monitoring applications, a strong epoxy is recommended, also aided with a sensor cover for protection.
ABS GUIDANCE NOTES ON STRUCTURAL MONITORING USING ACOUSTIC EMISSIONS . 2016 41
Appendix 4 Acoustic Emission Testing Systems and Performance Standards
Commercially available couplants for ultrasonic flaw detection are used. Silicone-based high-vacuum grease has been found to be particularly suitable. Adhesives may also be used. Note: The sensor attachment procedure as well as the couplant or adhesive may be subject to approval prior to sensor
installation due to special requirements of materials in contact with structures for corrosion and contamination control.
Couplant selection should be made to minimize changes in coupling sensitivity during a complete test. Consideration should be given to the time duration of the examination and maintaining consistency of coupling throughout the examination.
3.5 Signal Cable The signal cable connecting the sensor to the preamplifier should not attenuate the sensor peak voltage in the 50 kHz to 300 kHz frequency range more than 3 dB [1.8 m (6 ft) is a typical length]. Integral preamplifier sensors meet this requirement. They have inherently short internal signal cables.
The signal cable shall be shielded against electromagnetic interference and tribo-electric noise. Standard low-noise coaxial cable is generally adequate.
3.7 Preamplifier The preamplifier should have a noise level no greater than 5 micro-volts rms (referred to as a shorted input) within the 50 kHz to 300 kHz frequency range.
Preamplifier gain should vary no more than ± 1 dB within the 50 kHz to 300 kHz frequency band and temperature range of use.
Preamplifiers shall be shielded from electromagnetic interference.
Preamplifiers should include a band pass filter with a minimum bandwidth of 50 kHz to 300 kHz. Note that the crystal resonant characteristics provide additional filtering as does the band pass filter in the signal conditioner. A third order Butterworth filter (or better) will be used.
It is preferred that the preamplifier be mounted inside the sensor housing. This eliminates the sensor-to-preamplifier cable, resulting in a much more reliable installation for shipboard applications.
3.9 Power-Signal Cable The cable and connectors that provide power to preamplifiers, and that conduct amplified signals to the main processor, shall be shielded against electromagnetic interference. Signal loss shall be less than 3 dB over the length of the cable used (when standard coaxial cable is used, 330 m (1000 ft) is the maximum recommended cable length to avoid excessive signal attenuation). For intrinsically-safe environments, the power-signal cables are required to use special low voltage (5 volt DC, whereas the typical cables are 28 volt DC)
3.11 Acoustic Emission Processor Power Supply A stable, grounded, power supply that meets the signal processor manufacturer’s specification should be used.
3.13 Main Signal Processor The main processor should have circuitry through which sensor data are processed. It shall be capable of processing hits, hit arrival time, duration, counts, peak amplitude, signal strength, energy on each channel, and parametric (load) measurement capability on 1 or more channels.
Electronic circuitry shall be stable within ±1 dB in the temperature range 4° to 38°C (40° to 100°F).
Acoustic Emission Signal dynamic range: >80 dB.
Acoustic Emission Threshold shall be accurate within ±1 dB.
The examination threshold should be set at or below 50 dBAE (depending on background noise of the system setup when subjected to a constant load of 10% or less of the estimated examination load). Threshold should remain constant during the entire examination, if possible; however, it may need to be changed in order to keep the Acoustic Emission threshold above the background noise by at least 3 dB to avoid collecting Acoustic Emission data from noise.
System needs to be able to process Acoustic Emission waveforms.
42 ABS GUIDANCE NOTES ON STRUCTURAL MONITORING USING ACOUSTIC EMISSIONS . 2016
Appendix 4 Acoustic Emission Testing Systems and Performance Standards
3.15 Number of Acoustic Emission Channels There needs to be an adequate number of Acoustic Emission system channels in the Acoustic Emission system. If there are not enough channels in one data acquisition chassis, there needs to be the ability to connect up and link additional Acoustic Emission system chassis together and the ability to act either independently from one another or time-synchronized for critical source location assessment.
3.17 System Environmental Requirements Acoustic Emission systems to be used on shipboard applications need to be rugged, sturdy, and reliable. The system must be in a protected housing with either NEMA 4 (semi-waterproof) or NEMA 12 (drip-proof) packaging. Other system requirements include:
• System Operational temperature range: 0°C-49°C (32°F-120°F)
• Humidity: 0-95% RH
• Shock and Vibration
• EMI/RFI Immunity
5 Calibration and Verification Calibration of Acoustic Emission sensors, preamplifiers (if applicable), signal processor and Acoustic Emission electronic waveform generator (or simulator) should be carried out in accordance with the equipment manufacturer’s specifications and requirements.
Routine electronic evaluations need to be performed any time there is concern about signal processor performance. An Acoustic Emission electronic waveform generator or simulator should be used in making evaluations. Each signal processor channel must respond with peak amplitude reading within ±2 dB of the electronic waveform generator output.
System performance verification needs to be conducted immediately before and immediately after each test. In the performance verification, a mechanical device is used to introduce stress waves into the material under examination at a specified distance from each sensor. These stress waves are intended to stimulate a sensor in the same way as emission from a flaw. Performance verifications verify performance of the entire system (including couplant).
The preferred technique for verifying performance is pencil lead break (PLB). Lead should be broken on the material surface at a specified distance from each sensor. 2H lead with length 2-3 mm and preferred diameter 0.5 mm is used.
Auto Sensor Test (AST). An electromechanical device such as a piezoelectric pulser (and sensor which contains this function) can be used in conjunction with pencil lead break as a means to assure system performance. This device can be used to replace the PLB post examination, system performance verification.
7 Software Acoustic Emission software needs to be robust and mature.
Reliability of acquisition is especially important. Once the data is safely archived, there are many opportunities to analyze it, but if it is not saved at acquisition time, it is lost forever.
9 Need for Current Equipment Current-generation Acoustic Emission systems and software should be used to take advantage of available performance and techniques. The marine environment is challenging in terms of both noise and environmental demands. System speed and storage requirements are such that older-generation equipment is simply not up to the job. Even today, ongoing technical refinements put additional demands on the Acoustic Emission systems to be deployed in the future.
ABS GUIDANCE NOTES ON STRUCTURAL MONITORING USING ACOUSTIC EMISSIONS . 2016 43
A p p e n d i x 5 : C o d e s a n d S t a n d a r d s
A P P E N D I X 5 Codes and Standards
This Appendix lists Acoustic Emission Codes and Standards from several leading organizations. The list is not comprehensive. Many of these documents are updated every few years and new ones are always being developed.
1 Acoustic Emission in ASTM Standards ASTM International, formerly the American Society for Testing and Materials, publishes Test Methods, Practices and Guides covering a very wide range of topics, developed by a committee consensus process.
1.1 Standards Specific to Acoustic Emission Testing 1. E 569-13 Standard Practice for Acoustic Emission Monitoring of Structures During Controlled
Stimulation.
2. E 650-12 Standard Guide for Mounting Piezoelectric Acoustic Emission Sensors
3 E 750-15 Standard Practice for Characterizing Acoustic Emission Instrumentation
4. E 976-15 Standard Practice for Determining the Reproducibility of Acoustic Emission Sensor Response
5. E 1106-12 Standard Method for Primary Calibration of Acoustic Emission Sensors
6. E 1139-12 Standard Practice for Continuous Monitoring of Acoustic Emission from Metal Pressure Boundaries
7. E 1211-12 Standard Practice for Leak Detection and Location Using Surface-Mounted Acoustic Emission Sensors
8. E 1419-15A Standard Test Method for Examination of Seamless, Gas Filled, Pressure Vessels Using Acoustic Emission
9. E 1781-13 Standard Practice for Secondary Calibration of Acoustic Emission Sensors
10. E 1930-12 Standard Test Method for Examination of Liquid-Filled Atmospheric and Low-Pressure Metal Storage Tanks Using Acoustic Emission
11 E 1932-12 Standard Guide for Acoustic Emission Examination of Small Parts
12. E 2075-15 Standard Practice for Verifying the Consistency of AE-Sensor Response Using an Acrylic Rod
13. E 2374-16 Standard Guide for Acoustic Emission System Performance Verification
14. E 2661-15 Standard Practice for Acoustic Emission Examination of Plate-like and Flat Panel Composite Structures Used Aerospace Applications
15. E2983-14 Standard Guide for Application of Acoustic Emission for Structural Health Monitoring
16. F 2174-15 Standard Practice for Verifying Acoustic Emission Sensor Response
1.3 Standards Closely Related/Relevant To Acoustic Emission 1. E 1002-11 Standard Method of Testing for Leaks Using Ultrasonics
2. E 1316-16 Standard Terminology for Nondestructive Examinations
3. E 2223-13 Examination of Seamless, Gas-Filled, Steel Pressure Vessels Using Angle Beam Incidence
44 ABS GUIDANCE NOTES ON STRUCTURAL MONITORING USING ACOUSTIC EMISSIONS . 2016
Appendix 5 Codes and Standards
3 Acoustic Emission in ASME Codes The ASME (American Society of Mechanical Engineers) Boiler and Pressure Vessel Code is widely used to for the safe design of pressurized equipment, nuclear power plant components etc.
1. “Use of Acoustic Emission Examination in Lieu of Radiography”, Code Case No. 1968, Section VIII, Division 1 (1982)
2. “Acceptance Test Procedure for Class II Vessels”, Article RT-6, Section X, Boiler and Pressure Vessel Code (December 1988 Addendum and later editions)
3. “Acoustic Emission Examination of Metallic Vessels During Pressure Testing”, Article 12, Subsection A, Section V, Boiler and Pressure Vessel Code (December 1988 Addendum and later editions)
4. “Acoustic Emission for Successive Inspections, Section XI, Div. 1”, Case N-471, Cases of ASME Boiler and Pressure Vessel Code; Introduced in Supplement No. 5 (Code Cases, Nuclear Components) to the 1989 Edition of the Boiler and Pressure Vessel Code. Approved by the Board on Pressure Technology Codes and Standards on April 30, 1990.
5. “Continuous Acoustic Emission Monitoring”, Article 13, Subsection A, Section V, Boiler and Pressure Vessel Code (1995 edition)
6. “Standard Test Method for Examination of Seamless, Gas Filled, Pressure Vessels Using Acoustic Emission”, ASME SE1419 (Section V, Boiler and Pressure Vessel Code)
5 Regulatory Code Variances and Exemptions Several US regulatory bodies have accepted Acoustic Emission testing into the regulations that they manage. Prominent among these is the US Department of Transportation. Two examples are given below.
1 DOT E-11059 (Tube Trailer Testing) to Bureau of Land Management (1993)
2. DOT E-11850 (Halon Bottle Testing) to ATA (1998)
7 Acoustic Emission Personnel Qualification and Certification ASNT and ISO are two of the bodies that promulgate standards and recommended practices for personnel qualification and certification in nondestructive testing. This is a vital step towards making sure that the testing fulfills its intended purpose.
1. ISO 18436:2014, Condition monitoring and diagnostic of machines – Requirements for training and certification of personnel – Part 6: Acoustic emission, 2014.
2. ISO 9712:2012, Nondestructive testing: qualification and certification of NDT personnel, International Organization for Standardization, Geneva, Switzerland, 2012.
3. ANSI/ASNT CP 189, ASNT standard for qualification and certification of nondestructive testing personnel (2011). Minimum requirements for the qualification and certification of NDT personnel.
4. Recommended Practice No. SNT-TC-1A: Personnel Qualification and Certification in Nondestructive Testing: The American Society for Nondestructive Testing (ASNT), Columbus, Ohio (new edition published every few years).
ABS GUIDANCE NOTES ON STRUCTURAL MONITORING USING ACOUSTIC EMISSIONS . 2016 45
Appendix 5 Codes and Standards
9 Acoustic Emission Codes and Standards – Overseas ISO as well as several national bodies outside the United States have published standards and test procedures for the use of acoustic emission in a variety of practical testing situations.
1. Acoustic Emission Testing of Spherical Pressure Vessels made of High Tensile Strength Steel and Classification of Test Results, NDIS 2412-1980. The Japanese Society for NDI (NDIS)
2. ISO 12713, Non-destructive Testing – Acoustic Emission Inspection – Primary Calibration of Transducers, International Organization for Standardization, Geneva Switzerland.
3. ISO 16148, Gas Cylinders – Refillable Seamless Steel Gas Cylinders and Tubes – Acoustic Emission Testing (AT) and Follow-up Ultrasonic Examination (UT) for Periodic Inspection and Testing, International Organization for Standardization, Geneva, Switzerland.
46 ABS GUIDANCE NOTES ON STRUCTURAL MONITORING USING ACOUSTIC EMISSIONS . 2016
A p p e n d i x 6 : E x a m p l e T e s t P r o c e d u r e
A P P E N D I X 6 Example Test Procedure
This Appendix is a transcript of a draft prepared before an actual sea voyage Acoustic Emission test. It illustrates the procedure-writing principles and practices discussed in Appendix 2. This draft procedure has some sections not completed because they were designated for further elaboration during the voyage itself.
TEST PROCEDURE FOR ACOUSTIC EMISSION MONITORING OF CONTAINERSHIP Sample
DURING TRANSPACIFIC VOYAGE, APRIL 2009 Draft Rev. 1.0, 11/6/2009
TABLE OF CONTENTS
1. Scope and purpose
2. Referenced documents
3. Safety
4. Containership Sample, and inspection areas to be examined
5. Locations of discontinuities known from previous inspections
6. Loading to be applied
7. Equipment to be used: type, number of Acoustic Emission channels, other measurements such as load transducers, strain gauges etc.
8. Potential sources of background noise; specific measurements, precautions and discrimination techniques to be applied before and during data acquisition
9. Sensor mounting method, configuration, source location techniques to be used
10. System settings (both system performance checks and main data acquisition)
11. System performance checks
12. Acoustic Emission Test forms
13. Data acquisition and recording (including data storage, setting changes, noise contingencies etc.)
14. Data interpretation and evaluation
15. Reporting
16. Verification of Acoustic Emission Results during Inspection
ABS GUIDANCE NOTES ON STRUCTURAL MONITORING USING ACOUSTIC EMISSIONS . 2016 47
Appendix 6 Example Test Procedure
1 Scope and Purpose The purpose of this work is to confirm the ability to implement the acoustic emission NDT method for containerships. This is done by monitoring selected areas of the containership Sample during a voyage from port A to port B.
The test is planned in detail before the voyage. Equipment is set up in port A before sailing. Acoustic Emission sensors are mounted and selected wireless communications are checked. During the voyage, Acoustic Emission data are collected along with data from strain gauges and accelerometers. Preliminary analysis is conducted during the voyage. Recommended locations for follow-up inspection are identified and reported in a preliminary report to be submitted about one month after the voyage. Follow-up inspection will be conducted during the next scheduled dry dock inspection using visual and other NDT techniques. The results of the follow-up inspection, along with the details of the voyage test, will be included in a final report.
This test procedure covers technical aspects of the Acoustic Emission and other monitoring. It is written in conformity with the ABS Guidance Notes on Structural Monitoring Using Acoustic Emissions (Reference 2.1) and is intended both to guide the test and to meet the needs of the ABS Surveyor checking conformity to the Guidelines.
2 Referenced Documents 1 ABS Guidance Notes on Structural Monitoring Using Acoustic Emissions, 2016.
2 Testing of Acoustic Emission Technology on Container Ships, a Proposal for a Joint ABS/Company A/ Company B Project OL9-036
3 Safety Job Hazard Analysis form is completed on arrival onboard. All vessel safety requirements are complied with.
4 Containership Sample and Monitoring Areas to be Examined Specific monitoring areas are identified by the vessel owner and ABS. These are selected areas that may be prone to cracking. Typical design focus areas for containerships are shown in Appendix 6, Figure 1 below.
FIGURE 1 Typical Design Focus Areas for Containerships
48 ABS GUIDANCE NOTES ON STRUCTURAL CONDITION ASSESSMENT USING ACOUSTIC EMISSION TESTING. 2016
Appendix 6 Example Test Procedure
5 Locations of Discontinuities Known from Previous Inspections Selected areas that are prone to cracking are shown in Appendix 6, Figure 2.
FIGURE 2 Selected Areas That May be Prone to Cracking
6 Loading to be Applied
6.1 General Description Loadings on the vessel resulting from weather and sea states are encountered during the voyage. There is no special additional load applied as part of the test.
6.2 Concurrent Load Measurements Strain gauges are used to monitor strain at 10 selected points in the monitoring area, concurrent with Acoustic Emission recording during the voyage.
6.3 Previous Loading History of the Monitoring Areas The loading history of the monitoring areas is monitored using strain gauges. Appendix 6, Figure 3 illustrates the arrangement of strain gauges for the hull girder stress at cross section in front of deck house. The strain gauges are four gauges installed at upper and 2nd decks. All gauges have been calibrated by the strain values using calculated levels (still water bending moment) in port.
ABS GUIDANCE NOTES ON STRUCTURAL MONITORING USING ACOUSTIC EMISSIONS . 2016 49
Appendix 6 Example Test Procedure
FIGURE 3 Arrangement of Strain Gauges for Hull Monitoring System
P2
P1 S1
2nd DECK
3rd DECK
4th DECK
ENGINE ROOM
S2
All strain gauge signals are digitized with the maximum rate up to 10,000 samples per second. During voyage 131, the raw time histories of the strain signals are recorded with the consistent rate to record Acoustic Emission signals.
A sample recorded strain with the rate of one record per second is shown as follows (Appendix 6, Figure 4).
FIGURE 4 Sample Recordings of Strain at Port Main Deck (Raw Data)
Since there was a large amount of strain data, a statistical method was used to simplify and present the strain data. Maximum, minimum, and mean of the recorded strains were calculated every five minutes. The time history of maximum strain at the port main deck is plotted in the following figure (Appendix 6, Figure 5).
FIGURE 5 Sample Recordings of Strain at Port Main Deck (Extreme Value in 5 Minutes)
50 ABS GUIDANCE NOTES ON STRUCTURAL CONDITION ASSESSMENT USING ACOUSTIC EMISSION TESTING. 2016
Appendix 6 Example Test Procedure
7 Equipment to be Used In outline, the monitoring equipment to be used on the voyage comprises:
• Uninterruptible power supply
• Two 24-channel AE SAMOS systems, one on each side of the vessel
• Seven accelerometers and associated electronics and accessories
• Ten strain gauges and associated electronics and accessories
Data transmission between sensors and AE systems are partly by cable and partly by wireless link.
The general layout of Acoustic Emission sensors and computers is indicated in Appendix 6, Figure 6 below.
FIGURE 6 Layout of Acoustic Emission Sensors and Computers
8 Noise
8.1 Potential Sources • Environmental: Waves (spraying and splashing), rain
• Movement: Vessel’s structure movement resulting from waves and swell; loose equipment
• Vessel’s operations: Engines, power washing
8.2 Precautions to be Taken • Secure equipment, sensors and all cables against noise resulting from vessel movement.
• Brief first mate and engineer regarding the need to communicate about upcoming work or personnel around the monitoring area.
ABS GUIDANCE NOTES ON STRUCTURAL MONITORING USING ACOUSTIC EMISSIONS . 2016 51
Appendix 6 Example Test Procedure
9 Sensor Mounting Method, Configuration and Source Location Techniques to be Used Sensors are mounted in accordance with ASTM E 650-97, Standard Guide for Mounting AE Sensors. The area identified as the sensor location is cleaned and all loose rust or paint are removed. This area should have enough space to accommodate the magnetic hold-downs. Each sensor is mounted using epoxy glue coupling. The system is checked and calibrated using 0.5 mm pencil, 2H lead breaks, see Subsection A6/11.
10 System Settings
10.1 General Settings The following Subsparagraph specifies the system settings generally used for all measurements. Any departures from these settings for special purposes are clearly documented:
10.1.1 Settings for Signal Measurement i) Frequency Filters 100-400 kHz
ii) Waveform Setup:
• Sample Rate 2 MSPS
• Pretrigger 200 μs
• Length 2 k
iii) Timing Parameters:
• PDT(peak definition time) 500 μs
• HDT(hit definition time) 1000 μs
• HLT(hit lockout time) 1000 μs
• Max Duration 99 ms
10.1.2 Items to be Recorded i) The Acoustic Emission recorded hit features include:
• Amplitude, energy, counts, duration, risetime
• Average frequency, signal strength, absolute energy, ASL
• Suitable hit parametrics and/or cycle count
ii) Depending on waveform recording/processing strategy, the frequency driven data include:
• Frequency centroid, peak frequency and/or partial powers
iii) The time driven data include:
• Suitable parametric inputs, average signal level (ASL), Absolute Energy
10.1.3 Detection Threshold Detection thresholds may be fixed or floating (optional) depending on circumstances and Acoustic Emission specialist discretion. Setting and alterations are made clear in test logs and/or saved layout files.
Detection thresholds are the same for pencil lead break (PLB) test as for the main data acquisition. A graph of amplitude vs. channel is used with the cursor, to see the pencil lead break (PLB) response even in the presence of background noise.
52 ABS GUIDANCE NOTES ON STRUCTURAL CONDITION ASSESSMENT USING ACOUSTIC EMISSION TESTING. 2016
Appendix 6 Example Test Procedure
11 System Performance Checks System performance checks are conducted in accordance with ASTM E 976. They are done with 0.5 mm pencil, 2H lead, 2-3 mm (0.1 inch) extension, 30 degree angle using normal technique. Record data on file (including waveforms) and record amplitudes in real time on System Performance Check Form (PPF-103) or on some equivalent medium such as an Excel spreadsheet. Take averages without delay. The individual sensor’s response is defined by the average amplitude from 3-5 consecutive breaks, after any necessary remediation to the coupling and mounting. Either of two acceptance criteria is used:
i) System performance is acceptable when the responses of sensors of the same type all lie within 4 dB of their average;
ii) System performance is acceptable when the response of sensors of the same type all lie within a 6 dB range (i.e., no more than 6 dB difference between maximum response and minimum response).
Sensor response range is between 80 dB and 98 dB. The distance between the pencil lead break and the center of the sensor is greater than four inches and close enough to meet this sensor response range. The selected distance is the same for all sensors and is recorded.
Optionally, 0.3 mm pencil lead may be used as an alternative to 0.5 mm for some or all sensors. In this case, the distance between the pencil lead break and the center of the sensor is four inches. If this option is taken, record is kept of which sensors were used.
12 Acoustic Emission Test Forms It is essential to keep well-organized records of test activities during the voyage. The following standard forms may be used (in hardcopy, and/or equivalent on system computer or laptop):
ABS GUIDANCE NOTES ON STRUCTURAL MONITORING USING ACOUSTIC EMISSIONS . 2016 53
Appendix 6 Example Test Procedure
12.2 System Performance Check – Appendix 6, Table 2
TABLE 2 System Performance Check
Peak Amplitude Performance Verification Source Location Accuracy Waveform parameter to be verified Peak amplitude Waveform parameter to be verified Source loc. accuracy Specified acceptable range 80- 98 dBAE Specified acceptable range Within ±300 mm Verification device PLB Verification device PLB Lead diameter 0.5 mm Lead diameter 0.5 mm Lead hardness 2H Lead hardness 2H Lead length 2-3 mm Lead length 2-3 mm PLB distance >100 mm, specify PLB distance 600 mm intervals
12.3 Acoustic Emission Test Log – Appendix 6, Tables 3 and 4
TABLE 3 Acoustic Emission Test Log – General Information
Project Number _______________ Test performed by ____________________________ Date(s) _____________
Sketch of Structure (here or elsewhere, see above)/Other Notes
54 ABS GUIDANCE NOTES ON STRUCTURAL CONDITION ASSESSMENT USING ACOUSTIC EMISSION TESTING. 2016
Appendix 6 Example Test Procedure
TABLE 4 Acoustic Emission Test Log – Detail Information
Year ________ Month _____________ Project # _______________
Description ______________________________________________________________ Page ______ of ______
Date (mm/dd)
Local Time
Test Time
Open File (.dta or .lay)
Close File (.dta or .lay)
Hits/ Events
Counts/ Energy
Load/Comments
12.4 Parametric Setup Table – Appendix 6, Table 5
TABLE 5 Parametric Setup Table
Parametric # Connected to Gain Multiplier Offset Units
13 Data Acquisition and Recording The on-site operator exercises the normal responsibilities of a Level II operator including equipment operation, record keeping, awareness of and handling of developing noise situations, and safe preservation of the Acoustic Emission data.
13.1 Data Storage Data are stored to hard disk. Each system’s data are stored to its own folder. Date and time are used to identify filenames. Automatic file closing is set to 10 MB.
13.2 Setting Changes Setting changes are entered to the test log as and when they occur.
13.3 Noise Contingencies Specific instances of environmental or operating conditions are entered in the test log when they occur, including times, causes, channels affected, etc.
ABS GUIDANCE NOTES ON STRUCTURAL MONITORING USING ACOUSTIC EMISSIONS . 2016 55
Appendix 6 Example Test Procedure
14 Data Interpretation and Evaluation Data are interpreted and evaluated during and after the voyage.
14.1 Check Data Quality – Correlation between Stress and Acoustic Emission A sample figure, shown in Appendix 6, Figure 7, indicates the correlation between stress and acoustic emission. Three time history graphics (strain, amplitude, and energy) display the acoustic emission activities from all channels of the monitoring area for the duration of the test period. The period of high strain level with high levels of Acoustic Emission energy and amplitude indicate that the source of Acoustic Emission activity is induced by stress during this period. It is noted that a level of amplitude greater than 60 dB indicates possible crack type activities.
FIGURE 7 Correlation between Stress and Acoustic Emission
14.2 Check Data Quality – Signature Recognition In order to identify the Acoustic Emission activity of structural flaw, several sample cross plots, shown as follows, are used for signature recognition and filter out the noise.
Appendix 6, Figure 8 displays the amplitude distribution for each Acoustic Emission hit recorded during the test period. In this case, it is noted that the level of low amplitude activity (below 60 dB) indicates a high level of non-crack-related activity.
56 ABS GUIDANCE NOTES ON STRUCTURAL CONDITION ASSESSMENT USING ACOUSTIC EMISSION TESTING. 2016
Appendix 6 Example Test Procedure
FIGURE 8 Cross plot: Number of Acoustic Emission Hits versus Amplitude
Crack related activity
Appendix 6, Figure 9 displays the cumulative Acoustic Emission hit energy and the total Acoustic Emission Hit amplitude recorded for each channel. It is noted in this case that channel 3 has the highest level of activity. Therefore, the source of Acoustic Emission activity is closest to this channel.
FIGURE 9 Cross Plot: Energy and Amplitude versus Channels
Appendix 6, Figure 10 displays the relationship between the Acoustic Emission hit Energy and Amplitude as well as Duration and Amplitude. This relationship is used to determine the quality of the Acoustic Emission data being recorded during the test period. In this case, it is noted that there is a lot of extraneous noise and the data should be filtered before final analysis. The noise includes mechanical rubbing and electromagnetic indication (not shown in Appendix 6, Figure 10).
ABS GUIDANCE NOTES ON STRUCTURAL MONITORING USING ACOUSTIC EMISSIONS . 2016 57
Appendix 6 Example Test Procedure
FIGURE 10 Cross Plot: Energy and Duration versus Amplitude
Active crack like
Electro Magnetic Indication
Mechanical Rubbing
Appendix 6, Figure 11 is used to display the approximate location of the Acoustic Emission locatable events, relative to the Acoustic Emission sensors locations. On the right-hand side of the graph is a table that lists the number and intensity of the clusters, that is the number of events located close to each other forming a cluster, plus the total energy recorded in each cluster. In this case, it is noted that cluster X, Y, Z at coordinates 6.6 and 4 feet is the area of interest. The X axis is the horizontal distance between each Acoustic Emission sensor in this case feet and the Y axis if the vertical distance. The accuracy of the location is dependent on the accuracy of the sensor placement and the data recorded in the computer program.
FIGURE 11 Clusters in the Zonal Source Location
58 ABS GUIDANCE NOTES ON STRUCTURAL CONDITION ASSESSMENT USING ACOUSTIC EMISSION TESTING. 2016
Appendix 6 Example Test Procedure
15 Reporting A preliminary report is issued in a timely manner. It describes the locations of suspect areas, and provides guidance for the follow-up verifications during drydocking later this year. However, if active crack propagation is detected, the preliminary report must be created as soon as possible.
The Acoustic Emission testing company prepares a detailed report of the tests during voyage and drydocking. This report is presented to the vessel owner and ABS.
16 Verification of Acoustic Emission Testing Results during Complementary Inspection The objective is to supplement the Acoustic Emission testing findings via visual inspection of the Acoustic Emission source locations when the vessel is scheduled for inspection. Other NDT technologies can be used in some locations. A detailed plan will be developed and submitted after the Acoustic Emission testing is completed.
ABS GUIDANCE NOTES ON STRUCTURAL MONITORING USING ACOUSTIC EMISSIONS . 2016 59