www.tjprc.org SCOPUS Indexed Journal [email protected]
STRUCTURAL OPTIMIZATION OF DIFFERENT TRUSS MEMBERS USING
FINITE ELEMENT ANALYSIS FOR MINIMUM WEIGHT
P. SATHEESH KUMAR REDDY & CH. NAGARAJU
Department of Mechanical Engineering, V.R. Siddhartha Engineering College,
Vijayawada, Andhra Pradesh, India
ABSTRACT
This paper aims to optimize and analyze a Warren, Pratt and Howe steel trusses and comparing Warren truss
with other Pratt and Howe trusses. Existing structure steel trusses was initially optimized for minimum weight, in
constrained with allowable stresses and deflections. The cross-sectional area of the truss members is taken as a design
variable. Existing geometry and loading conditions of the truss are sized to mimic a real world environment.
Every attempt was made to adhere to both state and federal regulations.
The structural steel trusses was optimized using the design optimization tool as first order optimization method
in ANSYS and it is extended to compare for best suitable truss geometry for minimum weight. Mesh studies were
performed on all ANSYS finite element models to ensure solution convergence. A comparison of the trusses was made by
evaluating the minimum margin of safety in all truss members. To make a fair evaluation all trusses have identical
geometries and loading conditions. The intent is to compare which truss is more efficient when constructing a truss.
Finally it is concluded that Warren truss is showing high stiffness to weight ratio over other trusses after
optimization.
KEYWORDS: Warren Truss, Pratt Truss, Howe Truss, Steel, Optimization & Finite Element Method
Received: Apr 19, 2019; Accepted: May 09, 2019; Published: Jun 17, 2019; Paper Id.: IJMPERDAUG201911
INTRODUCTION
Structural design is a branch of Engineering that deals with systems comprised from a set of structural
members. These members may be characterized either truss or frame elements, connected by pinned or fixed joints.
Common structures include truss bridges, frame buildings, race car and airplane space frames, crane arms, and
power line truss towers. Structures may range in size from 1,450 ft. tall buildings weighing 222,500 tons down to
bicycle frames weighing less than 10 lb.
Structural optimization has become a valuable tool for engineers and designers in recent years. Although
it has been applied for over forty years, optimization in engineering has not been a commonly used design tool
until high performance computing systems were made widely available. Structures are becoming lighter, stronger,
and cheaper as industry adopts higher forms of optimization. This type of problem solving and product
improvement is now a crucial part of the design process in today’s engineering industry.
To better understand optimization of structures and the focus of this paper, two definitions must be stated.
The first definition is that of the structure, including all implications and capabilities in the static analysis of such
systems. The second definition applies to that of structural optimization, more specifically the optimization of size
Original A
rticle International Journal of Mechanical and Production Engineering Research and Development (IJMPERD) ISSN(P): 2249-6890; ISSN(E): 2249-8001 Vol. 9, Issue 4, Aug 2019, 99-110 © TJPRC Pvt. Ltd.
100 P. Satheesh Kumar Reddy & Ch. Nagaraju
Impact Factor (JCC): 7.6197 SCOPUS Indexed Journal NAAS Rating: 3.11
and shape. These two primary definitions will hold true for the entirety of this research and are derived from McGuire
(2000).
A structure is a set of nodes (vertices) that are connected by a set of elements (edges). This includes all plane (2D)
and space (3D) truss and frame structures. Loads may be placed at nodes to exert a force or moment on the structure.
Constraints may be placed at nodes to restrain the structure from translation or rotation caused by nodal loads. A valid
structure must constrain at least all six degrees of freedom as a system, and over constraint will generally produce stiffer
structures.
All elements are associated with a material defined by a minimum of two values: modulus of elasticity (E) and
Poisson’s ratio (µ). These values define the element’s behaviour under static linear elastic loading conditions.
Values used only for the optimization process include the element’s yield strength (σ) and unit weight (Kg) or mass density
(ρ). These values are used for stress limit comparison and structural mass, respectively.
Standard Form of the Optimal Design Problem
Design optimization seeks the best values of design variables, to achieve, within certain constraints, placed on the
system behaviour, allowable stresses, geometry, or other factors, its goal ofoptimality defined by a vector of objective
functions, for specified environmental conditions.
Mathematically, design optimization may be cast in the following standard form:
Statement of the Optimization Problem
An optimization or a mathematical programming problem can be stated as follows.
Find X = { x1 , x2 , x3,.......... xn } which minimizes f (X)
subject to the constraints
gj (X) ≤ 0, j = 1, 2, . . . , m
l j (X) = 0, j = 1, 2, . . . , p
where X is an n-dimensional vector called the design vector, f (X) is termed the objective function, and gj (X) and
l j (X) are known as inequality and equality constraints, respectively. The number of variables n and the number of
constraints m and or pneed not be related in any way. The problem stated in Equation is called a constrained optimization
problem. Some optimization problems do not involve any constraints andcan be stated as
Find X = { x1 , x2 , x3,.......... xn } which minimizes f (X)
Such problems are called unconstrained optimization problems
FORMULATION OF OPTIMIZATION PROBLEM
• Objective Function: Minimize Weight
Member weight = Length x Member cross-sectional area x density
Truss weight = ∑ �����������
Structural Optimization of Different Truss Members Using 101 Finite Element Analysis for Minimum Weight
www.tjprc.org SCOPUS Indexed Journal [email protected]
Design Constraints: Stress & Nodal
Direct stress < 125 MPa
Nodal displacement < 25 mm
• Design Variables : Members cross-sectional Area
Starting Point : 50000 sq.mm
TRUSSES AND THEIR GEOMETRIES
A truss bridge is a bridge whose load-bearing superstructure is composed of a truss, a structure of connected
elements forming triangular units. The connected elements (typically straight) may be stressed from tension, compression,
or sometimes both in response to dynamic loads. Truss bridges are one of the oldest types of modern bridges.
The basic types of truss bridges shown in this article have simple designs which could be easily analyzed by 19th and early
20thcentury engineers. A truss bridge is economical to construct because it uses materials efficiently. A truss is a simple
structure whose members are subject to axial compression and tension only and but not bending moment. The most
common truss types are Warren truss, Pratt truss and Howe truss. Warren truss contains a series of isosceles triangles or
equilateral triangles. To increase the span length of the truss bridge, verticals are added for Warren Truss. Pratt truss is
characterized by having its diagonal members (except the end diagonals) slanted down towards the middle of the bridge
span. Under such structural arrangement, when subject to external loads tension is induced in diagonal members while the
vertical members tackle compressive forces. Hence, thinner and lighter steel or iron can be used as materials for diagonal
members so that a more efficient structure can be enhanced. The design of Howe truss is the opposite to that of Pratt truss
in which the diagonal members are slanted in the direction opposite to that of Pratt truss (i.e. slanting away from the middle
of bridge span) and as such compressive forces are generated in diagonal members. Hence, it is not economical to use steel
members to handle compressive force.
Table 1: Existing and Allowable Data for Different Trusses
Design Parameters Warren Truss Howe Truss Pratt Truss Number of truss members 19 21 21 Max. Allowable Stress (MPa) 125 125 125 Max. Deflection (mm) 25 25 25 Total Weight of Truss members (kN) 14.45 16.71 16.75 No. of Joints 11 12 12 Cross sectional Area (Sq.mm) 50000 50000 50000
MATERIAL PROPERTIES
Most truss bridges are constructed out of structural steel but wooden truss bridges are not uncommon if the
loading is minimal. In bridge designs that utilize these materials the stresses are computed and then compared with a
material allowable. If the stress is too high a designer has only two choices. One is to increase cross sectional area and the
other is to redesign the geometry of the truss to more evenly distribute load. Each of these choices has unfortunate
tradeoffs. Increasing cross sectional area increases weight which adds additional loading the truss has to carry. It can also
cause other geometric problems which may violate the design parameters of the bridge. Redesigning the truss geometry
adds to the number of connections needed in the truss and possible points of failure. When these two options are not
available the designer has no choice but to go for optimization which can lead to the need for larger or smaller cross
102 P. Satheesh Kumar Reddy & Ch. Nagaraju
Impact Factor (JCC): 7.6197 SCOPUS Indexed Journal NAAS Rating: 3.11
sectional area.
The truss element is independent of the second moment of area therefore only the normal stresses are of main
concern. Circular cross sections are best for bearing normal stress however L-shape rolled sections are used in this study
due to their wide use and ease of joining and are taken as per AISC manual with material as per ASTM-A36; Modulus of
elasticity = 200 GPa, Poisson ratio = 0.29, Yield strength = 250MPa, Ultimate strength = 1930MPa and density = 7860
kg/m3. As factor of safety taken for the design is 2, hence allowable stress is 125MPa. Analysis and optimization is
performed using ANSYS software .
MODEL GEOMETRY, ELEMENT TYPE AND MESH
The CAD model of the truss was generated using nodes and elements in ANSYS. The members were modelled
with nodes joining. Figure 1 shows this CAD model how they are connected to get a nineteen bar Warren truss, twenty one
bar Pratt truss and twenty one bars Howe truss. The left end joints are pivoted and right end joints restrained in vertical
direction. The vertical loads acting downward are with magnitudes 200kN, 400kN and 500kN at the similar joints for all
trusses.
Warren Truss
Pratt Truss
Howe Truss
Figure 1: 2D ANSYS FEM Geometry
Structural Optimization of Different Truss Members Using 103 Finite Element Analysis for Minimum Weight
www.tjprc.org SCOPUS Indexed Journal [email protected]
Figure 2: LINK-1 2D Spar
Once the CAD model was created an element type was selected. LINK 1 for truss members was chosen as the
most appropriate elements for this analysis. Figure 2 shows a LINK 1 element.
LINK 1 is suitable for members with different area of cross sections as real constants
LOADS AND BOUNDARY CONDITIONS
Figure 3: (a) Warren Truss (b) Howe Truss (c) Pratt Truss
The steel truss material was defined as linear isotropic truss material. The inputs for the isotropic material are
elastic modulus and Poisson ratio. Loads were applied to the truss as per the free body diagram. The application point of
these loads was at the nodes connecting the beams of the truss. The boundary conditions were set such that the truss is
simply supported. This means that left node is fixed in space and right node is set as a pinned support. This translates to
restraining left node from movement in the x, y, and z direction as well as a rotationally constraining it around the x and y
axis. It also sets right node as restrained from movement in the y and z directions and the rotationally restrained are around
the x and y axis.
RESULTS
The results of applying the analysis methodologies detailed in the previous sections are presented in the following
section. Results of the different truss are presented along with optimization of each candidate member. The results of this
study will help choose the best truss for the real time loadings.
104 P. Satheesh Kumar Reddy & Ch. Nagaraju
Impact Factor (JCC): 7.6197 SCOPUS Indexed Journal NAAS Rating: 3.11
The results of the 2D FEM are nodal displacements and stresses in each member in the axial direction.
The distribution of stresses throughout this model did not vary significantly. Some of the members in compression and
some of the members in tension. The only difference was the magnitude of the stresses in each truss. A colour plot of the
2D finite element model axial stress results for all truss members are shown in Figures.
Structural Analysis of Pre and Post Optimization of Truss Members
It is identified before optimization warren truss is with maximum nodal displacement 1.7855 mm where as in
Pratt and Howe trusses are 2.264 and 2.224 mm respectively. After optimization maximum nodal displacement 18.99 mm
where as in Pratt and Howe trusses are 20.39 and 20.31 mm respectively. These values are not violated the design
constraint. This shows Warren truss is having high stiffness before optimization and after optimization. The difference in
nodal displacement magnitude between the models can be seen in the summary of results in Table 2. It is identified that
there are two zero force members in case of Pratt and one zero force member in case of Howe trusses which is not true in
case of Warren truss as before and after optimization. After optimization stress constraint is no were exceeded with factor
of safety 2 as shown in Table 3. It shows the real resistance of loads for Warren truss due to its geometrical structure is far
better than Pratt and Howe trusses.
Table 2: Nodal Displacements among Different Trusses in mm
Node Joint
Pre – Optimization Post - Optimization Warren Truss Pratt Truss Howe Truss Warren Truss Pratt Truss Howe Truss Ux Uy Ux Uy Ux Uy Ux Uy Ux Uy Ux Uy
1 0 0 0 0 0 0 0 0 0 0 0 0 2 0.056 -0.993 0.083 -0.960 0.083 -1.042 1.420 -10.21 1.185 -8.403 1.206 -9.615 3 0.224 -1.653 0.166 -1.753 0.250 -1.878 2.876 -16.95 2.370 -14.43 2.406 -16.73 4 0.447 -1.655 0.333 -2.184 0.460 -2.224 4.339 -16.94 3.574 -19.20 3.616 -20.31 5 0.610 -1.066 0.506 -1.848 0.670 -1.923 5.793 -10.23 4.779 -14.46 4.827 -16.74 6 0.712 0 0.643 -1.202 0.843 -1.239 7.229 0 5.978 -8.450 6.028 -9.608 7 0.650 -0.513 0.780 0 0.980 0 6.508 -5.53 7.176 0 7.226 0 8 0.537 -1.406 0.724 -0.960 0.723 -0.959 5.067 -14.03 5.994 -8.403 5.999 -8.408 9 0.342 -1.785 0.557 -1.837 0.640 -1.834 3.607 -18.99 4.790 -15.62 4.792 -15.61 10 0.149 -1.409 0.347 -2.264 0.473 -2.224 2.148 -14.02 3.579 -20.39 3.592 -20.31 11 0.016 -0.642 0.137 -1.884 0.300 -1.886 0.701 -5.570 2.368 -15.60 2.391 -15.59 12 -0.035 -1.202 0.163 -1.203 1.162 -8.450 1.193 -8.460
Table 3: Axial Stresses among Different Truss Members
Element Number
Pre – Optimization Post - Optimization Warren Truss
Pratt Truss Howe Truss Warren Truss
Pratt Truss Howe Truss
Axial stress (MPa)
Axial stress (MPa)
Axial stress (MPa)
Axial stress (MPa)
Axial stress (MPa)
Axial stress (MPa)
1 -9.0963 -11.785 -11.785 -119.84 -120.48 -120.47 2 4.68 8.3333 8.3333 118.36 118.51 120.65 3 9.0963 0 8.3333 119.84 0 120.65 4 -9.36 -16.667 -8.3333 -120.05 -120.42 -120.65 5 -9.0963 11.785 -11.785 -119.84 120.48 -120.47 6 14.04 8.3333 16.667 121.33 118.51 120 7 4.4315 -8.3333 4.3333 117.73 -118.51 112.5 8 -16.32 16.667 -16.667 -121.66 120.42 -120 9 -4.4315 6.1283 -6.1283 -117.73 118.55 -119.8 10 18.6 -21 21 121.9 -121.1 121.03
Structural Optimization of Different Truss Members Using 105 Finite Element Analysis for Minimum Weight
www.tjprc.org SCOPUS Indexed Journal [email protected]
Table 3 Contd., 11 -4.898 -8 0 -118.12 -118.45 0 12 -16.08 17.333 21 -121.63 120.54 121.03 13 4.898 5.1854 -5.1854 118.12 120.15 -117.21 14 13.56 -21 -17.333 121.22 -121.1 -120.19 15 -4.898 -3.6667 3.6667 -118.12 -113.32 114.87 16 -11.04 -17.333 17.333 -120.61 -120.54 120.19 17 4.898 5.1854 -5.1854 118.12 119.97 -117.22 18 8.52 13.667 -13.667 119.67 119.83 -119.8 19 -16.56 0 3.6667 -121.54 0 114.87 20 - -19.328 13.667 -121.84 119.8 -121.84 21 - 13.667 -19.328 119.83 -121.31 119.83
DISSCUSSION ON OPTIMIZED RESULTS OF TRUSSES
It is confirmed that optimized trusses are within the limits of design constraints, now it is require to analyze
cross-sections of all the members may not be same, which is not necessary since all the members are not in a position to
take heavy loads. Therefore, optimization tool in 2D ANSYS FEM was used to calculate optimum cross-sectional areas for
each and every truss member in reducing weight of truss and their by reducing loads at joints causing reduction in stress
levels. Area of cross-sections of all the members are taken as a design variables, allowable stress in the members are taken
as a state variables along with weight of each members as objective function. It is identified that there is a big drop in
weight of the truss and area of cross-sections making the truss optimized. The following graphs and figures show reduction
in structural weight in proportion with cross-sectional areas of individual members.
Warren Truss
Figure 4: Iteration Wise Reduction in Structural Weight and Area of Cross-Sections for Warren Truss Members
Figure 5: Optimized Cross-Sectional Area in Warren Truss Members with Existing 50000 Sq.Mm
106 P. Satheesh Kumar Reddy & Ch. Nagaraju
Impact Factor (JCC): 7.6197 SCOPUS Indexed Journal NAAS Rating: 3.11
Figure 6: Pre & Post Optimum Finite Element Model and Results Obtained for Warren Truss
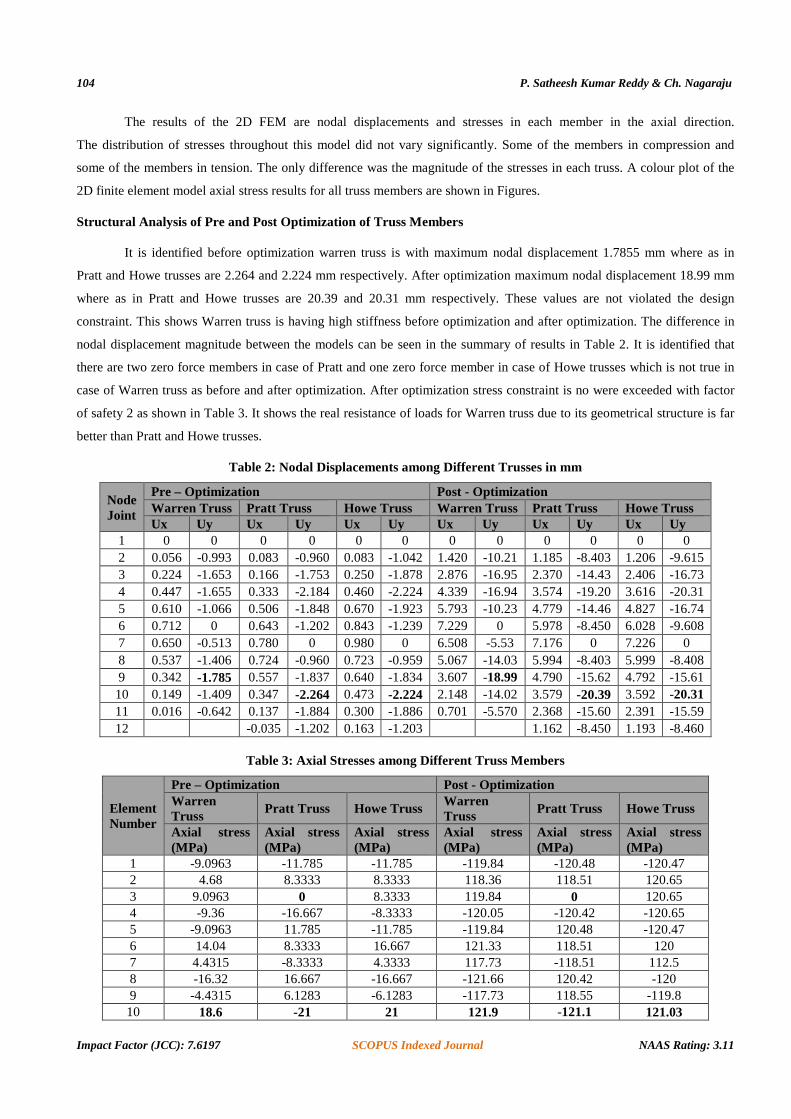
Pratt Truss
Figure 7: Iteration Wise Reduction in Structural Weight and Area of Cross-Sections for Pratt Truss Members
Figure 8: Optimized Cross-Sectional Area in Pratt Truss Members With Existing 50000 Sq.Mm
Structural Optimization of Different Truss Members Using 107 Finite Element Analysis for Minimum Weight
www.tjprc.org SCOPUS Indexed Journal [email protected]
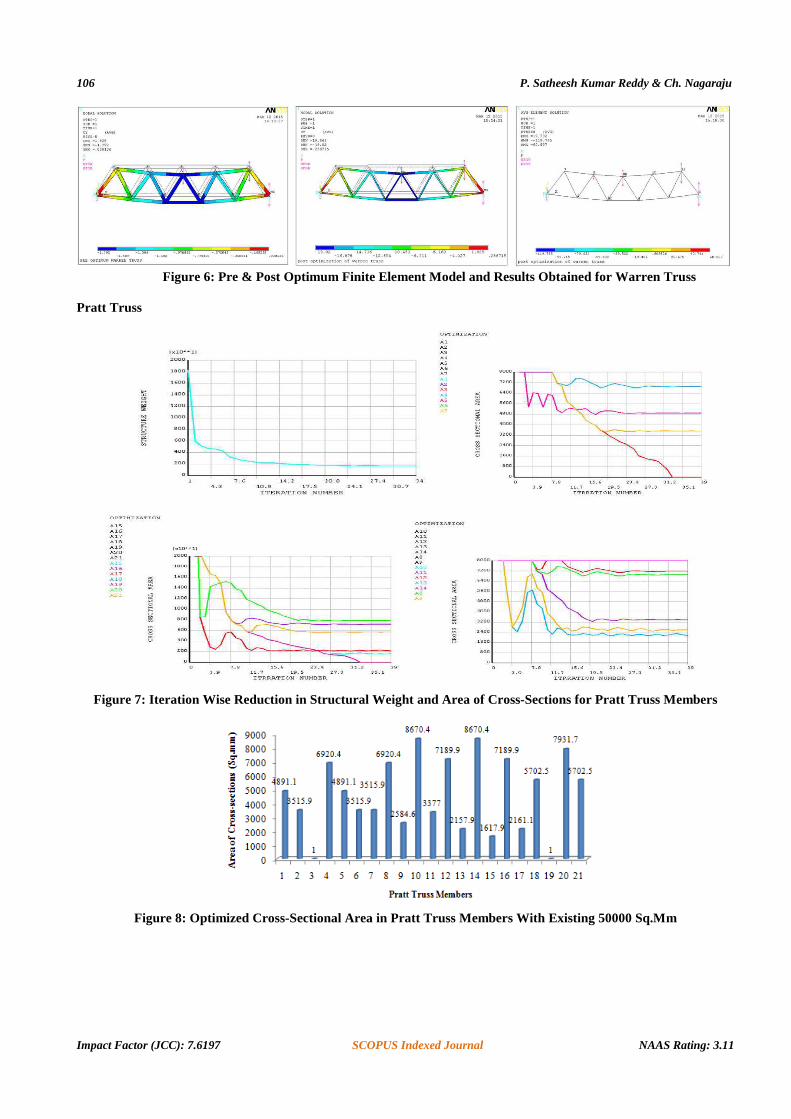
Figure 9: Pre & Post Optimum Finite Element Model and Results Obtained for Pratt Truss
Howe Truss
Figure 10: Iteration Wise Reduction in Structural Weight and Area of Cross-Sections for Pratt Truss Members
Figure 11: Optimized Cross-Sectional Area in Howe Truss Members with Existing 50000 Sq.Mm
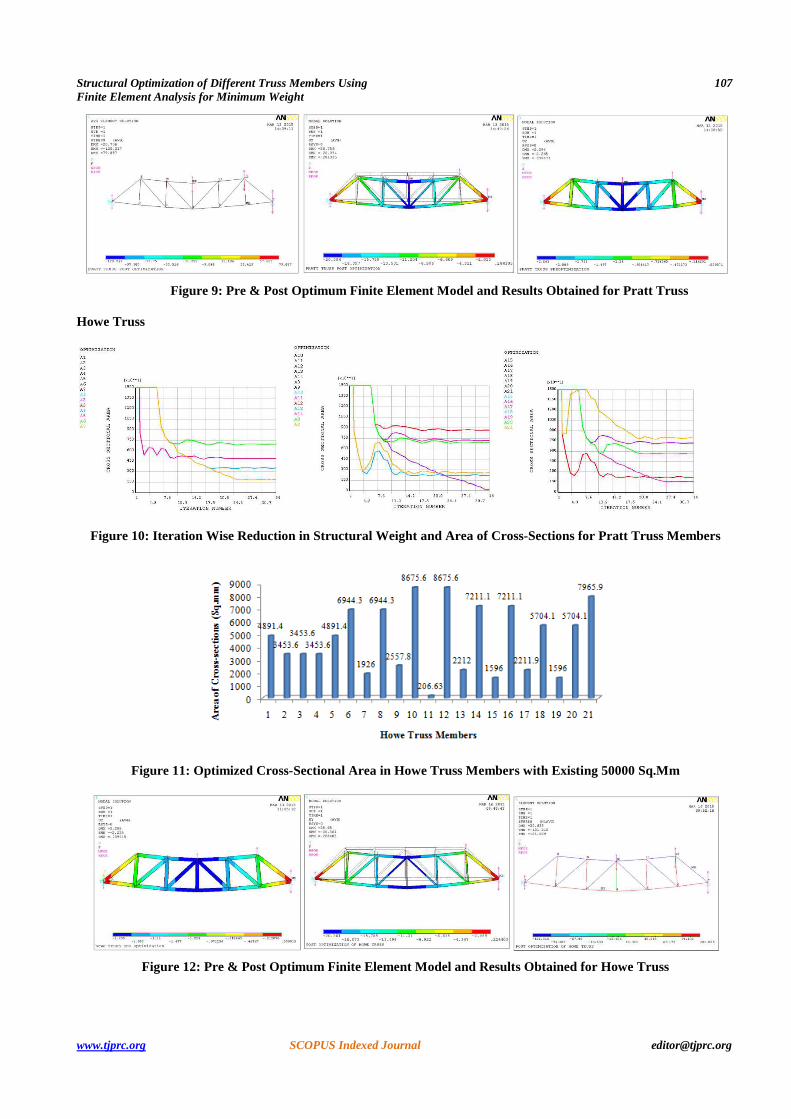
Figure 12: Pre & Post Optimum Finite Element Model and Results Obtained for Howe Truss
108
Impact Factor (JCC): 7.6197
MARGIN OF SAFETY (M.S)
The ultimate goal of using optimization for the construction of a truss bridge is achieving a lower weight structure
that has higher strength. Strength can be
safety is defined as in equation.
When the M.S. reaches a value less than or equal to
equal to the factor of safety. This factor is used to compare different trusses
computing the M.S in every member of every truss model for axial directi
M.S. in each truss is made. The truss with the highest M.S. is deemed the strongest and the one with the lowest is ranked as
the weakest. This results in a simple quantitative parameter to compare between each
Steel Truss Margin of Safety
The intermediate alloy ASTM
direction. The material allowable for this strength only varies wi
allowable for steel material in compression and tension.
Table
The maximum axial stress in each member as computed was compared to the appropriate tension or compression
material allowable. The member stresses used in this calculation can found in the previous
is shown in Table 5. It is identified that margin of safety is greater than one for all the members after optimization, and is
also greater than two for all the members with
Element Member
Warren trussStress
1 -119.842 118.363 119.844 -120.055 -119.846 121.337 117.738 -121.669 -117.7310 121.911 -118.1212 -121.6313 118.1214 121.2215 -118.1216 -120.61
P. Satheesh Kumar Reddy
Impact Factor (JCC): 7.6197 SCOPUS Indexed Journal
The ultimate goal of using optimization for the construction of a truss bridge is achieving a lower weight structure
that has higher strength. Strength can be quantified by calculating a margin of safety in each truss member. Margin of
When the M.S. reaches a value less than or equal to one the structure will fail. An alternate definition is that it is
equal to the factor of safety. This factor is used to compare different trusses and members among them
computing the M.S in every member of every truss model for axial direction. Then a comparison between the lowest axial
M.S. in each truss is made. The truss with the highest M.S. is deemed the strongest and the one with the lowest is ranked as
the weakest. This results in a simple quantitative parameter to compare between each truss model.
The intermediate alloy ASTM-A36 steel is an isotropic material. This means it has the same strength in every
direction. The material allowable for this strength only varies with the type of stress applied.
allowable for steel material in compression and tension.
Table 4: Allowable Stresses in Steel Material
ASTM-A36 Allowable (MPa) σty (Tensile) 250
σcy (Compressive) 250
The maximum axial stress in each member as computed was compared to the appropriate tension or compression
material allowable. The member stresses used in this calculation can found in the previous section
is identified that margin of safety is greater than one for all the members after optimization, and is
members with high factor of safety.
Table 5: Margin of Safety Calculations
Warren truss Pratt Truss HoweStress M.S Stress M.S Stress 119.84 2.09 -120.48 2.08 -120.47 118.36 2.11 118.51 2.11 120.65 119.84 2.09 0 --- 120.65 120.05 2.08 -120.42 2.08 -120.65 119.84 2.09 120.48 2.08 -120.47 121.33 2.06 118.51 2.11 120 117.73 2.12 -118.51 2.11 112.5 121.66 2.05 120.42 2.08 -120 117.73 2.12 118.55 2.11 -119.8 121.9 2.05 -121.1 2.06 121.03 118.12 2.12 -118.45 2.11 0 121.63 2.06 120.54 2.07 121.03 118.12 2.12 120.15 2.08 -117.21 121.22 2.06 -121.1 2.06 -120.19 118.12 2.12 -113.32 2.21 114.87 120.61 2.07 -120.54 2.07 120.19
Satheesh Kumar Reddy & Ch. Nagaraju
NAAS Rating: 3.11
The ultimate goal of using optimization for the construction of a truss bridge is achieving a lower weight structure
quantified by calculating a margin of safety in each truss member. Margin of
the structure will fail. An alternate definition is that it is
and members among them. This is done by
on. Then a comparison between the lowest axial
M.S. in each truss is made. The truss with the highest M.S. is deemed the strongest and the one with the lowest is ranked as
truss model.
A36 steel is an isotropic material. This means it has the same strength in every
th the type of stress applied. Table 4 details the material
The maximum axial stress in each member as computed was compared to the appropriate tension or compression
section. The resulting axial M.S.
is identified that margin of safety is greater than one for all the members after optimization, and is
Howe Truss M.S
2.08 2.07 2.07 2.07 2.08
2.08 2.22 2.08 2.09
2.07 ---
2.07 2.13 2.08 2.18 2.08
Structural Optimization of Different Truss Members Using 109 Finite Element Analysis for Minimum Weight
www.tjprc.org SCOPUS Indexed Journal [email protected]
Table 5 Contd., 17 118.12 2.12 119.97 2.08 -117.22 2.13 18 119.67 2.09 119.83 2.09 -119.8 2.09 19 -121.54 2.06 0 --- 114.87 2.18 20 -121.84 2.05 119.8 2.09 21 119.83 2.09 -121.31 2.06
WEIGHT REDUCTION IN TRUSSES
It is confirmed that optimized trusses are within high margin of safety or factor of safety, now it is require to
evaluate the weight of the structural members as well as trusses. The below Table 6 shows weight reduction during
iterations using optimization technique. Due to reduction in weight a lot of material can be saved which saves a lot of cost
during construction .The first row shows weight reduction of warren truss using 26 iterations and the weight is reduced
from 17471 kg to 1418kg.The second row shows weight reduction of Pratt truss using 39 iterations and the weight is
reduced from182367 kg to 1670 kg. The third row shows weight reduction of Howe truss using 34 iterations and the
weight is reduced from 18267 kg to 1676kg
Table 6: Weight Reduction and Convergence During Iterations
Iteration 35 36 37 38 39 40 41 Warren Converged... Pratt 1670.4 1673.1 1675.5 1670.5 1669.6 Converged... Howe Converged...
Figure 13: Weight Reduction With Iteration Number of Three Trusses
110 P. Satheesh Kumar Reddy & Ch. Nagaraju
Impact Factor (JCC): 7.6197 SCOPUS Indexed Journal NAAS Rating: 3.11
Figure 14: Pre And Post Optimum Weight of The Truss
Table 7: Saving in Weight Without Violating Design Constraint
Weight Saving in Kg Existing Truss Optimized Truss Saving in Weight Warren Truss 17,471 1,414 13,327 Pratt Truss 18,267 1,670 15,597 Howe Truss 18,267 1,676 16,691
CONCLUSIONS
• After the optimization Warren truss is with less weight compared to Pratt & Howe trusses for similar loading.
• It is identified that margin of safety is more or less equal in all trusses and also satisfied the design constraint.
• It is identified that nodal displacements at critical nodes are also more are less equal and in limits.
• It is identified that there are two zero force members in case of Pratt and one zero force member in case of Howe
trusses which is not true in case of Warren truss. It shows the real resistance of loads for Warren truss due to its
geometrical structure is far better than Pratt and Howe trusses.
• Construction of optimized 19-bar Warren truss is recommended when compared to Pratt & Howe trusses.
REFERENCES
1. Amaresh kumar D et al.,(2019), "FEA analysis and optimization of two-wheeler bike mono suspension system” International
Journal of Mechanical and Production Engineering Research and Development (IJMPERD) 2249-8001 Vol. 9, Issue 2, Apr
2019, 111-122.
2. Suraj et al., (2014) “Design, analysis and optimization of a multi-tubular space frame”, International Journal of Mechanical
and Production Engineering Research and Development (IJMPERD) Vol. 4, Issue 4, Aug 2014, 37-48.
3. M. Katoh N (2005), “Topology optimization of trusses with stress and local constraints on nodal stability and member
intersection by Ohsaki”, Structural and Multidisciplinary Optimization. Volume 29, issue 3. Pp. 190-197
4. Kalyanmoy. Gulati, Surendra (2000), “Design of Truss-Structures for Minimum Weight using Genetic Algorithms by Deb”,
Finite Elements in Analysis and Design. Volume 37, issue 5. Pp. 447-465.
5. Max Hultman (2010),” Weight optimization of steel trusses by a genetic algorithm”, Master’s Thesis, Lund University,
6. Panneerselvam, K., & Lenin, K. (2013). Study on hardness and micro structural characterization of the friction stir welded
Nylon 6 plate. Int J Mech Eng, 2, 51, 62.