32
WP/06/137 Structural Reforms in the Euro Area: Economic Impact and Role of Synchronization Across Markets and Countries Luc Everaert and Werner Schule

WP/06/137
Structural Reforms in the Euro Area: Economic Impact and Role of Synchronization
Across Markets and Countries
Luc Everaert and Werner Schule


© 2006 International Monetary Fund WP/06/137
IMF Working Paper
European Department
Structural Reforms in the Euro Area:
Economic Impact and Role of Synchronization Across Markets and Countries
Prepared by Luc Everaert and Werner Schule1
Authorized for distribution by Luc Everaert
June 2006
Abstract
This Working Paper should not be reported as representing the views of the IMF. The views expressed in this Working Paper are those of the author(s) and do not necessarily represent those of the IMF or IMF policy. Working Papers describe research in progress by the author(s) and are published to elicit comments and to further debate.
Using the IMF’s Global Economic Model, calibrated to the European Union, the effects of reform in product and labor markets are quantified for both a large and a small euro area economy. When markups in these markets are reduced, there are sizable long-term gains in output and employment. Most of these gains accrue to the reforming country regardless of whether reform takes place elsewhere; conversely, spillovers of reform elsewhere are limited.Labor and services market reforms have transitional costs as they induce a temporary decline in consumption, but raising competition in goods markets can mitigate some of these costs. Thus, coordinating the timing of reforms across markets is beneficial, and the more so the more open the reforming economy. In addition, synchronizing structural reforms across largecountries of the euro area could eliminate transition costs. Increased supply would allow monetary policy to ease without jeopardizing price stability objectives, though in practice uncertainty may prevent full accommodation. JEL Classification Numbers: C53; E52; F47 Keywords: Economic policy, econometric models, competition, markups, monetary policy Author(s) E-Mail Address: [email protected] , [email protected]
1 The authors are grateful for discussions with Douglas Laxton, Philippe Karam, Benjamin Hunt, and Michael Kumhof and comments from Igor Lebrun, Chantal Kegels, Jan van der Linden, Joost Verlinden, participants at the 2006 Scottish Economic Society Conference and at seminars at the French Ministry of Finance and the IMF. Susan Becker and Constanze Schulz-Calle La Rosa provided able assistance with data presentation and editing.

- 2 -
Contents Page
I. Introduction ............................................................................................................................3
II. Global Economic Model .......................................................................................................4 A. Brief Description.......................................................................................................4 B. Model Setup and Calibration.....................................................................................6 C. Markups in Labor and Product Markets..................................................................10 D. Scenarios .................................................................................................................12
III. Simulation Results .............................................................................................................13 A. Long-Run Effects of Structural Reforms ................................................................13 B. Transition Dynamics ...............................................................................................16 C. Synchronization of Reforms in the Euro Area ........................................................21
IV. Conclusions........................................................................................................................23
References................................................................................................................................24 Tables 1. Selected Calibration Parameters ............................................................................................8 2. Assumed Markups in Labor and Product Markets ..............................................................12 3. Long-Run Effects of Reducing Markups in Labor and Product Markets in France............14 4. Long-Run Effects of Reducing Markups in Labor and Product Markets in Belgium.........14 5. Synchronized Euro Area-Wide Structural Reform––Long-Run Impact .............................15 Figures 1. Country Size and Trade Relations .........................................................................................7 2. Structural Reform in France (Labor, Services, and Goods Markets....................................17 3. Structural Reform in Belgium (Labor, Services, and Goods Markets)................................18 4. Structural Reform in all Markets (Stand-Alone) .................................................................20 5. Structural Reform in all Markets (Euro Area-Wide) ...........................................................22 Appendix Tables A1. Increasing Competition in Labor and Product Markets in France ....................................27 A2: Increasing Competition in Labor and Product Markets in France and the Euro Area......28 A3. Increasing Competition in Labor and Product Markets in Belgium .................................29 A4: Increasing Competition in Labor and Product Markets in Belgium and the Euro Area...30

- 3 -
I. INTRODUCTION
Europe has been experiencing more than a decade of sluggish growth ascribed to a lack of flexibility in its product and labor markets. Prospects for higher growth are dim as population aging is expected to reduce the labor force. The solution to this economic challenge—structural reforms—has been well established (European Commission, 2005a; IMF, 2004; and OECD, 2006). In the EU, most goods and services market reforms are directed from the center, while labor market reform is a national matter. This setup follows from the historical focus on trade and capital flows as a source of European integration and the respect for the expression of national preferences in different labor market institutions. Consequently, the required labor market reforms differ considerably across countries, making coordination from the center unwieldy. Nonetheless, EU-driven efforts to foster labor market reform are being stepped up with the relaunched Lisbon strategy (European Commission, 2005b; Pisani-Ferry and Sapir, 2006; and Wanlin, 2006).
Conceptually, rigidities in labor and product markets can be modeled in a stylized manner by markups in the respective markets. Regulations and barriers to competition in product markets give firms market power, allowing them to charge customers a markup over costs. In the labor market, regulations (e.g., minimum wages, and employment protection) and institutions (e.g., centralized bargaining) prevent competitive forces from playing fully. Hence, the rents that firms extract in the product market are bargained over in the labor market and split between capital and labor. Blanchard and Giavazzi (2003) show in a theoretical model how a reduction in markups would raise output. They argue in favor of starting reforms with widespread product market deregulation as this would raise real wages and diminish the size of rents to be bargained over, thus lowering resistance to labor market reforms.
In this paper, the issue of labor and product market reforms in the EU is analyzed with the IMF’s Global Economy Model (GEM). The model is used to quantify the steady state effects of labor and product market reforms on key macroeconomic variables, investigate international spillovers, and explore transition costs and monetary policy implications for the euro area. GEM is well suited to do this (Bayoumi, 2004). It belongs to the class of large-scale, new open economy models with structural equations rooted in microeconomic theory. The model incorporates monopolistic competition in product and labor markets (specified through markups), frictions in the adjustment to shocks, and a fully specified monetary policy reaction function. Its multi-country dimension allows for a complete exploration of international linkages.
A number of features set this study apart from previous analysis of the impact of product and labor market reforms and applications of GEM. First, the model contains four country blocks within the EU: an individual economy of the euro area, the rest of the euro area, the non-euro area members of the EU15 (Denmark, Sweden, and the United Kingdom), and the group of 10 newly acceded countries. Second, the focus is on reform in a prototype large and small euro area country, here approximated by France and Belgium, respectively. This setup permits the quantification of spillovers and the discussion of the monetary policy reaction of the ECB. Third, the model uses recent joint estimates of markups in product markets and

- 4 -
bargaining power of unions from the literature, which differ from earlier, separate estimates of these parameters.
The findings that product and labor market reforms have sizable steady state effects on output, probably well above 10 percentage points, are consistent with earlier studies of reform in the EU using GEM (Bayoumi, Laxton, and Pesenti, 2004). The size of the effect depends in a nonlinear manner on the degree of pre-reform rigidity in the various markets. More flexible countries, which already have a relatively high level of per capita GDP, obviously have less room to reap benefits from reform, though possible gains are still substantial (e.g., for Denmark by Hunt, 2004; and for Finland by Luna, Lutz, and Stavrev, 2005). Steady state spillovers of reforms are modest because supply and demand in the reforming country rise broadly proportionally. Similar results were obtained in a study of combined fiscal adjustment and productivity-enhancing reforms for Japan (Batini, N’Daye, and Rebucci, 2005). While all reforms are welfare-enhancing, labor market reforms are associated with lower steady-state real wages, whereas product market reforms are associated with higher real wages.
Transition dynamics are important. Traded goods market reforms alone have immediate positive effects on output, wages, and welfare, while labor market reforms alone lead to output gains and a decline in real wages. Synchronizing the timing of product and labor market reforms would mitigate the downward effect on real wages. Services sector reforms alone boost real wages but are likely to have a temporary negative effect on consumption and output. For a small euro area economy, reforming labor and product markets concurrently may be sufficient to avoid a decline in real wages, consumption, and output below baseline. For a large euro area economy, this is unlikely as it is more difficult for such a country to sell additional output abroad without a decline in price. Synchronization of reforms among euro area economies would modify this result as it brings into play monetary policy. To the extent that reforms boost potential output significantly for the entire euro area, monetary policy could be eased, thereby eliminating transition costs.
The remainder of the paper is structured as follows: Section II provides a brief description of GEM and discusses its setup and calibration with particular attention to the markups in labor and product markets. It also describes the scenarios that will be conducted. Section III presents the simulation results of increasing competition in labor, goods (traded), and services (nontraded) markets, both in terms of steady state effects and transition dynamics. It assesses spillover effects and the interaction with monetary policy in the euro area. Section IV concludes.
II. GLOBAL ECONOMIC MODEL
A. Brief Description
The IMF’s GEM is a large-scale version of the class of new open-economy macroeconomic models, incorporating international economic linkages (Bayoumi, 2004). These models merge microeconomic foundations with sticky prices, nominal rigidities, trade, and international financial markets. With GEM based on optimizing consumers and producers, it has a comparative advantage to analyze the impact of structural changes. Indeed, traditional

- 5 -
large-scale macroeconomic models conduct policy analysis with reduced-form equations, which is problematic when structural changes modify underlying behavior (Lucas, 1976). Exactly this happens when markets are deregulated and competition increases. Such reforms change behavior, which in turn affects a wide range of relationships in the model. For example, when labor union bargaining power is reduced, output increases and the real exchange rate depreciates as more output needs to be sold to the rest of the world. The effect on output will depend on the elasticity of the response of hours worked to the change in the wage as well as on the degree of substitutability between domestic and foreign produced goods. All these parameters are explicitly identified in GEM.
GEM comprises firms, which produce goods, households, which consume and supply labor and capital to firms, and a public sector, which taxes and spends. The model uses standard functional forms, which allows firms and consumers to be aggregated as if they were a representative entity. Firms produce goods with constant elasticity of substitution production functions using labor, capital, and intermediate foreign and domestically-produced inputs. Goods are differentiated, conveying market power onto firms. Capital, intermediates, and final traded goods are freely traded, while labor is immobile. Households decide how to allocate their time between work and leisure. They supply differentiated labor in a monopolistic manner, thus exerting limited bargaining power. Households own firms and receive all income, which they allocate between domestic- and foreign-produced goods with a constant elasticity of substitution utility function. This setup allows for home bias both in production and consumption. A portion of households does not have access to financial markets.
There are four types of “goods”: consumption and investment goods, which are either traded (goods) or nontraded (services). Production takes place in two stages and is followed by distribution. In a first step, capital and labor are combined (using CES technology) to produce intermediate traded or nontraded goods, which are used as inputs in the production of final goods or exported. Intermediate production takes place under monopolistic competition, allowing firms to charge markups over production costs. In a second step, perfectly competitive firms combine domestically-produced and imported intermediate goods, again using CES technology (allowing for home bias), to produce investment and consumption goods for final demand.
Adjustment costs for nominal and real variables enable GEM to mimic the typical hump-shape reaction of macroeconomic variables to shocks observed in reality. There are adjustment costs to the capital stock and the level of imports and there is habit persistence in consumption and hours worked. Realistic dynamics require a fairly strong habit persistence, while a high intertemporal elasticity of substitution ensures reasonable fluctuations in real interest rates. Sticky prices are modeled through adjustment costs for wages and prices of domestic goods and imports. The adjustment costs have been calibrated to fit evidence from estimated vector autoregressions, but overall GEM responses tend to be somewhat faster.
The tight theoretical structure of GEM imposes limitations. For example, representative consumers are infinitely lived, which precludes consideration of income distribution effects. A large number of parameters needs to be specified but not all of them are available as some of the concepts in the model do not dovetail with existing data. For example, it is not

- 6 -
straightforward to split output into the types of goods considered in the model. Hence, calibration of a baseline is a time-consuming process. Efforts to implement Bayesian estimation of the model parameters are still at too early a stage to be applied here.
B. Model Setup and Calibration
In the version of GEM used here, the world is confined to the EU and split into four blocks: the individual euro area country under consideration, the rest of the euro area (EA), the group of three non-euro area EU15 members (RE (Rest of EU15)––Denmark, Sweden, and the United Kingdom), and the group of the ten new member states (NMS). There are two setups, one for a large euro area country, approximated by France, and one for a small euro area country, approximated by Belgium.
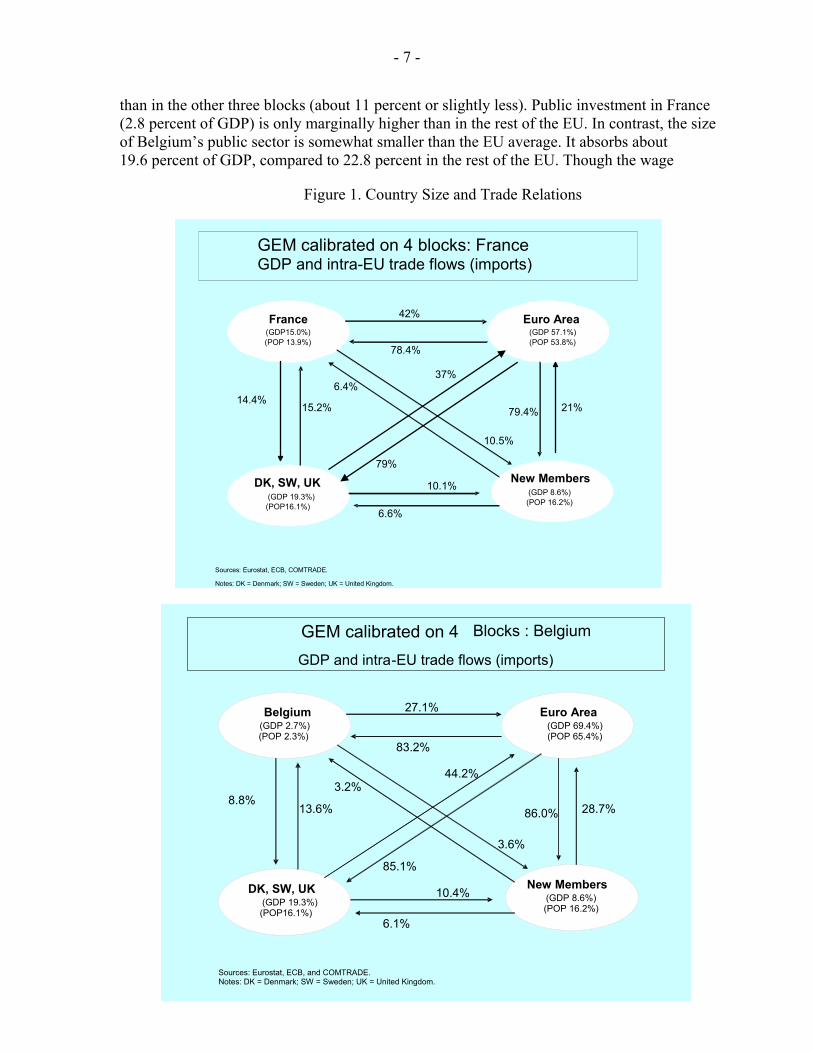
GEM needs to be calibrated to represent country-specific economic relations. Country-specific parameters are derived from the national accounts and trade statistics (Figure 1). The population and real GDP (in purchasing power parity) shares of the four specified blocks sum to 100 percent. Trade (in percent of GDP) covers intra-EU flows only. Therefore, the four blocks appear less open than they are in reality, and the spillover effects are limited to those that benefit EU members.2 Overall trade shares cover goods and services, while the geographic orientation and sector composition are based on trade in goods only.3 It is assumed that bilateral services trade flows are proportional to trade in goods. For France, this assumption appears to be relatively innocuous, but for Belgium, it may introduce a small bias as Belgium is a highly service-oriented economy and the geographical distribution of services trade may not fully match that of trade in goods. In addition, due to its geographical location, transit trade is much more important for Belgium than for the other blocks. In order not to overestimate the economy’s openness, this trade (estimated at 55 percent of total) was excluded.4
The size of the public sector is a factor which helps determine the share of nontraded goods in GDP and the role of competitive markets. The public sector is larger in France than in the other country blocks. It absorbs about 26.2 percent of GDP, compared to 21.5 percent in the rest of the EU.5 The cross-country difference is due to public consumption, and, more importantly, to the public sector wage bill, which is higher in France (13.9 percent of GDP)
2 Bayoumi, Laxton, and Pesenti (2004) estimate spillovers from the euro area to the rest of the world, which provide a benchmark for the degree of underestimation of spillover effects due to the reduced-openness assumption. They estimate jont labor and product market reforms in the euro area to yield 12.4 percentage points of output with a spillover effect on the rest of the world of 0.8 percentage point of output.
3 Trade flows are based on the UN COMTRADE statistics. For the sake of simplicity, the commodities sector was excluded from this version of GEM.
4 This estimate is approximate. It was guided by the observation that according to input-output tables, about 45 percent of final domestic demand consists of imports (Avonds, 2005, Table 47).
5 The resource allocation to the public sector is based on national accounts data (WEO database, 2004). It does not include interest payments and transfers.
- 7 -
than in the other three blocks (about 11 percent or slightly less). Public investment in France (2.8 percent of GDP) is only marginally higher than in the rest of the EU. In contrast, the size of Belgium’s public sector is somewhat smaller than the EU average. It absorbs about 19.6 percent of GDP, compared to 22.8 percent in the rest of the EU. Though the wage
Figure 1. Country Size and Trade Relations
France(GDP15.0%) (POP 13.9%)
Euro Area (GDP 57.1%) (POP 53.8%)
DK, SW, UK (GDP 19.3%) (POP16.1%)
New Members (GDP 8.6%) (POP 16.2%)
42%
21%
37%
79%
14.4%
6.6%
79.4%
78.4%
10.1%
10.5%
6.4%
15.2%
GEM calibrated on 4 blocks: France GDP and intra-EU trade flows (imports)
Sources: Eurostat, ECB, COMTRADE. Notes: DK = Denmark; SW = Sweden; UK = United Kingdom.
Belgium (GDP 2.7%) (POP 2.3%)
Euro Area (GDP 69.4%)(POP 65.4%)
DK, SW, UK (GDP 19.3%)(POP16.1%)
New Members (GDP 8.6%)(POP 16.2%)
27.1%
28.7%
44.2%
85.1%
8.8%
6.1%
86.0%
83.2%
10.4%
3.6%
3.2%
13.6%
GEM calibrated on 4 Blocks : Belgium
GDP and intra-EU trade flows (imports)
Sources: Eurostat, ECB, and COMTRADE. Notes: DK = Denmark; SW = Sweden; UK = United Kingdom.

- 8 -
bill (12.2 percent) is slightly higher than in the other three blocks, total public consumption is marginally lower. Public investment (1.6 percent of GDP) is noticeably smaller.
Behavioral parameters were taken from the relevant literature, some of which are invariant across countries, and others have been modified when country-specific information has suggested it.6 The approach in this paper has been to be parsimonious with differences across blocks and countries, particularly between Belgium and France, which are geographically and culturally very close. Hence, all key elasticities of substitution, the discount factor, and habit persistence have been specified at the same value for all blocks (Table 1). Spillover effects of reforms in one country to the rest of the EU are inversely related to the degree of import substitution. The elasticity of substitution between imports and domestic production was set at 2.5, but a sensitivity test with respect to this parameter will be conducted.
The elasticity of labor supply with respect to wages is essential in determining the magnitude of the response of hours worked to labor market reforms. Estimates of this elasticity vary a great deal in the literature depending on the methodology followed and the sample considered. This elasticity is typically found to be low for those who are employed in permanent full-time jobs and relatively high for those in other types of jobs. Based on a recent metaregression (Evers, De Mooij, and Van Vuuren, 2005), this parameter is here set
6 See Bayoumi, Laxtion , and Pesenti (2004) for the calibration details. This paper follows in their footsteps.
Belgium France EA RE NMS
ParametersElasticities of substitution
Intertemporal consumption elasticity 3.00 3.00 3.00 3.00 3.00Labor supply elasticity (Frisch) 0.33 0.33 0.33 0.33 0.33Capital-labor substitution 0.80 0.80 0.80 0.80 0.80Tradables and nontradables 0.50 0.50 0.50 0.50 0.50Domestic tradables and imports 2.50 2.50 2.50 2.50 2.50
Home biasConsumption goods 1/ 0.38 0.34 0.20/0.13 0.61/0.58 0.11/0.14Capital goods 1/ 0.49 0.28 0.18/0.09 0.59/0.57 0.04/0.05
Liquidity-constrained consumers (share) 0.35 0.35 0.45 0.25 0.55Discount rate (1.03-0.25) 0.993 0.993 0.993 0.993 0.993
Habit persistenceConsumption 0.91 0.91 0.91 0.91 0.91Labor supply 0.80 0.80 0.80 0.80 0.80
Country size (population share) 1/ 2.3 13.9 65.4/53.8 16.1 16.2
1/ The first number reflects calibration for Belgium, the second for France.
Notes: EA = Euro Area; RE = Rest of EU15; NMS = New Member States.
Table 1. Selected Calibration Parameters

- 9 -
at 0.33.7 Estimates of this parameter appear to be quite similar across countries. A recent study for Belgium indicates the overall value of this elasticity to be 0.3, though only 0.12 for men only (Konings, 2005). A sensitivity analysis will be conducted.
Home bias parameters are related to the size of the economy, its openness to trade, and the elasticity of substitution between imported and domestically-produced goods in the CES production and consumption functions. GEM computes the summary parameters on the basis of assumed elasticities and actual data on trade. These parameters can be interpreted intuitively as follows: for example, in the case of Belgium, the bias for domestically-produced goods over imported traded consumption goods is 0.38. This implies that Belgian consumers demand about 38 percent more goods produced at home compared to a situation of indifference (zero bias) between home and foreign-produced traded goods. Zero bias is defined as the case in which the share of home-produced traded goods is the same as the relative size of the economy in the world.
While the preferences of households are similar, part of consumption is subject to liquidity constraints. This feature allows the model to deviate from Ricardian equivalence. Estimates of the share of liquidity-constrained consumers—which is not exactly the same as liquidity-constrained consumption, the concept used in GEM—vary a great deal depending on the methodology used and period studied and do not seem to be robust (Fernandez-Corugedo and Price, 2002). Campbell and Mankiw (1991) estimated this fraction at between 40 and 50 percent for the United States, while Weber (2000) could not reject the hypothesis that there were no “rule-of-thumb” or liquidity-constrained consumers. Iacoviello (2004) estimates the amount of consumption subject to liquidity constraints to be between 20 and 25 percent for the United States, a figure close to what is used in other simulations.8
Consequently, the share of liquidity-constrained consumers for the financially most advanced countries (Denmark, Sweden, and the United Kingdom) was set at 25 percent. For the euro area, estimates for individual countries ranged between 20 and 60 percent (Roeger and in ‘t Veld, 1997). It was assumed that Belgium and France do somewhat better than average as they have relatively deep financial markets, with a share of 35 percent of consumers liquidity constrained, and the rest of the euro area somewhat worse with a share of 45 percent. For new member states, the share was set at 55 percent, in line with estimates by Coricelli, Mucci, and Revoltella (2005). The sensitivity of the results to these assumptions will be explored.
Nominal and real rigidities in GEM produce realistic dynamic adjustment patterns. EU economies are characterized by relatively strong real rigidities, relatively high adjustment cost in the investment equations, and strong habit persistence in consumption, combined with a high intertemporal elasticity of substitution. There is also habit persistence in labor supply. 7 This metaregression (using 239 elasticities from 32 empirical studies) predicts the elasticity for men to be 0.1 or 0.2 depending on model specification and for women 0.5. Here, the average is taken, assuming equal numbers of men and women at the margin.
8 Roeger and in ‘t Veld (1997) impose 30 percent for all countries in the world for simulations with QUEST.

- 10 -
Once the degree of real rigidities has been set, adjustment costs in price and wage equations are calibrated to reproduce realistic sacrifice ratios (2.2 in France, 2.1 in Belgium and the rest of the euro area, 1.4 in the RE block, and 1.6 in the NMS block).9
In GEM, monetary policy authorities are forward-looking and assumed to target inflation. Following Orphanides (2003),10 the interest rate rule, which nests a variety of policy strategies, is specified as follows for each of the blocks:
exp exp1 1 1 2 3 3 3 4 1(1 )t nat t t t ti i i gap gapα α α π α α− + + −= − + + + ∆ +
where i is the nominal interest rate, inat the natural interest rate, π inflation and gap the output gap. For all blocks, the inflation target is set at 2 percent. For the euro area, the ECB sets monetary policy on the basis of area-wide indicators. Hence, nominal interest rates in France and Belgium are determined by the ECB. France’s (Belgium’s) inflation and its output gap enter the ECB rule with the weight of its GDP in the euro area. With the euro as its currency, fluctuations in France’s (Belgium’s) nominal effective exchange rate are limited. Consequently, changes in relative prices between traded and nontraded goods, or the real effective exchange rate, take the form of inflation differentials and result in important cross-country variations in the real interest rate after shocks.
Fiscal policy is modeled through a fiscal rule, which ensures debt sustainability in the long run. Tax rates on labor adjust automatically so that public debt approaches a target level. For the purpose of the simulations in this paper, the level of public debt is kept constant at the last historical observation. The tax rate on capital is fixed at 10 percent. Hence, fiscal policy is essentially passive. However, if structural reforms improve the tax base, the tax rate on labor is allowed to decline with positive feedback effects on the labor market.
C. Markups in Labor and Product Markets
Markups are a key feature of GEM, used to reflect imperfect competition in product and labor markets. Each product is made by one monopolistic firm, which sets a markup over costs. However, there is a very large number of firms offering (a continuum of) diverse products and services that are imperfect substitutes. The elasticity of substitution of demand between products of different firms determines the market power of each firm, which sets prices subject to the risk of losing marking shares so as to maximize profits:
Pricet = markupt * marginal costt or /( 1)*t tp mcθ θ= − 11
9 Estimates of sacrifice ratios, the cumulated output costs of reducing inflation permanently by 1 percentage point, are often higher than these values, but they might reflect slow learning by central banks during the transition from a high to a low inflation environment.
10 See also WEO April 2005, Annex 3.3 to Chapter III.
11 This simple formula ignores adjustment costs. An elasticity of substitution of 5 translates into a markup of 1.25 (25 percent). The markup goes to 0 only if all products are perfect substitutes.

- 11 -
where θ is the elasticity of substitution. The setup in the labor market is analogous. Each worker offers a specific kind of labor services that is an imperfect substitute for services offered by other workers. The lower the degree of substitutability, because of skill differences, anti-competitive regulation or other factors, the higher will be the markup, and the lower employment in terms of hours.
In GEM, these markups are modeled by a single parameter in each of the markets. Modifying these markup parameters can simulate the impact of structural reforms that raise competition in product and labor markets. The simplicity of this relation makes the analysis tractable, but admittedly comes at the expense of being agnostic about specific reasons for imperfect competition. Nonetheless, the model is nonlinear so that the effect of reforms per “unit” of reform is larger the further the markup is away from the target of the simulation.
Empirical estimates show significant markups in product and labor markets for most countries. Traditionally, estimates of markups were made separately for product and labor markets respectively (Oliveira, Martins, Scarpetta, and Pilat, 1996; and Jean and Nicoletti, 2002). However, there is theoretical justification (Blanchard and Giavazzi, 2003) and abundant empirical evidence of a positive relation between goods market rents and wage premia over market clearing wages.12 Recent joint estimates of product market markups and bargaining power by labor indicate much higher product market markups than traditional estimates, which omitted the part of the firm’s rent captured by workers. Workers’ rents can assume various forms: wage premia, higher nonwage benefits, and more favorable general work conditions. All of them raise the cost of labor per unit of output. Workers’ bargaining power depends on labor market institutions, such as legal job protection, union strength, the generosity of unemployment assistance, minimum wages, the size of the public sector, and political support. Hence, the model was calibrated with product markups from such joint estimates (Table 2). Estimates of wage bargaining power from Dumont, Rayp, and Willemé (2005) and Crépon, Desplatz, and Mairesse (2002) were transformed into wage markups, thus ensuring a consistent approach.13
12 Jean and Nicoletti (2002); Saint-Paul (2004); Crépon, Desplatz, and Mairesse (2002); Dobbelaere (2005); Konings, Van Cayseele, and Warzynski (2001).
13 The wage markup is defined as the ratio of the wage under bargaining and the wage under perfect competition. This ratio can be computed as 1+bargaining power*(1/labor share-1), with bargaining power between 0 and 1, defined as in Crépon, Desplatz, and Mairesse (2002).
- 12 -
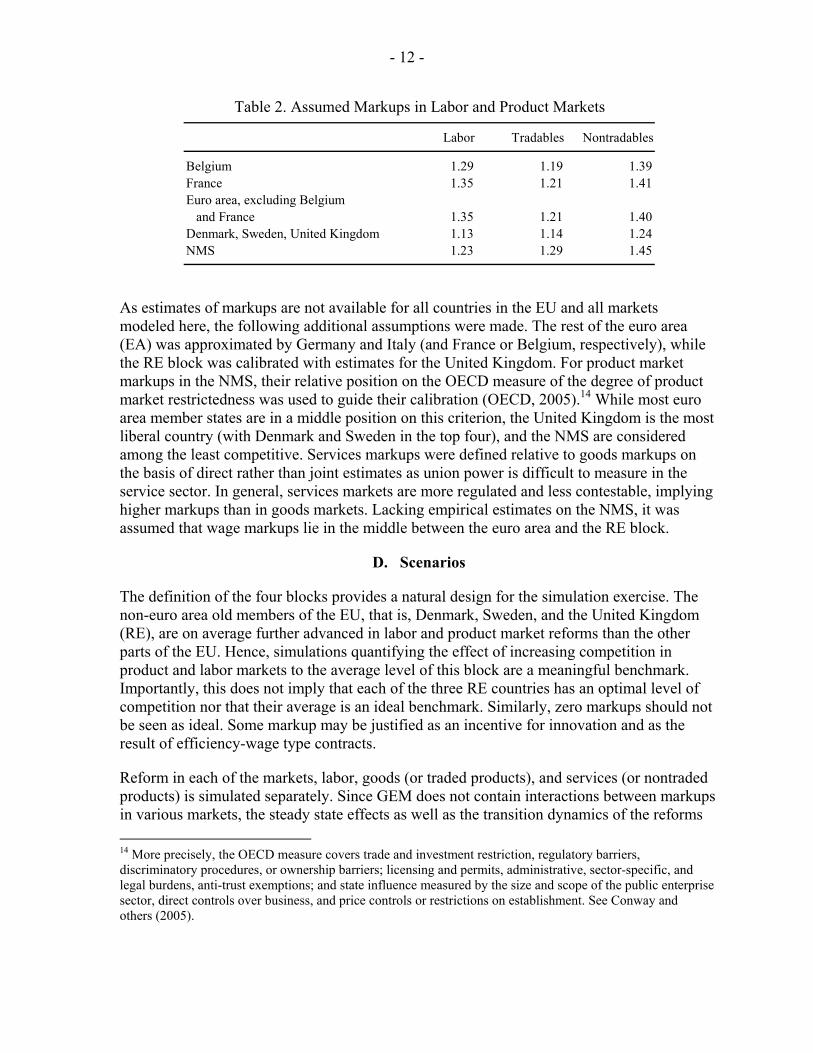
As estimates of markups are not available for all countries in the EU and all markets modeled here, the following additional assumptions were made. The rest of the euro area (EA) was approximated by Germany and Italy (and France or Belgium, respectively), while the RE block was calibrated with estimates for the United Kingdom. For product market markups in the NMS, their relative position on the OECD measure of the degree of product market restrictedness was used to guide their calibration (OECD, 2005).14 While most euro area member states are in a middle position on this criterion, the United Kingdom is the most liberal country (with Denmark and Sweden in the top four), and the NMS are considered among the least competitive. Services markups were defined relative to goods markups on the basis of direct rather than joint estimates as union power is difficult to measure in the service sector. In general, services markets are more regulated and less contestable, implying higher markups than in goods markets. Lacking empirical estimates on the NMS, it was assumed that wage markups lie in the middle between the euro area and the RE block.
D. Scenarios
The definition of the four blocks provides a natural design for the simulation exercise. The non-euro area old members of the EU, that is, Denmark, Sweden, and the United Kingdom (RE), are on average further advanced in labor and product market reforms than the other parts of the EU. Hence, simulations quantifying the effect of increasing competition in product and labor markets to the average level of this block are a meaningful benchmark. Importantly, this does not imply that each of the three RE countries has an optimal level of competition nor that their average is an ideal benchmark. Similarly, zero markups should not be seen as ideal. Some markup may be justified as an incentive for innovation and as the result of efficiency-wage type contracts.
Reform in each of the markets, labor, goods (or traded products), and services (or nontraded products) is simulated separately. Since GEM does not contain interactions between markups in various markets, the steady state effects as well as the transition dynamics of the reforms 14 More precisely, the OECD measure covers trade and investment restriction, regulatory barriers, discriminatory procedures, or ownership barriers; licensing and permits, administrative, sector-specific, and legal burdens, anti-trust exemptions; and state influence measured by the size and scope of the public enterprise sector, direct controls over business, and price controls or restrictions on establishment. See Conway and others (2005).
Labor Tradables Nontradables
Belgium 1.29 1.19 1.39France 1.35 1.21 1.41Euro area, excluding Belgium
and France 1.35 1.21 1.40Denmark, Sweden, United Kingdom 1.13 1.14 1.24NMS 1.23 1.29 1.45
Table 2. Assumed Markups in Labor and Product Markets

- 13 -
are largely additive. Reforms are also considered whether they are implemented in stand-alone fashion by France or Belgium, respectively, or synchronized with the rest of the euro area. These sets of simulations permit an assessment of the merits of synchronizing reforms across markets and across countries.
Reforms are implemented through a gradual reduction in markups in labor and product markets to the level of the RE block. More specifically, markups in labor and goods markets are reduced over a period of five years, while in the services sector, deregulation is assumed to progress slower, taking ten years. In the model, agents have perfect foresight, thus eliminating any uncertainty about the nature and path of these reforms.
III. SIMULATION RESULTS
A. Long-Run Effects of Structural Reforms
The simulated overall gains from more competition in labor and product markets are substantial in terms of GDP, employment, and consumption (Tables 3 and 4 and Appendix). Once the adjustment to reform in all markets is complete, real GDP would be about 16 percent above the baseline in France and about 11 percent in Belgium. The difference between these two outcomes is due to the different starting point of the two economies, with France somewhat further away from the benchmark RE block, particularly in the labor market. The capital stock would rise very substantially (22 and 16 percent, respectively) and hours worked would also rise, but by less (15 and 10 percent, respectively). The increase in consumption (13 and 9 percent respectively) is smaller than the gain in GDP, because resources need to be diverted to investment to maintain a higher capital stock.
Increasing competition in each market separately yields significant, though varying, gains in GDP and employment. Comparing the effects of reforms across markets is not straightforward. The impact depends on the magnitude of the reform (i.e., the distance from the benchmark) as well as the elasticity of output and employment to changes in relative prices. Further, the relationship between the elasticity of substitution across different products and labor inputs and respective markups is convex. Hence, reforms in the traded sector, where markups are small and not very different across blocks, do not yield large gains. Reform in the nontraded (services) sector yields larger effects in France than in Belgium, in part because the starting markup is slightly higher but also because the sector has a much larger weight in GDP.
Complementarities between labor market reform on the one hand and goods and services market reforms on the other hand are important. When implemented in isolation, labor market reform raises output and consumption by broadly the same amount, but hours worked go up more than proportionally and the capital stock less than proportionally. Moreover, real wages remain permanently below baseline because goods and services prices do not decline in proportion with wages, as firms increase rents and limit the expansion of output. On the other hand, product market reforms raise the capital stock sharply, triggering

- 14 -
Real GDP Consumption Hours Worked Capital Stock
Labor market 6.1 6.1 6.7 5.9 Labor supply elasticity (Frisch) 0.165 3.4 3.4 3.7 3.2 Share of liquidity-constrained consumers 0.25 7.5 7.5 8.2 7.2 Trade elasticity 1.005 4.0 3.9 5.6 3.3
Services 7.3 5.1 6.2 10.1 Labor supply elasticity (Frisch) 0.165 4.5 2.4 3.1 7.3 Share of liquidity-constrained consumers 0.25 7.3 5.1 6.2 10.1 Trade elasticity 1.005 4.2 2.9 3.8 5.8
Goods 1.6 1.3 1.4 4.9 Labor supply elasticity (Frisch) 0.165 1.0 0.7 0.7 4.3 Share of liquidity-constrained consumers 0.25 1.6 1.3 1.4 4.9 Trade elasticity 1.005 0.7 0.3 1.3 4.0
All markets simultaneously 16.0 13.1 15.0 22.5
Tradables markup 1.1 12.5 9.9 11.4 17.0 Labor supply elasticity (Frisch) 0.165 9.3 6.6 7.7 15.7 Share of liquidity-constrained consumers 0.25 17.3 14.4 16.4 23.7 Trade elasticity 1.005 9.3 7.2 10.9 13.8
1/ Markups were reduced by 22 percentage points in labor markets, 17 percentage points in nontradables, and 7 percentage points in tradables.
Table 3. Long-Run Effects of Reducing Markups in Labor and Product Markets in France 1/(Deviations from baseline in percent)
Real GDP Consumption Hours Worked Capital Stock
Labor market 4.5 4.5 5.0 4.4 Labor supply elasticity (Frisch) 0.165 2.5 2.5 2.8 2.5 Share of liquidity-constrained consumers 0.25 5.7 5.6 6.2 5.5 Trade elasticity 1.005 3.2 3.1 4.7 2.9
Services 4.9 3.4 3.9 6.8 Labor supply elasticity (Frisch) 0.165 3.1 1.7 2.0 5.1 Share of liquidity-constrained consumers 0.25 4.9 3.4 3.9 6.8 Trade elasticity 1.005 4.6 3.2 3.8 6.6
Goods 1.2 1.0 1.0 4.2 Labor supply elasticity (Frisch) 0.165 0.8 0.5 0.5 3.8 Share of liquidity-constrained consumers 0.25 1.2 1.0 1.0 4.2 Trade elasticity 1.005 0.3 0.0 0.8 3.1
All markets simultaneously 10.8 9.0 10.0 15.6
Tradables markup 1.1 9.4 7.9 8.9 11.2 Labor supply elasticity (Frisch) 0.165 6.4 4.7 5.2 11.2 Share of liquidity-constrained consumers 0.25 12.0 10.2 11.3 16.8 Trade elasticity 1.005 8.2 6.4 9.4 12.5
1/ Markups were reduced by 16 percentage points in labor markets, 15 percentage points in nontradables, and 5 percentage points in tradables.
Table 4. Long-Run Effects of Reducing Markups in Labor and Product Markets in Belgium 1/(Deviations from baseline in percent)

- 15 -
higher real wages as labor becomes relatively scarce. Consequently, output rises by more than hours worked. International spillover and feedback effects of reform are limited (Table 5). Reform across the euro area and France yields additional output for France of about 1.3 percent (out of 17.3 percent) over stand-alone reforms in France. In the case of Belgium, it yields only a 0.9 percent (out of 11.7 percent) increase over stand-alone reforms. Practically all additional GDP gains are direct spillovers from reforms abroad. The limited size of spillovers in the long run stems from the fact that the reforms drive up supply and income in the reforming country proportionally, ultimately leading to a similar demand response. Changes in terms-of-trade, which would alter this outcome, are relatively small.
While the long-run increase in output as a result of joint reforms does not go beyond the combined long-run impact of reforms in each country separately, welfare gains from joint reforms are important. Reforms elsewhere ultimately reverse the terms-of-trade loss that a country suffers when attempting to sell additional output abroad. Consequently, joint reform leads to higher consumption and lower hours worked and thus more welfare than stand-alone reforms. For a smaller country, the welfare gains are more modest as the initial terms-of-trade loss is smaller.
The simulation results are sensitive to alternative values of key parameters, though without altering the qualitative conclusions. It has been argued, especially for Belgium, that its pricing power may be limited and its markup in the traded goods sector the same or even less than of the benchmark RE block. Given the convex nature of the relation between the mark-up and the elasticity of substitution, when the starting position is relatively close to the
Real GDP Consumption Hours Worked Capital Stock
France 1/Labor market 6.8 6.7 6.9 6.7Services 7.6 5.4 6.3 10.5Goods 2.0 1.7 1.5 5.5All markets 17.3 14.5 15.2 24.4 Of which: spillover from Euro area 1.3 1.4 0.2 1.9
Belgium 2/Labor market 4.9 4.9 5.1 4.8Services 4.9 3.5 3.9 6.9Goods 1.5 1.3 1.1 4.5All markets 11.7 9.9 10.2 16.5 Of which: spillover from Euro area 0.9 0.9 0.2 1.0
1/ Markups were reduced in France by 22 percentage points in labor markets, 17 percentage points in nontradables,and 7 percentage points in tradables. The markup reductions in the euro area were 22, 16, and 7 percentage points,respectively.
2/ Markups were reduced in Belgium by 16 percentage points in labor markets, 15 percentage points in nontradables,and 5 percentage points in tradables. The markup reductions in the euro area were 22, 16, and 7 percentage points, respectively.
(Deviations from baseline in percent)
Table 5. Synchronized Euro Area-Wide Structural Reform––Long-Run Impact
- 16 -
perfect competition case, additional gains from reforms are small. From a policy perspective, there is no best performer to converge to. The less labor supply reacts to changes in the wage, the lower the impact of reforms, predictably more so for labor market reforms than for product market reforms. A lower share of liquidity-constrained consumption raises the beneficial impact of labor market reforms as more of the rewards to work, and thus consumption can be intertemporally allocated. As a result, the response of hours worked rises. Finally, if trade elasticities are weaker (domestic and foreign traded goods are poorer substitutes), the impact of reform diminishes substantially, with a larger effect in the smaller, more open country.
B. Transition Dynamics
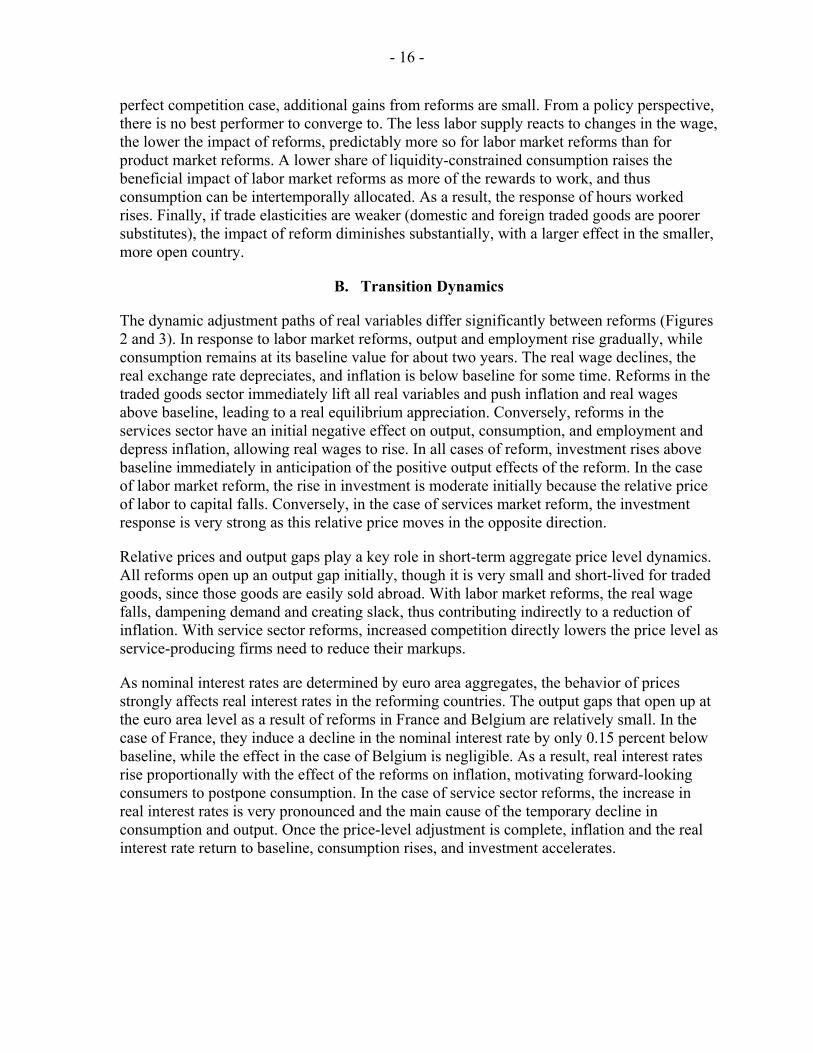
The dynamic adjustment paths of real variables differ significantly between reforms (Figures 2 and 3). In response to labor market reforms, output and employment rise gradually, while consumption remains at its baseline value for about two years. The real wage declines, the real exchange rate depreciates, and inflation is below baseline for some time. Reforms in the traded goods sector immediately lift all real variables and push inflation and real wages above baseline, leading to a real equilibrium appreciation. Conversely, reforms in the services sector have an initial negative effect on output, consumption, and employment and depress inflation, allowing real wages to rise. In all cases of reform, investment rises above baseline immediately in anticipation of the positive output effects of the reform. In the case of labor market reform, the rise in investment is moderate initially because the relative price of labor to capital falls. Conversely, in the case of services market reform, the investment response is very strong as this relative price moves in the opposite direction.
Relative prices and output gaps play a key role in short-term aggregate price level dynamics. All reforms open up an output gap initially, though it is very small and short-lived for traded goods, since those goods are easily sold abroad. With labor market reforms, the real wage falls, dampening demand and creating slack, thus contributing indirectly to a reduction of inflation. With service sector reforms, increased competition directly lowers the price level as service-producing firms need to reduce their markups.
As nominal interest rates are determined by euro area aggregates, the behavior of prices strongly affects real interest rates in the reforming countries. The output gaps that open up at the euro area level as a result of reforms in France and Belgium are relatively small. In the case of France, they induce a decline in the nominal interest rate by only 0.15 percent below baseline, while the effect in the case of Belgium is negligible. As a result, real interest rates rise proportionally with the effect of the reforms on inflation, motivating forward-looking consumers to postpone consumption. In the case of service sector reforms, the increase in real interest rates is very pronounced and the main cause of the temporary decline in consumption and output. Once the price-level adjustment is complete, inflation and the real interest rate return to baseline, consumption rises, and investment accelerates.
- 17 -
Figure 2. Structural Reform in France (Labor, Services, and Goods Markets)(Deviations from baseline in percent)
Notes: Labor = solid lines, Goods = dashed lines, Services = dotted lines; x-axis in number of quarters.
Real GDP
-3
0
3
6
9
0 8 16 24 3 2 4 0 4 8 56 64 72
Output Gap
-9
-6
-3
0
3
0 8 16 2 4 3 2 4 0 4 8 56 6 4 72
Consumption
-6
-3
0
3
6
0 8 16 2 4 3 2 4 0 48 56 64 72
Investment
0
1
2
3
4
0 8 16 2 4 3 2 4 0 4 8 56 6 4 72
Hours Worked
-3
0
3
6
9
0 8 16 2 4 3 2 4 0 48 56 64 72
Capital Stock
0
4
8
12
0 8 16 2 4 3 2 40 4 8 56 6 4 72
CPI Inflation
-4
-2
0
2
0 8 16 2 4 3 2 4 0 48 56 64 72
Real Wage
-5
0
5
10
15
0 8 16 2 4 3 2 4 0 4 8 56 6 4 72
Current Account/GDP
-1.0
-0 .5
0 .0
0 .5
1.0
1.5
0 8 16 24 3 2 4 0 4 8 56 6 4 72
Real Exchange Rate (+ = depreciation)
-5
0
5
10
15
0 8 16 2 4 3 2 4 0 4 8 56 6 4 72
Nominal Short-Term Interest Rate
-0 .2
-0 .1
0 .0
0 .1
0 8 16 24 3 2 4 0 4 8 56 6 4 72
Real Short-Term Interest Rate
-2
0
2
4
0 8 16 2 4 3 2 40 4 8 56 6 4 72

- 18 -
Figure 3. Structural Reform in Belgium (Labor, Services, and Goods Markets)(Deviations from baseline in percent)
Notes: Labor = solid lines, Goods = dashed lines, Services = dotted lines; x-axis in number of quarters.
Real GDP
-3
0
3
6
9
0 8 16 24 32 40 48 56 6 4 72
Output Gap
-6
-3
0
3
0 8 16 2 4 3 2 4 0 4 8 56 64 72
Consumption
-2-101
234
0 8 16 2 4 3 2 4 0 4 8 56 64 72
Investment
0 .0
0 .5
1.0
1.5
2 .0
2 .5
0 8 16 2 4 3 2 40 48 56 64 72
Hours Worked
-2
0
2
4
6
0 8 16 2 4 3 2 4 0 4 8 56 64 72
Capital Stock
0
2
4
6
8
0 8 16 2 4 3 2 4 0 4 8 56 64 72
CPI Inflation
-3
-2
-1
0
1
0 8 16 2 4 3 2 4 0 4 8 56 64 72
Real Wage
-3
0
3
6
9
0 8 16 2 4 3 2 4 0 4 8 56 64 72
Current Account/GDP
-0 .4
-0 .2
0 .0
0 .2
0 .4
0 8 16 24 32 40 48 56 64 72
Real Exchange Rate (+ = depreciation)
-5
0
5
10
0 8 16 2 4 3 2 4 0 4 8 56 64 72
Nominal Short-Term Interest Rate
-0 .03
-0 .02
-0 .0 1
0 .00
0 .0 1
0 8 16 24 32 40 48 56 64 72
Real Short-Term Interest Rate
-1
0
1
2
3
0 8 16 2 4 3 2 4 0 4 8 56 64 72
- 19 -
With domestic inflation differing from inflation in trade partner countries, the real exchange rate adjusts. Increasing competition in the traded goods sectors makes domestic firms internationally more competitive as well. Since they are partly price-taker, they can afford to pay somewhat higher wages, which quickly leads to an expansion of demand, a real appreciation, and a current account temporarily below baseline.15 For the other reforms, domestic prices fall, the real exchange rate depreciates (nontradables become cheaper relative to tradables), and net exports rise. However, the improvement in the trade balance is insufficient to fully compensate for the shortfall of domestic demand relative to supply. Once the price level adjustment is complete, the trade surplus is temporarily reduced.
Synchronizing reforms across markets in a given country reduces transition costs in terms of foregone consumption (Figure 4). However, if the country is large, it may not be possible to prevent a decline in consumption, though the decline in output below baseline may become negligible. This is mainly due to the fact that a larger country tends to have a larger share of nontraded goods (services). Hence, for a given change in markups, the real exchange rate needs to adjust by more to return to equilibrium, but nominal and real rigidities prevent this from happening quickly.
15 Alternatively, more competition in the tradables sector lowers tradables prices vis-à-vis nontradables prices and therefore represents a real appreciation of the home currency.

- 20 -
Figure 4: Structural Reform in all Markets (Stand-Alone)(Deviations from baseline in percent)
Notes: France = solid lines, Belgium = dashed lines; x-axis in number of quarters.
Real GDP
-4048
12162 0
0 8 16 24 3 2 4 0 48 56 6 4 72
Output Gap
-16
-12
-8
-4
0
4
0 8 16 24 3 2 40 4 8 56 6 4 72
Consumption
-3
0
3
6
9
0 8 16 2 4 3 2 4 0 48 56 64 72
Investment
0
2
4
6
0 8 16 2 4 3 2 4 0 4 8 56 6 4 72
Hours Worked
-5
0
5
10
15
20
0 8 16 2 4 32 4 0 48 56 64 72
Capital Stock
0
10
2 0
3 0
0 8 16 24 3 2 40 4 8 56 6 4 72
CPI Inflation
-4
-3
-2
-1
0
1
0 8 16 2 4 3 2 4 0 48 56 64 72
Real Wage
-5
0
5
10
15
2 0
0 8 16 24 3 2 40 4 8 56 6 4 72
Current Account/GDP
-1
0
1
2
0 8 16 24 3 2 4 0 4 8 56 64 72
Real Exchange Rate (+ = depreciation)
0
4
8
12
0 8 16 2 4 3 2 40 4 8 56 6 4 72
Nominal Short-Term Interest Rate
-0 .4
-0 .2
0 .0
0 .2
0 8 16 24 3 2 4 0 4 8 56 6 4 72
Real Short-Term Interest Rate
-1
0
1
2
3
4
0 8 16 2 4 3 2 4 0 4 8 56 6 4 72

- 21 -
C. Synchronization of Reforms in the Euro Area
While monetary policy is neutral in the long run, the adjustment path depends strongly on the stance of monetary policy during the transition. When markups are reduced only in the reforming country, opening up an output gap in the country, area-wide nominal interest rates fall very little, as the monetary policy rule is formulated in terms of the euro area-wide indicators. Similarly, the euro depreciates very little in nominal terms. As a result, though the stance of monetary policy remains optimal from a euro area-wide perspective, monetary conditions in the reforming country tighten, which exerts additional deflationary pressure. The depreciation of the real effective exchange rate, needed to balance supply and demand, must come about through temporary lower inflation at home, further depressing prices, and raising the real interest rate. In the presence of nominal rigidities, insufficient monetary accommodation slows the response of investment and consumption.
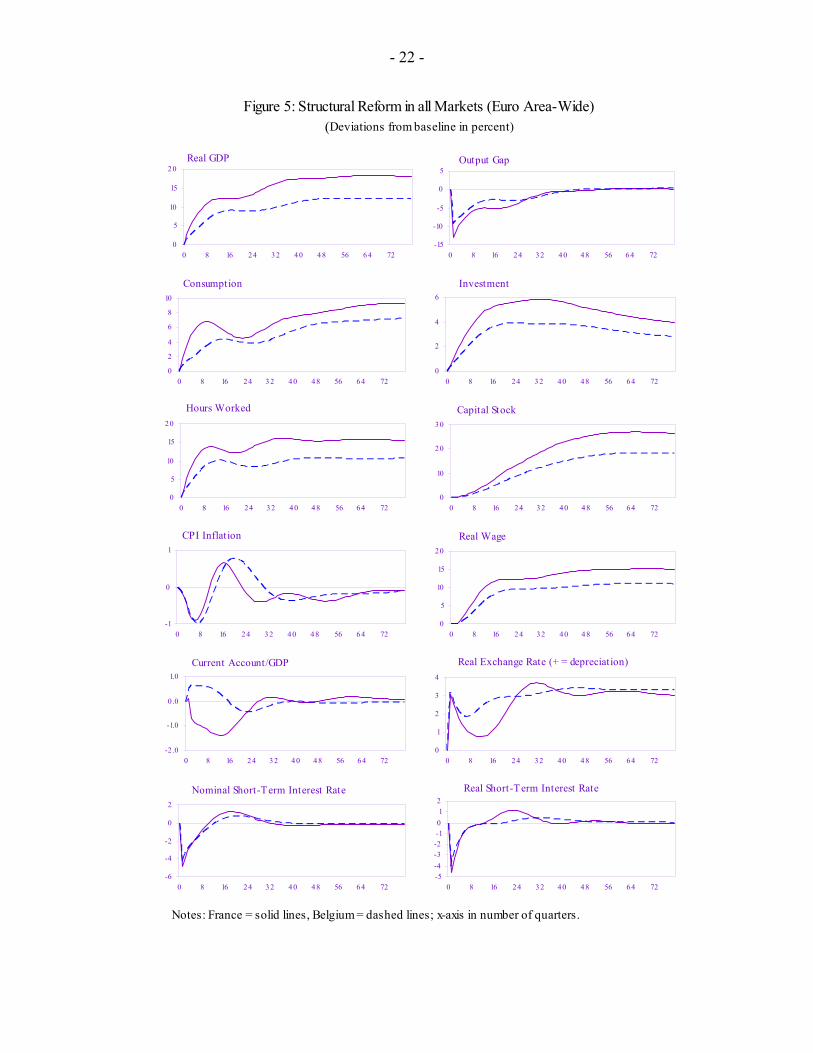
Coordination of the timing of structural reforms in the euro area results in faster adjustment and eliminates transition costs (Figure 5). When markups are reduced in the entire euro area, nominal interest rates fall sufficiently to prevent transitory deflation. In the first year, the real interest rate declines by 2.9 percentage points, and the real exchange rate depreciates by about 2.5 percent in the reforming country. This makes a large difference to demand: with stand-alone reforms, consumption in France would be 2.7 percent below baseline in the first year and investment 3 percent above. With synchronized reforms, consumption would be 5 percent above baseline and investment almost 8 percent.
In reality, other factors not considered in the model are likely to influence transition dynamics and the monetary policy reaction. Reforms might raise uncertainty about income and employment, delaying agents’ positive response to the long-run benefits of reform. Uncertainty typically leads to caution, including on the side of monetary policy-makers. As a result, monetary conditions may not be fully accommodative, even in the case of synchronized euro area-wide reform.
- 22 -
Figure 5: Structural Reform in all Markets (Euro Area-Wide)(Deviations from baseline in percent)
Notes: France = solid lines, Belgium = dashed lines; x-axis in number of quarters.
Real GDP
0
5
10
15
20
0 8 16 24 32 40 48 56 64 72
Output Gap
-15
-10
-5
0
5
0 8 16 24 32 40 48 56 64 72
Consumption
0
2
4
6
8
10
0 8 16 24 32 40 48 56 64 72
Investment
0
2
4
6
0 8 16 24 32 40 48 56 64 72
Hours Worked
0
5
10
15
20
0 8 16 24 32 40 48 56 64 72
Capital Stock
0
10
20
30
0 8 16 24 32 40 48 56 64 72
CPI Inflation
-1
0
1
0 8 16 24 32 40 48 56 64 72
Real Wage
0
5
10
15
20
0 8 16 24 32 40 48 56 64 72
Current Account/GDP
-2 .0
-1.0
0 .0
1.0
0 8 16 24 32 40 48 56 64 72
Real Exchange Rate (+ = depreciation)
0
1
2
3
4
0 8 16 24 32 40 48 56 64 72
Nominal Short-Term Interest Rate
-6
-4
-2
0
2
0 8 16 24 32 40 48 56 64 72
Real Short-Term Interest Rate
-5-4-3-2-101
2
0 8 16 24 32 40 48 56 64 72

- 23 -
IV. CONCLUSIONS
Simulations with the IMF’s Global Economy Model (GEM) calibrated for the EU demonstrate the potential for large steady-state benefits from reforms in labor, goods, and services markets. Reform in the nontraded (services) sector yields the largest gains because the degree of competition in this sector is comparatively the lowest. Labor market reforms also have the potential to raise output appreciably, while reforms in the traded (goods) sector produce fewer, though still significant, benefits because markups are already lower in this sector.
In terms of steady-state outcomes, individual countries should proceed with reforms regardless of what happens in the rest of the world. Spillover effects of reform are limited because supply-enhancing reforms raise consumption and investment, leading to an equivalent increase in demand in the long run. Benefits are more evenly distributed when market forces are strengthened in all markets and transition costs are lower. In particular, combining product and labor market reforms can avoid a decline in real wages associated with the latter.
Synchronization of reforms in the euro area would eliminate the transition costs of reforms. Stand-alone reforms represent an asymmetric positive supply shock, which causes a sharp increase in real interest rates in the reforming country as the impact of such reforms on euro area-wide aggregates would be very small. In the short term, the resulting tightening of monetary conditions in the reforming country would lead to a decline in consumption. A large country, with a large nontraded sector, would suffer relatively more. However, synchronization of reforms would open up a substantive euro area-wide output gap, allowing a monetary policy reaction that mitigates the effects on the real interest rate and output.
The political economy implications regarding the sequencing of reforms differ slightly from Blanchard and Giavazzi (2003) because GEM explicitly takes into account nominal and real rigidities and the fact that the monetary authority reacts only to euro area-wide developments but is much less responsive to an individual country’s events. Reforms in the traded goods sector still follow Blanchard and Giavazzi’s (2003) theoretical predictions and can be used to generate support for labor market reform. However, services sector reforms, while they raise real wages, do not generate support for labor market reform, because they dampen activity unless such reforms are synchronized across the entire euro area.
The results of the simulations are subject to caveats. The magnitude of the reform effects is sensitive to the value of some key parameters, though sensitivity analysis has shown that the qualitative conclusions remain valid. The model assumes that announced reforms are fully credible and that all actors have perfect foresight and complete knowledge of the structure of the economy. In reality, reforms might not be credible initially, and there is uncertainty about how the economy will react. The monetary policy reaction can therefore not be mechanical. In addition, the model does not contain effects of interactions between labor and product market reforms, which may be important (Estevão, 2005; and Berger and Danninger, 2005). Labor market reforms may be more effective, the more deregulated the product markets are. Conversely, if labor markets are rigid, product market reform may shift rents to workers rather than consumers.
- 24 -
REFERENCES
Alessandria, G., and A. Delacroix, 2004, “Trade and the (Dis)Incentive to Reform Labor Markets: The Case of Reform in the European Union,” FRB of Philadelphia WP 04-18.
Avonds, L., 2005, “Een vergelijkende analyse van de Input-Outputtabellen van 1995 en 2000,” Working Paper 4-05 (Brussels: Federal Planning Bureau).
Batini, N., P. N’Diaye, and A. Rebucci, 2005, “The Domestic and Global Impact of Japan’s Policies for Growth,” Working Paper 05/209 (Washington: International Monetary Fund).
Bayoumi, T., 2004, GEM: A New International Macroeconomic Model, Occasional Paper 239 (Washington: International Monetary Fund).
______, D. Laxton, and P. Pesenti, 2004, “Benefits and Spillovers of Greater Competition in Europe: A Macroeconomic Assessment,” Working Paper 341 (Frankfurt: European Central Bank).
Bean, C.R., 1998, “The Interaction of Aggregate-Demand Policies and Labour Market Reform,” Swedish Economic Policy Review, pp. 353–88 (Stockholm: The Economic Council of Sweden).
Berger, H., and S. Danninger, 2005, “Labor and Product Market Deregulation: Partial, Sequential, or Simultaneous Reform?” Working Paper 05/227 (Washington: International Monetary Fund).
Blanchard, O., and F. Giavazzi, 2003, “Macroeconomic Effects of Regulation and Deregulation in Goods and Labor Markets,” The Quarterly Journal of Economics, Vol. 118, pp. 879–907 (Cambridge, Massachusetts: MIT Press).
Bowman, D., 2003, “Market Power and Inflation, Board of Governors of the FRS,” International Finance Discussion Papers 783 (Washington: Federal Reserve System).
Campbell, J.Y., and N.G. Mankiw, 1991, “Permanent Income, Current Income and Consumption,” NBER Working Paper No. W2436 (Cambridge, Massachusetts: National Bureau of Economic Research).
Clark, A.E., and C. Senik, 2004, “The (Unexpected) Structure of ‘Rents’ on the French and British Labour Markets,” IZA Discussion Paper 1438 (Bonn: Institut zur Zukunft der Arbeit).
Conway, P., V. Janod, and G. Nicoletti, 2005, “Product Market Regulation in OECD Countries: 1998 to 2003,” OECD Economics Department Working Paper 419, Paris: Organisation for Economic Co-operation and Development).
Coricelli, F., F. Mucci, and D. Revoltella, 2006, “The New Europe Household Lending Market,” CEPR Discussion Paper 5520 (London: Centre for Economic Policy Research).
Crépon, B., R. Desplatz, and J. Mairesse, 2002, “Price-Cost Margins and Rent Sharing: Evidence from a Panel of French Manufacturing Firms” (unpublished).

- 25 -
Dobbelaere, S., 2005, “Estimation of Price-Cost Margins and Union Bargaining Power for Belgian Manufacturing,” International Journal of Industrial Organization (Amsterdam: Elsevier).
Dumont, M., G. Rayp, and P. Willemé, 2005, “Does internationalization affect union bargaining power? An empirical study for 5 European countries,” Oxford Economic Papers, Vol 58, pp. 77–102 (Oxford: Oxford University Press).
Duval, R., and J. Elmeskov, 2005, “The Effects of EMU on Structural Reforms in Labour and Product Markets,” paper prepared for the conference on “What effects is EMU having on the euro area and its member countries?” organized by the European Central Bank.
Estevão, M., 2005, “Product Market Regulation and the Benefits of Wage Moderation,” Working Paper 05/191 (Washington: International Monetary Fund).
European Commission, 2005a, “Working for Growth and Jobs: Next Steps in Implementing the Revised Lisbon Strategy,” Commission Staff Working Paper 622.
European Commission, 2005b, “Working together for Growth and Jobs. A new Start for the Lisbon Strategy,” Communication to the Spring European Council.
Evers, M., R.A. de Mooij, and D.J. van Vuuren, 2005, “What Explains the Variation in Estimates of Labor Supply Elasticities?” Working Paper 1633, December 2005 (Munich: CESifo).
Fernandez-Corugedo, E., and S. Price, 2002, “Financial Liberalisation and Consumers’ Expenditure: “FLIB” reexamined,” Working Paper 157 (London: Bank of England).
Galí, J., M. Gertler, and J. D. Lopez-Salido, 2002, “Markups, Gaps, and the Welfare Costs of Business Fluctuations,” NBER Working Paper No. 8850 (Cambridge, Massachusetts: National Bureau of Economic Research).
Hunt, B., 2004, IMF Country Report 04/241 (Washington: International Monetary Fund).
Iacoviello, M., 2004, “Consumption, House Prices, and Colateral Constraints: A Structural Econometric Analysis,” Working Paper no. 589 (Boston, Massachusetts: Boston College).
IMF, 2004, “World Economic Outlook: Advancing Structural Reforms,” Washington.
IMF, 2005, “World Economic Outlook: Globalization and External Balances,” Washington.
Jean, S., and G. Nicoletti, 2002, “Product Market Regulation and Wage Premia In Europe and North America: An Empirical Investigation,” Economics Department Working Paper 419 (Paris: Organisation for Economic Co-operation and Development).
Kahn, H., 2004, “Price-setting Behaviour, Competition, and Markup Shocks in the New Keynesian Model,” Working Paper 240 (London: Bank of England).
Konings, J., 2005, “Loonkosten en jobcreatie: regionale en sectorale verschillen,” Beleidsnota No. 5, March 2005 (Antwerpen: VKW).
Konings, J., J.P. Van Cayseele, and F. Warzynski, 2001, “The Dynamics of Industrial Markups in Two Small Open Economies: Does National Competition Policy Matter?” International Journal of Industrial Organization, pp. 841–59 (Amsterdam: Elsevier).
- 26 -
Lucas, R.E., Jr., 1976, “Econometric Policy Evaluation: A Critique,” Journal of Monetary Economics, Vol. 1, No. 2, pp. 19–46 (Amsterdam: Elsevier).
Luna, F., M. Lutz, and E. Stavrev, 2005, IMF Country Report 05/36 (Washington: International Monetary Fund).
Nicoletti, G., A. Bassanini, E. Ernst, S. Jean, P. Santiago, and P. Swaim, 2001, “Product and Labor Markets Interaction in OECD Countries,” Economics Department Working Paper 312 (Paris: Organisation for Economic Co-operation and Development).
Nicoletti, G., and S. Scarpetta, 2003, “Regulation, Productivity, and Growth,” Policy Research Working Paper 2944 (Washington: World Bank).
OECD, 2006, “Economic Policy Reforms: Going for Growth,” (Paris).
Oliveira Martins, J., S. Scarpetta, and D. Pilat, 1996, “Markup Ratios in Manufacturing Industries––Estimates for 14 OECD Countries,” Economics Department Working Paper 162 (Paris: Organisation for Economic Co-operation and Development).
Oliveira Martins, J., and S. Scarpetta, 1999, “The Levels And Cyclical Behaviour Of Markups Across Countries And Market Structures,” Economics Department Working Paper 213 (Paris: Organisation for Economic Co-operation and Development).
Orphanides, A., 2003, “Historical Monetary Analysis and the Taylor Rule.” Journal of Monetary Economics, pp. 983–1022 (Amsterdam: Elsevier).
Pisani-Ferry, J., and A. Sapir, 2006, “Last Exit to Lisbon,” Bruegel Policy Brief (Brussels: Bruegel).
Roeger, W., and J. in ‘t Veld, 1997, “Quest II: A Multi-Country Business Cycle and Growth Model.” Economic Papers 123 (Brussels: European Commission).
Saint-Paul, G., 2004, “Did European Labour Markets Become More Competitive in the 1990s? Evidence From Estimated Worker Rents,” CEPR Discussion Paper 4327 (London: Centre for Economic Policy Research).
Weber, C., 2000, “Rule-of-Thumb” Consumption, Intertemporal Substitutions, and Risk Aversion,” Journal of Business And Economic Statistics, October 2000 (Boston, Massachusetts: American Statistical Association).
Wanlin, A., 2006, “The Lisbon Scorecard VI: Will Europe’s Economy Rise Again?” (London: Centre For European Reform).
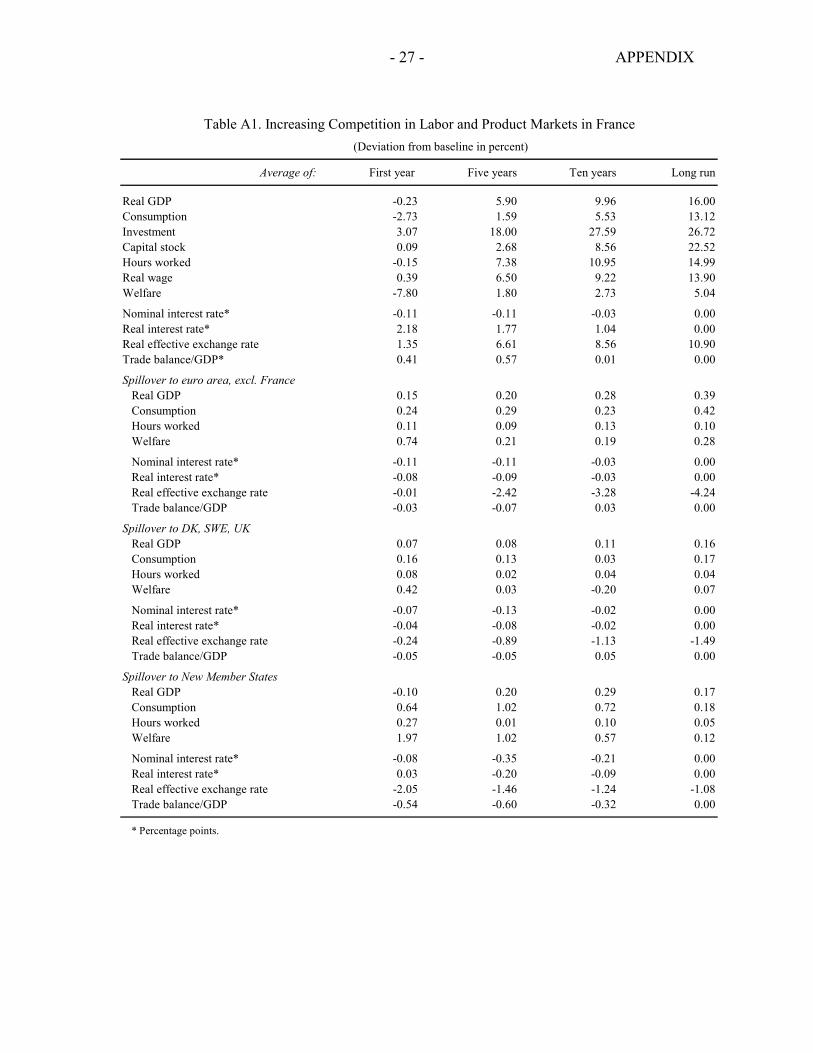
- 27 - APPENDIX
Average of: First year Five years Ten years Long run
Real GDP -0.23 5.90 9.96 16.00Consumption -2.73 1.59 5.53 13.12Investment 3.07 18.00 27.59 26.72Capital stock 0.09 2.68 8.56 22.52Hours worked -0.15 7.38 10.95 14.99Real wage 0.39 6.50 9.22 13.90Welfare -7.80 1.80 2.73 5.04
Nominal interest rate* -0.11 -0.11 -0.03 0.00Real interest rate* 2.18 1.77 1.04 0.00Real effective exchange rate 1.35 6.61 8.56 10.90Trade balance/GDP* 0.41 0.57 0.01 0.00
Spillover to euro area, excl. FranceReal GDP 0.15 0.20 0.28 0.39Consumption 0.24 0.29 0.23 0.42Hours worked 0.11 0.09 0.13 0.10Welfare 0.74 0.21 0.19 0.28
Nominal interest rate* -0.11 -0.11 -0.03 0.00Real interest rate* -0.08 -0.09 -0.03 0.00Real effective exchange rate -0.01 -2.42 -3.28 -4.24Trade balance/GDP -0.03 -0.07 0.03 0.00
Spillover to DK, SWE, UKReal GDP 0.07 0.08 0.11 0.16Consumption 0.16 0.13 0.03 0.17Hours worked 0.08 0.02 0.04 0.04Welfare 0.42 0.03 -0.20 0.07
Nominal interest rate* -0.07 -0.13 -0.02 0.00Real interest rate* -0.04 -0.08 -0.02 0.00Real effective exchange rate -0.24 -0.89 -1.13 -1.49Trade balance/GDP -0.05 -0.05 0.05 0.00
Spillover to New Member StatesReal GDP -0.10 0.20 0.29 0.17Consumption 0.64 1.02 0.72 0.18Hours worked 0.27 0.01 0.10 0.05Welfare 1.97 1.02 0.57 0.12
Nominal interest rate* -0.08 -0.35 -0.21 0.00Real interest rate* 0.03 -0.20 -0.09 0.00Real effective exchange rate -2.05 -1.46 -1.24 -1.08Trade balance/GDP -0.54 -0.60 -0.32 0.00
* Percentage points.
Table A1. Increasing Competition in Labor and Product Markets in France (Deviation from baseline in percent)

- 28 - APPENDIX
Average of: First year Five years Ten years Long run
Impact in FranceReal GDP 5.13 10.23 12.85 17.28Consumption 5.57 8.98 9.40 14.49Investment 7.85 24.80 31.41 27.60Capital stock 0.20 4.72 11.30 24.35Hours worked 6.14 11.37 13.13 15.23Welfare 13.00 5.33 4.79 5.91
Nominal interest rate* -3.61 -0.56 -0.16 0.00Real interest rate* 2.93 -0.51 -0.01 0.00Real effective exchange rate 2.38 1.39 2.35 2.80Trade balance -0.02 -0.68 -0.24 0.01
Impact in the euro areaReal GDP 3.86 8.69 10.70 15.31Consumption 2.48 5.58 6.88 12.90Investment 6.08 21.09 27.50 25.35Capital stock 0.19 3.67 9.30 22.00Hours worked 4.27 10.21 11.05 13.39Welfare 4.79 2.76 3.12 4.91
Nominal interest rate* -3.61 -0.56 -0.16 0.00Real interest rate* -2.76 -0.57 -0.12 0.00Real effective exchange rate 7.28 5.10 4.85 5.11Trade balance 0.88 0.60 0.21 0.00
Spillover to DK, SWE, UKReal GDP 0.15 0.50 0.59 1.04Consumption 0.73 0.18 0.24 1.09Hours worked 0.66 0.31 0.21 0.27
Nominal interest rate* -0.39 -0.11 0.05 0.00Real interest rate* -0.29 -0.15 -0.05 0.00Real effective exchange rate -5.30 -5.88 -7.15 -8.41Trade balance -0.40 0.20 0.22 0.00
Spillover to New Member StatesReal GDP -1.30 0.85 1.55 1.47Consumption 4.53 5.10 3.57 1.55Hours worked 1.38 -0.34 0.60 0.39
Nominal interest rate* -1.70 -2.26 -1.05 0.00Real interest rate* -0.92 -1.42 -0.57 0.00Real effective exchange rate -18.55 -9.57 -8.28 -7.81Trade balance -4.50 -3.25 -1.49 0.00
* Percentage points.
Table A2: Increasing Competition in Labor and Product Markets in France and the Euro Area (Deviation from baseline in percent)

- 29 - APPENDIX
Average of: First year Five years Ten years Long run
Real GDP 0.64 4.71 7.05 10.81Consumption -0.25 2.52 4.32 9.03Investment 3.21 14.01 19.47 18.13Capital stock 0.10 2.39 6.53 15.64Hours worked 0.94 5.67 7.60 10.02Real wage 0.18 4.66 6.72 9.95Welfare -0.58 1.72 2.06 3.28
Nominal interest rate* -0.01 -0.01 0.00 0.00Real interest rate* 0.63 1.21 0.75 0.00Real effective exchange rate 0.64 3.90 5.59 7.31Trade balance* 0.02 0.04 -0.05 0.01
Spillover to euro area, excluding BelgiumReal GDP 0.02 0.02 ..03 0.04Consumption 0.03 0.02 0.02 0.04Hours worked 0.02 0.01 0.01 0.01Welfare 0.07 0.01 0.02 0.03
Nominal interest rate* -0.01 -0.01 0.00 0.00Real interest rate* -0.01 -0.01 0.00 0.00Real effective exchange rate -0.07 -0.46 -0.66 -0.89Trade balance 0.00 0.00 0.00 0.00
Spillover to DK, SWE, UKReal GDP 0.02 0.02 0.02 0.03Consumption 0.02 0.03 0.02 0.03Hours worked 0.02 0.01 0.01 0.01Welfare 0.05 0.02 0.02 0.02
Nominal interest rate* 0.00 0.00 0.00 0.00Real interest rate* 0.00 0.00 0.00 0.00Real effective exchange rate -0.06 -0.28 -0.40 -0.48Trade balance 0.00 0.00 0.00 0.00
Spillover to New Member StatesReal GDP 0.05 0.07 0.09 0.12Consumption 0.06 0.08 0.09 0.13Hours worked 0.05 0.04 0.04 0.03Welfare 0.19 0.07 0.08 0.09
Nominal interest rate* -0.02 -0.01 0.00 0.00Real interest rate* -0.02 -0.01 0.00 0.00Real effective exchange rate -0.03 -0.24 -0.33 -0.41Trade balance 0.00 0.00 0.00 0.00
* Percentage points.
Table A3. Increasing Competition in Labor and Product Markets in Belgium (Deviation from baseline in percent)

- 30 - APPENDIX
Average of: First year Five years Ten years Long run
Impact in BelgiumReal GDP 2.68 6.74 8.24 11.67Consumption 1.81 4.75 5.63 9.90Investment 4.60 16.24 20.79 18.93Capital stock 0.15 2.91 7.29 16.48Hours worked 3.18 7.75 8.39 10.24Welfare 3.67 2.77 2.71 3.83
Nominal interest rate* -3.29 -0.89 -0.29 0.00Real interest rate* -2.57 -0.73 -0.21 0.00Real effective exchange rate 2.60 2.44 2.77 3.32Trade balance 0.45 0.16 -0.04 0.01
Impact in the euro area, excluding BelgiumReal GDP 3.81 8.55 10.42 14.23Consumption 3.76 5.44 7.38 12.16Investment 5.42 18.87 24.68 22.30Capital stock 0.18 3.54 9.03 20.64Hours worked 4.65 10.02 10.85 12.47Welfare 9.93 3.98 3.49 4.66
Nominal interest rate* -3.29 -0.89 -0.29 0.00Real interest rate* -2.34 -0.65 -0.17 0.00Real effective exchange rate 4.96 5.06 5.82 6.47Trade balance 0.15 0.05 0.01 0.00
Spillover to DK, SWE, UKReal GDP 0.16 0.33 0.37 0.50Consumption 0.55 0.46 0.38 0.53Hours worked 0.48 0.19 0.15 0.13
Nominal interest rate* -0.09 -0.14 -0.02 0.00Real interest rate* -0.07 -0.12 -0.05 0.00Real effective exchange rate -4.80 -4.76 -5.43 -6.06Trade balance -0.25 -0.12 -0.02 0.00
Spillover to New Member StatesReal GDP 0.40 1.13 1.33 1.61Consumption 1.23 1.38 1.30 1.69Hours worked 1.31 0.74 0.63 0.42
Nominal interest rate* -0.03 -0.17 -0.01 0.00Real interest rate* 0.15 -0.18 -0.05 0.00Real effective exchange rate -4.07 -4.30 -4.91 -5.45Trade balance -0.49 -0.14 0.01 0.00
* Percentage points.
Table A4: Increasing Competition in Labor and Product Markets in Belgium and the Euro Area (Deviation from baseline in percent)


