CONFIDENTIAL AND PROPRIETARY Any use of this material without specific permission of McKinsey & Company is strictly prohibited Structural shifts shaping the future of Asset Management April 26 th , 2010 Discussion document
Transcript
CONFIDENTIAL AND PROPRIETARYAny use of this material without specific permission of McKinsey & Company is strictly prohibited
Structural shifts shaping the future of Asset Management
April 26th, 2010
Discussion document
|McKinsey & Company 1
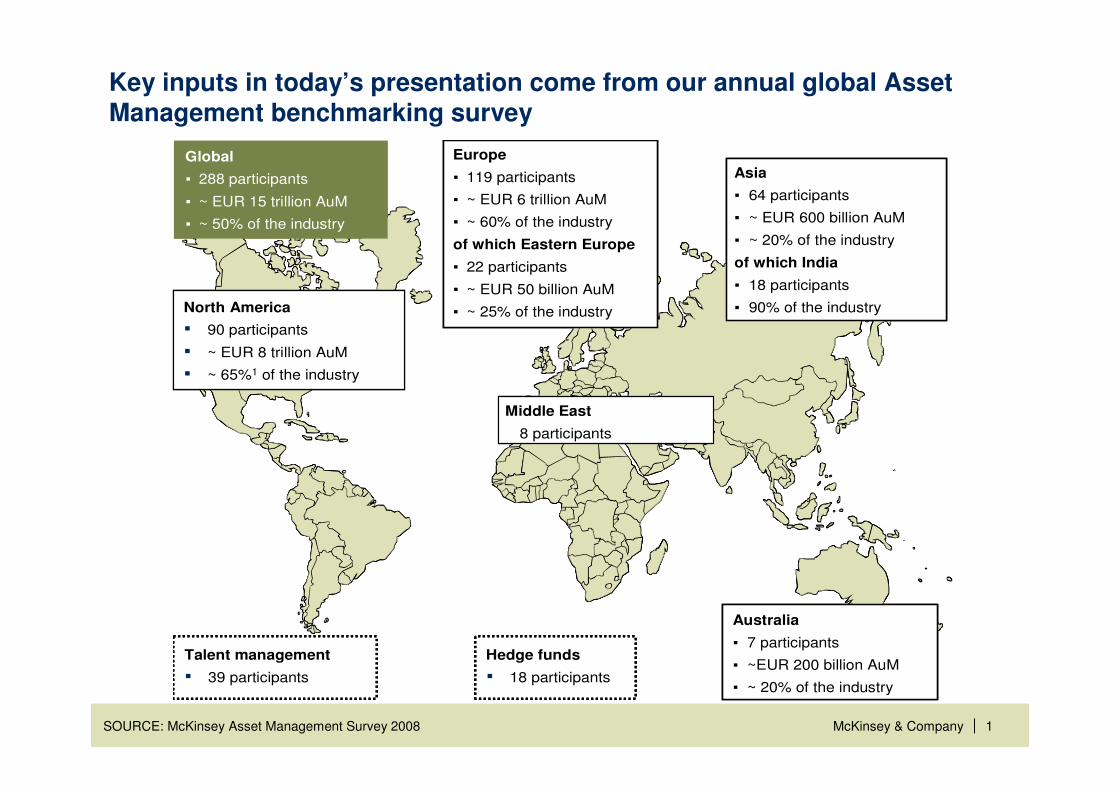
Key inputs in today’s presentation come from our annual global Asset Management benchmarking survey
SOURCE: McKinsey Asset Management Survey 2008
Australia
▪ 7 participants
▪ ~EUR 200 billion AuM
▪ ~ 20% of the industry
Middle East
▪ 8 participants
Europe
▪ 119 participants
▪ ~ EUR 6 trillion AuM
▪ ~ 60% of the industry
of which Eastern Europe
▪ 22 participants
▪ ~ EUR 50 billion AuM
▪ ~ 25% of the industry
Asia
▪ 64 participants
▪ ~ EUR 600 billion AuM
▪ ~ 20% of the industry
of which India
▪ 18 participants
▪ 90% of the industry
Global
▪ 288 participants
▪ ~ EUR 15 trillion AuM
▪ ~ 50% of the industry
North America
▪ 90 participants
▪ ~ EUR 8 trillion AuM
▪ ~ 65%1 of the industry
Talent management
▪ 39 participants
Hedge funds
▪ 18 participants
Australia
▪ 7 participants
▪ ~EUR 200 billion AuM
▪ ~ 20% of the industry
Middle East
▪ 8 participants
Europe
▪ 119 participants
▪ ~ EUR 6 trillion AuM
▪ ~ 60% of the industry
of which Eastern Europe
▪ 22 participants
▪ ~ EUR 50 billion AuM
▪ ~ 25% of the industry
Asia
▪ 64 participants
▪ ~ EUR 600 billion AuM
▪ ~ 20% of the industry
of which India
▪ 18 participants
▪ 90% of the industry
Global
▪ 288 participants
▪ ~ EUR 15 trillion AuM
▪ ~ 50% of the industry
North America
▪ 90 participants
▪ ~ EUR 8 trillion AuM
▪ ~ 65%1 of the industry
North America
▪ 90 participants
▪ ~ EUR 8 trillion AuM
▪ ~ 65%1 of the industry
Talent management
▪ 39 participants
Hedge funds
▪ 18 participants
Talent management
▪ 39 participants
Talent management
▪ 39 participants
Hedge funds
▪ 18 participants
Hedge funds
▪ 18 participants
|McKinsey & Company 2
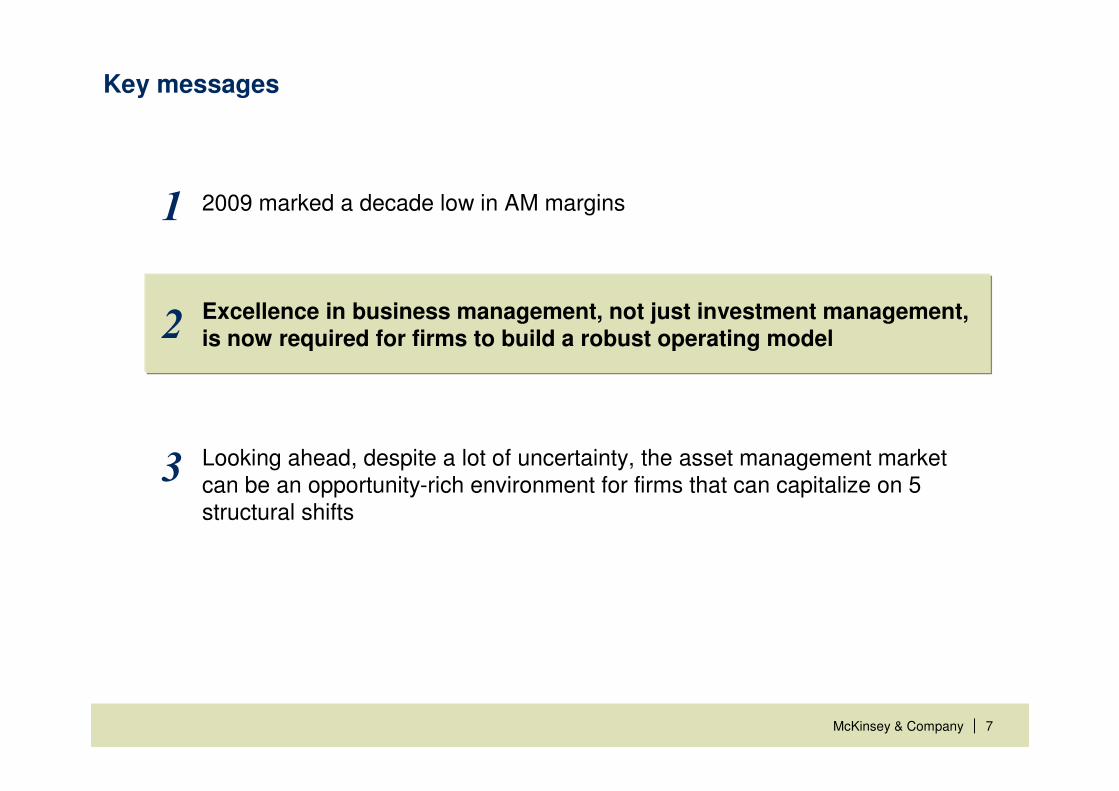
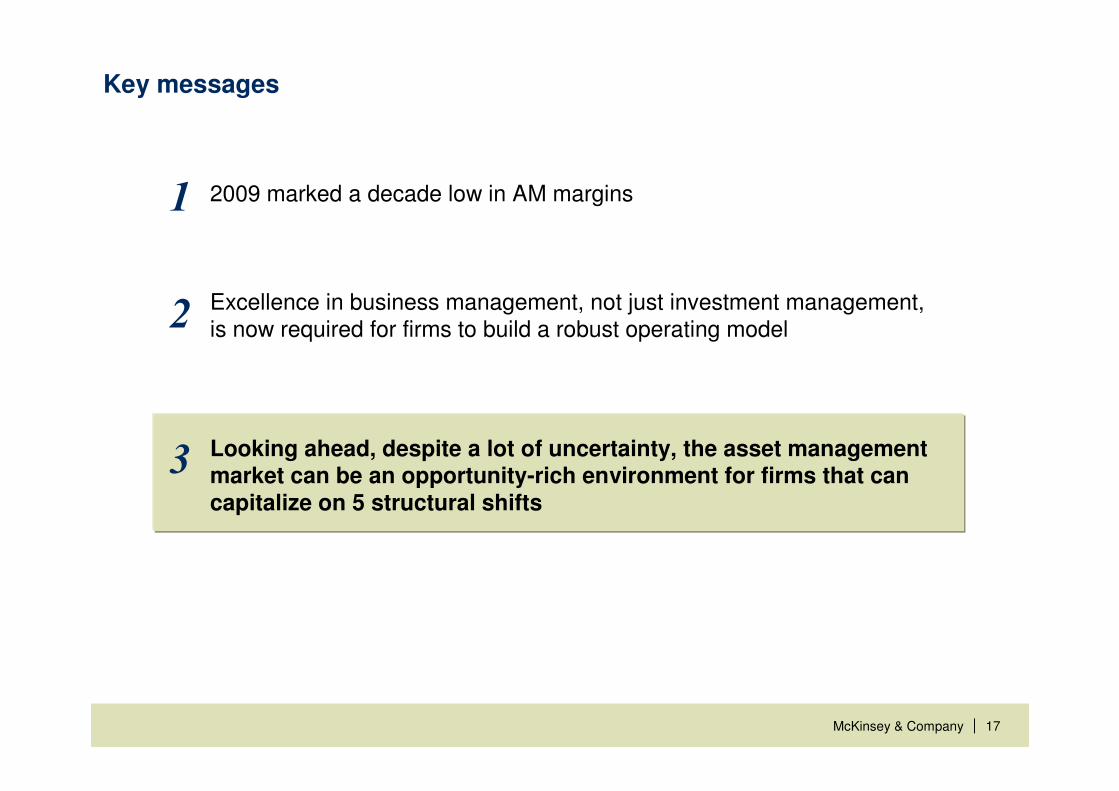
Key messages
2009 marked a decade low in AM margins
Excellence in business management, not just investment management, is now required for firms to build a robust operating model
Looking ahead, despite a lot of uncertainty, the asset management market can be an opportunity-rich environment for firms that can capitalize on 5 structural shifts
1
2
3
|McKinsey & Company 3
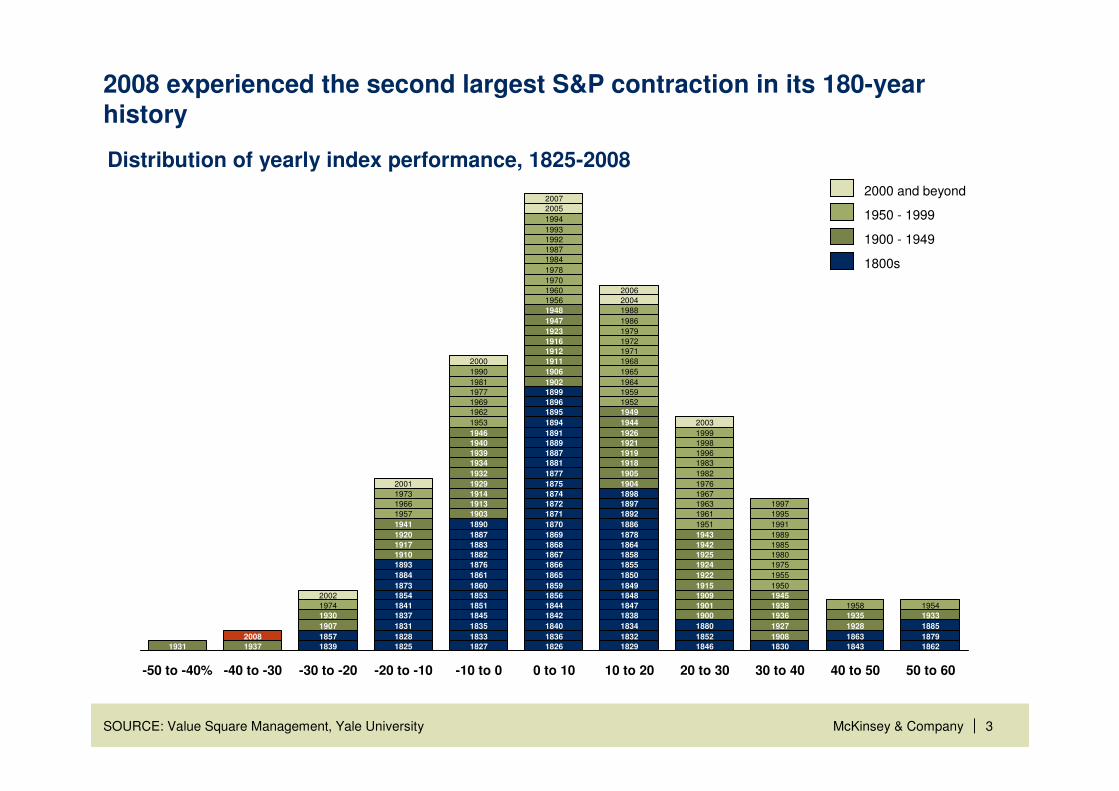
2008 experienced the second largest S&P contraction in its 180-year history
-50 to -40%
2008
1937
-40 to -30
2002
1974
1930
1907
1857
1839
-30 to -20
2001
1973
1966
1957
1941
1920
1917
1910
1893
1884
1873
1854
1841
1837
1831
1828
1825
-20 to -10
2000
1990
1981
1977
1969
1962
1953
1946
1940
1939
1934
1932
1929
1914
1913
1903
1890
1887
1883
1882
1876
1861
1860
1853
1851
1845
1835
1833
1827
-10 to 0
2007
2005
1994
1993
1992
1987
1984
1978
1970
1960
1956
1948
1947
1923
1916
1912
1911
1906
1902
1899
1896
1895
1894
1891
1889
1887
1881
1877
1875
1874
1872
1871
1870
1869
1868
1867
1866
1865
1859
1856
1844
1842
1840
1836
1826
0 to 10
2006
2004
1988
1986
1979
1972
1971
1968
1965
1964
1959
1952
1949
1944
1926
1921
1919
1918
1905
1904
1898
1897
1892
1886
1878
1864
1858
1855
1850
1849
1848
1847
1838
1834
1832
1829
10 to 20
2003
1999
1998
1996
1983
1982
1976
1967
1963
1961
1951
1943
1942
1925
1924
1922
1915
1909
1901
1900
1880
1852
1846
20 to 30
1997
1995
1991
1989
1985
1980
1975
1955
1950
1945
1931
1938
1936
1927
1908
1830
30 to 40
1958
1935
1928
1863
1843
40 to 50
1954
1933
1885
1879
1862
50 to 60
2000 and beyond
1950 - 1999
1900 - 1949
1800s
Distribution of yearly index performance, 1825-2008
SOURCE: Value Square Management, Yale University
|McKinsey & Company 4
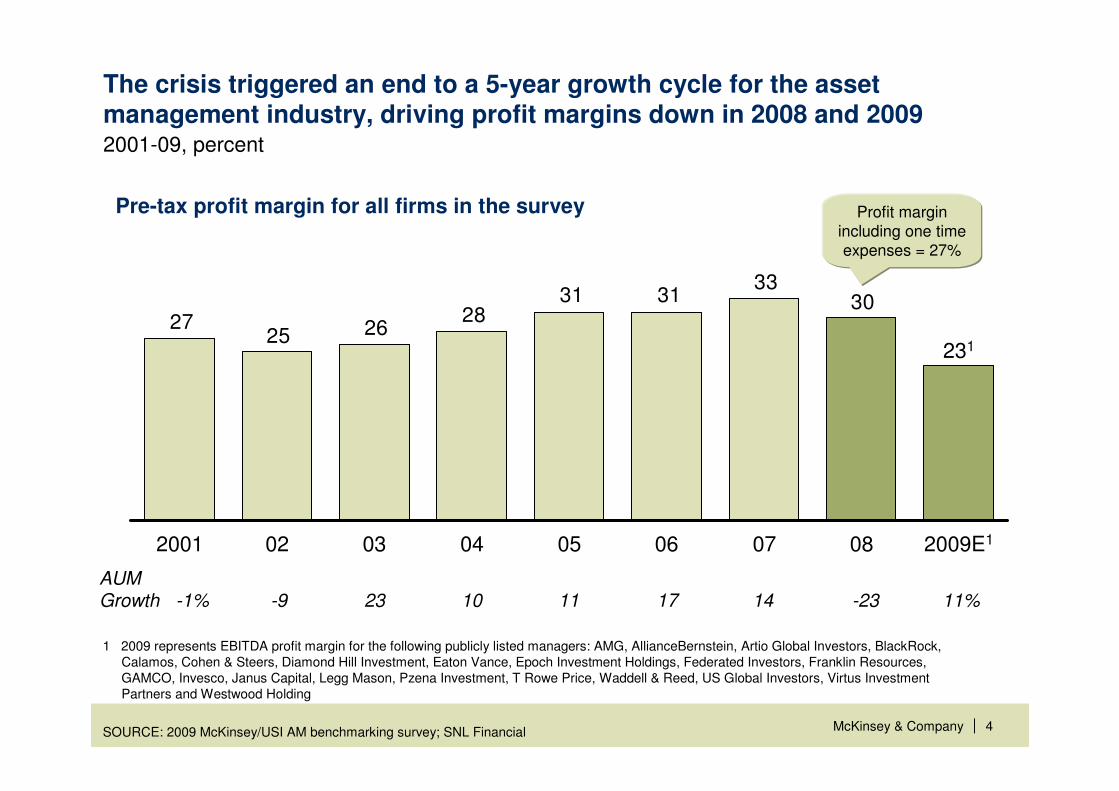
The crisis triggered an end to a 5-year growth cycle for the asset management industry, driving profit margins down in 2008 and 2009
Pre-tax profit margin for all firms in the survey
2001-09, percent
3033
313128
262527
2009E1
231
080706050403022001
1 2009 represents EBITDA profit margin for the following publicly listed managers: AMG, AllianceBernstein, Artio Global Investors, BlackRock, Calamos, Cohen & Steers, Diamond Hill Investment, Eaton Vance, Epoch Investment Holdings, Federated Investors, Franklin Resources, GAMCO, Invesco, Janus Capital, Legg Mason, Pzena Investment, T Rowe Price, Waddell & Reed, US Global Investors, Virtus Investment Partners and Westwood Holding
SOURCE: 2009 McKinsey/USI AM benchmarking survey; SNL Financial
Profit margin including one time expenses = 27%
11%AUM Growth -1% -9 23 10 11 17 14 -23
|McKinsey & Company 5
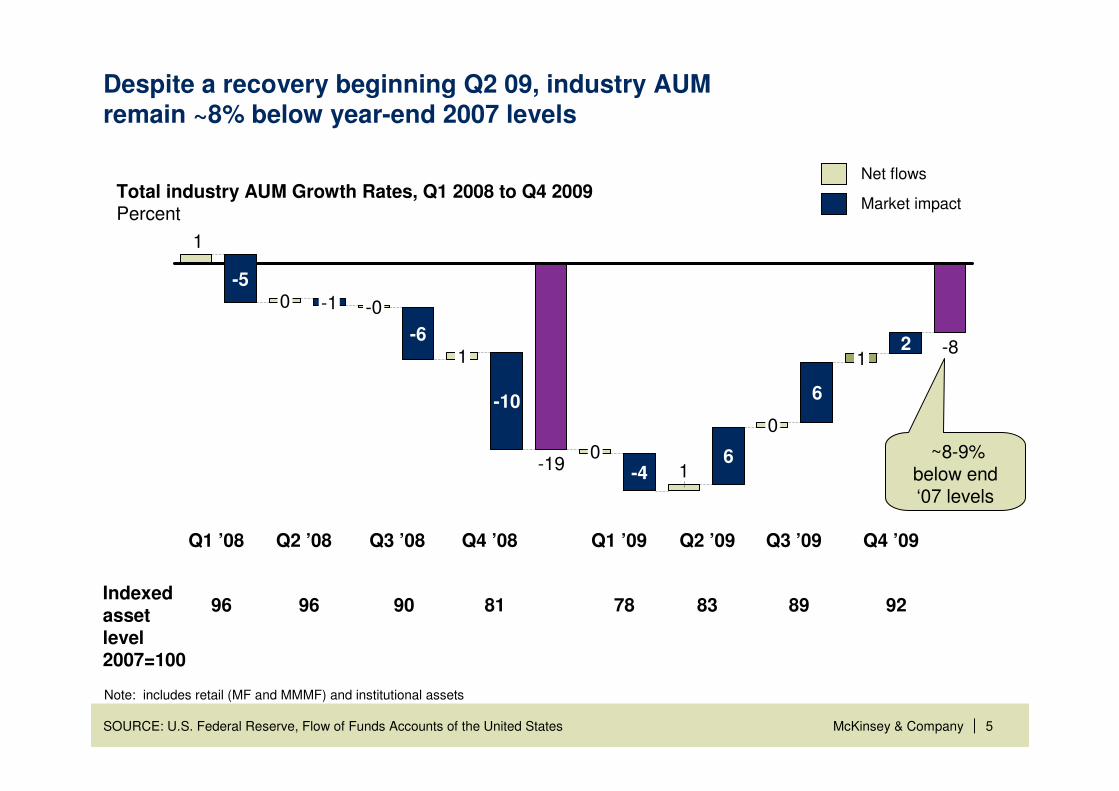
Despite a recovery beginning Q2 09, industry AUM remain ~8% below year-end 2007 levels
SOURCE: U.S. Federal Reserve, Flow of Funds Accounts of the United States
1
2
6
0
61-4
0-19
-0-10-5
1-8
1
-6
-10
Total industry AUM Growth Rates, Q1 2008 to Q4 2009Percent
Net flows
Market impact
Indexed asset level 2007=100
Q1 ’08
96
Q2 ’08
96
Q3 ’08
90
Q4 ’08
81
Q1 ’09
78
Q2 ’09
83
Q3 ’09
89
~8-9% below end ‘07 levels
Q4 ’09
92
Note: includes retail (MF and MMMF) and institutional assets
|McKinsey & Company 6
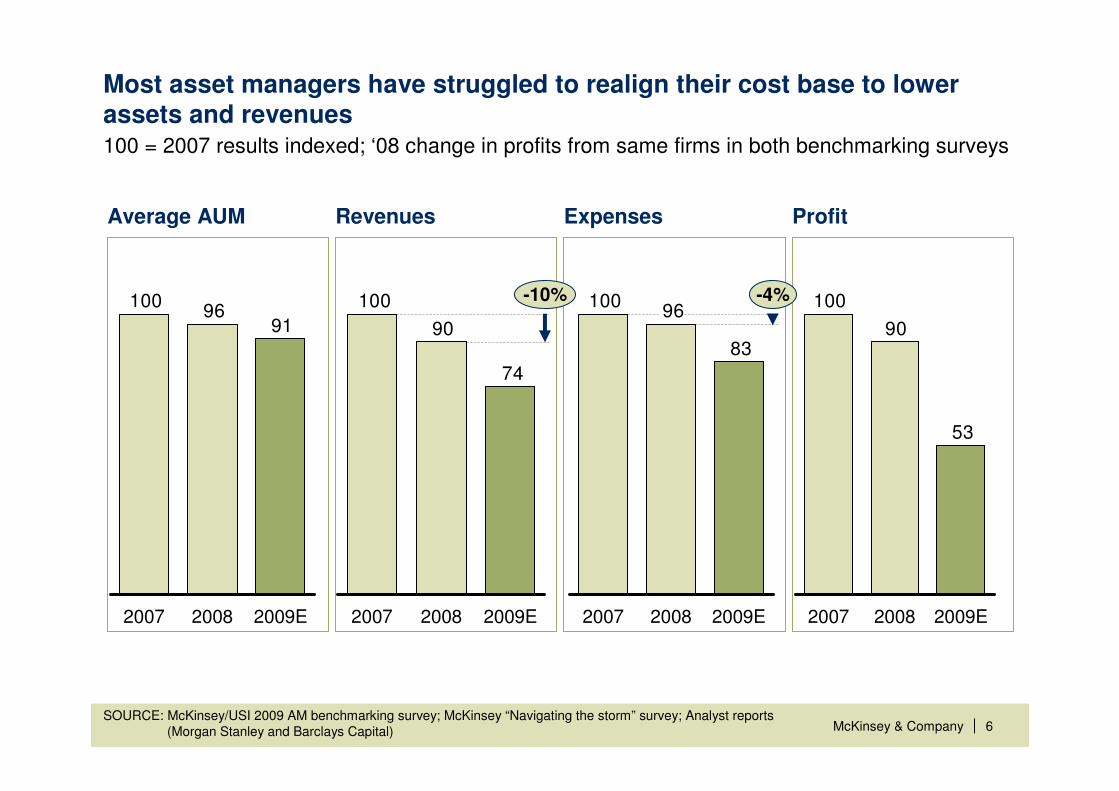
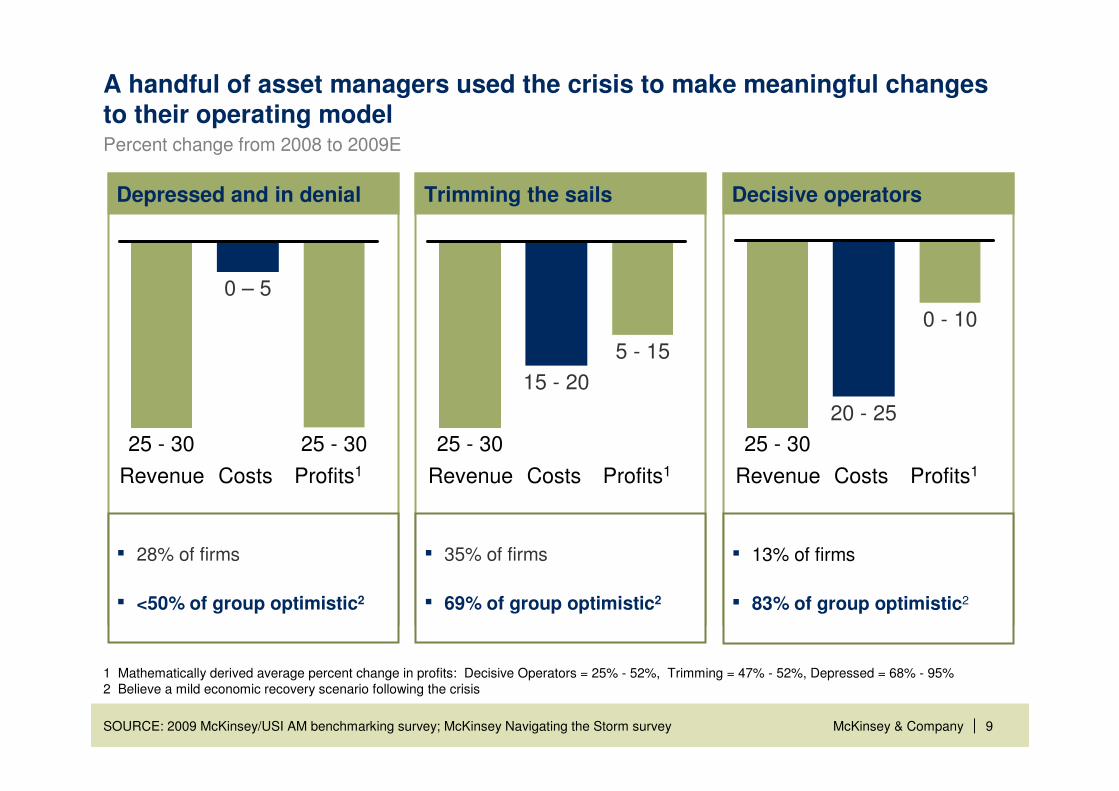
Most asset managers have struggled to realign their cost base to lower assets and revenues
SOURCE: McKinsey/USI 2009 AM benchmarking survey; McKinsey “Navigating the storm” survey; Analyst reports (Morgan Stanley and Barclays Capital)
Average AUM Revenues Expenses Profit
9196
100
2009E20082007
74
90
100
2009E20082007
-10%
83
96100
2009E20082007
-4%
53
90
100
2009E20082007
100 = 2007 results indexed; ‘08 change in profits from same firms in both benchmarking surveys
|McKinsey & Company 7
Key messages
2009 marked a decade low in AM margins
Excellence in business management, not just investment management, is now required for firms to build a robust operating model
Looking ahead, despite a lot of uncertainty, the asset management market can be an opportunity-rich environment for firms that can capitalize on 5 structural shifts
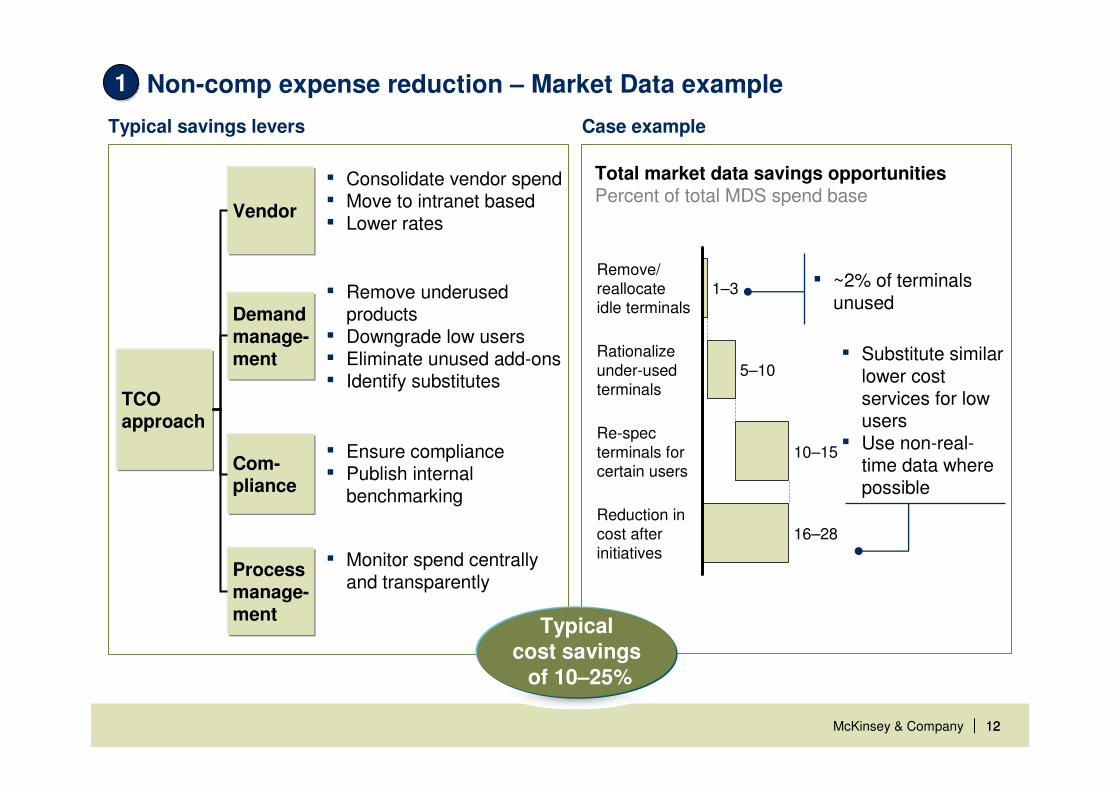
Total market data savings opportunitiesPercent of total MDS spend base
▪ ~2% of terminals unused
▪ Substitute similar lower cost services for low users
▪ Use non-real-time data where possible
Typical cost savings
of 10–25%
|McKinsey & Company 1313
Product development
▪ Install lean requirements definition process with a set of go / no-go points between Ops & Technology and the product groups before product launch
Investment management
▪ Improve cycle time of innovation and pre-trade investment ideas
▪ Implement cost, quality and service metrics to manage vendor performance
Asset management operations
▪ Implement common workflows to simplify process and reduce waste
Fund administration
▪ Optimize staff locations to load balance and segment complexity by asset type
Client Service▪ Consolidate redundant functional units (e.g., transfer
agency processing groups)
Lean techniques across the value chain22
|McKinsey & Company 1414
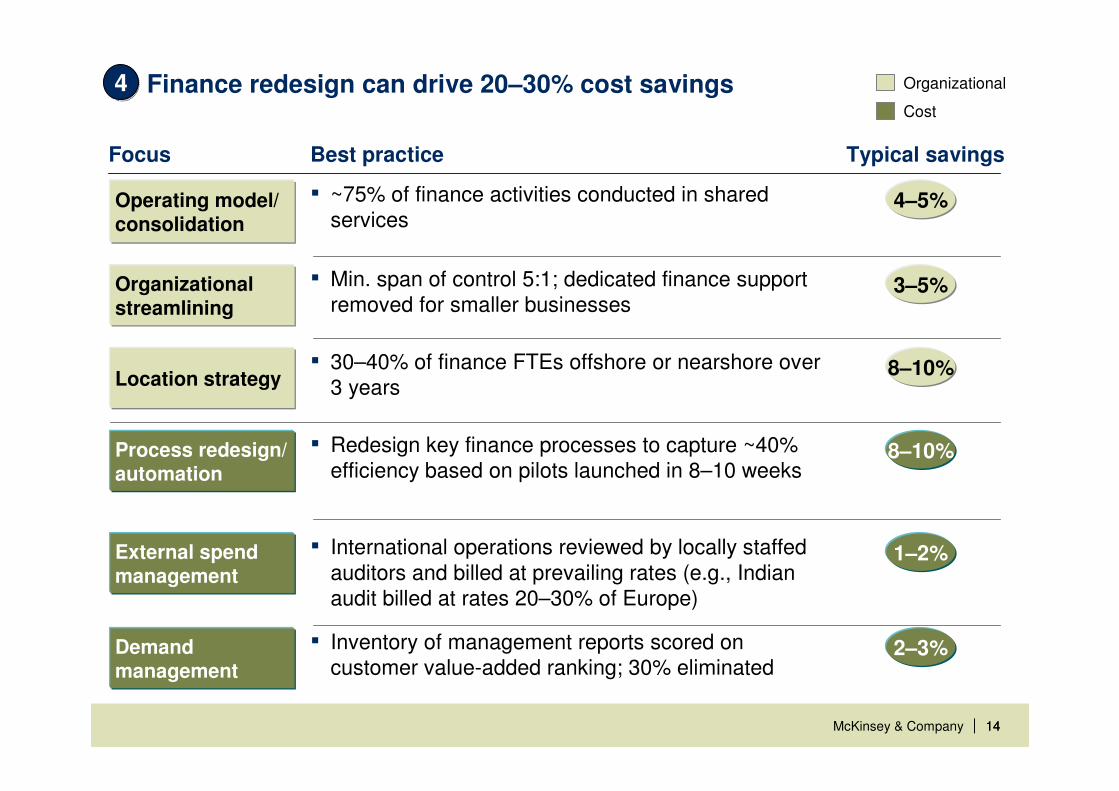
Finance redesign can drive 20–30% cost savings
1–2%
44 Organizational
Best practice Typical savingsFocus
4–5%Operating model/ consolidation
▪ ~75% of finance activities conducted in shared services
Organizational streamlining
▪ Min. span of control 5:1; dedicated finance support removed for smaller businesses
3–5%
Location strategy▪ 30–40% of finance FTEs offshore or nearshore over
3 years8–10%
Cost
Process redesign/ automation
▪ Redesign key finance processes to capture ~40% efficiency based on pilots launched in 8–10 weeks
8–10%
External spend management
▪ International operations reviewed by locally staffed auditors and billed at prevailing rates (e.g., Indian audit billed at rates 20–30% of Europe)
Demand management
▪ Inventory of management reports scored on customer value-added ranking; 30% eliminated
2–3%
|McKinsey & Company 1515
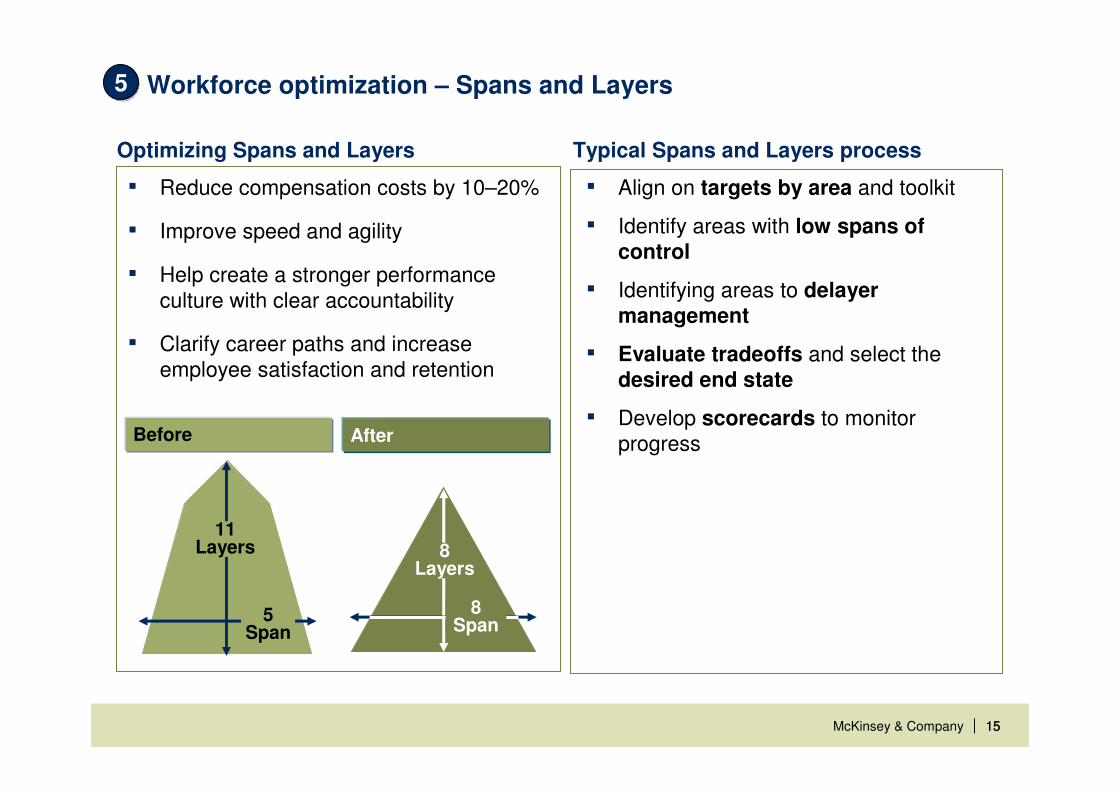
Workforce optimization – Spans and Layers
Optimizing Spans and Layers
▪ Reduce compensation costs by 10–20%
▪ Improve speed and agility
▪ Help create a stronger performance culture with clear accountability
▪ Clarify career paths and increase employee satisfaction and retention
Typical Spans and Layers process
▪ Align on targets by area and toolkit
▪ Identify areas with low spans of control
▪ Identifying areas to delayer management
▪ Evaluate tradeoffs and select the desired end state
▪ Develop scorecards to monitor progress
8Layers
AfterBefore
11Layers
5Span
8Span
55
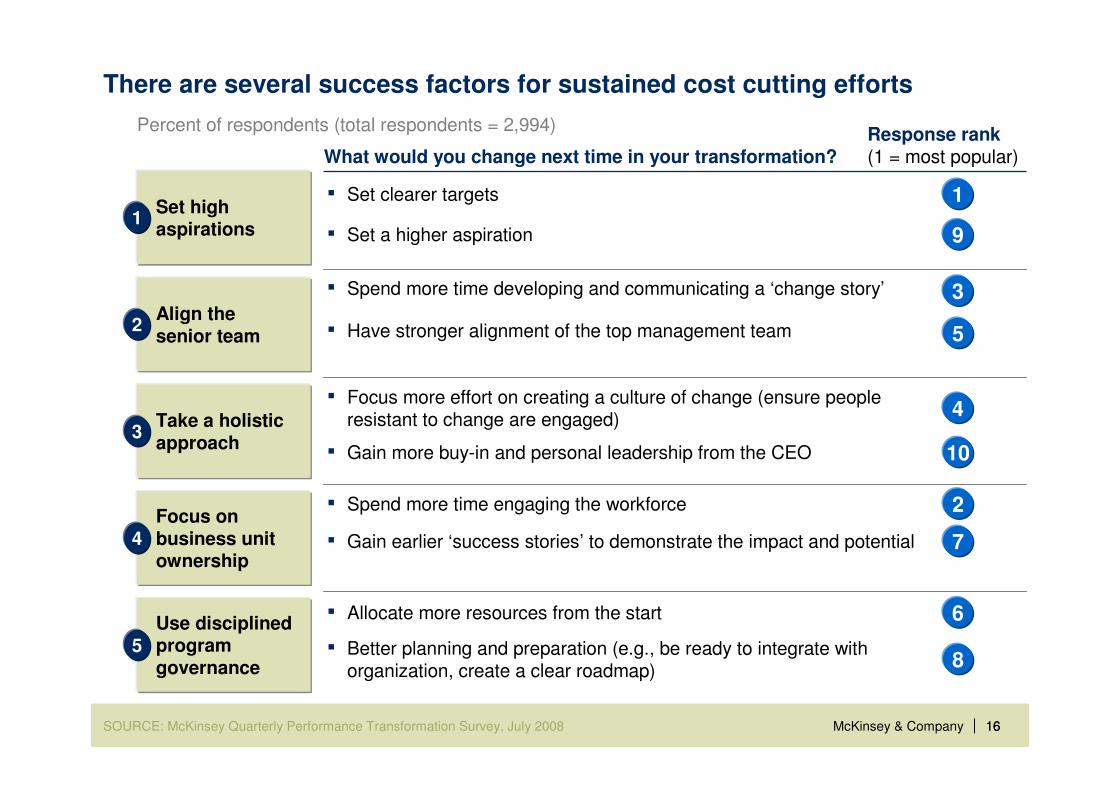
|McKinsey & Company 1616 SOURCE: McKinsey Quarterly Performance Transformation Survey, July 2008
There are several success factors for sustained cost cutting efforts
Percent of respondents (total respondents = 2,994)
What would you change next time in your transformation?
▪ Better planning and preparation (e.g., be ready to integrate with organization, create a clear roadmap)
▪ Allocate more resources from the startUse disciplined program governance
5
▪ Focus more effort on creating a culture of change (ensure peopleresistant to change are engaged)
▪ Gain more buy-in and personal leadership from the CEO
Take a holistic approach
3
▪ Spend more time engaging the workforce
▪ Gain earlier ‘success stories’ to demonstrate the impact and potential
Focus on business unit ownership
4
▪ Spend more time developing and communicating a ‘change story’
▪ Have stronger alignment of the top management teamAlign the senior team
2
▪ Set a higher aspiration
Set high aspirations
1
▪ Set clearer targets
Response rank(1 = most popular)
9
1
5
3
7
2
8
6
10
4
|McKinsey & Company 17
Key messages
2009 marked a decade low in AM margins
Excellence in business management, not just investment management, is now required for firms to build a robust operating model
Looking ahead, despite a lot of uncertainty, the asset management market can be an opportunity-rich environment for firms that can capitalize on 5 structural shifts
1
2
3
|McKinsey & Company 18
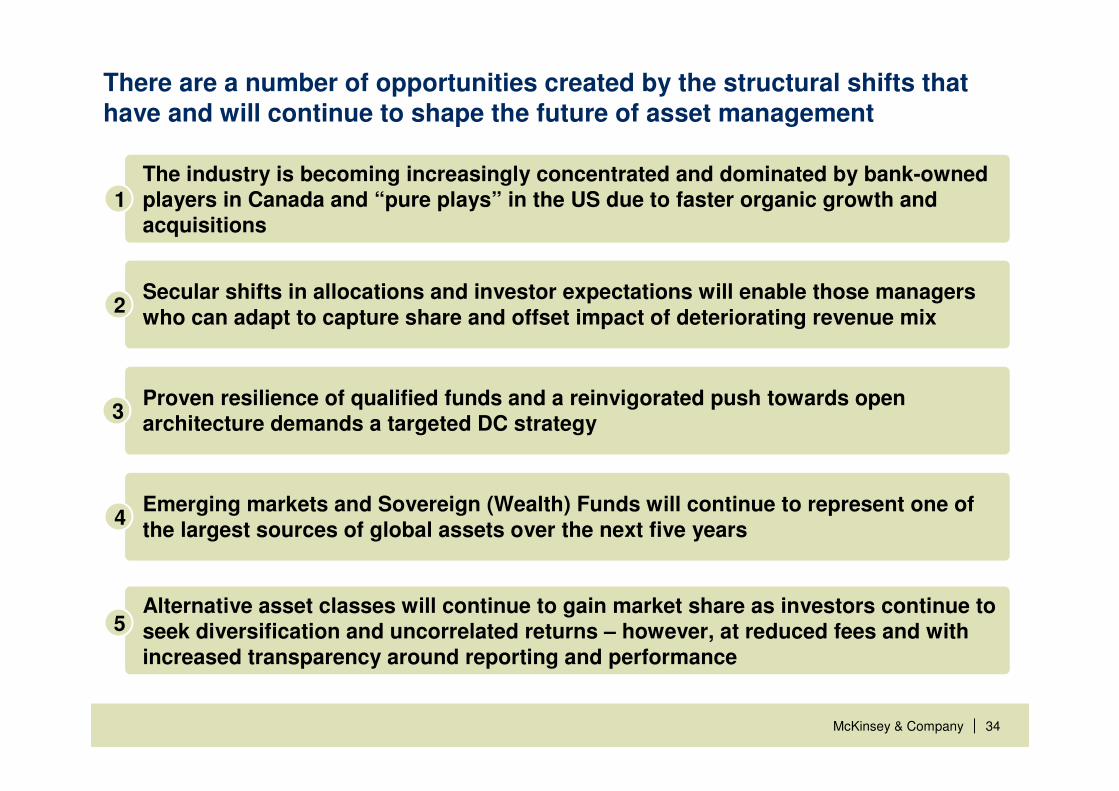
There are a number of opportunities created by structural shifts that have and will continue to shape the future of asset management
1The industry is becoming increasingly concentrated and dominated by bank-owned players in Canada and “pure plays” in the US due to faster organic growth and acquisitions
|McKinsey & Company 19
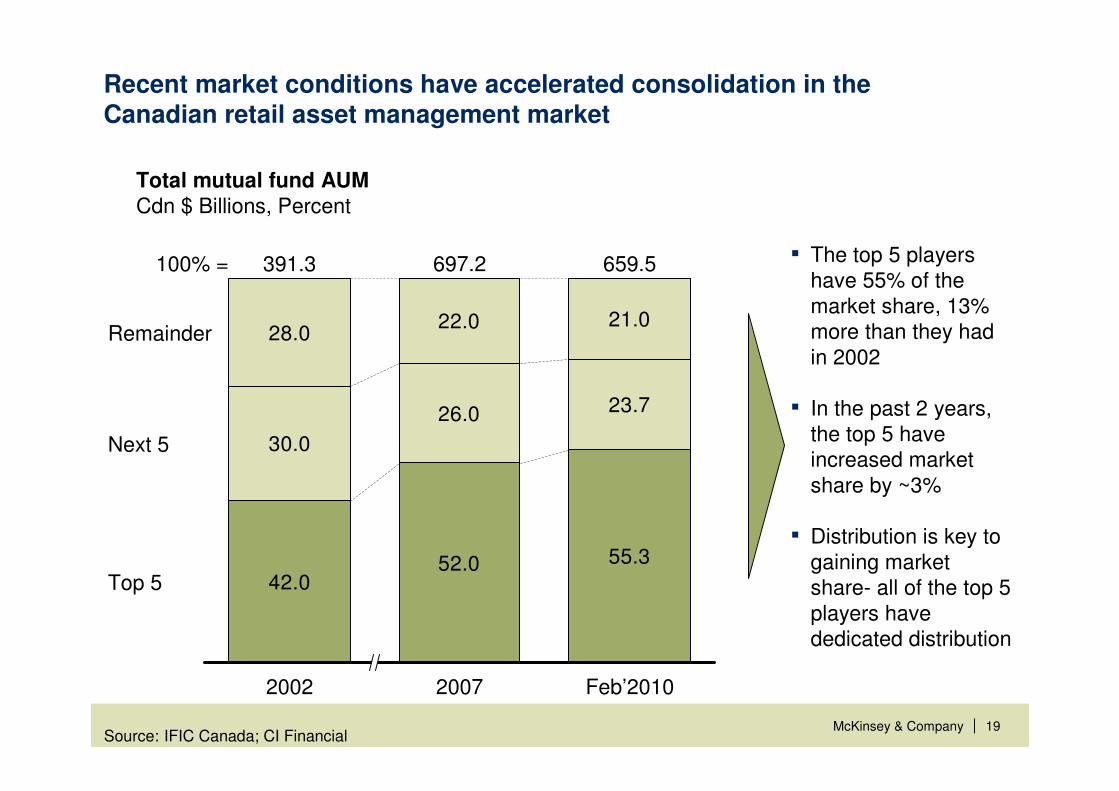
Recent market conditions have accelerated consolidation in the Canadian retail asset management market
Total mutual fund AUM Cdn $ Billions, Percent
Source: IFIC Canada; CI Financial
42.052.0 55.3
30.0
26.0 23.7
28.022.0 21.0
2002
391.3100% =
Top 5
Next 5
Remainder
Feb’2010
659.5
2007
697.2 ▪ The top 5 players have 55% of the market share, 13% more than they had in 2002
▪ In the past 2 years, the top 5 have increased market share by ~3%
▪ Distribution is key to gaining market share- all of the top 5 players have dedicated distribution
|McKinsey & Company 20SOURCE: Institutional Investor; SNL Financial; McKinsey
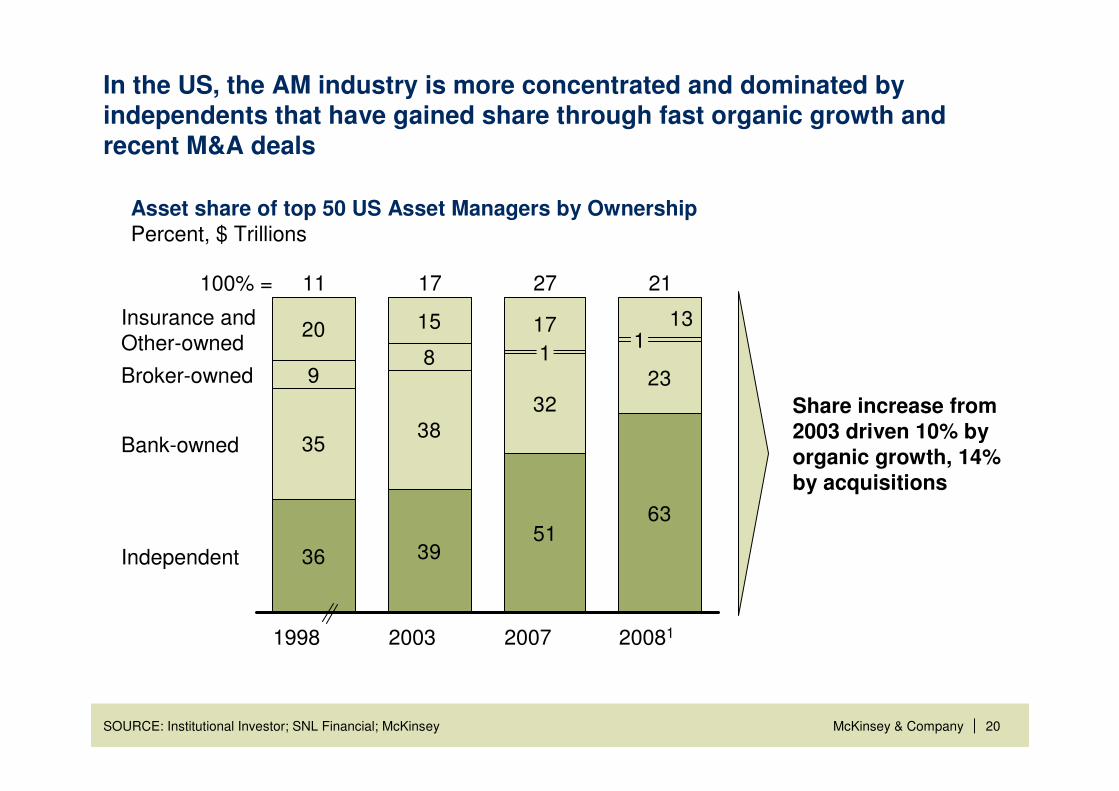
36 3951
63
3538
32
2398
20 15 17 13
11
1998
17
2003
1
27
2007
1
21
20081
Insurance andOther-owned
Broker-owned
Bank-owned
Independent
100% =
Asset share of top 50 US Asset Managers by OwnershipPercent, $ Trillions
In the US, the AM industry is more concentrated and dominated byindependents that have gained share through fast organic growth and recent M&A deals
Share increase from 2003 driven 10% by organic growth, 14% by acquisitions
|McKinsey & Company 21
There are a number of opportunities created by the structural shifts that have and will continue to shape the future of asset management
2Secular shifts in allocations and investor expectations will enable those managers who can adapt to capture share and offset impact of deteriorating revenue mix
1The industry is becoming increasingly concentrated and dominated by bank-owned players in Canada and “pure plays” in the US due to faster organic growth and acquisitions
|McKinsey & Company 22
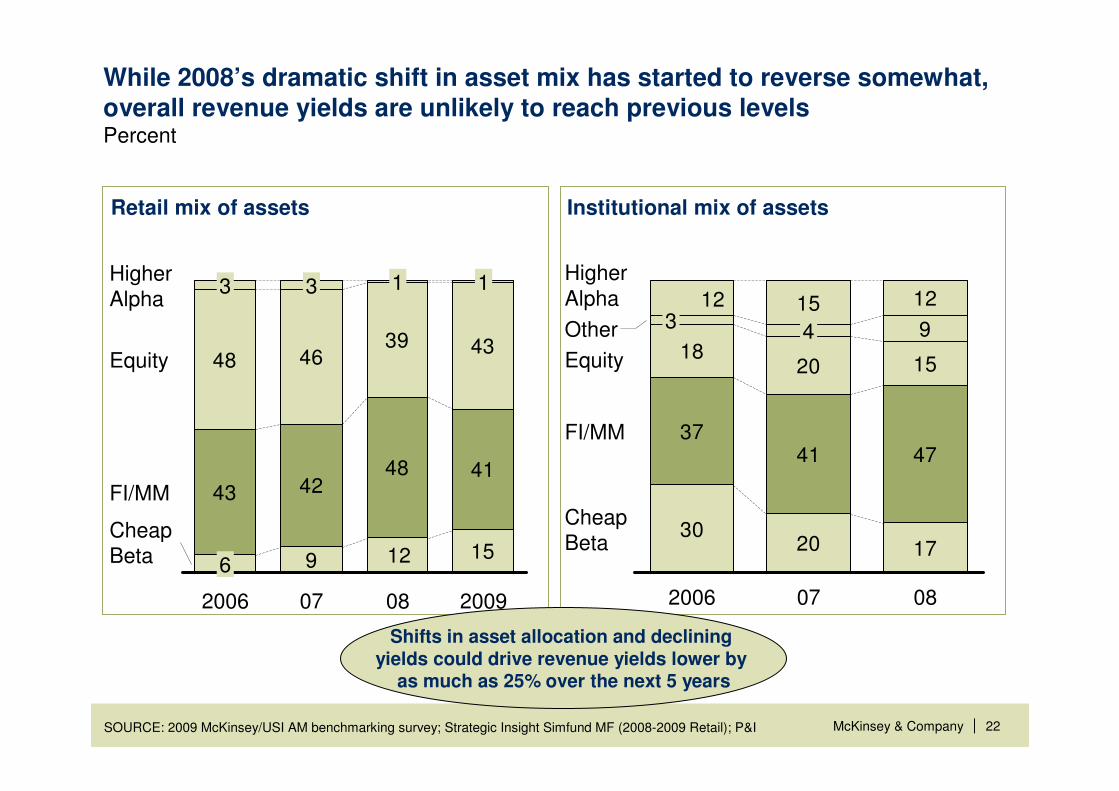
Retail mix of assets
9 1512
41484243
43394648
Cheap Beta
FI/MM
Equity
Higher Alpha
2009
1
08
1
07
3
2006
6
3
Institutional mix of assets
3020 17
3741 47
1820 15
15 12
9
123
Cheap Beta
FI/MM
Equity
Other
Higher Alpha
0807
4
2006
While 2008’s dramatic shift in asset mix has started to reverse somewhat, overall revenue yields are unlikely to reach previous levelsPercent
Shifts in asset allocation and declining yields could drive revenue yields lower by
as much as 25% over the next 5 years
|McKinsey & Company 23
Net revenue yields in retail and institutional AM have declined from their peakBps
Retail net revenues/AUM Institutional net revenues/AUM
3941423735363433
’09E1
341
’080706050403022001
434645
4851
545359
’09E1
351
080706050403022001
1 2009 based on publicly listed players only, Retail = Eaton Vance, Federated Investors, Franklin Templeton, Invesco, Janus, T Rowe Price, US Global Investors and Waddell & Reed; Institutional = Affiliated Managers Group, AllianceBernstein, Artio Global Investors, Calamos, Pzena, and Virtus Investment Partners
SOURCE: 2009 McKinsey/USI AM benchmarking survey; SNL Financial
Decline due to lower revenue yields and changing asset and product mix
|McKinsey & Company 24
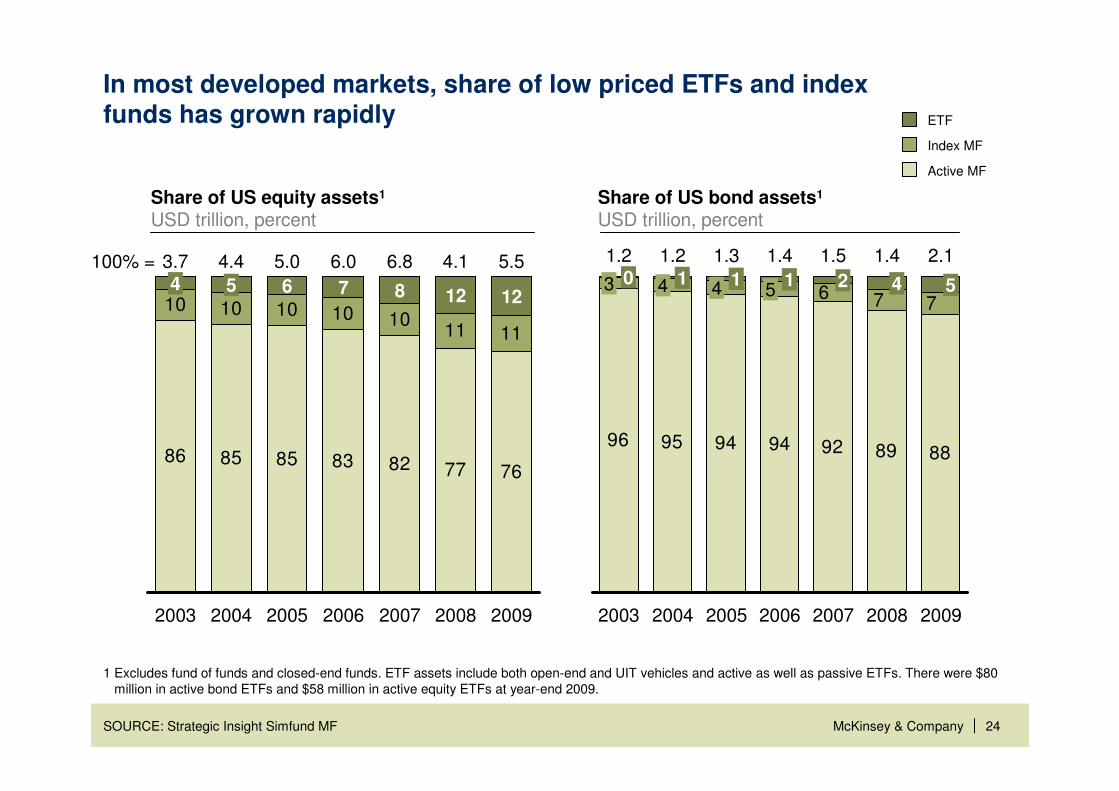
In most developed markets, share of low priced ETFs and index funds has grown rapidly
1 Excludes fund of funds and closed-end funds. ETF assets include both open-end and UIT vehicles and active as well as passive ETFs. There were $80 million in active bond ETFs and $58 million in active equity ETFs at year-end 2009.
SOURCE: Strategic Insight Simfund MF
76778283858586
111110101010108
2006
6.0 6.8
2007
124
3.7
2003
5
4.4
2004
4.1
2009
7
2005
100% = 5.0 5.5
12
2008
6
Index MF
Active MF
ETF
Share of US equity assets1
USD trillion, percent
96 95 94 94 92 89 88
7761 4
20072005
1.3 1.5
4 21
2004 2006
1.41.2
54 1
2003
1.2
3 0 5
2008 2009
1.4 2.1
Share of US bond assets1
USD trillion, percent
|McKinsey & Company 25
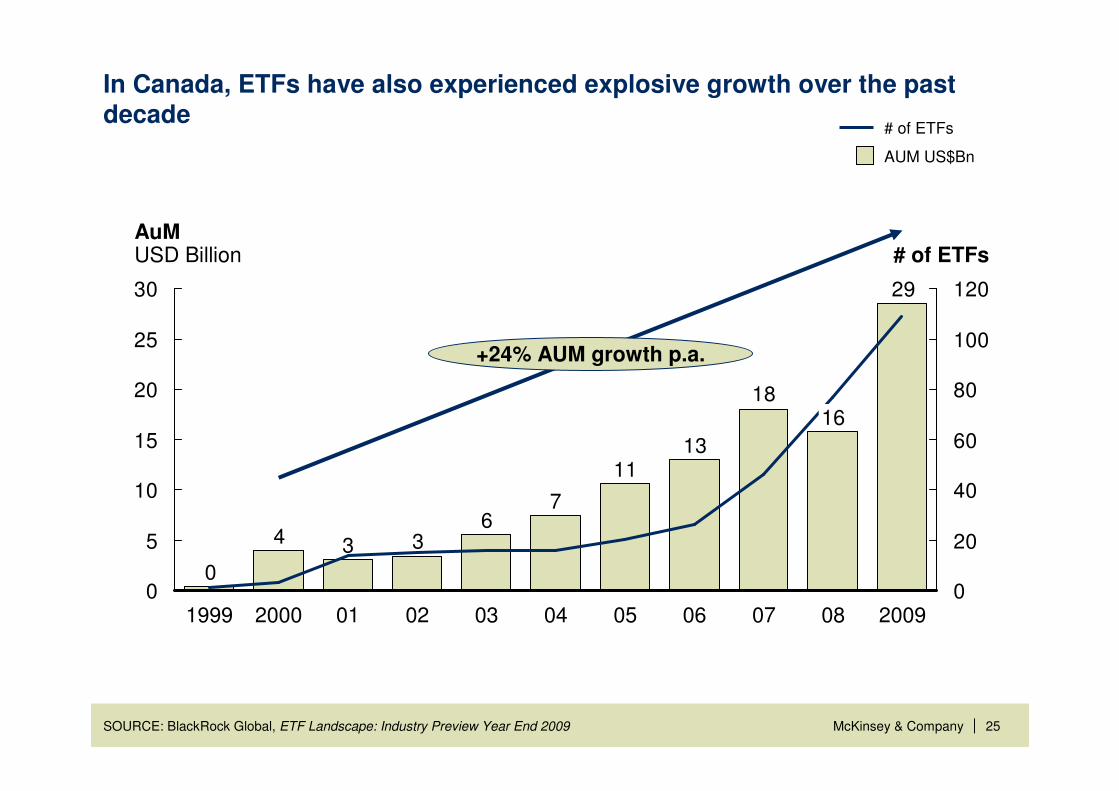
In Canada, ETFs have also experienced explosive growth over the past decade
SOURCE: BlackRock Global, ETF Landscape: Industry Preview Year End 2009
29
18
1311
76
334
00
5
10
15
20
25
30
0
20
40
60
80
100
120
# of ETFsAuM USD Billion
+24% AUM growth p.a.
200908
16
0706050403020120001999
AUM US$Bn
# of ETFs
|McKinsey & Company 26
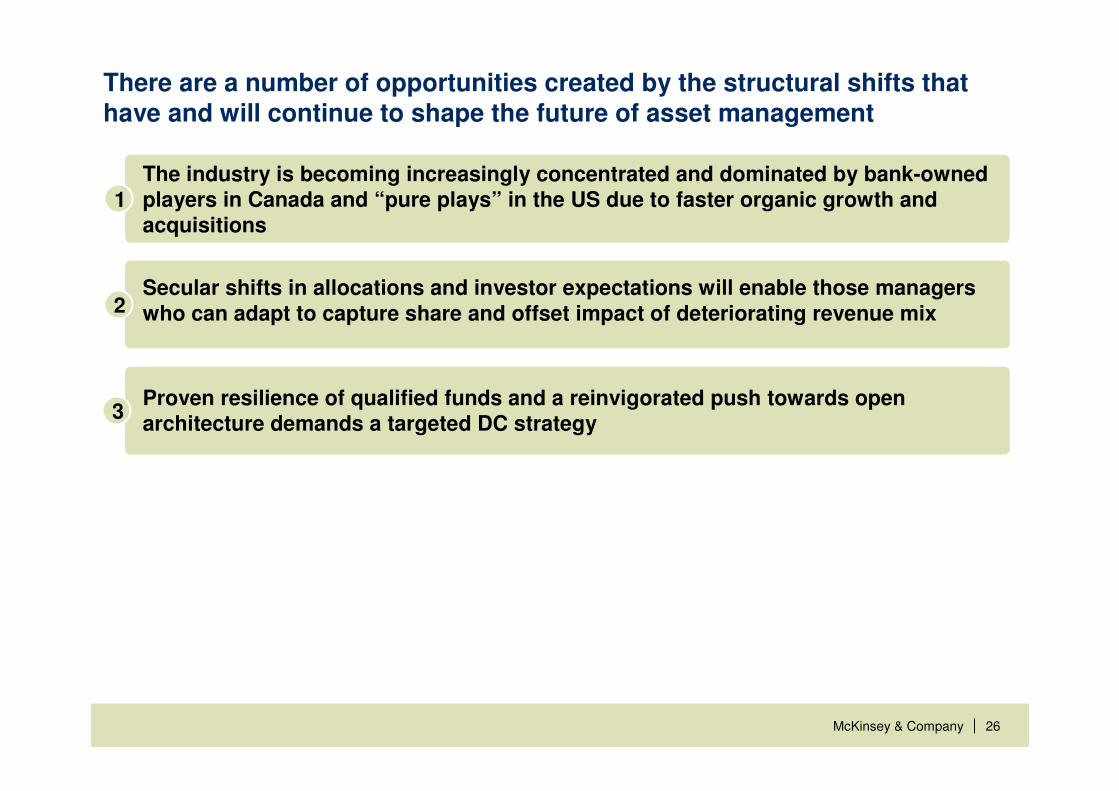
There are a number of opportunities created by the structural shifts that have and will continue to shape the future of asset management
Proven resilience of qualified funds and a reinvigorated push towards open architecture demands a targeted DC strategy
3
2Secular shifts in allocations and investor expectations will enable those managers who can adapt to capture share and offset impact of deteriorating revenue mix
1The industry is becoming increasingly concentrated and dominated by bank-owned players in Canada and “pure plays” in the US due to faster organic growth and acquisitions
|McKinsey & Company 27
DC assets likely to return to ‘07 levels by 2011 and approach $6 T by 2015
SOURCE: ICI; American Benefits Council; Vanguard; J.P. Morgan Asset Management
2.7
2015F assetsRollovers / Withdrawals
2.4
Market appreciation
Contributions2009E assets
4.2
0.5-1.8
DC assets$ Trillions
~5.4-6.1
Estimated DC net flows$ Billions
19
45
69
86
89
2014
2013
2012
2011
2010
2007 assets
4.5 CAGR 4-6%
Cumulative net flows: ~$300 B
|McKinsey & Company 28SOURCE: ICI; FRC; McKinsey analysis
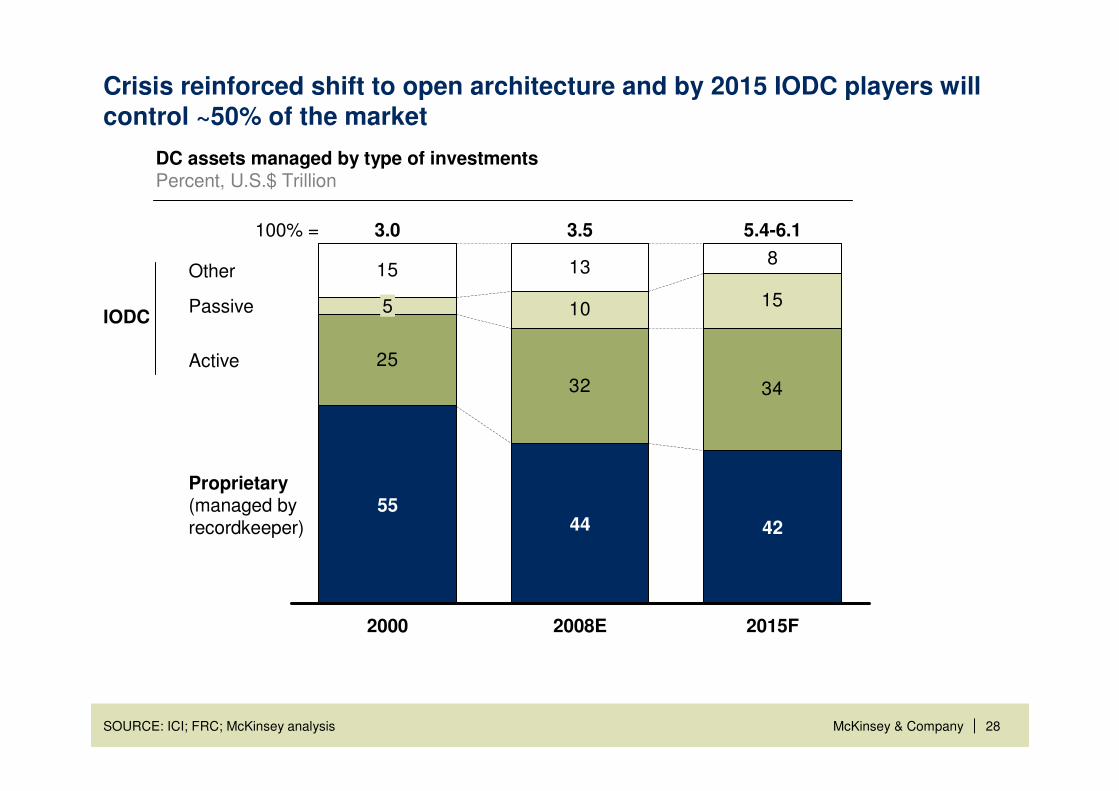
25
32 34
10 15
15 13 8
5.4-6.1
42
2008E
3.5
44
2000
3.0
55
5
2015F
100% =
Proprietary(managed by recordkeeper)
Active
Passive
Other
DC assets managed by type of investmentsPercent, U.S.$ Trillion
IODC
Crisis reinforced shift to open architecture and by 2015 IODC players will control ~50% of the market
|McKinsey & Company 29
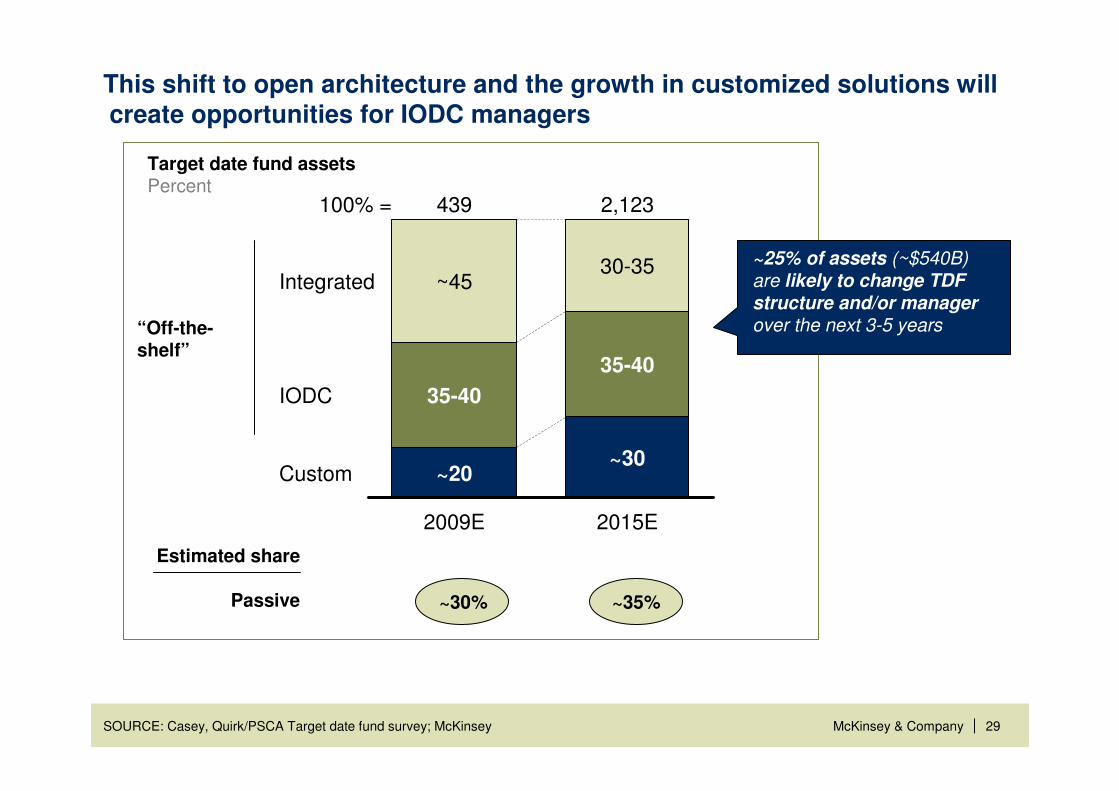
This shift to open architecture and the growth in customized solutions will create opportunities for IODC managers
SOURCE: Casey, Quirk/PSCA Target date fund survey; McKinsey
Passive
~25% of assets (~$540B) are likely to change TDF
structure and/or manager
over the next 3-5 years
Target date fund assetsPercent
Estimated share
“Off-the-shelf”
~30% ~35%
30-35
2015E
439100% =
~30
35-40
Integrated
35-40
2009E
~20
2,123
Custom
IODC
~45
|McKinsey & Company 30
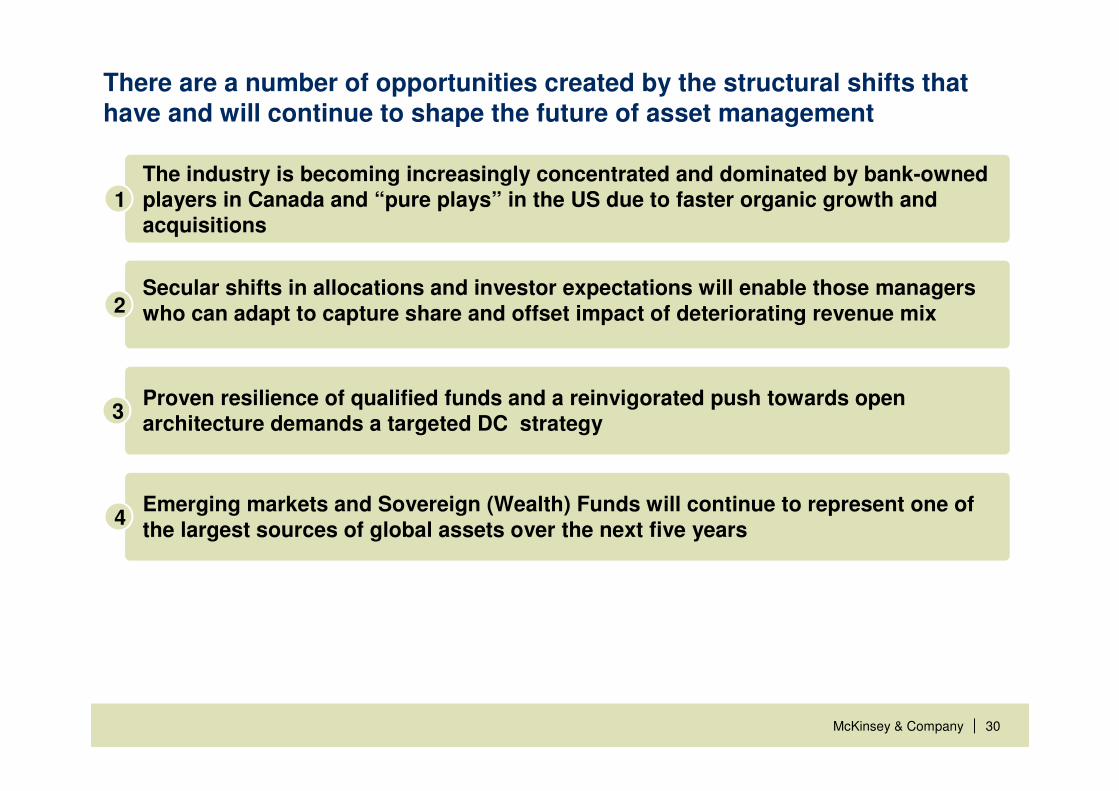
There are a number of opportunities created by the structural shifts that have and will continue to shape the future of asset management
Emerging markets and Sovereign (Wealth) Funds will continue to represent one of the largest sources of global assets over the next five years
4
Proven resilience of qualified funds and a reinvigorated push towards open architecture demands a targeted DC strategy
3
2Secular shifts in allocations and investor expectations will enable those managers who can adapt to capture share and offset impact of deteriorating revenue mix
1The industry is becoming increasingly concentrated and dominated by bank-owned players in Canada and “pure plays” in the US due to faster organic growth and acquisitions
|McKinsey & Company 31
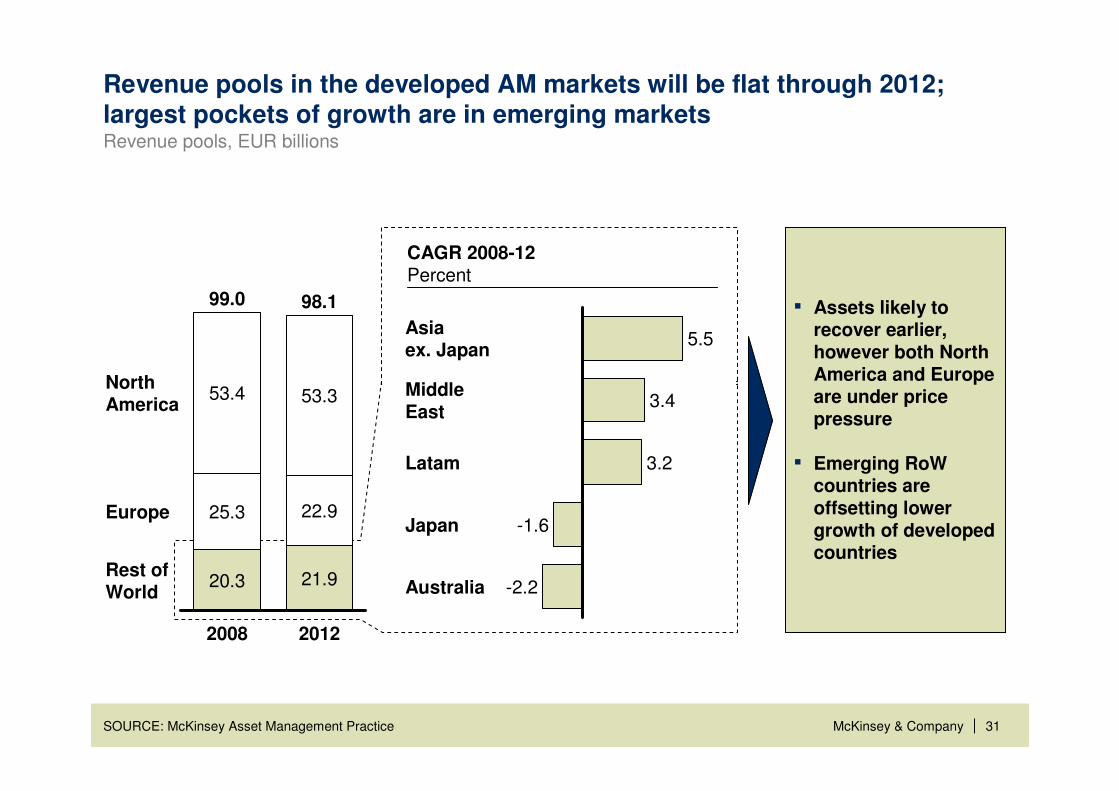
Revenue pools in the developed AM markets will be flat through 2012; largest pockets of growth are in emerging marketsRevenue pools, EUR billions
Europe 22.9
98.1
2012
21.9
North America
99.0
20.3
25.3
53.3
2008
53.4
Rest of World
CAGR 2008-12Percent
Australia
-1.6
Latam 3.2
-2.2
Japan
MiddleEast
3.4
Asiaex. Japan
5.5
▪ Assets likely to recover earlier, however both North America and Europe are under price pressure
▪ Emerging RoW countries are offsetting lower growth of developed countries
SOURCE: McKinsey Asset Management Practice
|McKinsey & Company 32
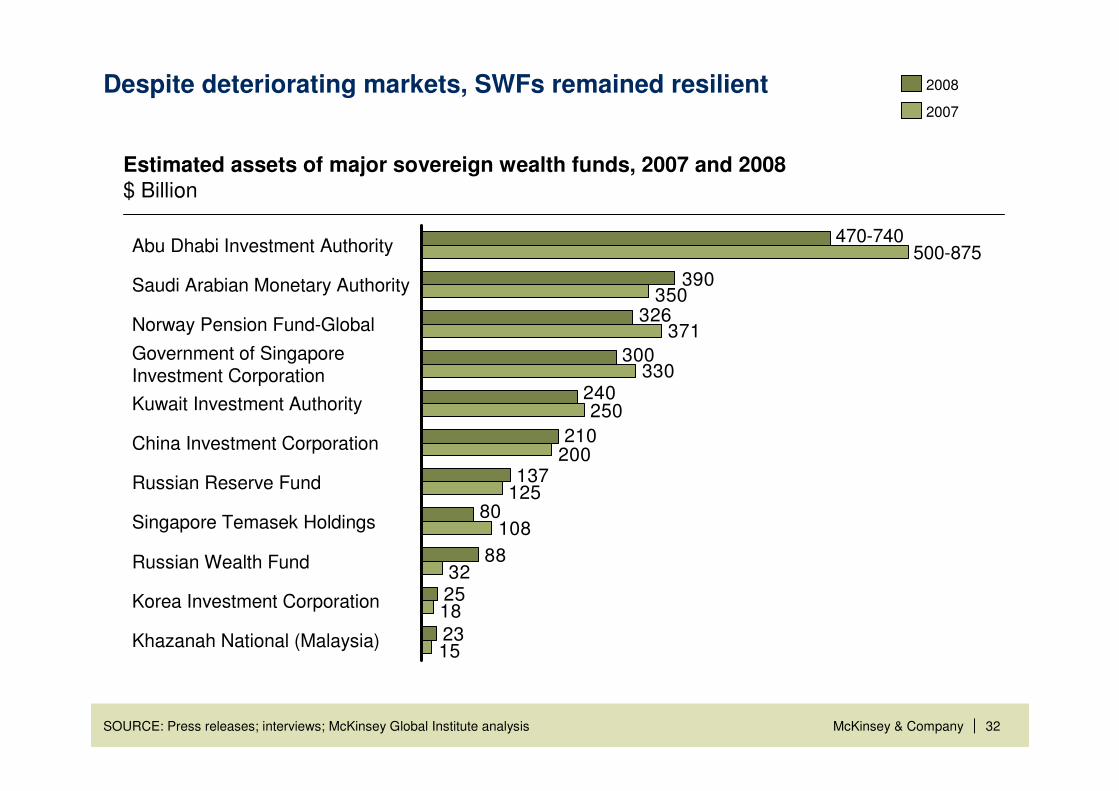
Despite deteriorating markets, SWFs remained resilient
23
25
88
80
137
210
240
300
326
390
15
18
32
108
125
200
250
330
371
350
470-740500-875Abu Dhabi Investment Authority
Saudi Arabian Monetary Authority
Norway Pension Fund-Global
Government of SingaporeInvestment Corporation
Kuwait Investment Authority
China Investment Corporation
Russian Reserve Fund
Singapore Temasek Holdings
Russian Wealth Fund
Korea Investment Corporation
Khazanah National (Malaysia)
2008
2007
Estimated assets of major sovereign wealth funds, 2007 and 2008 $ Billion
SOURCE: Press releases; interviews; McKinsey Global Institute analysis
|McKinsey & Company 33
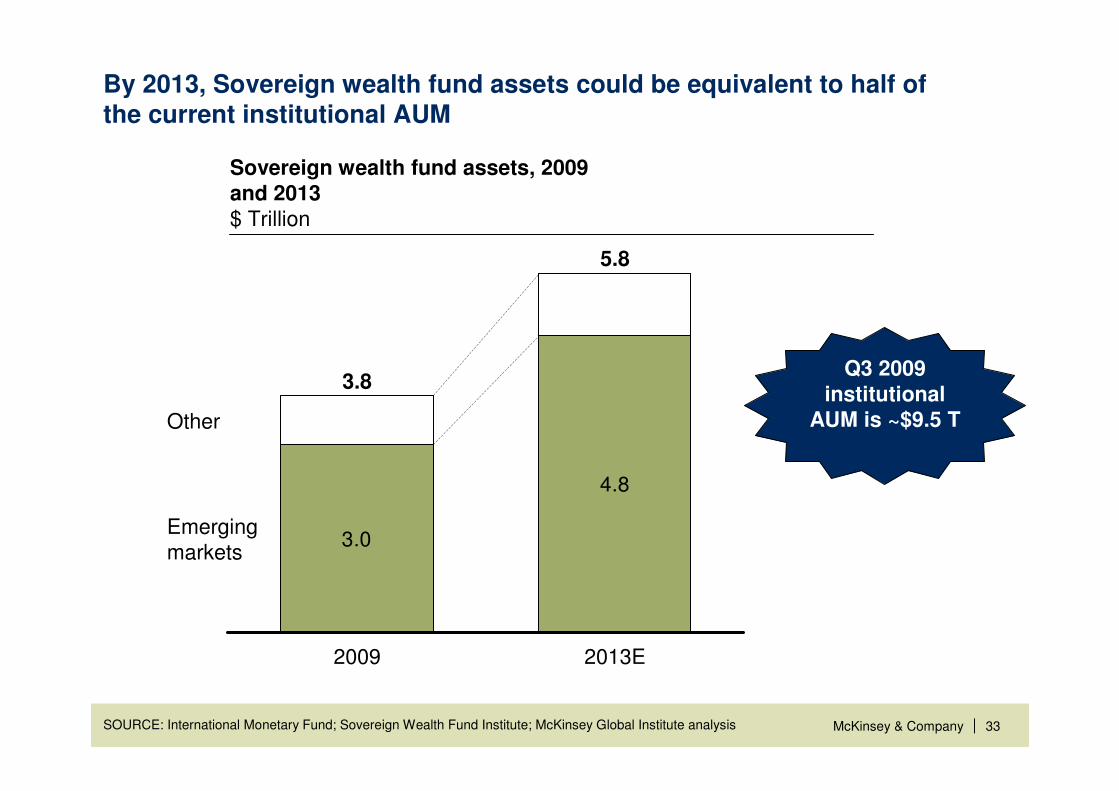
3.0
4.8
3.8
5.8
2013E
Emerging markets
Other
2009
By 2013, Sovereign wealth fund assets could be equivalent to half of the current institutional AUM
Sovereign wealth fund assets, 2009 and 2013$ Trillion
SOURCE: International Monetary Fund; Sovereign Wealth Fund Institute; McKinsey Global Institute analysis
Q3 2009 institutional
AUM is ~$9.5 T
|McKinsey & Company 34
There are a number of opportunities created by the structural shifts that have and will continue to shape the future of asset management
Alternative asset classes will continue to gain market share as investors continue to seek diversification and uncorrelated returns – however, at reduced fees and with increased transparency around reporting and performance
5
Emerging markets and Sovereign (Wealth) Funds will continue to represent one of the largest sources of global assets over the next five years
4
Proven resilience of qualified funds and a reinvigorated push towards open architecture demands a targeted DC strategy
3
2Secular shifts in allocations and investor expectations will enable those managers who can adapt to capture share and offset impact of deteriorating revenue mix
1The industry is becoming increasingly concentrated and dominated by bank-owned players in Canada and “pure plays” in the US due to faster organic growth and acquisitions
|McKinsey & Company 35
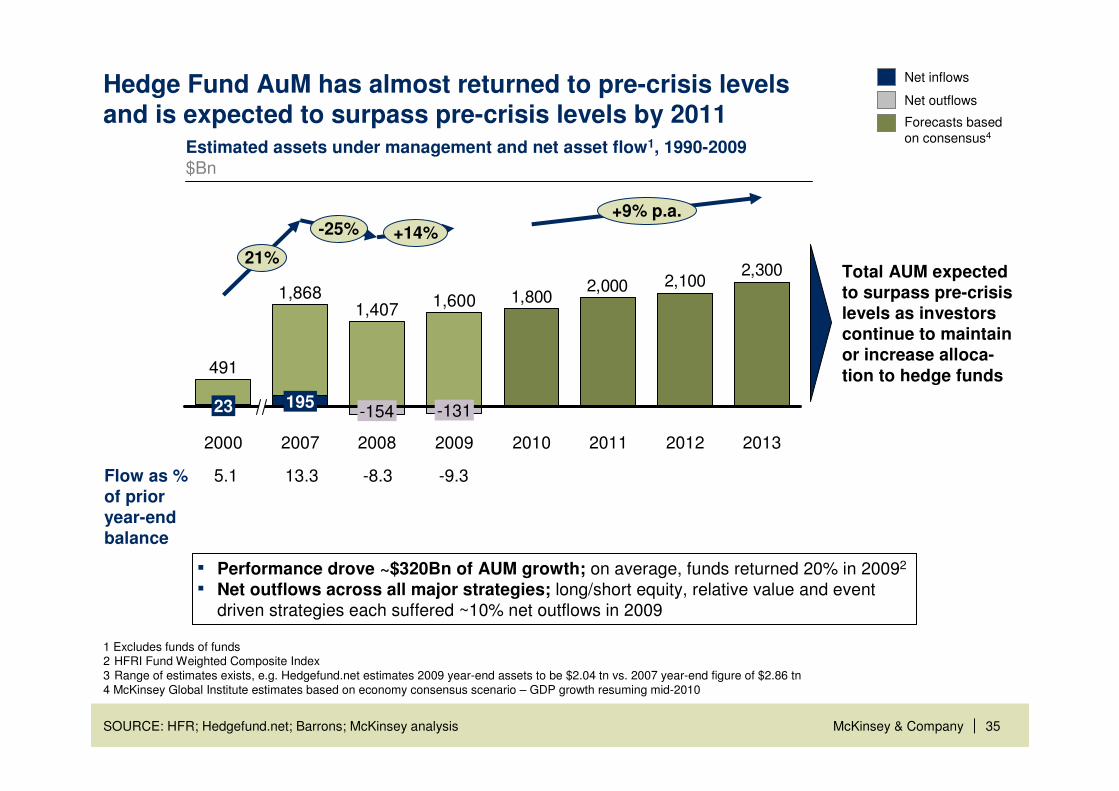
Hedge Fund AuM has almost returned to pre-crisis levels and is expected to surpass pre-crisis levels by 2011
Estimated assets under management and net asset flow1, 1990-2009$Bn
2,3002,1002,000
1,800
+9% p.a.
+14%
21%
-25%
20132012201120102009
1,600
-131
2008
1,407
-154
2007
1,868
195
2000
491
23
1 Excludes funds of funds2 HFRI Fund Weighted Composite Index3 Range of estimates exists, e.g. Hedgefund.net estimates 2009 year-end assets to be $2.04 tn vs. 2007 year-end figure of $2.86 tn4 McKinsey Global Institute estimates based on economy consensus scenario – GDP growth resuming mid-2010
Flow as % of prior year-end balance
5.1 13.3 -8.3 -9.3
▪ Performance drove ~$320Bn of AUM growth; on average, funds returned 20% in 20092
▪ Net outflows across all major strategies; long/short equity, relative value and event driven strategies each suffered ~10% net outflows in 2009
Total AUM expected to surpass pre-crisis levels as investors continue to maintain or increase alloca-tion to hedge funds
Net inflows
Net outflows
Forecasts based on consensus4
|McKinsey & Company 36
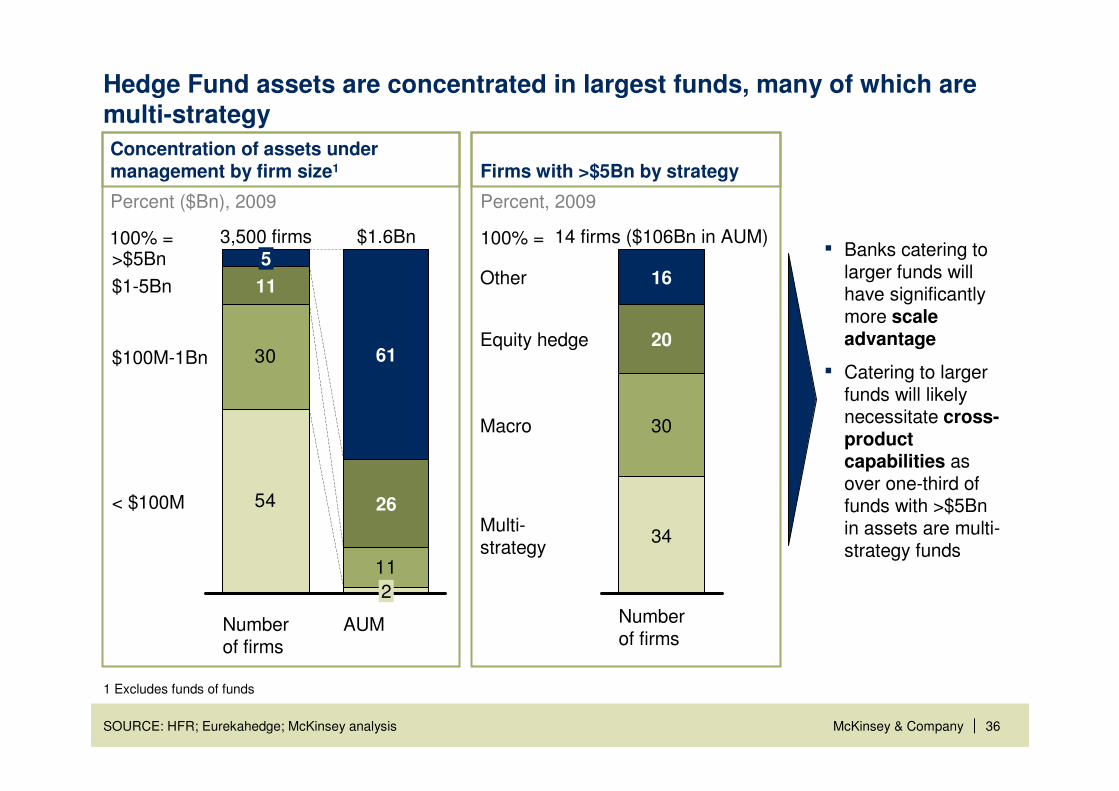
Hedge Fund assets are concentrated in largest funds, many of which are multi-strategy
SOURCE: HFR; Eurekahedge; McKinsey analysis
1 Excludes funds of funds
▪ Banks catering to larger funds will have significantly more scale advantage
▪ Catering to larger funds will likely necessitate cross-product capabilities as over one-third of funds with >$5Bnin assets are multi-strategy funds
30
11
54< $100M
$100M-1Bn
$1-5Bn
>$5Bn
AUM
$1.6Bn
2
26
61
Number of firms
3,500 firms
11
5
Concentration of assets under management by firm size1 Firms with >$5Bn by strategy
100% = 100% =
Multi-strategy
Macro
Equity hedge
Other
Number of firms
20
30
16
14 firms ($106Bn in AUM)
34
Percent, 2009 Percent ($Bn), 2009
|McKinsey & Company 37
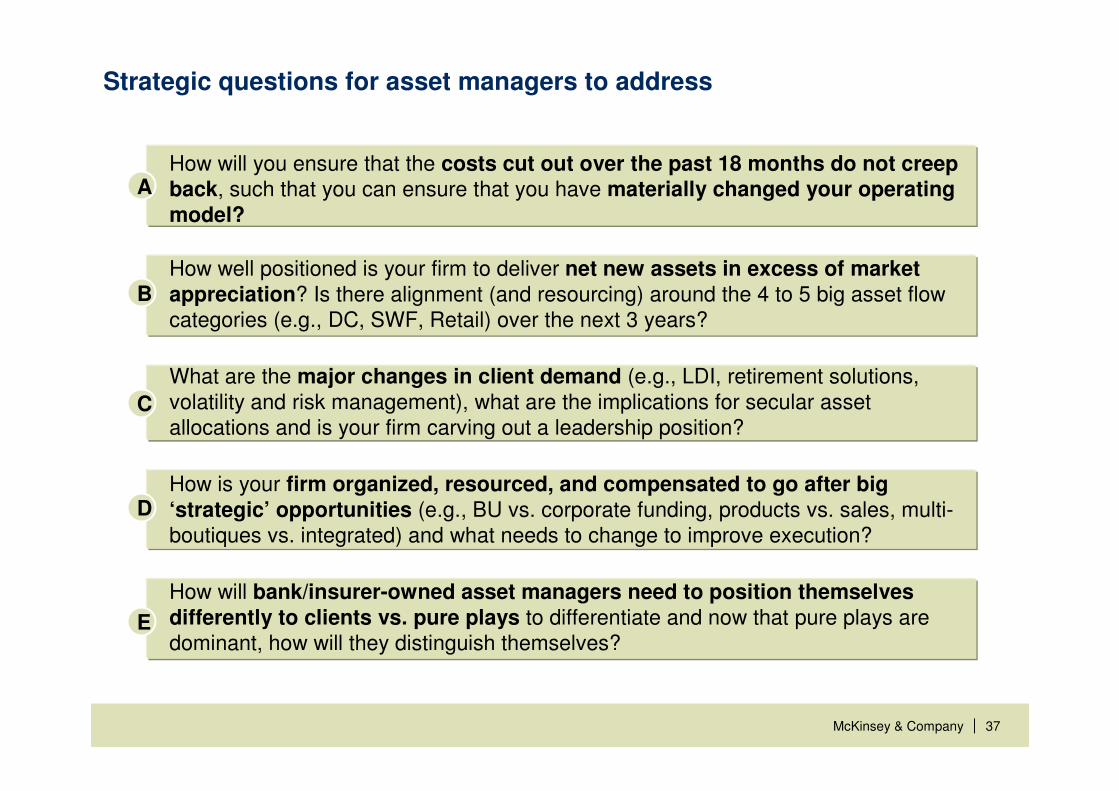
E
Strategic questions for asset managers to address
D
C
B
AHow will you ensure that the costs cut out over the past 18 months do not creep back, such that you can ensure that you have materially changed your operating model?
How well positioned is your firm to deliver net new assets in excess of market appreciation? Is there alignment (and resourcing) around the 4 to 5 big asset flow categories (e.g., DC, SWF, Retail) over the next 3 years?
What are the major changes in client demand (e.g., LDI, retirement solutions, volatility and risk management), what are the implications for secular asset allocations and is your firm carving out a leadership position?
How is your firm organized, resourced, and compensated to go after big ‘strategic’ opportunities (e.g., BU vs. corporate funding, products vs. sales, multi-boutiques vs. integrated) and what needs to change to improve execution?
How will bank/insurer-owned asset managers need to position themselves differently to clients vs. pure plays to differentiate and now that pure plays are dominant, how will they distinguish themselves?
|McKinsey & Company 38
Appendix
|McKinsey & Company 39
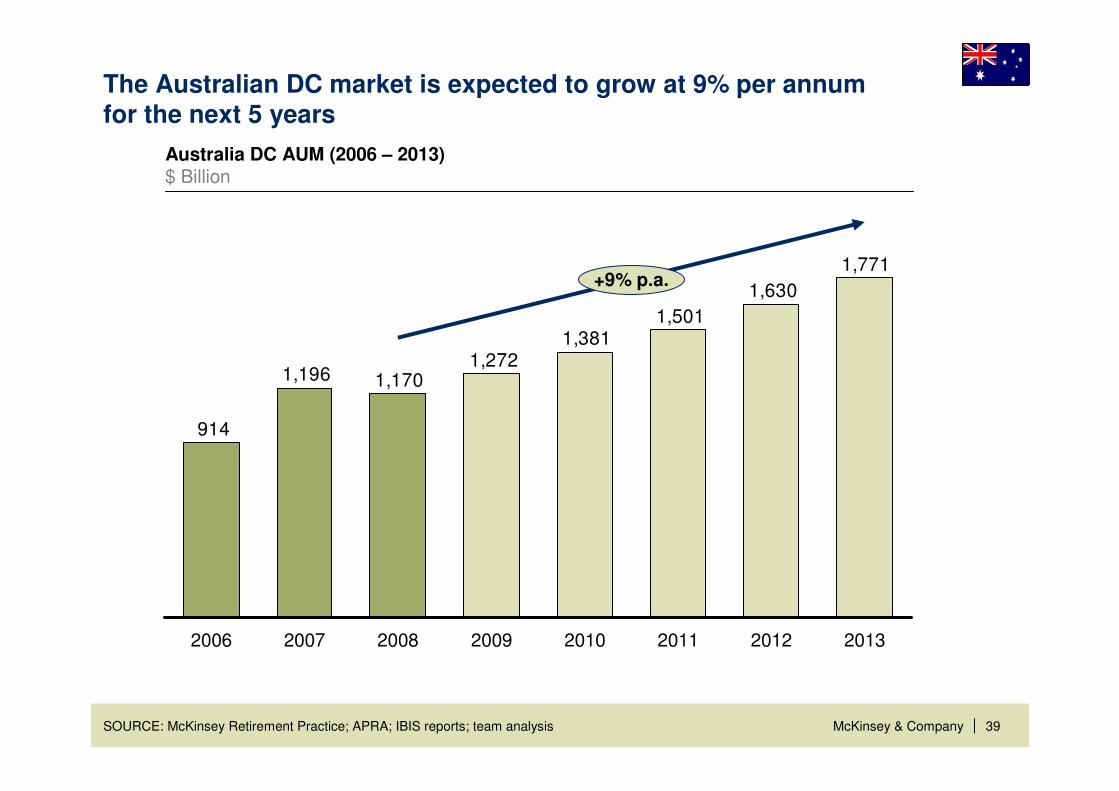
The Australian DC market is expected to grow at 9% per annumfor the next 5 years
SOURCE: McKinsey Retirement Practice; APRA; IBIS reports; team analysis
Australia DC AUM (2006 – 2013) $ Billion
1,771
1,630
1,5011,381
1,2721,1701,196
914
2006 2007 20092008 2010
+9% p.a.
20132011 2012
|McKinsey & Company 40
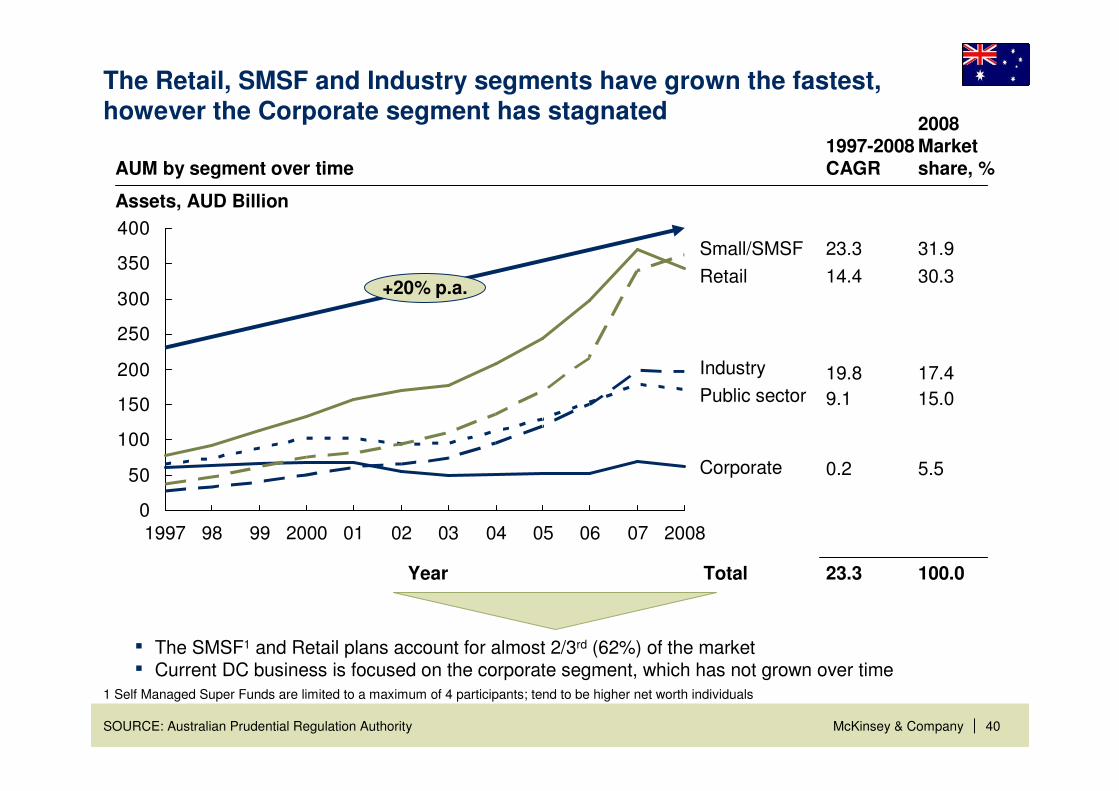
The Retail, SMSF and Industry segments have grown the fastest, however the Corporate segment has stagnated
SOURCE: Australian Prudential Regulation Authority
0
50
100
150
200
250
300
350
400
1997 98 99 2000
Corporate
0504030201 06
Industry
Public sector
Retail
Small/SMSF
07 2008
+20% p.a.
1997-2008CAGR
23.3
14.4
19.8
9.1
0.2
23.3Total
AUM by segment over time
Assets, AUD Billion
Year
▪ The SMSF1 and Retail plans account for almost 2/3rd (62%) of the market▪ Current DC business is focused on the corporate segment, which has not grown over time
1 Self Managed Super Funds are limited to a maximum of 4 participants; tend to be higher net worth individuals