STRUCTURAL TRANSFORMATION OF THE INDIAN ECONOMY AND ITS AGRICULTURE: 1961-2040 CABR annual meeting, Frascati, Italy June 27-29, 2011 Hans P. Binswanger-Mkhize, Kirit Parikh, Alwin d’Souza and Probal Ghosh
Transcript
STRUCTURAL TRANSFORMATION OF
THE INDIAN ECONOMY AND ITS
AGRICULTURE: 1961-2040
CABR annual meeting, Frascati, Italy
June 27-29, 2011
Hans P. Binswanger-Mkhize, Kirit Parikh, Alwind’Souza and Probal Ghosh
The past: 1961-2010
The future: 2011-2040
Comparison with other Asian countries
Outline
Hans Binswanger-Mkhize and Alex McCalla,
“The Changing Context and Prospects for
African Agricultural Development,” IFAD and
AFDB, Rome and Tunis, 2009
http://www.ifad.org/evaluation/jointevaluation/do
cs/annex1.pdf
Long version in Handbook of Agricultural Development
At the outset of Structural Transformation (ST), labor and
economic output are both concentrated in Agriculture
The share of labor in agriculture exceeds the share in
nonagriculture
because labor productivity in agriculture is lower than in industry
During ST, the gaps in labor productivity and between the
agricultural shares of labor and output widen
A turning point is reached when the productivities and the
shares start converging
recently estimated by Peter Timmer at between 1600 and 9000
dollars per capita incomes ($ of 2000)
Convergence is driven by rapid absorption of labor in the
nonagricultural sector and by agricultural productivity growth
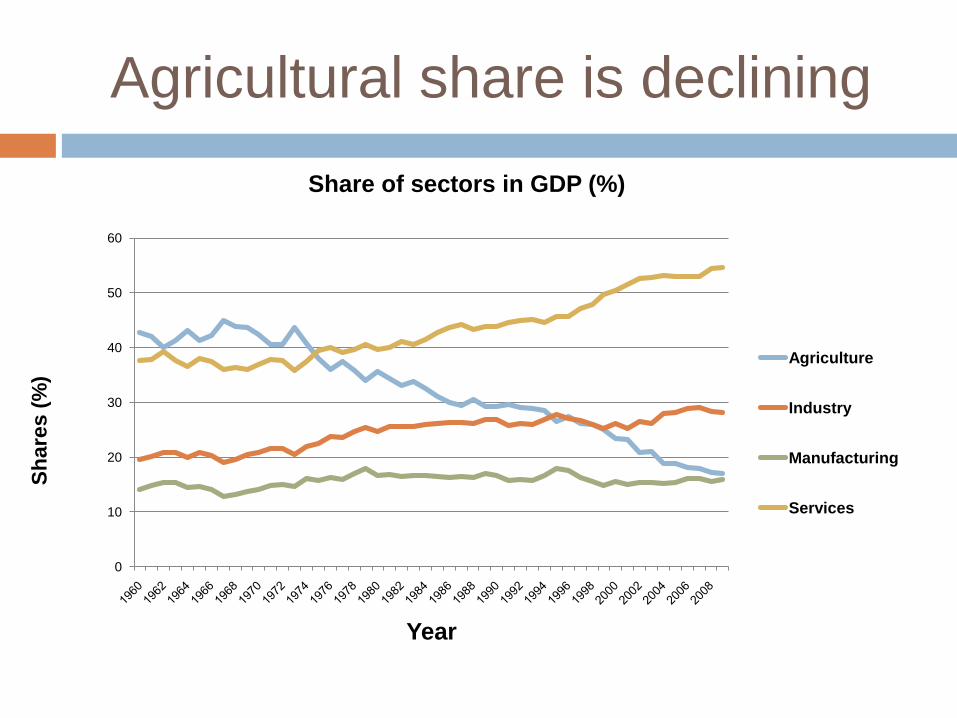
Agricultural share is declining
0
10
20
30
40
50
60
Sh
are
s (
%)
Year
Share of sectors in GDP (%)
Agriculture
Industry
Manufacturing
Services
Structural Transformation in
India
0
500
1,000
1,500
2,000
2,500
3,000
3,500
1961
1964
1967
1970
1973
1976
1979
1982
1985
1988
1991
1994
1997
2000
2003
2006
2009
Ag. output per worker and Non. Ag. output per worker
Ag output per ag worker
Non Ag. Output per worker
0
10
20
30
40
50
60
70
80
1960
1963
1966
1969
1972
1975
1978
1981
1984
1987
1990
1993
1996
1999
2002
2005
2008
Pe
rce
nta
ge(%
)
Year
Share of Ag. in labour force and GDP
Share of labor force
Share of Ag. In GDp
Structural Transformation in
China
0
1000
2000
3000
4000
5000
6000
7000
8000
1980
1982
1984
1986
1988
1990
1992
1994
1996
1998
2000
2002
2004
2006
2008
ou
tpu
t p
er
wo
rker
Year
Ag. output & Non. Ag. output per worker
Ag. Out. per worker
Non. Ag. Out. per worker
0
10
20
30
40
50
60
70
80
1980
1982
1984
1986
1988
1990
1992
1994
1996
1998
2000
2002
2004
2006
2008
perc
en
tag
e (
%)
Year
Share of Ag. Labor Force and Ag. Value Added
Ag. value added
Sh. of Ag. Labr. force
Productivity Growth in Agriculture
Indicator
Average
1961/62
to
1963/64
Average
last
avail
three
years
Growth rates for decade
or three year avg. centered on last year shown
Average
growth
rate of
2006-
20091961-
1970
1971-
1980
1981-
1990
1991-
2000
2001-
2009Agric. output
per ha of
cropland (US$
of 2000)
315 1044 1.73 1.91 3.81 2.42 2.62 3.07
Animal
output/head
of cattle
equivalent
(US$ of 2000)
43 148 0.65 2.85 3.46 3.11 3.32 3.41
TFP growth* 0.8 2.1 1.5 1.9*
TFP growth
China*4.2 2.7*
* till 2007
Structural Transformation has been very
slow, a turning point may be far away
Agricultural labor force is still growing and its share
in the economy is declining slowly
Agricultural productivity growth has slowed down
Increasingly divergence in labor productivity
between agriculture and nonagriculture
Agricultural unemployment has increased in the
past decade
Agricultural wage growth has slowed down
But urban and rural poverty
have converged
Population below poverty line (%)
20
30
40
50
60
70
1950 1960 1970 1980 1990 2000 2010
Urban
Rural
Notes: Poverty rates based on a new and consistent time series of poverty lines which are based in the original Planning
Commission poverty lines but updated over time using different price indexes. Source: Datt and Ravallion (2009)
Why is there not more divergence
The decline in poverty in rural areas is now driven
as much by urban growth as by rural growth
Urban employment has been skills and capital
intensive
Too few employment opportunities for lower skilled
Rising inequality and depth of urban poverty
Relatively slow rural-urban migration
Rural poverty remains concentrated among rural
labor, of lower skills who have little access to
migration or rural non-farm jobs
The rural non-farm sector has become the
major source of rural income and
employment growth
YearRural
Poverty
Agricultural
wage
Non farm
employmentGDPN
Nonfarm
GDPAgriculture GDP
1983
-
2004
-2.3 3.2 3.3 5.8 7.1 2.6
1983
-
1993
-2.2 3.2 3.5 5.2 6.4 2.9
1993
-
2004
--- 1.7 4.8 6.0 7.2 1.8
Source: Himanshu et al.2010 and Eswaran et al. 2009
Notes: GDP at factor cost at 1993-94 prices. Agriculture GDP originating in agriculture,
forestry, and fishing. Nonfarm GDP defined as a residual.
Annualized rates of growth)
The rural non-farm sector is the single
most important source of jobs in India
6 out of 10 new jobs in rural areas are now in the non-
farm sector
They offer significantly higher wages than farm labor, but have
contributed only 22 percent of the wage rise in rural areas
These jobs go mostly to young men with some education, and
women have a hard time getting them
Most jobs are casual jobs, and a growing share of rural non-farm
self employment
Trade and transport, construction, and services growing
especially fast
But manufacturing still about 20 percent of non-farm jobs
Rural manufacturing concentrated in areas of relatively low
wages and agricultural productivity
Rural non-farm self employment
has become especially dynamic
Out of 5760 households, 19.6% have non-farm self
employment, up from only 7.3 percent
The share of households who combine farm and non-farm self
employment has gone from 58% to 73%
Their non-farm profits have increased by 70%
exceeding farm profits of each of the farming households
Nonfarm self employment income now 19.6 % of total village
income, plus 7.8% from non-farm wages
Results from National REDS survey 1999-2007 of NCAER
What does it mean for future
structural transformation?
While urban-agricultural productivity differential
will continue to rise, rural urban income
differences will grow less on account of the non-
farm sector
Nevertheless agricultural productivity will have to
rise much more rapidly
To gradually allow for convergence to emerge
To avoid even more political tension with farmers
Accelerating agricultural productivity will take time
The political issue of agricultural parity income
will remain very salient
Agriculture and Rapid Economic
Growth: 2007 - 2040
Issues
Double Digit economic growth along with population
growth will drive up food demand rapidly.
Given the limited land and water resources, political
economy constraints over limits to imports, change
in composition of demand basket, will domestic
agriculture provide the required food?
We need to expand irrigation, intensify use of inputs
and accelerate TFPG through technological
developments. What roles do these play?
What will be the impact on rural urban migration?
Modeling Approach
An activity analysis multi-sector multi-period programming model
Maximizes discounted sum of private consumption over 2003 to 2043, 10 time points 4 years apart
Constrained by commodity balance, capacity constraints, BOP, land and irrigation constraints, upper bound of trade, investment and savings rates and availability of different types of investment goods.
28 commodities of which 15 are agricultural commodities.
40 production activities/sectors
20 consumption classes, 10 rural and 10 urban.
Urban/rural consumption parity ratio drives migration: Assumed to decline from 2.35 in 2003 to 1.75 by 2039
Class boundaries
Class RURAL URBAN
1(poorest) < 4000 < 5000
2 < 6800 < 10800
3 < 14200 < 31000
4 < 19175 < 46000
5 < 24150 < 61000
6 < 36225 < 91500
7 < 48300 < 122000
8 < 62375 < 162500
9 < 82450 < 200000
10(richest) > = 82450 >= 200000
Consumption Expenditure Class in Rs per person per year at
2003-04 prices
Model Specifications (contd…):
Discount rate(3%), min growth of private consumption(3%),
government consumption growth (9%), upper bound on