Structural Transitions and pH-Dependent Equilibria Between Unusual Double and Triple Helical Conformations of Nucleic Acid Polymers, Studied by UV Resonance Raman Spectroscopy
A. GFRORER, M. E. SCHNETrER, J. WOLFRUM, and K. O. GREULICH Physikalisch-Chemisches Institut, Universit6t Heidelberg, Im Neuenheimer Feld 253, D-6900 Heidelberg, Germany
In order to study pH-driven associations and equilibria between nucleic acid helices containing the homopolymers poly(A) and poly(U), the pH- value of solutions of poly(A) or poly(A)*poly(U) or the triple helix poly(U)*poly(A)*poly(U) was varied in steps of 0.5 p H units between p H = 7.0 and p H = 2.5. Resonance Raman spectra were taken with 260- n m and 220-nm excitation, both in H 2 0 and in D20 solvent. For the solutions containing poly(A) only, marked spectral changes between pH = 6.0 and p H = 5.5 can be attributed to the formation of the parallel s t randed double helix poly(A)+*poly(A) +. The cooperativity of this du- plex formation is better represented in the 260-nm than in the 220-nm excitation spectra. The double helix poly(A)*poly(U) remains stable down to p H = 5.0. At p H = 4.5 and 4.0, the experimental spectra can be understood by means of a superposition of the spectra of the triple hel ix poly(U)*poly(A)*poly(U) and the protonated double helix poly(A)+*poly(A) ÷. The triple helix itself is stable at these pH values, as can be concluded from the spectra of solutions of this polymer. Below p H = 4.0, the spectra can be calculated by the sum of poly(A)+*poly(A) ÷ and the single-stranded poly(U) polymer. All the helical transitions ob- served are better represented in the spectra excited with 260 nm, whereas the protonation state is better resolved in the 220-nm spectra. The data reported here provide a basis for further studies of unusual nucleic acid s t ructures as triple and quadruple helices and they show that UV-res- onance Raman spectroscopy is a sensitive tool for studying the kinetics and dynamics of the formation of these structures.
Index Headings : Resonance Raman; UV; Nucleic acids; He l ix confor- mation; pH-equilibria.
INTRODUCTION
For the determination of nucleic acid structures, clas- sical Raman spectroscopy has contributed much valuable data in the past. ~ More recently resonance Raman spec- troscopy with UV excitation has added great flexibility to vibrational diagnostics of nucleic acid structuresY -4 It offers not only the increased sensitivity but also the in- herent advantage of allowing one to choose an excitation wavelength at which, for instance, the spectral signatures of two or more conformations differ most. In the past, Raman investigations of nucleic acids used mainly fre- quencies and frequency shifts for the determination of structure-spectra correlations, the phosphate band sure- ly being the most important of these. Resonance Raman (RR) now offers the possibility of making more use of absolute and relative intensities, and to do this in a more systematic way. The resonance Raman-active bands of the nucleic bases do not reflect secondary structure in a way that is as obvious as is the case for the phosphate
Received 29 Sep t embe r 1992. * A u t h o r to w h o m cor respondence should be sent .
band; however there is actually a very strong dependence on secondary structure, especially when the intensi- ties are considered. For example, the double helix poly(A)*poly(U) and the triple helix poly(U)*poly(A)*- poly(U) are hardly distinguished by the frequencies of their base vibrations but they are readily distinguishable by relative intensity patterns of several adenine modes2 ,6 Therefore UV Resonance Raman spectroscopy should be a valuable tool for identifying and quantifying the rel- ative content of different helical structures in solutions with unknown amounts and compositions of these struc- tures. Furthermore, the dependence of equilibria be- tween different structures on factors such as tempera- ture, pH, or ionic strength can easily be investigated with resonance-enhanced Raman spectroscopy.
Most of the spectroscopic nucleic acid literature deals with single and double helical structures and aims to identify A, B, or Z-backbone conformations. However, it has been known since the early sixties that many more helical structures can form in vitroY -11 Triple and quad- ruple helices in particular were found. However, their biological significance in vivo seemed to be low. In recent years, though, this estimation has changed considerably. For example, Franck-Kamenetskii and co-workers 12,13 found triple helical structures in plasmids. Predomi- nantly homopurine*homopyrimidine inserts can adopt triple helical structures. Both superhelical stress and/or mildly acid conditions favor their formation. Because purine-pyrimidine stretches frequently occur in regula- tory regions of the eucaryotic genome, 14 triple helices may indeed play a significant role for gene regulation in vivo.
Another very interesting future prospect of triple hel- ices is being intensively studied by the groups of Dervan 15,16 and of H~l~ne. 17,1s They synthesized oligonu- cleotides that were specifically targeted to sequences in double helical DNA. The oligonucleotides bind in a high- ly sequence-specific way to DNA via triple helix for- mation. Dervan and co-workers coupled the oligonucleo- tides covalently to an EDTA-Fe(II) complex, which causes a breakage of both strands of the DNA target sequence. The sequence specificity obtainable with oligonucleo- tides can be much higher than is the case with restriction enzymes, because their recognition sequence can be lon- ger and thus more specific. However, these oligonucle- otide-DNA triplexes are interesting not only as a tool for molecular biologists. ~9 Surely the most challenging pros- pect of these structures is their use as highly specific drugs, which are targeted directly to the DNA double helixY ° Actually the formation of triple helices strongly
depends on factors like pH, ionic strength, temperature, and concentration, tS,2t,22
To determine the conditions that actually allow the formation of triple helices--or other unusual struc- t u r e s - a s well as to quantify equilibria between several conformations, Resonance Raman (RR) offers very in- teresting capabilities. Among them is the possibility of varying concentrations over several orders of magnitude, as well as achieving a low degree of sensitivity against changes of solvent composition and a high information content when compared with other spectroscopic tech- niques for solution diagnostics like fluorescence or ab- sorption.
Because pH is one of the most important factors gov- erning triplex formation, the main purpose of our ex- periments is the determination of pH-dependent struc- tural transitions and equilibria between various helical conformations. Here we present results with helices com- posed of poly(U) and poly(A) strands as a model for homopurine-homopyrimidine sequences, which play a predominant role for the formation of triple helical struc- tures in nucleic acids.
MATERIAL AND M E T H O D S
The spectrometer we used was based on an excimer- pumped dye-laser system with subsequent frequency doubling (BBO crystals). Excitation wavelengths were continuously adjustable down to 205 nm with pulse en- ergies of 2 mJ. Pulse length and repetition rates were 20 ns and 100 Hz, respectively.
Spectra were recorded with a triple spectrograph (Spex triplemate) and multichannel detector (EG u.G). The scattering geometry was 180 ° backward. The UV beams were focused with two cylindrical lenses ([ = 100, 300 mm) in order to get a rectangular shape. This configu- ration allows an optimized illumination of the detector pixels (25*2500 #m) when the rectangular shape of the illumination spot at the sample equals that of the pixel times the magnification factor of the collection optics (elliptical mirror). The experimental setup is described in more detail in Refs. 6 and 23.
To avoid sample degradation and to reduce the sample volume required, we developed a new rotating cell. The principle of the cell is both very simple and quite ver- satile: a variable distance ring is covered by two micro- scope cover slides of fused silica. Thin cover slides are needed to minimize spectral contributions from the win- dow material. The volume of the cell is adjustable by the depth and inner diameter of the distance ring in use. This arrangement allows sample volumes down to 2 gL. The adhesion of water is sufficient to hold the two cover slides and the distance ring tightly together; therefore no further clamping or fixing mechanism is needed. Un- like most rotating cells for Raman spectroscopy pub- lished in the literature, the axis of rotation of our cell is oriented parallel to the optical axis of the system (di- rection of excitation and detection). A small ball of glass inserted in the cell improves the convection within the sample and improves protection against photodecom- position.
The polynucleotides as well as the double and triple helices poly(A)*poly(U) and poly(U)*poly(A)*poly(U)
were purchased from Boehringer Mannheim and Sigma and were used without further purification. The lyoph- ilized samples were first dissolved in HPLC water (0.63 mM in phosphate) with 100 m M NaCl. Afterwards, buff- er solution was added to yield final concentrations of 0.5 mM in nucleic acids (phosphates), 100 m M NaC1, 100 m M NaC104, and 10 mM buffer. Perchlorate was added as an internal standard to all samples. The buffers we used were HEPES (pH = 7.0), malonic acid (pH = 2.5, 3.0, 3.5, 5.5, 6.0, and 6.5), and acetic acid (pH = 4.0, 4.5, and 5.0) titrated with NaOH or HC1. The experiments were done at room temperature 21 ± 2°C.
In order that saturation effects could be avoided, the excitation beam was attenuated to less than 60 #J/pulse. Several scans of the multichannel detector were added with integration times between 30 and 60 s. The spectra were normalized with the 932-cm -~ band of perchlorate, and the background and buffer contributions were sub- tracted.
Because equilibria between different nucleic acid structures occasionally adjust very slowly, t° two series of experiments were done. In the first series, the RR spectra were taken approximately three hours after the nucleic acid sample was dissolved in the appropriate buffers. The second series was recorded approximately 52 h after the addition of buffers. No significant differences within the spectra of the two series were found.
RESULTS
As mentioned above, we were interested in the relative stabilities of helices composed of poly(U) and poly(A) strands, when the pH is lowered. To be more precise, we investigated the pH-dependence of the equilibria be- tween the single helical conformations of poly(A) and poly(U), the double helix poly(A)*poly(U), the triple he- lix poly(U)*poly(A)*poly(U), and the unusual double he- lix poly(A)+*poly(A) +. For this purpose we varied the pH value of solutions of poly(A), poly(A)*poly(U), and poly(U)*poly(A)*poly(U) in steps of 0.5 pH units.
The RR spectra with 260-nm excitation wavelength of single-stranded poly(A), the double-stranded poly- (A) ÷*poly(A) +, and the dependence of these structures on pH are described in greater detail in Ref. 23. Addi- tionally, here we present some recent spectra of exper- iments with the 220-nm excitation wavelength.
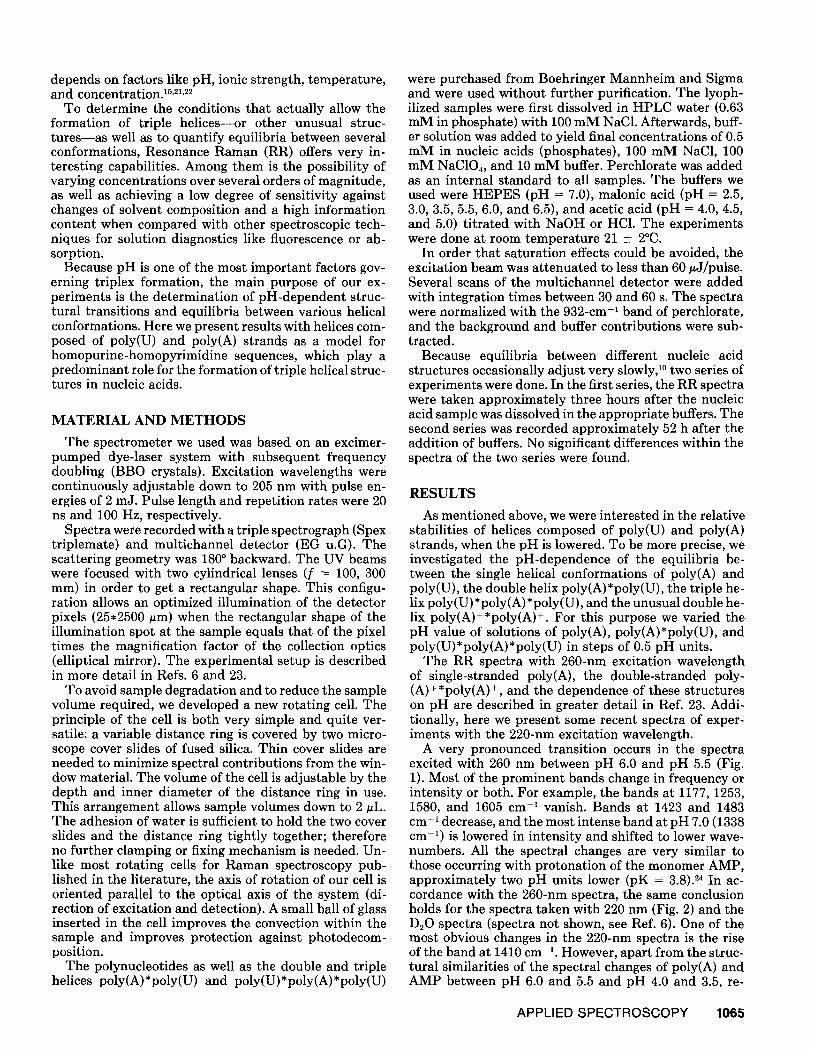
A very pronounced transition occurs in the spectra excited with 260 nm between pH 6.0 and pH 5.5 (Fig. 1). Most of the prominent bands change in frequency or intensity or both. For example, the bands at 1177, 1253, 1580, and 1605 cm -t vanish. Bands at 1423 and 1483 cm -1 decrease, and the most intense band at pH 7.0 (1338 cm -1) is lowered in intensity and shifted to lower wave- numbers. All the spectral changes are very similar to those occurring with protonation of the monomer AMP, approximately two pH units lower (pK = 3.8). 24 In ac- cordance with the 260-nm spectra, the same conclusion holds for the spectra taken with 220 nm (Fig. 2) and the D20 spectra (spectra not shown, see Ref. 6). One of the most obvious changes in the 220-nm spectra is the rise of the band at 1410 cm -t. However, apart from the struc- tural similarities of the spectral changes of poly(A) and AMP between pH 6.0 and 5.5 and pH 4.0 and 3.5, re-
APPLIED SPECTROSCOPY 1065
poly(A) kexc=260 am
H20
pH
5,5
5,0
4,5
4,0
3,5
3,0
2,5
1700 1500 1300 l I00 900 [cm "l]
FIG. 1. Resonance Raman spectra of poly(A) at pH-values from 7.0 to 2.5; excitation wavelength: 260 nm. Pronounced spectral changes attributable to the formation of the double helix poly(A) ÷ +poly(A) ÷ occur between pH 6.0 and pH 5.5.
spectively, protonation causes an additional hypochro- mism in the 260-nm poly(A) spectra, which is stronger than it is for the respective modes in AMP. For example the band at 1338 cm -1 decreases to 0.6 of its original intensity (at pH = 7.0) in AMP, but to 0.4 in poly(A). This hypochromism is also seen in the absorption spectra of poly(A). 6
It is not difficult to identify the changes occurring in the spectra of poly(A) between pH 6.0 and 5.5 with the formation of a protonated double helix poly(A)+*poly - (A) +. Early titration experiments done by various au- thors with poly(A) revealed a pK for the polymer be- tween 5.0 and 6.0, depending on salt concentrations and temperature, s,2~-27 Diffraction data of poly(A) fibers un- der acidic conditions were interpreted in terms of a pro- tona ted and para l le l -s t randed double helix poly(A) ÷*poly(A) +. Studies with NMR 2s and diffraction data from solutions 29 are in accordance with the structure proposed by Rich e t al. 9
The RR spectra with 260-nm excitat ion of poly(A)*poly(U) in the pH range between 2.5 and 7.0 are depicted in Fig. 3. Three regions or types of spectra can easily be distinguished. Down to pH 5.0, the spectra are identical with those at neutral pH (region I). A first set of changes occurs between pH 5.0 and 4.5 (I -~ II) and a second one occurs between pH 4.0 and 3.5 (II -~ III). At the first transition, only the adenine vibrations are affected. Most of its bands .decrease strongly (see, for
pH
7,0
5,5
poly(A)
~xc=220 nm l - / - n
Fro. 2. Resonance Raman spectra of poly(A) at pH values from 7.0 to 2.5; excitation wavelength: 220 nm.
example, the bands at 1177, 1338, 1480, and 1575 cm-1). The bands at 1338 and 1575 cm -1 seem to be partially replaced by additional shoulders at 1562 and 1323 cm-L In contrast to the changes in many adenine modes, nei- ther frequencies nor intensities of the uracil modes change down to pH 4.0. Strong changes of the uracil modes, however, are observable between pH 4.0 and pH 3.5. Nearly all prominent bands rise in intensity (785, 1232, 1396, 1618, and 1681 cm-0. The mode at 1618 cm -~ is additionally upshifted to 1627 cm -1. Thus we have to imagine that at least three different helical conforma- tions are present within the poly(A)/poly(U) sample. Spectra with D~O as a solvent also show three clearly distinguishable spectral regions and therefore confirm the two-step mechanism of structural changes (Fig. 4).
However, what is surprising and not easily understood at a first glance is the asynchronous manner of the spec- tral changes of adenine and uracil modes, respectively. For a clear visualization of the asychronicity see Fig. 5. With an excitation wavelength of 220 nm (Fig. 6), the distinction of three different regions is less evident. Strong spectral changes cannot be discerned above pH 3.5. Nonetheless, changes that correspond to the I -~ II tran- sition in Fig. 3 are not completely absent; an increase of the band around 1410 cm -~ and a decrease of the band at 1575 cm -1 can be deduced between pH 5.0 and pH 4.5.
In Fig. 7, the results of a titration experiment starting with the triple helix poly(U)*poly(A)*poly(U) are de- picted. Unlike in the titration experiments starting with the double helix poly(U)*poly(A), no significant changes
1066 Volume 47, Number 7, 1993
i
Xexc=260 nm
H20
pH
7,0
6,5
6,0 b=~
5,5 1
5,0
4,5 ?
4,0
3,5 T
3,0
2,5 ~
I I I I I I I I I I
1500 1300 1100 900 [cm "1]
FIG. 3. Resonance Raman spectra of solutions of poly(A)*poly(U) and their dependence on pH; excitation wavelength: 260 nm. Three differ- ent spectral regions (I, II, III) are discernible.
J
/ I
1700 I I I I I
1500 1300
~xc=260 nm
D20
pD
7,0
4,5
I I I I I I II00 900 700 [~'I]
FZG. 4. Resonance Raman spectra of poly(A)*poly(U) dissolved in D20; excitation wavelength: 260 nm.
FIG. 5. Intensity changes of adenine (5A) and uracil (5B) bands of poly(A)/poly(U) solutions due to pH changes. Excitation wavelength: 260 nm. The maximum intensity of each band is arbitrarily set to 1.
occur in the spectra until pH 4.0. Therefore we can con- clude that the triple helix is more stable at lower pH values than is the double helix.
DISCUSSION
Poly(A). The spectral series shown above demonstrate that structural transitions between different helical con- formations are well represented in the RR spectra. How- ever, it is obvious, for example, when we compare the spectra of poly(A) at different excitation wavelengths, that cooperativity, which plays an important role in most helical transitions, is not equally well represented at the two excitation wavelengths (260 and 220 nm) we used.
Along with the cooperative transition from the single to the double helix of poly(A), both the protonation state and the helical conformation change. Therefore we should address the question of the relative contributions exerted on the spectra from protonation and altered secondary structure, respectively.
As mentioned above, the spectral patterns of the poly- mer and the monomer protonation are very similar. Be- cause the protonation results in an altered bond structure within the adenine moiety it is not surprising that the dominant effect seen in the RR spectra is protonation. Different secondary structures can manifest themselves only indirectly via hydrogen bonds, stacking interactions, or sugar-base conformation. However, apart from the hypochromism observable with 260-nm excitation, some
APPLIED SPECTROSCOPY 1067
I
~.~xc=220 nm
H20
FIG. 6. Resonance R a m a n spec t ra of poly(A)*poly(U) and thei r de- pendence on pH; same condi t ions as in Fig. 4 except exci ta t ion wave- length: 220 nm.
changes in relative band intensities in the region between 1480 and 1520 cm -1 are observable as well. 23
Olson 3° concluded, from a theoretical estimation, that the relative orientation of the adenine bases within the single helix is very similar to the orientation in the double helix poly(A) +*poly(A) ÷. This view, however, is in con- trast to our observation of a further intensity decrease of most adenine bands with 260-nm excitation, in ad- dition to the strong hypochromism already present in the poly(A) single helix when compared to the monomer AMP. 6 In accordance with the RR results the model of Rich e t al . 9 describes the poly(A)+*poly(A) ÷ helix as an unusual compact structure without large grooves.
With titration experiments, Holocomb and Timasheff 26 demonstrated that duplex formation is even possible with a protonation rate of 0.2. Both elevated temperatures and higher ion strengths increase the degree of proton- ation necessary for the duplex formation. Lerner and Kearns 28 concluded from NMR data that, at the condi- tions of their experiments (40 mM poly(A), 50 mM NaAc, 22°C), double helix formation is complete at pH 5.7 with a protonation rate of 50%. Down to pH 4.0 protonation completes, whereas base stacking remains essentially un- changed. Qualitatively, the RR spectra confirm these re- sults. The most obvious spectral changes occur between pH 6.0 and 5.5. The strong hypochromism with 260-nm excitation is surely a consequence of the duplex forma- tion, because it has no quantitative counterpart in the AMP spectra. At first glance, however, the spectra sug- gest that protonation is nearly complete at pH 5.0. The spectra at pH 5.0 and 4.0 seem to be almost identical. Bands that vanished with AMP protonation 24 (for in-
poly(U) * poly(A) *poly(U) ~.e, xc=260 nm
H20
FIG. 7. R e s o n a n c e R a m a n s p e c t r a o f t h e t r i p l e h e l i x poly(U)*poly(A)*poly(U) and thei r dependence on pH; exci ta t ion wavelength: 260 nm.
stance those at 1177 cm -1 and at 1253 cm -1) are absent in the poly(A) spectra even at pH 5.0. Therefore the 260- nm spectra suggest a stronger coupling between duplex formation and protonation. The 220-nm spectra, how- ever, indicate a more gradual increase of the protonation rate with pH (see, for example, the bands at 1410 and 1696 c m - i ) . Because with the 220-nm excitation spectra no genuine hypochromism is found, the protonation is better represented in these spectra than with 260-nm excitation. When we reinspect the 260-nm spectra some hints of additional protonation between pH 5.0 and 4.0 can be found as well. For example, bands at 1562 and 1615 cm -1, both typical for the protonated nucleotide, additionally rise between these pH values. In view of this observation, the vanishing of the small but very pro- nounced bands at 1177 and 1253 cm -t even at pH 5.0 must be attributed not solely to protonation but to the double helix formation as well. In conclusion, we can say that the protonation is better represented in the spectra with 220-nm excitation, whereas the duplex formation is better represented in the 260-nm spectra.
Poly(A)*poly(U) and poly(U)*poly(A)*poly(U). The first transition (I -+ II) in the spectra of Fig. 3 is not easy to understand at first glance. Because only the adenine modes change at this transition, one has to imagine a Watson-Crick double helix of which only one strand [poly(A)] undergoes structural changes, whereas the sec- ond strand [poly(U)] seems to be unaffected. A more detailed examination of the adenine changes suggests that at least a part of the bases are protonated between pH 5.0 and pH 4.5. For example, the new bands at 1323 and 1562 cm -1, or the strong decrease of intensity at 1338 and 1480 cm -1, were found characteristic for ade- nine protonation (see above and Refs. 6 and 24). This
Fro. 8. R e s o n a n c e R a m a n s p e c t r a of the t r ip le hel ix p o l y ( U ) * p o l y ( A ) * p o l y ( U ) in c o m p a r i s o n wi th the doub le hel ix poly(A)*poly(U); excitation wavelength: 260 nm. The spectra are nor- malized to the 1232-cm -1 band of uracil.
protonation occurs approximately one pH unit below the cooperative single to double helix transition of poly(A) and one pH unit above the pK of AMP. Therefore we can conclude that, on one hand, the double helical struc- ture in poly(A)*poly(U) prevents its poly(A) strand from becoming pro tona ted at pH values where the poly(A)+*poly(A) + double helix formation should be possible. On the other hand, there is some support for the base protonation by the polymer structure around pH 4.5 as well.
However, the assumption that the poly(A) strand in poly(A)*poly(U) is protonated to a high degree is incom- pat ib le with the s imul taneous existence of the poly(A)*poly(U) double strand, because the preferred protonation site of adenine is at position N1 in the py- rimidine part of the molecule, 31 which is involved in a Watson-Crick bond too.
A structure with uracil modes merely identical to those in the double helix is the triple helix poly(U)*poly(A)*- poly(U), whose spectrum is compared with the spectrum of the double helix poly(A)*poly(U) in Fig. 8. This triple helical conformation indeed provides the key for a cor- rect interpretation of the spectra in region II of Fig. 3. The resonance Raman spectra excited with 260 nm of the triple helix exhibit a strong decrease in many adenine modes, whereas both the uracil frequencies and inten- sities are practically identical with respective modes in the double helix poly(A)*poly(U). The adenine band that decreases most is the ring mode at 1338 cm -1, which at an excitation wavelength of 260 nm is the most intense band in AMP, poly(A), and poly(U)*poly(A)*poly(U). Unlike poly(A)*poly(U), the triple helix poly(U)*poly- (A)*poly(U) remains stable within this pH region (Fig. 7).
Stoichometrically, the following disproportionation reaction is possible:
A reaction of this kind was postulated on the basis of absorption measurements by Morikawa e t a l ) 2 Indeed the computer-added spectra of the isolated compounds on the right-hand side of the above equilibrium agree
a) kexc=260 nm
H20
poly(A)*poly(U) (pH=4,5) [--]
(pH=7,O) [- - -]
L4
Difference %
I I I I I I I I I I I 1700 1500 1300 1100 900 [cm" 1 ]
b) kexc=260 nm
poly(A)*poly(U) D20 I (pZ~-.4,5) [--1 I poly(A) (pD=4,5) + ,
I~ I poly(U)*poly(A)*poly(U) [
V Difference
I I I I I I I I I I I 1700 1560 1300 1100 900 [cm" 1]
FIG. 9. Difference spec t ra to prove the composi t ion of a solut ion con- ta in ing poly(A) and poly(U) in an equimolar mix tu re a t p H 4.5 (region II in Fig. 4). T h e dashed spec t ra are the calculated s u m of the pos tu la ted componen t s of the r i gh t -hand side of Eq. 1. T h e spec t ra agree qui te well, for the remain ing differences see text; exci ta t ion wavelength: 260 rim. (a) Dissolved in H20; (b) dissolved in D20.
quite well with the RR spectra of the disproportionated poly(A)*poly(U) (Fig. 9), and thus confirm that the dou- ble helix disproportionates into the unusual helices on the right-hand side of Eq. 1. For an explanation of the remaining differences in Fig. 9 see below.
Therefore the very pronounced changes in the 260-nm RR spect ra are due to the format ion of both poly(U)*poly(A)*poly(U) and poly(A)+*poly(A) +, which cause spectral changes in the same "direction." Conse- quently, the most prominent decrease, that of the 1338- cm -1 band, is due to both the formation of the double helical poly(A) ÷*poly(A) ÷ and the t r ip le -s t randed poly(U)*poly(A)*poly(U).
The overall degree of protonation for adenine in this case will be 50% at most. However, with respect to the spectra using 260-nm excitation, this value seems to be exceeded. The 220-nm spectra on the other hand, indi- cate a much lower degree of protonated adenine at pH 4.5 and 4.0. The discrepancies between the 260-nm and the 220-nm spectra can be explained when we recall the results of the poly(A)+*poly(A) ÷ double helix and the RR spectra of the triple helix poly(U)*poly(A)*poly(U) (see also Ref. 5). For both of these helices we found
APPLIED SPECTROSCOPY 1069
kcxc=260 nm
H20
poly(A)*poly(U) .
poly(U) + poly(A)
<2222;J<. .5 A - B
I I I I I I I I I i I I 1700 1500 1300 1100 900 [cm "l]
FIG. 10. Comparison of the poly(A)/poly(U) solution at pH 2.5 and the calculated sum of the postulated components of the right-hand side of Eq. 2. The spectra (excitation: 260 nm) are practically identical and therefore the disproportionation of Eq. 2 is proved by the resonance Raman spectra.
considerable hypochromism with 260-nm excitation, but not with that at 220 nm. Therefore the "overall" spectral changes occurring with the d ispropor t iona t ion of poly(A)*poly(U) are much weaker in the spectra with the lower excitation wavelength. The transition between the double and the triple helix formation is hardly de- tected at this wavelength, and the protonation as well as the double helix formation is less obvious. Therefore the two-step mechanism, discernible from the 260-nm spec- tra, is hardly seen in the 220-nm spectra.
The interpretation of the second transition II -~ III between pH 4.0 and 3.5 is comparatively straightforward. The increase of poly(U) bands in connection with the upshift 1618 ~ 1627 cm -1 clearly indicates the release of poly(U) from its H-bonded form. Thus at pH values below 3.5, poly(U) has its single-stranded random con- formation. All the poly(A) strands are now protonated, forming the poly(A)+*poly(A) + double helix. The dis- proportionation
is again confirmed by difference spectra (Fig. 10). The remaining differences in Fig. 9 are now easily ex-
plained as well. In both the difference spectra of these figures the uracil contributions are somewhat too high, whereas the adenine contributions are too low. The rea- son for this result is the onset of the second dispropor- tionation even at pH values above 3.5.
The RR spectra of unusual nucleic acid structures, presented here and in Refs. 5, 6, and 23, give a good idea of the potential usefulness of UV-resonance Raman spec- troscopy for the determination of nucleic acid structures in situ. For the intended use of oligonucleotides as highly
specific labels for particular genome sequences, which are targeted directly into the double helical DNA in com- plex biological systems, a knowledge of the conditions for triple helix binding is essential. The high sensitivity of resonance-enhanced Raman spectroscopy should al- low the screening of great numbers of samples under different conditions. None of the spectra depicted in this paper were taken with integration times of more than five minutes. A more quantitative use of the inherent information content of the RR spectra should be possible with the application of multivariate calibration tech- niques like PCR (principal component regression) or PLS (partial least squares) 33 to the spectra.
1. W. L. Peticolas, W. L. Kubasek, G. A. Thomas, and M. Tsuboi, "Nucleic Acids," in Biological Applications of Raman Spectros- copy, T. G. Spiro, Ed. (John Wiley and Sons, New York, 1987), Vol. 1, Chap. 3, p. 81.
2. S. P. A. Fodor and T. G. Spiro, J. Am. Chem. Soc. 108, 3198 (1986). 3. J .R. Perno, C. A. Grygon, and T. G. Spiro, J. Phys. Chem. 93, 5672
(1989). 4. F. Sureau, L. Chinsky, C. Amirand, J. P. Ballini, M. Duquesne, A.
Laigle, P. Y. Turpin, and P. Vigny, Appl. Spectrosc. 44,1047 (1990). 5. A. GfrSrer, M. E. Schnetter, J. Wolfrum, and K. O. Greulich, Ber.
Bunsenges. Phys. Chem., paper submitted. 6. A. GfrSrer, Ph.D. Thesis, University of Heidelberg (1991). 7. G. Felsenfeld, D. R. Davies, and A. Rich, J. Am. Chem. Soc. 79,
2023 (1957). 8. R. F. Steiner and R. F. Beers, Jr., Biochim. Biophys. Acta 32, 166
(1959). 9. A. Rich, D. R. Davies, F. H. C. Crick, and J. D. Watson, Mol. Biol.
3, 71 (1961). 10. R. D. Blake, J. Massoulie, and J. R. Fresco, J. Mol. Biol. 30, 291
(1967). 11. G. Felsenfeld and H. T. Miles, Ann. Rev. Biochem. 7, 407 (1967). 12. V. I. Lyamichev, S. M. Mirkin, and M. D. Frank-Kamenetskii, J.
Biomol. Struct. Dyn. 3, 275 (1987). 13. S. M. Mirkin, V. I. Lyamichev, K. N. Drushlyak, V. N. Dobrynin,
S. A. Filipov, and M. D. Frank-Kamenetskii, Nature 330, 495 (1987). 14. R. D. Wells, D. A. Collier, J. C. Hanvey, M. Shimizu, and F. Wohl-
rah, FASEB J. 2, 2939 (1988). 15. H. E. Moser and P. B. Dervan, Science 238, 645 (1987). 16. T. J. Povsic and P. B. Dervan, J. Am. Chem. Soc. III, 3059 (1989). 17. D. Praseuth, L. Perrouault, T. Le Doan, M. Chassignol, N. Thuong,
and C. H6l~ne, Proc. Natl. Acad. Sci. USA 85, 1349 (1988). 18. G. DuvaLValentin, N. T. Thuong, and C. H6l~ne, Proc. Natl. Acad.
Sci. USA 89, 504 (1992). 19. T. Ito, C. L. Smith, and C. R. Cantor, Proc. Nat]. Aead. Sci. USA
8 9 , 495 (1992). 20. J. M. Chubb and M. E. Hogan, TIBTECH 1 0 , 132 (1992). 21. Y. Kohwi and T. Kohwi-Shigematsu, Proc. Natl. Acad. Sci. USA
85, 3781 (1988). 22. A. R. Morgan and R. D. Wells, J. Mol. Biol. 37, 63 (1968). 23. A. GfrSrer, M. Schnetter, J. Wolfrum, and K. O. Greulich, Ber.
Bunsenges. Phys. Chem. 93, 300 (1989). 24. A. GfrSrer, M. Schnetter, J. Wolfrum, and K. O. Greulich, Ber.
Bunsenges. Phys. Chem. 95, 824 (1991). 25. V. Gramlich, H. Klump, and E. D. Schmid, Biochem. and Biophys.
Res. Com. 63, 906 (1975). 26. D. N. Holocomb and S. N. Timasheff, Biopolymers 6, 513 (1968). 27. W. M. Scovell, Biopolymers 17, 969 (1978). 28. D. B. Lerner and D. R. Kearns, Biopolymers 20, 803 (1981). 29. J. R. Fresco, J. Mol. Biol. 1, 106 (1959). 30. W. K. Olson, Nucl. Acids Res. 2, 2055 (1975). 31. J. E. Del Bene, J. Phys. Chem. 87, 367 (1983). 32. K. Morikawa, M. Tsuboi, S. Takahashi, Y. Kyogoku, Y. Mitsui,
and G. J. Thomas, Jr., Biopolymers 12, 799 (1973). 33. H. Martens and T. Naes, Multivariate Calibration (John Wiley