Structure analysis of solid surfaces Discrepancies that had cast doubt on the value of low-energy electron diffraction as a tool for defining the positions of surface atoms have been resolved, and new techniques are enhancing its usefulness. Thor N. Rhodin and David S. Y. Tong An accident that occurred at Bell Labo- ratories in 1925 started Clinton Davis- son and Lester Germer on an historical series of experiments. While studying the backscattering of slow electrons from a polycrystalline nickel target, they observed that the angular distribu- tion of the electrons changed complete- ly when the surface was inadvertently oxidized at a high temperature. The consequent study of diffraction phe- nomena in electrons scattered from the (111) face of a nickel crystal confirmed the de Broglie hypothesis of the wave nature of electrons. 1 But Davisson and Germer also predicted that this type of experiment would provide a valuable approach to the important problem of defining the precise position of atoms in the surfaces of crystalline solids. This suggestion has been pursued diligently by scientists both in the US and abroad. Now, fifty years after Davisson and Germer demonstrated the coherent scattering of electrons by a crystalline solid, the goal of studying surface struc- ture with this technique is becoming a reality. In this article we will discuss some of the major advances of the past few years that are making this achieve- ment possible. The diffraction spectra obtained Thor N. Rhodin is professor of applied and en- gineering physics at Cornell University and David S. Y. Tong is assistant professor of physics at the University of Wisconsin at Mil- waukee and a member of the consultant staff of the Naval Research Laboratory. when a beam of incident low-energy electrons with well-defined energy and momentum is scattered by a solid con- tain important information on the posi- tions of the surface atoms. Because strong inelastic absorption keeps the penetration of an incident electron to within a few atomic layers it has long been anticipated that analysis of curves of diffracted-electron intensity as a function of beam energy could lead to a determination of the crystallography of surfaces. With adequate theoretical models to describe the electron-diffrac- tion process we can obtain structural in- formation such as the chemisorption bond-lengths and the binding locations of adsorbed atoms and molecules. This goal has recently been achieved on a number of relatively simple systems of overlayers adsorbed on substrates. Before discussing the present status of this work, let us summarize some of the specific landmarks that have re- sulted in critical advances of the field. Early formulations by Kyo Kambe, Eion McRae and John Beeby laid the frameworks of the theoretical methods now in use. In low-energy electron dif- fraction, "LEED," the incident elec- trons have energies of 10-500 eV, high enough to excite surface and bulk plas- mons in a target material, so it is impor- tant to include inelastic damping in the electron propagation in a solid, as was pointed out by a number of early work- ers. Charles Duke and Charles Tucker, and independently Robert Jones and John Strozier, showed how such a damping factor can be included by as- suming a finite mean free path for the electrons. Then came the recognition that significant agreement between theory and experiment can be achieved with phase shifts calculated from realis- tic ion-core potentials. The impor- tance of using multiple phase shifts to obtain agreement between theory and experiment was shown by John Pendry, by us and by Donald Jepsen, Paul Mar- cus and Franco Jona. Acquisition of complete reliable intensity data both on clean surfaces and simple overlayer sys- tems by experimental researchers played a central role in these advances. Among these, the data of Stig Anders- son, Bengt Kasemo, Alex Ignatiev and Jona, Werner Berndt and Peter Biitt- ner, Joseph Demuth and Rhodin, and Jean-Bernard Theeton among others made useful contributions to the early stages of overlayer-structure analysis. 2 In this article we shall present an overview of some recent achievements of surface-structure analysis by LEED. In particular: • We shall examine the reliability of current dynamical LEED calculations to extract accurate chemisorption bond- lengths of adsorbed atoms. It was pointed out recently 2 that certain struc- tural results determined by different groups showed some rather large dis- crepancies. The reasons for these dis- agreements were not known at the time, and they resulted in some serious ques- tions as to the usefulness of the meth- odology. As a result of significant new PHYSICS TODAY/OCTOBER 1975 23
Transcript
Structure analysis of solidsurfacesDiscrepancies that had cast doubt on the value of low-energy electrondiffraction as a tool for defining the positions of surface atoms have beenresolved, and new techniques are enhancing its usefulness.
Thor N. Rhodin and David S. Y. Tong
An accident that occurred at Bell Labo-ratories in 1925 started Clinton Davis-son and Lester Germer on an historicalseries of experiments. While studyingthe backscattering of slow electronsfrom a polycrystalline nickel target,they observed that the angular distribu-tion of the electrons changed complete-ly when the surface was inadvertentlyoxidized at a high temperature. Theconsequent study of diffraction phe-nomena in electrons scattered from the(111) face of a nickel crystal confirmedthe de Broglie hypothesis of the wavenature of electrons.1 But Davisson andGermer also predicted that this type ofexperiment would provide a valuableapproach to the important problem ofdefining the precise position of atoms inthe surfaces of crystalline solids. Thissuggestion has been pursued diligentlyby scientists both in the US and abroad.Now, fifty years after Davisson andGermer demonstrated the coherentscattering of electrons by a crystallinesolid, the goal of studying surface struc-ture with this technique is becoming areality. In this article we will discusssome of the major advances of the pastfew years that are making this achieve-ment possible.
The diffraction spectra obtained
Thor N. Rhodin is professor of applied and en-gineering physics at Cornell University andDavid S. Y. Tong is assistant professor ofphysics at the University of Wisconsin at Mil-waukee and a member of the consultant staffof the Naval Research Laboratory.
when a beam of incident low-energyelectrons with well-defined energy andmomentum is scattered by a solid con-tain important information on the posi-tions of the surface atoms. Becausestrong inelastic absorption keeps thepenetration of an incident electron towithin a few atomic layers it has longbeen anticipated that analysis of curvesof diffracted-electron intensity as afunction of beam energy could lead to adetermination of the crystallography ofsurfaces. With adequate theoreticalmodels to describe the electron-diffrac-tion process we can obtain structural in-formation such as the chemisorptionbond-lengths and the binding locationsof adsorbed atoms and molecules. Thisgoal has recently been achieved on anumber of relatively simple systems ofoverlayers adsorbed on substrates.
Before discussing the present statusof this work, let us summarize some ofthe specific landmarks that have re-sulted in critical advances of the field.Early formulations by Kyo Kambe,Eion McRae and John Beeby laid theframeworks of the theoretical methodsnow in use. In low-energy electron dif-fraction, "LEED," the incident elec-trons have energies of 10-500 eV, highenough to excite surface and bulk plas-mons in a target material, so it is impor-tant to include inelastic damping in theelectron propagation in a solid, as waspointed out by a number of early work-ers. Charles Duke and Charles Tucker,and independently Robert Jones andJohn Strozier, showed how such a
damping factor can be included by as-suming a finite mean free path for theelectrons. Then came the recognitionthat significant agreement betweentheory and experiment can be achievedwith phase shifts calculated from realis-tic ion-core potentials. The impor-tance of using multiple phase shifts toobtain agreement between theory andexperiment was shown by John Pendry,by us and by Donald Jepsen, Paul Mar-cus and Franco Jona. Acquisition ofcomplete reliable intensity data both onclean surfaces and simple overlayer sys-tems by experimental researchersplayed a central role in these advances.Among these, the data of Stig Anders-son, Bengt Kasemo, Alex Ignatiev andJona, Werner Berndt and Peter Biitt-ner, Joseph Demuth and Rhodin, andJean-Bernard Theeton among othersmade useful contributions to the earlystages of overlayer-structure analysis.2
In this article we shall present anoverview of some recent achievementsof surface-structure analysis by LEED.In particular:• We shall examine the reliability ofcurrent dynamical LEED calculationsto extract accurate chemisorption bond-lengths of adsorbed atoms. It waspointed out recently2 that certain struc-tural results determined by differentgroups showed some rather large dis-crepancies. The reasons for these dis-agreements were not known at the time,and they resulted in some serious ques-tions as to the usefulness of the meth-odology. As a result of significant new
PHYSICS TODAY/OCTOBER 1975 2 3
findings, the physical reasons for uncer-tainties in some of the original surfacestructures are now understood. Weshall explore the sources of these uncer-tainties and attempt to clarify the ear-lier differences.• Accurate dynamical LEED calcula-tions in the energy range 10-200 eV forstructure determination require sevento eight phase shifts. Exact calcula-tions based on inclusion of all orders ofmultiple scattering events require con-siderable computation cost. As waspointed out by Peder Estrup,3 suchexact methods usually require computa-tion facilities beyond the capacity avail-able in all but a few laboratories. How-ever, the alternative of fast perturba-tion approaches within the dynamicalapproach of LEED is now available.Extensive applications of these havedemonstrated that this dynamical ap-proach can be made economical. Weshall review the reasons why convergentperturbation schemes achieve accurateresults with less computation time.• We shall make some predictionsbased on our present understanding asto the future prospects of surface crys-tallography and point out what we be-lieve to be important and fruitful direc-tions for the near-future developmentof the LEED technique. We shall alsobriefly review the current status of de-velopment in the use of data-reduction
methods, which analyze LEED intensi-ty data by methods analogous to thoseused in x-ray diffraction.
The chalcogens on a nickel surface
The recent success of the dynamicalapproach of LEED in extracting surfacestructure information from the experi-mental data is a major step in the devel-opment of the theoretical model of elec-tron-solid scattering. Quantitativeknowledge of chemisorption bond-lengths and the preferred coordinationsymmetry of adsorption sites providesvaluable information on the chemicalnature of chemisorption. A great dealof attention, and unfortunately alsoconsiderable uncertainty, were generat-ed on the reliability of the theoreticalinterpretation of the centered chalcogenoverlayers, with the surface cell spaced2 X 2 relative to the substrate, onNi(001). (The chalcogens are oxygen,sulfur, selenium and tellurium.)
The confusion was due to threeroughly concurrent but independentcalculations4 that reported differentsets of binding distances for two of thechalcogens, O and S. Andersson, Pen-dry, Kasemo and Michael Van Hovestudied the c(2 X 2) oxygen chemisorp-tion on Ni(001) and found that the oxy-gen sits at a four-fold coordinated bind-ing site with a vertical interlayer spac-ing of 1.5 ± 0.1 A. Demuth, Jepsen and
1.0
0.5
0.0
1.0
0.5
0.010 40 70 100 130
ELECTRON ENERGY (eV)160 190
Calculations based on two different potentials are compared with experimental data (topcurve) on the (001) face of a clean nickel crystal at 300 K, with the (0 0) beam at 8 = 6°, $ =0°. Pendry's Hartree-Fock potential yielded a curve (in black) that is in poor agreement but thecurve (in color) from Wakoh's potential corresponds well with the data. Figure 1
Marcus studied the c(2 X 2) chemisorp-tion for the four chalcogens on Ni(001)and for oxygen, they determined thesame four-fold coordinated site but atthe different interlayer spacing of 0.9 ±0.1 A.
The situation for c(2 X 2) sulfur onNi(001) was also confusing. Duke,Nunzio Lipari, George Laramore andTheeton4 determined a four-fold coor-dinated site with an interlayer spacingof 1.7 ± 0.1 A, whereas Demuth and hisassociates4 obtained a spacing of 1.3 ±0.1 A. Thus while all the calculationsagreed on the coordination symmetry ofthe binding site (with an oxygen or sul-fur atom sitting above four nearest-neighbor nickel atoms), they disagreedon the interlayer spacings, and hencethe correct chemisorption bond-lengths.
Besides forming the c(2 X 2) over-layer structure, the chalcogens alsoform a p(2 X 2) overlayer structure onNi(001) at a lower coverage. (Thenotation p(2 X 2) refers to a primitivesurface cell with double the substratelattice spacing; a c(2 X 2) cell contains acentered atom as well.) Demuth andRhodin5 have measured sets of LEEDintensity data on both of these over-layer structures. Van Hove and Tong6
recently calculated the interlayer spac-ings and adsorption sites for the com-plete set of p(2 X 2) chalcogen over-layers. For sulfur and oxygen, their re-sults for the p(2 X 2) structure wereidentical with the c(2 X 2) results ob-tained by the Demuth group.4 In viewof the close resemblances in the databetween c(2 X 2) and p(2 X 2) over-layers of oxygen and sulfur on Ni(001),it is reasonable to expect that the chem-isorption bond-lengths would be veryclose to each other. Thus the results ofVan Hove and Tong tend to confirm thecalculated spacings of Demuth and hisco-workers.
Why then did the Andersson group4
obtain a substantially different inter-layer spacing for oxygen and the Dukegroup4 for sulfur on Ni(001)? Let usexamine the factors that led them tothese conclusions. In the calculation ofAndersson and his colleagues, thesource of uncertainty was mainly thespecific choice of the scattering poten-tial they used for the nickel substrate.In a successful structure determination,the phase shifts used for the scatteringpotential of the substrate must producecalculated LEED intensity curves thatagree with the experimental data forthe clean crystal. The scattering po-tential used in the Andersson group'scalculation was a nonlocal Hartree-Fock nickel potential specifically con-structed to treat electron scattering atvery high energies. It has, however,since been shown7 that in the energyrange (10-200 eV) used for the struc-ture analysis, the nonlocal Hartree-Fock potential produced intensity-en-
2 4 PHYSICS TODAY/OCTOBER 1975
Overlayer structures
This Table summarizes results of structure analyses by the two groups named below on cen-tered and primitive 2 X 2 overlayers of chalcogen atoms at a fourfold site. The substrate hereis the (001) surface of nickel. The drawings on the right show the position of the overlayeratom (in color) and define the vertical spacing dand the bond length.
Theoretical Experimental
c(2 x 2) structure8 p(2 X 2) structure15
d Bond length d Bond length Bond length(A) (A) (A) (A) (A)
a J . E. Demuth, D. W. Jepsen, P. M. Marcus, Ref. 4.b M . Van Hove, S. Y. Tong, Ref. 6.
ergy spectra in poor agreement with theexperiment on clean Ni(001). This factcan be readily seen in figure 1, where acomparison between experiment andcalculation with the Hartree-Fock po-tential is shown. A calculation in whichTong, Pendry and Larry Kesmodel useda self-consistent nickel potential con-structed by S. Wakoh8 is also shownthere for comparison.
Comparing the calculated curves withexperiment we note that for the Har-tree-Fock potential the agreement israther poor. Shifts of more than 5 eVin major peak positions and substantialdifferences in peak shapes and relativeintensities are evident from the figure.Such discrepancies between theory andexperiment for the substrate are liableto produce serious errors in the struc-tures obtained for overlayers. On theother hand, curves for clean Ni(001)calculated with Wakoh's potential cor-respond very well with the experiment,with every peak in the data reproducedin detail in the calculation. TheWakoh nickel potential was used in theoverlayer calculations by Van Hove andTong6 for the p(2 X 2) structure and byDemuth and his colleagues4 for the c(2X 2) structure. Thus the differentbond length originally obtained by An-dersson and his associates4 for oxygenon Ni(001) was due primarily to theirchoice of the substrate potential fornickel. Pendry told us that he had ob-tained the smaller value for the oxygendisplacement, 0.9 A, with a linear-su-perposition potential, which is similarto Wakoh's.9
Let us turn to the calculation of Dukeand his co-workers4 for sulfur on
Ni(001). Since they used a linear su-perposition potential for nickel, thesephase shifts are practically the same asthose obtained from Wakoh's potential.Hence the uncertainty in their calcula-tion was not in the dynamical inputsthey chose; rather, it was in the accura-cy of the computation. The theoreticalmodel they used was based on Beeby'smatrix-inversion method. This theorywas developed to describe, in an exactformalism, the self-consistent solutionof multiple scattering of an incidentelectron in a finite number of crystallayers. The method inverts a large ma-trix and requires a huge amount of com-puter core memory. The method isalso time-consuming and hence not wellsuited for structure analysis of over-layers. In fact, because of the largecore-storage demand and lengthy com-putation time, calculations for overlayerstructure with this method were re-stricted to four phase shifts. The layer-Korringa-Kohn-Rostoker method usedby the Demuth group4 is more efficientby comparison.
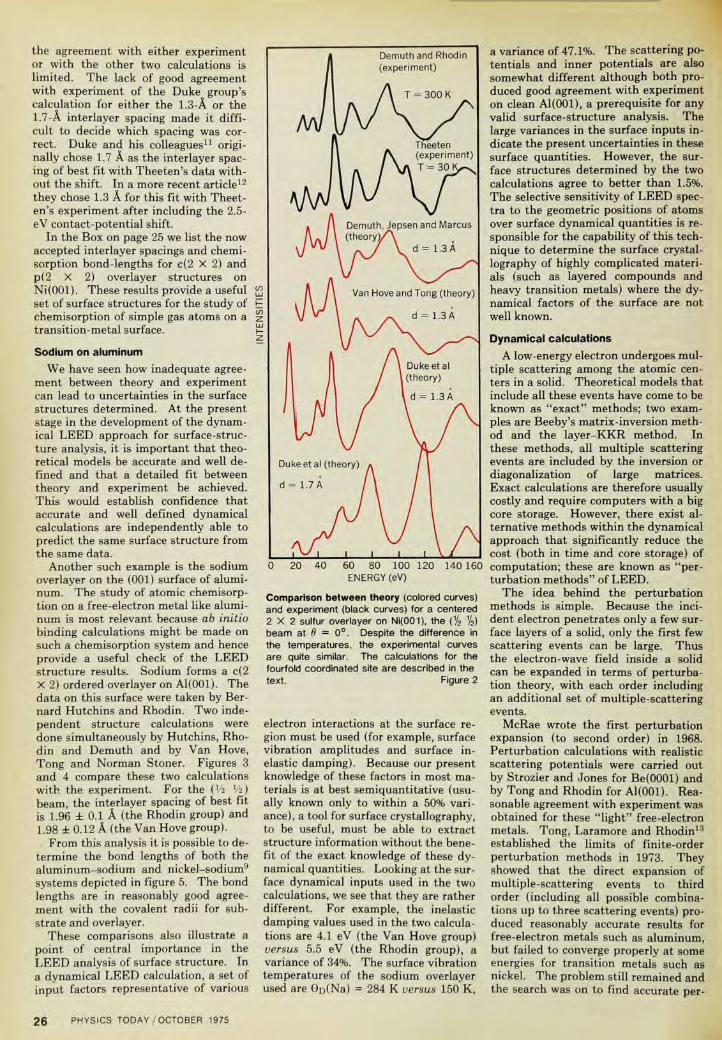
We show in figure 2 the comparisonbetween calculations done by differentgroups and the experimental data of c(2X 2) sulfur overlayer on Ni(001) for the(V2 Vijbeam. For the experiments, thedata of Theeten4 were taken at 30 Kand those of Demuth and Rhodin5 at300 K. Even with this temperature dif-ference the two sets of experimentscompare very well. Although there aresmall differences in peak shapes andrelative intensities of some peaks, thenumber of peaks and the positions ofmajor peaks agree very well in the twoexperiments. In Theeten's data, a 2.5-
eV shift to lower energies should beadded before it can be validly comparedto the calculated spectra. This is re-quired to account properly for a con-tact-potential difference in Theeten'sdefinition of the vacuum level of ener-gy.10 With this shift—and bearing inmind that the two experiments weredone at very different temperatures—all the small differences in the two ex-perimental curves can be accounted for.Even without the 2.5-eV contact-poten-tial correction for Theeten's data, thedifferences between the two experi-ments are small enough that they donot lead to different surface structureswhen analyzed by an accurate theoreti-cal calculation.
Figure 2 shows the calculated curvefor a c(2 X 2) sulfur layer on Ni(001) ata 1.3-A interlayer spacing and T = 300K by the Demuth group4 using thelayer-KKR method and the corre-sponding one by Van Hove and Tongusing a convergent perturbation meth-od. The two calculations used eightphase shifts and various dynamical in-puts such as surface-vibration ampli-tudes and inelastic damping. However,they agree very well with both Demuthand Rhodin's5 and Theeten's4 data.Small differences in the details of peakshapes and heights in the two calcula-tions are due to the different values ofsurface dynamical inputs used.
By way of comparison, the calcula-tions11 of Duke and his associates at T= 30 K are shown for interlayer spac-ings 1.3 A and 1.7 A (their choice of bestfit with Theeten's experiment). Wenote distortions in peak shapes andshifts in peak positions. In addition,
PHYSICS TODAY/OCTOBER 1975 2 5
the agreement with either experimentor with the other two calculations islimited. The lack of good agreementwith experiment of the Duke group'scalculation for either the 1.3-A or the1.7-A interlayer spacing made it diffi-cult to decide which spacing was cor-rect. Duke and his colleagues11 origi-nally chose 1.7 A as the interlayer spac-ing of best fit with Theeten's data with-out the shift. In a more recent article12
they chose 1.3 A for this fit with Theet-en's experiment after including the 2.5-eV contact-potential shift.
In the Box on page 25 we list the nowaccepted interlayer spacings and chemi-sorption bond-lengths for c(2 X 2) andp(2 X 2) overlayer structures onNi(OOl). These results provide a useful <2set of surface structures for the study of Echemisorption of simple gas atoms on a ztransition-metal surface. H
zSodium on aluminum
We have seen how inadequate agree-ment between theory and experimentcan lead to uncertainties in the surfacestructures determined. At the presentstage in the development of the dynam-ical LEED approach for surface-struc-ture analysis, it is important that theo-retical models be accurate and well de-fined and that a detailed fit betweentheory and experiment be achieved.This would establish confidence thataccurate and well defined dynamicalcalculations are independently able topredict the same surface structure fromthe same data.
Another such example is the sodiumoverlayer on the (001) surface of alumi-num. The study of atomic chemisorp-tion on a free-electron metal like alumi-num is most relevant because ab initiobinding calculations might be made onsuch a chemisorption system and henceprovide a useful check of the LEEDstructure results. Sodium forms a c(2X 2) ordered overlayer on Al(001). Thedata on this surface were taken by Ber-nard Hutchins and Rhodin. Two inde-pendent structure calculations weredone simultaneously by Hutchins, Rho-din and Demuth and by Van Hove,Tong and Norman Stoner. Figures 3and 4 compare these two calculationswith the experiment. For the (Va V2)beam, the interlayer spacing of best fitis 1.96 ± 0.1 A (the Rhodin group) and1.98 ± 0.12 A (the Van Hove group).
From this analysis it is possible to de-termine the bond lengths of both thealuminum-sodium and nickel-sodium9
systems depicted in figure 5. The bondlengths are in reasonably good agree-ment with the covalent radii for sub-strate and overlayer.
These comparisons also illustrate apoint of central importance in theLEED analysis of surface structure. Ina dynamical LEED calculation, a set ofinput factors representative of various
Demuth and Rhodin(experiment)
Demuth, Jepsen and Marcus(theory
' l d = 1.3A
Van Hove and Tong (theory)
d = 1.3A
0 20 40 60 80 100 120 140 160ENERGY (eV)
Comparison between theory (colored curves)and experiment (black curves) for a centered2 X 2 sulfur overlayer on Ni(001), the (1/2 V2)beam at 6 = 0°. Despite the difference inthe temperatures, the experimental curvesare quite similar. The calculations for thefourfold coordinated site are described in thetext. Figure 2
electron interactions at the surface re-gion must be used (for example, surfacevibration amplitudes and surface in-elastic damping). Because our presentknowledge of these factors in most ma-terials is at best semiquantitative (usu-ally known only to within a 50% vari-ance), a tool for surface crystallography,to be useful, must be able to extractstructure information without the bene-fit of the exact knowledge of these dy-namical quantities. Looking at the sur-face dynamical inputs used in the twocalculations, we see that they are ratherdifferent. For example, the inelasticdamping values used in the two calcula-tions are 4.1 eV (the Van Hove group)versus 5.5 eV (the Rhodin group), avariance of 34%. The surface vibrationtemperatures of the sodium overlayerused are 6D(Na) = 284 K versus 150 K,
a variance of 47.1%. The scattering po-tentials and inner potentials are alsosomewhat different although both pro-duced good agreement with experimenton clean Al(001), a prerequisite for anyvalid surface-structure analysis. Thelarge variances in the surface inputs in-dicate the present uncertainties in thesesurface quantities. However, the sur-face structures determined by the twocalculations agree to better than 1.5%.The selective sensitivity of LEED spec-tra to the geometric positions of atomsover surface dynamical quantities is re-sponsible for the capability of this tech-nique to determine the surface crystal-lography of highly complicated materi-als (such as layered compounds andheavy transition metals) where the dy-namical factors of the surface are notwell known.
Dynamical calculations
A low-energy electron undergoes mul-tiple scattering among the atomic cen-ters in a solid. Theoretical models thatinclude all these events have come to beknown as "exact" methods; two exam-ples are Beeby's matrix-inversion meth-od and the layer-KKR method. Inthese methods, all multiple scatteringevents are included by the inversion ordiagonalization of large matrices.Exact calculations are therefore usuallycostly and require computers with a bigcore storage. However, there exist al-ternative methods within the dynamicalapproach that significantly reduce thecost (both in time and core storage) ofcomputation; these are known as "per-turbation methods" of LEED.
The idea behind the perturbationmethods is simple. Because the inci-dent electron penetrates only a few sur-face layers of a solid, only the first fewscattering events can be large. Thusthe electron-wave field inside a solidcan be expanded in terms of perturba-tion theory, with each order includingan additional set of multiple-scatteringevents.
McRae wrote the first perturbationexpansion (to second order) in 1968.Perturbation calculations with realisticscattering potentials were carried outby Strozier and Jones for Be(0001) andby Tong and Rhodin for Al(001). Rea-sonable agreement with experiment wasobtained for these "light" free-electronmetals. Tong, Laramore and Rhodin13
established the limits of finite-orderperturbation methods in 1973. Theyshowed that the direct expansion ofmultiple-scattering events to thirdorder (including all possible combina-tions up to three scattering events) pro-duced reasonably accurate results forfree-electron metals such as aluminum,but failed to converge properly at someenergies for transition metals such asnickel. The problem still remained andthe search was on to find accurate per-
2 6 PHYSICS TODAY/OCTOBER 1975
turbation schemes that would work wellon transition metals as well as on free-electron metals.
It is clear that a suitable schemewould be one that can be carried suc-cessfully to all orders required toachieve convergence. This can be donemost easily if each order has exactly thesame form as the one before. Theneach order would take the same amountof computation time and have the samenumber of terms (as opposed to the ex-ponentially increasing number of termsin the direct-perturbation expansions)—this is, in fact, the basic logic of an iter-ation process.
The problem, then, is to find an itera-tion scheme such that each iterationstep takes a very small amount of com-putation time. If the time for each iter-ation is t, a calculation that requires niterations takes a total time nt; thecomputation time thus increases onlylinearly with n. If t is small, the totaltime will be small compared to that forexact calculations.
For most materials, including heavytransition metals, the perturbation iter-ation converges for n < 5, with an accu-racy practically as good as that of anexact calculation. A perturbationmethod works so much faster to reachsimilar numerical accuracy because itcalculates scattering terms in a well or-dered sequence. The computation isstopped as soon as the required accura-cy is reached. An exact calculation, onthe other hand, evaluates large andsmall scattering terms in a mixed man-ner, wasting relatively large amounts ofcomputational effort in the process.
One such scheme starts from the pla-nar-scattering factor of a single layerand iterates multiple scattering eventsby following the incident electron as itscatters in and out of the crystal layers.The number of layers included in the it-erations depends on the depth of pene-tration of the incident electron. Thislayer-by-layer interation is carried outuntil the reflectivity converges. Pen-dry14 first introduced this layer-itera-tion method with calculations onCu(OOl). Tong15 showed that, forNi(OOl), the layer-iteration methodsaved a factor of more than 36 in com-putation time and a factor of 10 in thecore-storage requirement over Beeby'smatrix-inversion method.
The layer-iteration method convergeswell for nickel, copper and many othermaterials but it is not applicable whentwo layers in a strongly scattering mate-rial are closely spaced to one another.In such cases a second iterative pertur-bation method can be used, which doesnot have this limitation. In the secondmethod, intraplanar and interplanarmultiple scattering events are solvedexactly for a pair of layers; the resultingtransmission and reflection matrices arethen used to solve for those of four
80ENERGY (eV)
120 160
A structure calculation is compared with experimental data (grey curve) for c(2 X 2) sodium onAI(100) at a fourfold site. The data are for the (1/2
1/2) beam at 0 = 0°; the temperature is 110K. The numbers shown on the left are the interlayer spacings in angstroms. The best fit wasfound to beat 1.96 ± 0.1 A. (From Hutchins, Rhodin and Demuth.) Figure 3
1.9
1.7100
ENERGY (eV)180
Another structure analysis on the same system as that of figure 3, performed independently byanother group at the same time. With the same site, beam and temperature the best fit be-tween theory (colored curves) and experiment (grey curve) was determined to be 1.98 ± 0.12A, in agreement with the above results. (From Van Hove, Tong and Stoner.) Figure 4
PHYSICS TODAY/OCTOBER 1975 27
SodiumSodium
• 2.49 A -»Nickel
2.85 A
Aluminum
Hard-sphere models showing the local geometry and dimensions for sodium atoms on a nickel(100) surface (a) and on an aluminum (100) surface (b) . The measurements and calculationsin a are from reference 9 and those in b are from Hutchins, Rhodin and Demuth. Figure 5
120 160 2001.1
ENERGY (eV)
The layer-iteration method was used in this structure determination of a primitive 2 X 2 sulfuroverlayer on a fourfold site of the (001) surface of a nickel crystal. The experimenta! curve(black line) is for a (% 0) beam at 8 = 0 ° . The interlayer spacing of best fit was determined tobe 1.3 ± 0.1 A. (From reference 6.) Figure 6
layers. This process is repeated untilthe reflected intensities converge. Thissecond method is about 30% slowerthan the layer-iteration method but ithas converged for every material thathas been tested.
Van Hove and Tong applied the iter-ative perturbation schemes extensivelyto structure analysis of clean surfacesand of overlayer systems including sur-face structures of W(001), W(110), oxy-gen on W(110), and carbon on Ni(001).Recently, Bernard Mrstik, Tong, RayKaplan and Achinta Ganguly used thelayer-iteration method to study the sur-face structure of two-dimensionallayered compounds. As an example ofthe successful use of perturbationmethod for structure analysis, we showin figure 6 the calculated curves6 for ap(2 X 2) sulfur overlayer on Ni(001)compared to the experiment5 of De-muth and Rhodin.
Data-reduction techniques
The dynamical approach of LEED isbased on an exact description of the in-cident electron as it undergoes a seriesof complicated interactions and multi-ple scattering events in the surface re-gion of a solid. It is therefore impor-tant to include accurately all majorscattering events of the electron. Twodata-reduction methods, carried out byMaurice Webb and Max Lagally16 atUniversity of Wisconsin (Madison) andby David Adams and Uzi Landman17 atXerox, attempt to select out from thecomplex intensity-energy data thosefeatures that originated primarily fromkinematic-scattering conditions of thesurface layers. Once such "Bragg-like"features are extracted, structures can bedetermined directly with methods simi-lar to those in x-ray crystallography.The data-reduction method proposedby Webb and Lagally, called the "Con-stant Momentum Transfer Averaging"scheme, "washes away" multiple-scat-tering peaks by averaging the measureddata taken at a mesh of incident angles.Lagally, Jeffrey Buchholz and Gwo-Ching Wang18 used this scheme tostudy clean tungsten and found that thetop layer of W(110) is not contracted orexpanded from the bulk spacing. A re-cent study by Van Hove, Tong andStoner,19 who use the dynamical ap-proach, agrees with this finding. Lagal-ly and his colleagues18 also applied thisdata-reduction scheme to a p(2 X 1)oxygen overlayer on W(110). Theyfound that it is difficult to determinethe positions of the oxygen atoms fromthe averaged data. The reason is thatmultiple-scattering contributions arehard to average out at low energies, sothat one must work at relatively highenergies—above 150 eV. At such highenergies there is a loss of surface sensi-tivity due to the deeper penetration ofthe incident electrons. As a result it is
28 PHYSICS TODAY/OCTOBER 1975
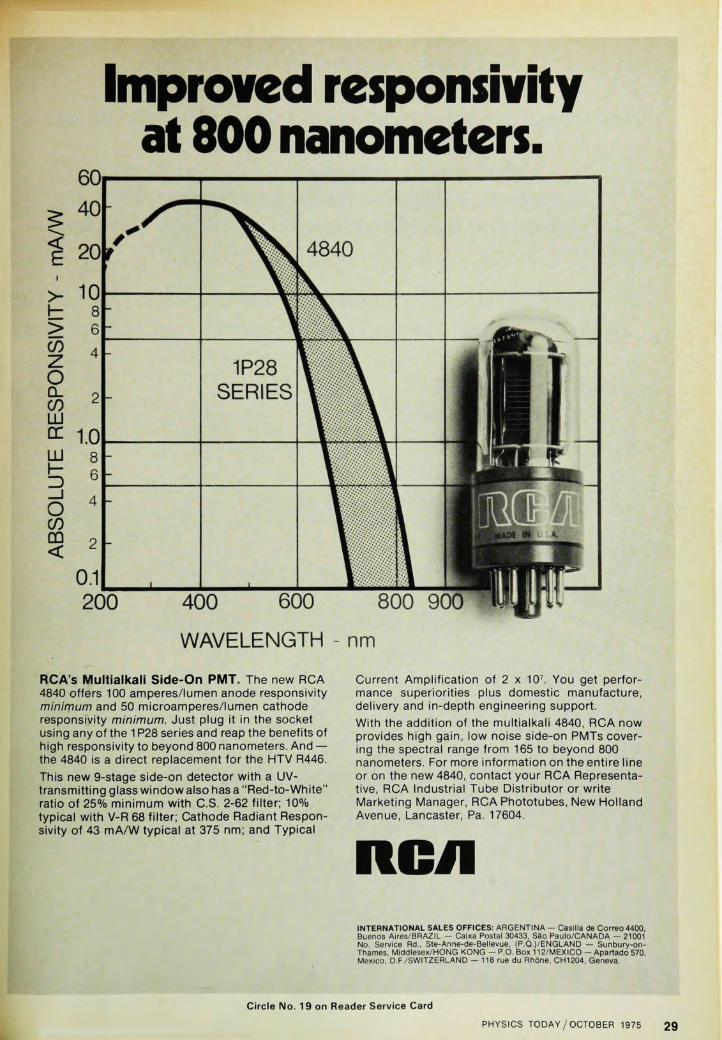
Improved responsivityat 800 nanometers.
0.1200 400
WAVELENGTH - nm
RCA's Multialkali Side-On PMT. The new RCA4840 offers 100 amperes/lumen anode responsivityminimum and 50 microamperes/lumen cathoderesponsivity minimum. Just plug it in the socketusing any of the 1P28 series and reap the benefits ofhigh responsivity to beyond 800 nanometers. And —the 4840 is a direct replacement for the HTV R446.This new 9-stage side-on detector with a UV-transmitting glass window also has a "Red-to-White"ratio of 25% minimum with C.S. 2-62 filter; 10%typical with V-R 68 filter; Cathode Radiant Respon-sivity of 43 mA/W typical at 375 nm; and Typical
Current Amplification of 2 x 10⁷. You get perfor-mance superiorities plus domestic manufacture,delivery and in-depth engineering support.With the addition of the multialkali 4840, RCA nowprovides high gain, low noise side-on PMTs cover-ing the spectral range from 165 to beyond 800nanometers. For more information on the entire lineor on the new 4840, contact your RCA Representa-tive, RCA Industrial Tube Distributor or writeMarketing Manager, RCA Phototubes, New HollandAvenue, Lancaster, Pa. 17604.
ItCilINTERNATIONAL SALES OFFICES: ARGENTINA — Casilla de Correo4400,Buenos Aires/BRAZIL — Calxa Postal 30433, SSo Paulo/CANADA — 21001No. Service Rd., Ste-Anne-de-Bellevue, (P.Q.)/ENGLANO — Sunbury-on-Thames, Middlesex/HONG KONG — P.O. Box 112/MEXICO — Apartado570,Mexico D.F./SWITZERLAND — 118 rue du Rh6ne. CH1204, Geneva.
Find the roots of: F(x) = 0.Find numerical solutions to ordinary differential equations.
Invert and multiply matrices.Solve simultaneous algebraic equations.
Integrate a function between arbitrary limits.Determine best-fit values for statistical samples.
I
o K i t i i i l
Texas Instruments SR-52.224 program locations.
Twice the user-defined keys.Twice the memory registers.
But half the costof the only other programmable in its class *
Complex repetitive problems orlengthy calculations that oncetook hours can now be solved inseconds. And the chances of entryerror are dramatically reduced.
The SR-52 allows you to recordup to 224 keystrokes to performyour calculations —your way. Pro-gramming is simple and straight-forward. What's more, prepro-grammed cards are availablewhich can be integrated into yourproblem solving routines.
Easy Left-to-Right AlgebraicEntry. Enter calculations exactlyas you write them. The SR-52 com-bines a 3-level algebraic hierarchywith 9 levels of parentheses. Thislets you enter problems containingup to 10 pending operations (threetimes the capability of the onlyother machine in its class). Thismeans you don't have topresolve the problem or /^search for the most ap-propriate, efficient orderof execution. The SR-52does this automatically.
Learn Mode. Teachthe SR-52 your personalapproach to problemsolving. Simply key-inyour problem left-to-right as you would incalculate mode, usingthe following options forprecise control:• Preprogrammed "if"
S t a t e m e n t s (8).Makes a decisionbased on the condi-tion of the display.
• Decrement and Skipon Zero. Lets a seg-ment of code be re-peated a specifiednumber of times.
• User-defined Flags(5). Determines thecondition under which
a program transfer is made.• Program Levels (3). A main pro-
gram can call up to two levels ofsubroutines.
• Labels (72). Name programsegments.
• Indirect Addressing (2 modes).Extends versatility of all mem-ory-reference and branchinginstructions.
Trial-run your program. Editingand "debugging" are easy. Movethrough problems a step at a time,forward or backward. Add moresteps. Delete. Or write over steps.Then record.
Run Mode. Load a magnetic card.This puts the card's contents inmemory. Insert the card above the5 user-defined keys representing10 functions.
Enter numbers directly into the
Complete software...and soon, an optionalprinter.Accompanying an SR-52:Operating guide. Compre-hensive owners manual.Basic library of prere-corded programs, diagnos-tic cards and head cleanerin carrying case. Basiclibrary manual. User in-struction & coding forms.Blank magnetic cards.Fast-charge battery pack.AC adapter/charger. Stur-dy vinyl carrying case.
SR-52 lock-in printer.(available early 1976)• Print out an entire
program.• Print calculate mode
results.• Print instructions or re-
sults without haltingprogram execution.
• Trace program execu-tion step by step forerror detection.
program. Or into one or more of the20 addressable memory registers.Or both.
Execution is completely auto-matic. A program runs until itencounters a halt, which may bepart of a program or a keyed-ininterruption.
Repeat a program as often asneeded. Change values of yourvariables. Solve for different un-knowns. The stored program isunaffected.
With the SR-52 comes a BasicLibrary Program Manual andpreprogrammed care's: Factors ofan integer. Complex ari. netic.Reconcile checking account. Ordi-nary annuity. Permutations andcombinations. Means and mo-ments. Random number genera-tor. Hi-pass active filter. Low-
EMI Gencom PMT Housings areunsurpassed for flexibility, ease ofuse, litetite construction, and RFIshielding. They are designed by en-gineers with years of PhotomultiplierApplication experience.
The "B" type shown above uses theunique Bayonet Lock, is available inSTD and RFI versions, with and with-out flange and provides space for AC-DC Power Supply if required. It ac-commodates all EMI 2" tubes andsome competitive types.
The QL-30 is similar in design andfits all EMI 1-1/8'' tubes. When sup-plied less flange, the slim line designallows compact packaging for OEMuse. RFI shielded version available.
T he new "S" Housing for side look-ing (squirrel cage) PMTs fits all tubesof this type, EMI or others. STD orRFIshielded versions available.
All of these new designs give im-proved performance at lower cost.Available from Stock.
Detaileddatafrom:
EMI GENCOM INC.80 Express St
Plainview, New York 11803Tel (516) 433-5900TWX 510-221-1889
Circle No. 20 on Reader Service Card
32 PHYSICS TODAY/OCTOBER 1975
harder to distinguish the scattering ef-fects of oxygen and determine its posi-tion.
A second data-reduction scheme isthe "Fourier Transform-Deconvolu-tion" method used recently by Land-man and Adams.17 This has the meritof being a direct scheme of determiningsurface structures from the reduction ofexperimental data. They Fourier inte-grated the intensity-energy data in agiven energy range and deconvolutedthe result. Applying this method to thesurface structure of clean Al(001), theyfound that there is no contraction or ex-pansion of the top layer, a result consis-tent with earlier findings by dynamicalcalculations. They also tested theirmethod on kinematical model calcula-tions of the sodium-on-Al(OOl) system.The resolution of this method and itsability to extract surface bond lengthsand binding locations from real over-layer-substrate systems, and from cleansurfaces where there is layer contrac-tion or expansion, still need to be estab-lished.
Fruitful directions
We have seen that when accurate andwell-defined dynamical calculations ofLEED are carried out, they can extractuseful structure information for simpleoverlayer systems on a number of sub-strate materials. The use of conver-gent-perturbation methods made possi-ble the economical application of thisapproach to a great many systems.Quantitative results of chemisorptionbond lengths and bonding sites providenew chemical information not availableotherwise. It would be worthwhile toverify the LEED structure results byother surface techniques or by directbinding-energy calculations.
Although present structure resultsare still confined to simple overlayersystems, the quantitative knowledgegained with this technique is importantbecause it can lead to an understandingof the basic physics and chemistry ofsurface interactions on many substratematerials. Because of the unique sensi-tivity of dynamical calculations to thepositions of surface atoms, their contin-ued development should be pursued. Itis likely that new formulations and ad-aptations will be made to enable thisapproach to study complex overlayerstructures. These include large organicmolecules (for example, the recent dataof Gabor Somorjai and his co-workers)and the structures of semiconductorsurfaces such as the Si(lll) surfacewith the (7 X 7) structure. As a firststep towards such development, struc-ture studies are already underway onthe (2 X 1) reconstructed surface ofSi(100).
The continued investigation of data-reduction schemes should also producefruitful results. Their underlying logic
is simple and the computation straight-forward, enabling experimentalists toanalyze their own data. Because data-reduction methods rely more heavily onthe accuracy of measured intensities,their use is more sensitive (compared tothe dynamic approach) to the quality ofthe experimental data and to the exactknowledge of surface inputs such as sur-face-vibration amplitudes and surfaceinelastic damping. However, studiesalong these lines could lead to better ex-perimental techniques and a better un-derstanding of such dynamical quan-tities as inelastic loss mechanisms andlayer vibration amplitudes in the sur-face region.
The authors are very grateful for useful dis-cussions with many colleagues familiar withwork in the field.
References1. C. Davisson, L. Germer, Nature 119, 558
(1927).2. PHYSICS TODAY, March 1974, page 17.3. P. Estrup, PHYSICS TODAY, April 1975,
page 33.4. S. Andersson, J. B. Pendry, B. Kasemo,
M. Van Hove, Phys. Rev. Lett. 31, 595(1973); J. E. Demuth, D. W. Jepsen, P.M. Marcus, Phys. Rev. Lett. 31, 540(1973); C. B. Duke, N. O. Lipari, G. E.Laramore, J. B. Theeten, Solid StateComm. 13,579 (1973).
5. J. E. Demuth, T. N. Rhodin, Surf. Sci.42, 261 (1974); 45, 249 (1974).
6. M. Van Hove, S. Y. Tong, J. Vac. Sci.Technol. 12, 230 (1975).
7. S. Y. Tong, in Progress in SurfaceScience (S. G. Davison, ed.) Pergamon,New York, volume 7, part 2 (1975).
8. S. Wakoh, J. Phys. Soc. Japan 20, 1894(1965).
9. S. Andersson, J. B. Pendry, Solid StateComm. 16, 563 (1975); J. E. Demuth, D.W. Jepsen, P. M. Marcus, J. Phys. C 8, 8(1975).
10. J. E. Demuth, D. W. Jepsen, P. M. Mar-cus, Surf. Sci. 45, 733 (1974).
11. C. B. Duke, N. O. Lipari, G. E. Lara-more, J. Vac. Sci. Technol. 11, 180(1974).
12. C. B. Duke, N. O. Lipari, G. E. Lara-more, J. Vac. Sci. Technol. 12, 222(1975).
13. S. Y. Tong, G. E. Laramore, T. N. Rho-din, Phys. Rev. B 8, 5361 (1973).
14. J. B. Pendry, Phys. Rev. Lett. 27, 856(1971).
15. S. Y. Tong, Solid State Comm. 16, 91(1975).
16. M. B. Webb, M. G. Lagally, Solid StatePhys. 28, 301 (1973).
17. U. Landman, D. Adams, Phys. Rev. Lett.33,585(1974).
18. M. G. Lagally, J. C. Buchholz, G. C.Wang, J. Vac. Sci. Technol. 12, 213(1975).
19. M. Van Hove, S. Y. Tong, N. Stoner,Bull. Am. Phys. Soc. 20, 388 (1975). •