STRUCTURE AND ADSORPTION AT THE WATER / CARBON TETRACHLORIDE INTERFACE by Tammy Baisley B.Sc., Mount Allison University, Sackville, New Brunswick, 1995 THESIS SUBMITTED IN PARTIAL FULFILLMENT OF THE REQUIREMENT FOR THE DEGREE OF MASTER OF SCIENCE in the Department Chemistry O Tammy Baisley 1997 SIMON FRASER UNIVERSITY August 1997 All rights reserved. This work may not be reproduced in whole or in part, by photocopy or other means, without the permission of the author.
Transcript
STRUCTURE AND ADSORPTION AT THE WATER /
CARBON TETRACHLORIDE INTERFACE
by
Tammy Baisley
B.Sc., Mount Allison University, Sackville, New Brunswick, 1995
THESIS SUBMITTED IN PARTIAL FULFILLMENT OF
THE REQUIREMENT FOR THE DEGREE OF
MASTER OF SCIENCE
in the Department
Chemistry
O Tammy Baisley 1997
SIMON FRASER UNIVERSITY
August 1997
All rights reserved. This work may not be reproduced in whole or in part, by photocopy
or other means, without the permission of the author.
National Library I * I , of Canada du Canada f
Acq;th~pions and Acquisitions efe Bibliogfaphic Services services Qiblio raphiq
.b I --- ' 395 Wellington Street 395. me wellingt A
W w a O N K l A O N 4 OttawaON K I A P Canada Canada
Your h e Yolre reference
Our hle Norre reference
The author has granted a non- L'auteur a accorde une licence non exclusive licence allowing the exclusive pennettant a la National Library of Canada to , Bibliotheque nationale du Canada de reproduce, loan, hstribute or sell reproduire, preter, distribuer ou copies of tlus thesis in microform, vendre des copies de cette these sous paper or electronic formats la forme de microfiche/film, de
reproduction sur papier ou sur format electronique.
The author retains ownershp of the L'auteur conserve la propriete du copyright in tlus thesis. Neither the droit d'auteur qui protege cette these. thesis nor substantial extracts fiom it Ni la these ni des extraits substantiels may be printed or otherwise de celle-ci ne doivent itre imprimes reproduced without the author's ou autrement reproduits sans son permission autoriiation.
APPROVAL
Name: Tahmy Baisley
Degm: Master of Science
Title of ttmis: Structure and Adsorption at the Water 1 Carbon Tetrachloride Interface
Examining Commhteb:
Chairperson: Dr. Ian Gay, Professor
Dr. Gary Lea@, Assistant Professor Senior Supervjgor
* ~- Dr. ~eorgd~ne&sistant Professor
-- Dr. Paul Percival, Professor
4
Dr. Ross Hill. Associate ~Zfessor Internal Examiner
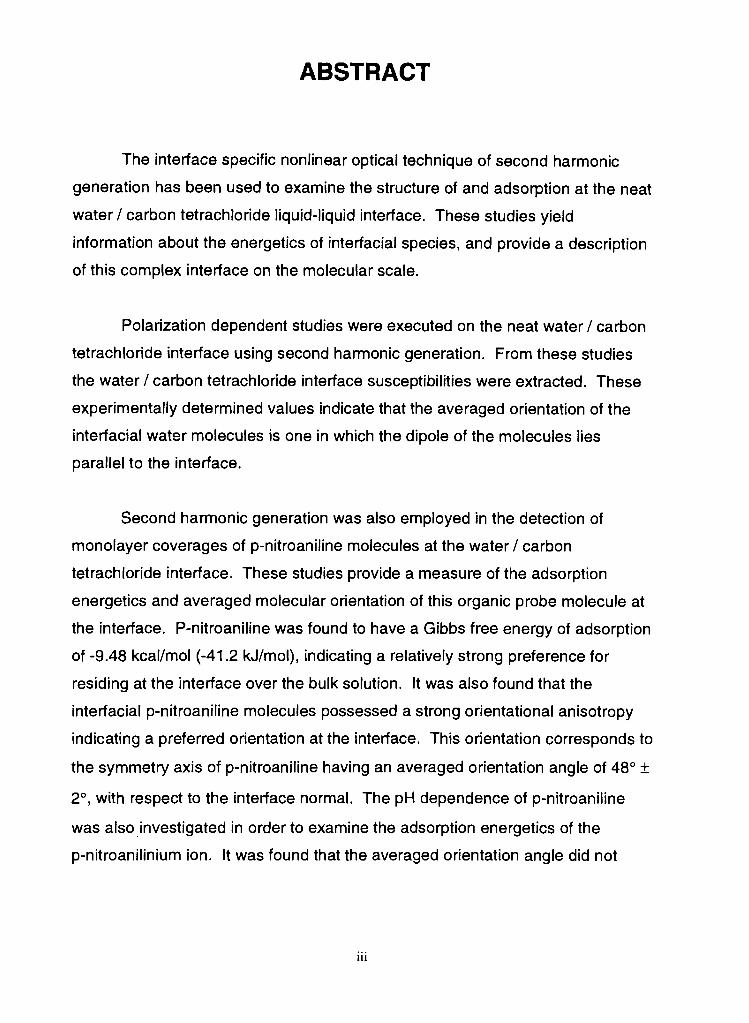
The interface specific nonlinear optical technique of second harmonic
generation has been used to examine the structure of and adsorption at the neat
water I carbon tetrachloride liquid-liquid interface. These studies yield
information about the energetics of interfacial species, and provide a description
of this complex interface on the molecular scale.
Polarization dependent studies were executed on the neat water I carbon
tetrachloride interface using second harmonic generation. From these studies
the water I carbon tetrachloride interface susceptibilities were extracted. These
experimentally determined values indicate that the averaged orientation of the
interfacial water molecules is one in which the dipole of the molecules lies
parallel to the interface.
Second harmonic generation was also employed in the detection of
monolayer coverages of p-nitroaniline molecules at the water / carbon
tetrachloride interface. These studies provide a measure of the adsorption
energetics and averaged molecular orientation of this organic probe molecule at
the interface. P-nitroaniline was found to have a Gibbs free energy of adsorption
of -9.48 kcallmol (-41.2 kJImol), indicating a relatively strong preference for
residing at the interface over the bulk solution. It was also found that the
interfacial p-nitroaniline molecules possessed a strong orientational anisotropy
indicating a preferred orientation at the interface. This orientation corresponds to
the symmetry axis of p-nitroaniline having an averaged orientation angle of 48" f
2 O , with respect to the interface normal. The pH dependence of p-nitroaniline
was also investigated in order to examine the adsorption energetics of the
p-nitroanilinium ion. It was found that the averaged orientation angle did not
change upon protonation but the Gibbs free energy of adsorption increased to
-7.75 kcaVmol (-32.4 kJ1mol).
As well a characterization of the water I carbon tetrachloride interface
upon adsorption of a series of small ions was undertaken. The Gibbs free
energy of adsorption of the ions was determined to depend on the size of the ion
and scale with their size. The ions that were investigated were hydrogen, lithium,
and sodium. The Gibbs free energies of adsorption for these ions were all small
positive numbers, indicating a preference for being in solution. The second
harmonic response in the case of small ion adsorption is the result of an electric
field induced second harmonic process and was also effected by the
reorientation of water molecules to solvate these ions.
To my parents, Fred and Yvette Baisley
I wish to thank my senior supervisor, Dr. Gary Leach, for his ongoing guidance, attention and patience throughout my studies.
I would like to thank the members of my group, Zhihong Zhao, Tatyana Kiktyeva and Dimitry Star, for their help and friendship.
1 wish to express my gratitude to the members of my supervisory committee, Drs. George Agnes and Paul Percival, for their time and attention.
I would also like to thank Dr. Ross Hill and his group for their input and helpful discussions during group meetings.
I would also like to express my gratitude to Dr. Paul Beattie for his informative discussions.
Special thanks goes to Michael Belyea for his patience, support and encouragement throughout my studies.
The generous financial support from the Department of Chemistry at Simon Fraser University and Dr. Gary Leach's research funds is gratefully acknowledged.
TABLE OF CONTENTS
........................................................................................................... APPROVAL ii
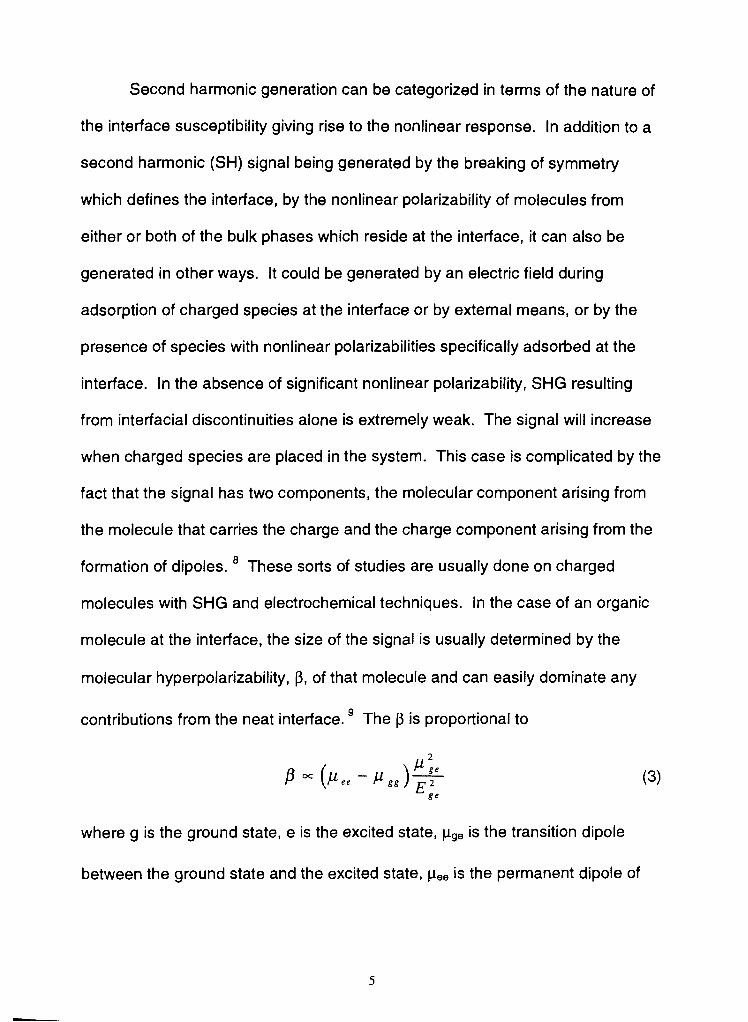
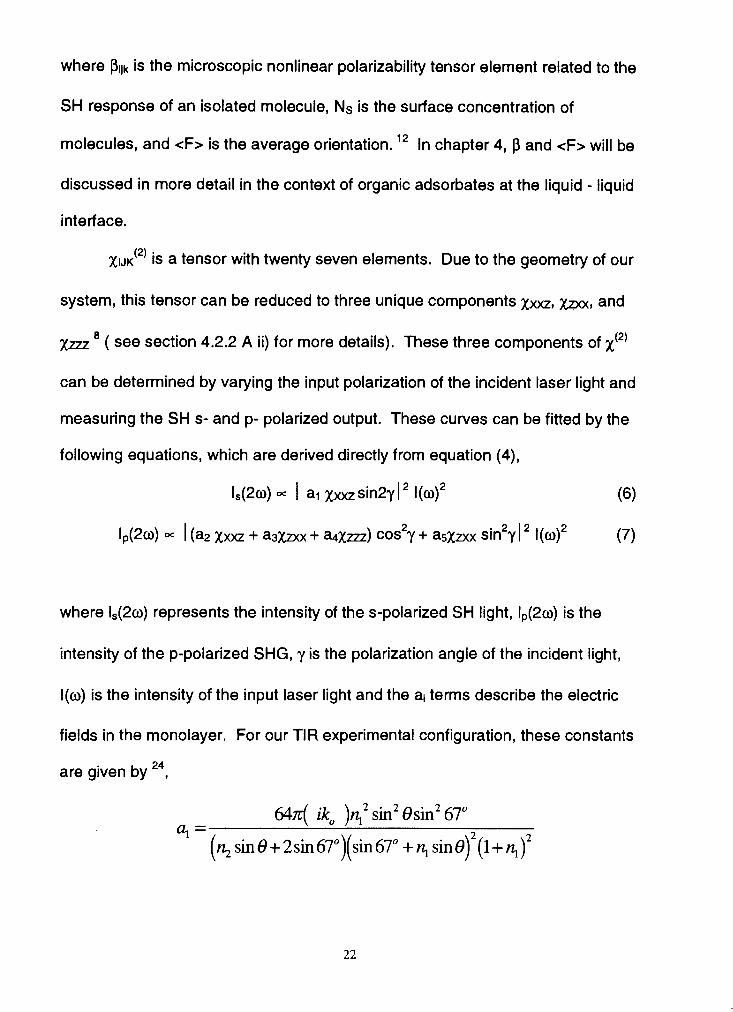
where k, is the wave vector of the fundamental wave, nl is the refractive index of
the water, n* is the relative refraction index of the carbon tetrachloride at the
second harmonic wavelength and 8 is as shown in figure 3.1.
By fitting the experimental curves with equations (6) and (7) the
components of X(2) can be determined.
air
input beam
fundamental output beam
laser Y
SH output beam
Figure 3.1 : Schematic representation of the interface
3.4) Results and Discussion
The signal that is obtained from the neat water / CC14 interface arises from
the broken symmetry at the interface and from the nonlinear polarizability of the
water molecule present there. Shown in figure 3.2 is the polarization
dependence curve for the water molecules at the water / CC14 interface. The
polarization of the incident light is varied and plotted against the second
harmonic signal intensity. The solid circles represent the p-polarized light while
the empty circles represent the s-polarized light. The lines represent the
theoretical fits based on the calculations of the previous section. The error in
these points is less than ten percent in the y direction and two degrees or less in
the x direction. These uncertainties were determined by reproducing the signal
at particular polarization angles several times and determining the standard
deviation.
It should be noted that even though the data is of reasonable quality, the
signal generated from the water molecules at the neat water 1 CC14 interface is
very small compared with signals generated from other interfaces that have a
similar interfacial concentrations, such as p-nitroaniline at the water / CC4
interface (see section 4.2).
We also have determined through our experiments that the polarization
curve characteristic of an interface free of contaminants is like the one shown in
figure 3.2. When organic species or other contaminants are at the interface, the
phase of the polarization curve is shifted and the appearance of the curve is
considerably different (for an example see figure 4.4). Thus we can use the
phase of the curve as a sign for a clean interface.
Polarization C u m for the Neat
0 s-polarized - Fit. P-pol
Input Polarization Angle
Figure 3.2) Orientation curves of s-and p- polarized SH signal for the neat water /CC14 interface, where filled in circles represent p-polarized and hollow circles represent s-polarized. Lines represent theoretical fits.
The s-polarized signal is fitted first because it only has one x parameter in
the formula for the fitting (see equation 6). This x parameter, xxxzl is extracted
from fitting the experimental data with this equation. Then we fix this parameter
and vary xz and m, using equation (7) to fit the p-polarized curve. It should
also be noted that the s-polarized curve has twice the periodicity of the p-
polarized curve (see equations 6 and 7). Looking at figure 3.2, one can verify
that this is the case for our experimental data, indicating that it is in fact a second
harmonic generated signal.
From the theoretical fitting procedure, we extract the x values. For the
water molecules at the interface, was found to be negligible, while the ratio
of the other components was found to be xxxz : of 1 It 0.08 : -1 -50 f 0.09.
The error on these susceptibilities was determined as explained in section
4.2.28.
Using the following relationship
xz + xxxz + xzxx = Ns (a + P) < cose > (9)
where Ns is the number of surface molecules, 0 is the angle between the dipole
and the surface normal, and a and p are hyperpolarizability components, we
can deduce the value of 0. l9 Our results yield a very small number on the left
hand side of the equation. Since (a+P) is a nonzero number 25, our results
would yield a very small number equal to the cosine 0.
At the water / CC14 interface there are a large number of water molecules,
even so the SH signal is small. There are two possible reasons for this small
signal. One possible reason for the small SH signals observed in these
experiments is that there may be a broad distribution of orientations of water
molecules at the interface. This would argue in favor of a small energy barrier to
molecular reorientation. Since two water molecules having opposite orientations
would cancel their contribution to X , a broad distribution of the orientation would
tend to have a signal canceling effect with the result that the SH signal would be
reduced. A second possible explanation for the small SH signals is that the
water molecules have a narrow distribution of orientations. In this case from
equation (9), < cos 8 > = cos <8> which is a very small number, thus theta is
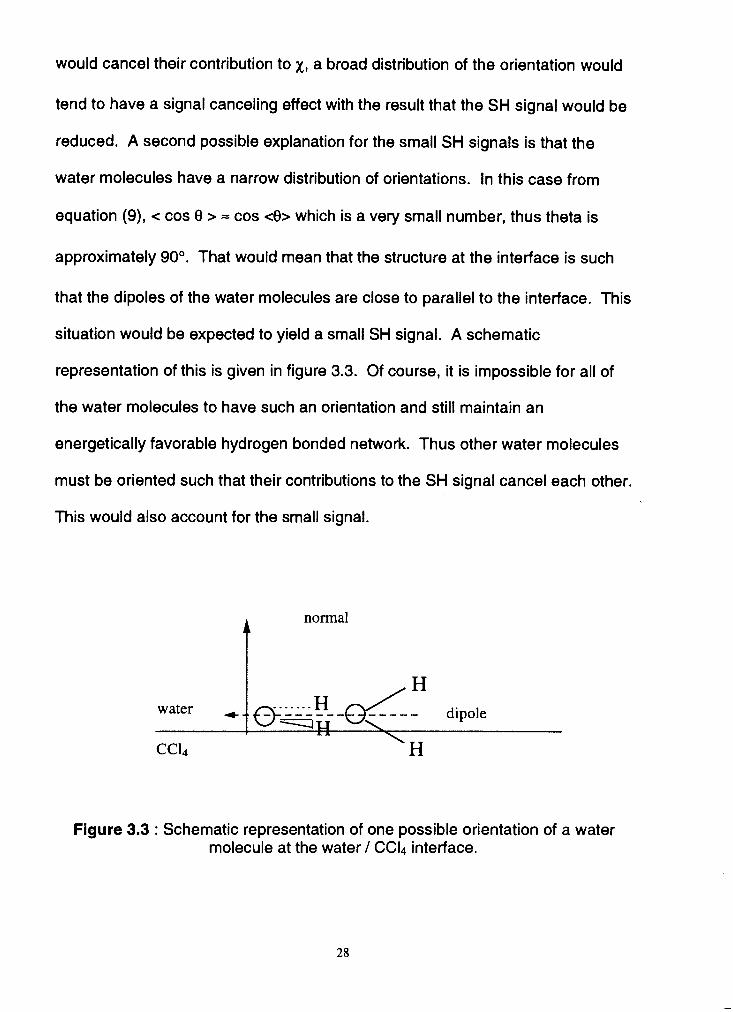
approximately 90". That would mean that the structure at the interface is such
that the dipoles of the water molecules are close to parallel to the interface. This
situation would be expected to yield a small SH signal. A schematic
representation of this is given in figure 3.3. Of course, it is impossible for all of
the water molecules to have such an orientation and still maintain an
energetically favorable hydrogen bonded network. Thus other water molecules
must be oriented such that their contributions to the SH signal cancel each other.
This would also account for the small signal.
A normal
Figure 3.3 : Schematic representation of one possible orientation of a water molecule at the water / CC14 interface.
Y. R. Shen et. 27 have reported surface vibrational spectroscopy
studies at three different water / hydrophobic interfaces; water / air, water /
surfactant covered quartz, and water / hexane. They have determined that 25 %
of the water molecules in a full monolayer have one of their hydrogen atoms
pointing toward the non-polar phase. Our results are consistent with this view.
With the water molecules unable to participate in any hydrogen bonding they are
aligned with their dipoles parallel to the interface and some of the hydrogens are
pointing toward the CC14 phase. These hydrogens would give rise to a large
surface vibrational spectrum. Since the dipoles are close to parallel to the
interface, the SH signal is small but as expected a fairly large surface vibrational
signal could be obtained with a frequency shifted peak for the OH'S that are
pointed out of the water, which is what Shen observed.
Chapter 4: Investigation of p-Nitroaniline and its pH Dependence at the Water 1 Carbon Tetrachloride Interface
4.1) Introduction
The behavior of organic molecules at interfaces has been the subject of
intense study for almost a century. ' Despite the widespread interest in this field,
an investigation of these interfaces on a molecular level remains an experimental
challenge. As mentioned in section 1 .l, molecules at a liquid - liquid interface
are especially difficult to investigate due to contributions in signal from the large
number of solute molecules in the bulk. The surface specific non-linear optical
technique, second harmonic generation, conquers this problem. Second
harmonic generation (SHG) is forbidden in the bulk media, thus it may be used
as a probe for molecules at the liquid - liquid interface.
P-nitroaniline was chosen as a probe molecule to investigate the
adsorption energetics and orientation effects at the water / CC14 interface
because of its large nonlinear response. This large response is a result of the
strength of the pNA donor and acceptor groups on opposite ends of the
molecule. This leads to a large nonlinear polarizability, P (refer to section 1.2 for
more details).
This investigation employs SHG as a spectroscopic tool in the detection of
monolayer and submonolayer coverages of p-nitroaniline at the water 1 CC14
interface. We have used this technique to determine the Gibbs free energy of
adsorption (AGOad,) of pNA, and to determine its averaged molecular orientation.
As well, the molecular orientation and SH signal intensity were investigated at
this interface as a function of solution acidity to monitor the adsorption energetics
of an organic ion at this liquid - liquid interface. These results provide an
example of interfacial chemical equilibrium and allow one to contrast aspects of
this equilibrium with those observed in the bulk phase.
In section 4.2 and section 4.3, descriptions of the adsorption energetics
and averaged rriolecular orientation of pNA and the protonated pNA at the water
1 CC14 interface are presented.
4.2) Second Harmonic Generation Studies of P- nitroaniline at the Water 1 CCI4 interface
4.2.1) Chemical Equilibrium: The Adsorption Isotherm
Recalling equation (4), the intensity of the second harmonic light is
proportional to the susceptibility squared multiplied by the intensity of the input
light squared (see equation 10 ).
I(2w) - (X'2')2 (~ (w) )~
As will be discussed later in section 4.2.2 A), the X'2' is proportional to the
number of molecules at the interface. So the SH signal generated is proportional
to the number of molecules squared. Thus a plot of the square root of the SH
intensity versus the concentration of the molecules in the bulk yields an
adsorption isotherm which is a measure of the number of interfacial molecules
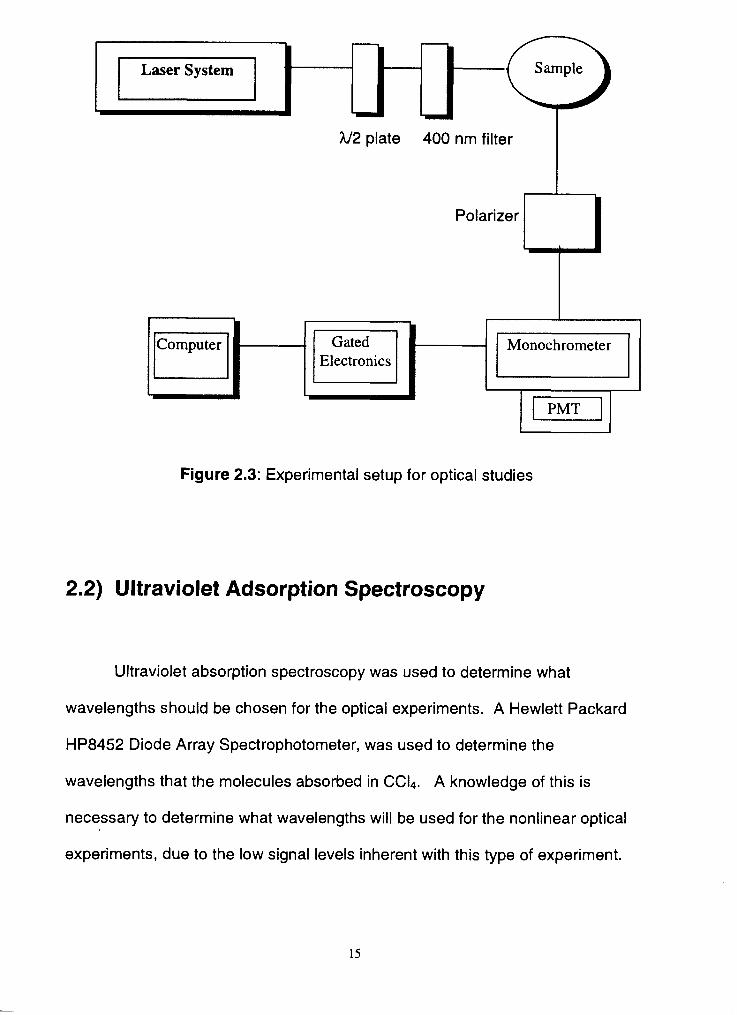
which undergo adsorption. The experimental setup is described in detail in
section 2.2.2).
4.2.1 A) The Langmuir Isotherm
The relationship between the amount of substance adsorbed at the
interface and a physical property of the interface (like the surface tension or the
second harmonic signal generated there) at a given temperature, is called an
adsorption isotherm. The Langmuir isotherm is the simplest isotherm and is
based on three assumption^.^^ The first is that maximum coverage is a
monolayer, thus no adsorption occurs beyond this. The second assumption is
that all sites available for adsorption are equivalent and the surface is uniform.
The final assumption is that the molecule's ability to be adsorbed is independent
of the occupation of neighboring sites.
There is an adsorption and desorption equilibrium that exists between the
bulk pNA molecules (M) and the free surface sites (S), giving rise to filled surface
sites (MS), represented by the following equation l 5
where kl is the rate constant for adsorption in molecules per second and k2 is the
rate constant for desorption. The kinetic equation l5 is
where N is the number of adsorbed molecules, N,, is the maximum number of
adsorbed molecules, C is the concentration of the bulk in moles1 liter, and 55.5 is
the molarity of water. The first term in this equation describes the rate of
adsorption and the second term describes the rate of desorption. At equilibrium
dN/dt = 0 and
Since 11N is proportional to the inverse of the square root of the SH intensity, a
plot of the inverse of the square root of the SH intensity versus the inverse bulk
concentration will yield a straight line with intercept equal to the inverse of the
maximum number of adsorbed molecules possible, and slope of
(55.5/N,,)(kl/k2), where
and AGoads is the free energy of adsorption and T is the temperature in degrees
Kelvin.
The kinetic equation at equilibrium can also be rewritten in the more
common Langmuir adsorption equation l5
This equation can be used directly in a theoretical fit to the plot of square root of
intensity versus concentration.
4.2.1 B) Results and Discussion
Figure 4.1 shows the adsorption isotherm obtained for pNA at the
water1 CC14 interface. The curve starts at the background level which is
essentially the signal generated from the clean water 1 CC14 interface. As the
bulk concentration increases, the signal increases until a monolayer is formed at
which point the curve levels off. Higher concentrations could not be investigated
since pNA is not extremely soluble in water. In figure 4.1, the squares represent
experimental data. The best fit was attained by a nonlinear least squares fit to
equation 13 as will be discussed below. The error bars were determined by
repeating various concentrations and observing the variation in signal. At low
concentrations the error was approximately twenty percent of the square root of
the intensity and at high concentrations the error was approximately five percent.
Adsorption isotherm for PNA at the Water 1 CCI4 i nterface
Figure 4.1 : A plot of the square root of the SH intensity versus bulk concentration for pNA. The squares represent experimental results and the line
is the theoretical fit, based on the Langmuir isotherm.
? 3 d w
% C1 . - V) C a> .C.r
C - I cn F a a
0 -
I E
I I I I I
0.00E+00 5.00E-04 1.00E-03 1.50E-03 2.00E-03
Concentration (M)
A nonlinear least squares fit to equation 13 yields a straight line as can be seen
in figure 4.2. Since the square root of the SH intensity is proportional to the
number of adsorbed molecules, according to equation 13 a plot of the inverse of
the SH signal versus the inverse of the bulk concentration will yield a straight
line. The squares represent the experimental results and the line is a best fit.
The slope of this line is 7.93 x 10⁻⁴ M and the intercept is equal to 7.56 x
The value of kl/k2 was calculated to be 1.1 3 x lo-'. The error is greater at the
lower concentration, as previously discussed in this section and was determined
by repeating various concentrations and determining the standard deviation.
Using these values and equations 13 and 14, the Gibbs free energy of
adsorption was determined to be -9.48 * 0.37 kcal/mol.
PNA at the Water/CC14 Interface
Figure 4.2 : A plot of the inverse of the square root of the SH signal versus the inverse of the bulk concentration of pNA. The squares represent experimental
results and the line is the theoretical fit.
Similar studies have previously been performed and some discussion of these is
necessary to put their results into context. An investigation by Higgens et. a/.
determined that the nitro group in p-nitrophenol is directed away from water at
the water 1 air interface. Using chemical intuition in the case of pNA, it would be
reasonable to assume that the NO2 group is the non - polar group and is pointed
toward the CC14. The NH2 group is more polar and also can form hydrogen
bonds with water molecules in the the aqueous phase. Using SHG, Castro et.
a1.15 have examined the behavior of p - n - alkylanilines with zero to six and ten
carbons in the hydrocarbon chain at the air / water interface. These molecules
are amphiphilic, meaning they have both hydrophilic and hydrophobic
components. 23 The molecules were oriented with their hydrophobic chain
pointed out of the water and the hydrophilic -NH2 group in the water phase. They
found a linear relationship between carbon chain length and AGoads where the
AGoads changed by 0.78 kcal/mol with every additional CH2 unit in the alkyl chain.
It was concluded that the free energies of adsorption became more negative
(from -3.5 to -1 1.3) with increasing chain length. This is consistent with the fact
that hydrophobicity increases with chain length. Thus the molecules would
prefer to be adsorbed at the interface where the hydrophobic chain can be away
from the water and the hydrophilic group can be in the water. Comparison our
results to Castro et. a/. l5 would indicate that the nitrobenzene portion of the
molecule behaves in the same manner as an alkyl benzene with chain length
between five and eight carbons, implying a large hydrophobic interaction.
However, our interface and those studied by Castro 15, although they have
37
similar properties, are not the same. Therefore to make a more direct
comparison, a future study would need to investigate other anilines at the water /
CC14 interface to see if similar behavior is observed.
4.2.2) Polarization Studies
The averaged molecular orientation of p-nitroaniline at various
concentrations was determined by a method that is outlined in section 4.2.2 A).
The experimental procedure is as described in section 3.2 and chapter 2.
4.2.2 A) Determination of the Interface Susceptibilities
The interface susceptibility, X'2', is directly related to the averaged
molecular orientation by the following formula:
xI,JK(~) = NS <FIJK~~~ (E, 0, a) > Pijk
where Piik is the nonlinear polarizability tensor element related to the SHG
response of an isolated molecule, Ns is the surface concentration of molecules,
and < FIJKijk(&, 0, a) > describes the averaged molecular orientation. The angles
E, 0, and a are described in figure 4.3.
To determine the averaged molecular orientation, one must first
determine what parameters of p are important and how to obtain values for them
through calculation or chemical intuition. Once the Piik elements are defined, and
xMW dotermined experimentally, they can be related in order to extract the
rnolacular averaged orientation, <F>.
Figure 4.3 : Definition of E, 8, and a. The surface normal is the Z axis. The triangle and square represent the NH2 and NOn groups. 2
i) Molecular Nonlinear Polarizabilities
Assuming a simple two level model where one only considers a
ground state and a single excited state, the equation for the elements of the
nonlinear polarizability tensor are given by l2
where Ar,, is the difference in permanent dipole moment between excited state n
and ground state g, r'., is the transition dipole matrix element between states n
and g along the molecular axis j, o is the incident laser frequency, and on, is the
difference in frequency between the ground and excited states. When the
frequency of the energy level on, is close to or resonant with the frequency of
the laser light, o, or the second harmonic light, 20, then the p's increase
dramatically thus the X(2"s increase and in turn the SHG is much enhanced. In
cases where rng and Ar, are collinear, the polarizability tensor is simplified
dramatically and only P,, is nonzero. In more complicated cases such as this
one with many real energy levels, working with only one tensor element is an
oversimplification, and other contributions cannot be neglected. *' For molecules
such as p-nitroaniline calculations have been completed 29 to determine that only
two components p dominate: p, and Dm.
ii) Surface Nonlinear Susceptibility
X~Jd2' is a tensor element with twenty seven elements. This tensor
can be reduced by assuming that the molecules at the interface are randomly
oriented in terms of rotation around the surface normal, Z. That is to say that a
random distribution of E is assumed. For example, X, will be zero following this
assumption. The polarization in this case is
Px = xxxvExEv
where E is the electric field intensity. Assuming that we can rotate it around the
Z axis, then
Xxxv ExEv 1 Xxxv (-Ex)(-Ev)
which is only true when the xw term is zero. Similarly twenty four of the twenty
seven components of X~JK are zero, leaving only three nonzero components of
which are xWI xUX1 and xzz. As described in detail in section 3.3 these
components of x(*) can be determined by varying the input polarization of the
incident laser light and measuring the SHG output at 0•‹ with respect to the plane
of incidence of the sample (s-polarized) and at 90' with respect to the plane of
incidence (p-polarized). These curves can be fitted by the following equations,
iii) Molecular Orientation Determination
In this case, when only two components of P are dominant, the relative
magnitudes of Pzn and Dm can be obtained from the experimentally determined
values of the X(2) elements as shown in equation (19).~'
As well, an orientation parameter D can be defined such that2'
Assuming the distribution of 8 is narrow, <cos38> - cos3c0> and <cos0> - cos<8>. From this, the average angle of the molecule with respect to the surface
normal, <8>, can be determined.
4.2.2 B) Results and Discussion
The orientation curves for the s- and p- polarized light, for pNA with bulk
concentration of 5.5 x MI are shown in figure 4.4. The polarization of the
incident light is plotted against the second harmonic signal intensity. The solid
circles represent the p-polarized SH signal and the empty circles represent the s-
polarized SH signal. The lines represent theoretical fits based on the
calculations described in the previous section. The error in these points is less
than ten percent in the y direction and two degrees or less in the x direction, and
was determined by repeat trials. The curves are fitted by fitting the s-polarized
curve first and determining x=. Then X= is fixed while the p-polarized curve is
fitted and the other two X'S are extracted.
When the experimental data for the orientation was fit theoretically for the
neutral p-nitroaniline, the ratio of xx* : xzxx : xz was found to be 1 .OO f 0.1 6 :
1.1 2 +_ 0.1 6 :1.85 f 0.21, and the ratio of Dm/ Pzu: = 0.01 7 + 0.01 1. The error for
in these values was determined as follows. Here is a typical value for pNA at a
concentration of 5.5 x 1 M.
X= = 0.725 f 0.059
x m = 0.750 + 0.051
xz = 1.328 + 0.042
The errors were extracted by nonlinear least squares fitting of the
polarization curves. The ratio of these values was calculated to be xxxz : xzxx :
xz = 1 .OO f 0.16 : 1.03 f 0.1 6 : 1.83 f 0.21. All curves demonstrated
approximately the same error so this error was taken to be representative of all
the pNA curves. All the errors in the x ratios throughout this paper have been
determined in this manner. From these X'S, the averaged orientation angle with
respect to the surface normal, 8, was calculated to be 48" ~t 0.05'. This is
comparable with results reported for p-nitrophenol at the air / water interface
where a value of 55" was obtained. 11-13 The 8 remained constant over all
concentrations, indicating that the averaged orientation did not vary with
concentration. It should be noted that the angles determined by these SHG
experiments reflect an averaged orientation angle and do not reflect molecular
tumbling of interfacial molecules. SHG is a coherent scattering parametric
process and in this experiment induced by laser pulses of 100 fs, much shorter
than rotional periods of molecules, which are typically more than 1 ns. In other
spectroscopies (for example, polarized fluorescence, NMR) special techniques
such as magic angle spinning are used in the detection of 'excited' molecules
(i.e. adsorption has already selected a subset of species being probed) in order
to remove the geometric contribution to the signal.32 Thus, SHG serves as a
probe of interfacial averaged molecular orientation.
Polarization Curve for PNA at the Water1 CC14 Interface
o s-polarized -Fit. P-pol
Fit. S-pol
0 90 180 270 360
Input Polarization Angle
Figure 4.4 : Polarization curves for pNA at a concentration of 5.5 x M. Filled circles represent experimental data for the p-polarized signal. Open circles
represent experimental data for the s-polarized SH signal. Lines represent theoretical fits as described in section 4.2.2 A.
4.3) Investigation of the pH Dependence of p-Nitroaniline
4.3.1) Adsorption Isotherm
4.3.1 A) SH Signal Dependence on pH
The acidity of pNA was varied by additions of 0.007M hydrochloric
acid (HCI) and 0.007M sodium hydroxide (NaOH) to a 5.5 x 1 oe4 M solution of
pNA at the interface, which corresponds to a surface coverage of approximately
eighty percent. The SH signal increases with the addition of acid but does not
change significantly upon addition of base (see figure 4.6. Stizman
investigated the effect that increasing the chain length (n) of p-n-anilinium ions
had on the SH signal. They found that chain lengths shorter than four carbons
showed no SH signal generated at the interface due to the strong solvation in the
bulk phase, but that the signal increased linearly with increasing carbon chain
length after four carbons. When there are more than four carbons in the chain,
the hydrophobicity overcomes this solvation. Thus our results imply that the
hydrophobic interaction of NO2, acting in a similar manner as long chain
hydrocarbons, drives more cations to the interface, thus increasing the signal.
The increase in signal with the addition of acid is consistent with the assertation
that the NH2 group of the pNA is pointed up into the water as we have argued
previously. Upon addition of acid interfacial pNA molecule can become
protonated (see fig. 4.5). One might expect the signal to vanish as a result of
the ions moving away from the interface into the water to be solvated, but this is
not the case.
The reason the signal increases is because this protonation creates a
large dipole within the molecule which increases the X(2'. which in turn increases
the SH signal intensity since the ( x ( * ' ) ~ is proportional to the signal intensity.
H+ H H L H\,
H H \ i / water
Figure 4.5 : Schematic representation of the protonation of p-nitroaniline at the water / CC4 interface.
Figure 4.6 shows the pH dependence of the SH signal of pNA at the water
/ CC14 interface. As can be seen there is a large increase in signal with decrease
in pH. The error bars were determined by repeated trials at various pH's.
pH Dependence of PNA at WaterCCI, l nterface
Figure 4.6 : Plot of second harmonic signal intensity versus pH.
The adsorption isotherm for the concentration of pNA cations has been
theoretically fit and a AGoads was determined and will be discussed in the next
section.
4.3.1 8) Adsorption Isotherm : Results and Discussion
Figure 4.7 is a plot of the inverse SH signal versus the inverse
concentration at pH = 3.5. The pKa of pNA in bulk solution is 1 .O. The percent
dissociation at this pH is 99.7%, meaning that the vast majority of pNA in solution
exists in ionic form. The squares represent the experimental data and the lines
represent the theoretical data based on the Langmuir isotherm. This plot yields a
straight line as would be expected from equation 13.
PNA ion at the Water / CC14 Interface
? =? a w - a C 0) .- V)
C3 I cn r Experimental
11 Concentration (M")
Figure 4.7 : A plot of the inverse of the SH signal versus the inverse of the bulk concentration of pNA ions. The squares represent experimental results and the
line is the theoretical fit based on the Langmuir isotherm.
The adsorption isotherm of the protonated pNA molecule was fit
theoretically in the manner described in section 4.2.1 A. Although the Langmuir
model assumes no interaction between the molecules and even though these
are ions that may repel each other, the Langmuir isotherm provides a good fit to
the data. Interestingly the model is successful, implying that the amphiphilic
nature of the molecule dominates over the repulsive effects or that the steric
effects of the organic molecule keep the charges far enough away from each
other so that the ionic replusions do not effect the signal.
Fitting the experimental data with equation 13 gives a slope of 5.25 x
M and an intercept of 0.346, as seen in figure 4.7. This corresponds to a AGoads
of -7.75 kcallmoll0.26 kcallmol. This is in line with the work of Castro et, a/.l5
who noted a decrease in the magnitude of AGoads relative to the neutral
molecule. It is likely that this decrease is a result of the extra work involved in
removing the ions from a solvated state in the water and bringing them to the
interface and due to the extra work involved in bringing an ion to an already
charged interface.
One can estimate the magnitude of these electrostatic effects by dividing
the observed AGoads into amphiphile and electrostatic contributions: l 5
AGoads = ~ G ~ a d s ~ ~ ~ + AGoads ion (21)
where A G ~ ~ ~ ~ ~ ~ ~ is that of the amphiphile and can be estimated to be the AGoads
observed for the neutral pNA molecule (section 4.2.1 B), and A G " ~ ~ ~ ' O " is that of
the electrostatic contribution. Comparison of the values of AGoads obtained for
the pNA and the p-nitroanilinium results in an electrostatic contribution of 1.73
kcallmol.
4.3.2) Polarization Studies
The polarization curve for the pNA ion at various pH's were obtained and
fitted with the method outlined in section 4.2.2.
4.3.2 A) Results and Discussion
Figure 4.8 shows an s- and p- polarization curve for pNA at a pH of 3.5.
Again, the filled circles represent the p-polarized signal and the empty circles
represent the s-polarized signal. The lines represent the theoretical best fits
determined as described in 4.2.2 A. The 0 values do not change with increased
ion concentration, in fact they are the same as the neutral pNA, 47.0" 0.08'
hence, the forces holding these molecules at the interface are dominant over the
ionic repulsion forces. The pNA cations1 orientation measurements gave a ratio
o f x x x z : ~ : x u z o f 1.0k0.13: 1.3+0.14 : 1.9+0.18. Theerrorswere
determined in the same manner as those for the neutral pNA molecule (see
section 4.2.2 B). The difference from that of the neutral pNA x ratio arises from
the increased polarization of the interfacial molecules due to protonation.
Pdarimtion Qrve fw the pNA Ion at the
ppolarizec 0 S-poIarid - Fit. P-pol
Figure 4.8 : Polarization curves for pNA at pH = 3.5. Filled circles represent experimental data for the p-polarized signal. Open circles represent
experimental data for the s-polarized SH signal. Lines represent theoretical fits as described in section 4.2.2 A.
Chapter 5 : Investigation of Positive Ions at the Water / CC14 Interface
5.1) Introduction
In a further attempt to characterize the water / CC14 interface, the
dependence of the interfacial SH signal on the presence of small ions was
examined. To investigate this, hydrochloric acid was added to the water. A
change in the SH signal occurred. To understand the nature of the SH signal, it
was monitored while adding sodium chloride (NaCI) and lithium chloride (LiCI).
The details of these experiments and the results that were obtained are
discussed in the next few sections.
5.2) Ion Adsorption at the Water / CC14 Interface
5.2.1) Water Acidity and the Water / Carbon Tetrachloride Interface
The adsorption energetics of small ions at the water / CC14 interface were
examined. Additions of 0.007 M hydrochloric acid (HCI) were made to the water
phase defining the neat interface and the SH signal was monitored. It is the
nature of the acid to be ionized in solution. An adsorption study was carried out
by examining the SH signal versus the bulk HCI concentration.
Figure 5.1 illustrates the concentration dependence of the SH signal at the
neat interface upon addition of HCI to the bulk. The squares represent
experimental data and the line is a best fit based on the Frumkin isotherm (as will
be discussed in the next section). The plot is the square root of the second
harmonic signal versus the concentration. Recall that the square root of the
second harmonic signal is proportional to the number of molecules at the
interface according to equation (4). As in previous figures, the error bars were
determined by repeating the SH intensity measurements at particular
concentrations multiple times to determine the reproducibility. The uncertainty
associated with these was then taken to be representative of the uncertainty in
data displaying comparable signal levels.
It should be noted that when the surface coverage reaches 85% (0 =
0.85), the bulk concentration was measured to be 6.93 x 10 .~ M.
Adsorption lsotherm at the Water I CC14 Interface in the Presence of HCI
- T - -
? 9 i Q V - 0 r rn i7j r Experimental U I cn - Theoretical
Concentration (M)
Figure 5.1 : Adsorption lsotherm for the water 1 CC14 interface in the presence of HCI. Squares represent experimental data. Line is a best fit determined by the
Frumkin isotherm.
5.2.2) The Frumkin lsotherm
Unlike the case of pNA and its cation, the adsorption isotherm for the
interface in the presence of HCI, does not obey the theoretical Langmuir
isotherm. Remember that one of the assumptions of the Langmuir isotherm is
that the molecule's ability to be adsorbed is independent of the occupation of
neighboring sites. 28 This implies that there are no interactions between the
molecules. One would expect, however, that small ions like H' and CI-, at the
interface may possess strong interionic interactions. In this case, the Langmuir
isotherm does not provide a good model for interfacial adsorption. A variation of
the Langmuir isotherm, the Frumkin isotherm, does take into consideration the
attraction or repulsion of adsorbed species and is often used successfully to
model the adsorption of ions on metal electrodes. 30 The Frumkin isotherm
incorporates a term called the attraction coefficient. If the ions attract each
other, the coefficient is positive and if the ions repel each other, the coefficient is
negative. As one would expect, when the attraction coefficient approaches zero,
the Frumkin isotherm approaches the Langmuir isotherm. The formula for the
Frumkin isotherm is
where 8 is the surface coverage (1 2 8 2 O), C is the bulk concentration, g is the
attraction coefficient and p, the adsorption coefficient, is given by
When our data was fitted to equation (22) using a nonlinear least squares
fitting technique, a combination of an attraction coefficient, g, of -4.41 f 0.66 and
a AGOads of 1.46 + 0.64 kcallmol gave a best fit. Such a large negative g
indicates a strong repulsive force at the interface consistent with either
adsorption of the hydrogen or the chloride ions. The AGoads is the driving force
for adsorption at the interface. Its small magnitude and positive sign indicates
that the concentration of adsorbed species at the interface is smaller than that in
solution and that the interfacial concentration of ions is a result of the increase in
bulk concentration. The next step is to determine the identity of the adsorbed
species. For this purpose sodium chloride and lithium chloride were also
investigated.
5.2.3) The Water / CC14 Interface in the Presence of Sodium Chloride and Lithium Chloride
The concentration dependence of the SH signal, upon addition of lithium
chloride (LiCI) and upon addition of sodium chloride (NaCI) to the water phase
defining the bulk, was observed. As in the case of HCI, these adsorption
isotherms were fit using the Frumkin model. Figures 5.3 and 5.4 show the
dependence of the SH signal on bulk concentration of LiCl and NaCl
respectively. The squares represent experimental data and the lines represent
best fits based on the Frumkin isotherm.
As in the case of hydrogen chloride, the lithium and sodium chloride have
attraction coefficients of -4.37 zfr 1.42 and -2.89 f 1.08 respectively, indicating a
strong repulsive force between the adsorbed species and consistent with ionic
adsorption. The corresponding Gibbs free energies of adsorption were found to
be 1.64 + 0.52 kcal/mole and 0.54 + 0.41 kcal/mol for LiCl and NaCl respectively.
These results are similar to those seen for HCI. Based on the AGoads, the
interfacial ion concentration is less than that for the bulk and that the increase in
bulk concentration causes the increase in interfacial ion concentration.
Adsorption lsotherm at the Water I CC14 Interface in the Presence of LiCl
m Experimental - Theoretical
J " I I I I C
0.00E+00 1.00E-04 2.00E-04 3.00E-04
Concentration (M)
Figure 5.2 : Adsorption lsotherm for the water / CC14 interface in the presence of LiCI. Squares represent experimental data. Line is a best fit determined by the
Frumkin isotherm.
Adsorption lsotherm at the Water I CC14 Interface in the Presence of NaCl
Figure 5.3 : Adsorption Isotherm for the water / CCI4 interface in the presence of NaCI. Squares represent experimental data. Line is a best fit determined by the
Frumkin isotherm.
It is the nature of the acid and the salts to be ionized in solution. Since
the SH signal increases with increasing salt concentration and since the only
reasonable fits occur when there is a large repulsive factor incorporated, then it
can be argued that there is ion adsorption at the interface. The major difference
between HCI and the alkali metal chloride salts is the concentration at which
adsorption is observed. Recall that for HCI, a surface coverage of 85% was
attained at a bulk concentration was 6.93 x M. For the cases of LiCl and
NaCl there is approximately an order of magnitude increase in bulk concentration
required to reach the point of 85% interfacial coverage. For LiCl when 8 = 0.85,
the bulk concentration was 3.5 x IO-~M. For NaCl when 8 = 0.85, the bulk
concentration was 7.5 x M. This large variation in signal with the nature of
the cationic species strongly argues that the change in the signal observed is
due to a cation effect and not the chloride ions. The behavior of the chloride
species remains unclear but more studies must be completed with larger alkali
metal chloride salts to form a definite conclusion on this.
5.3) Second Harmonic Polarization Dependence on Cationic Adsorption at the Water I CC14 Interface
When HCI, LiCl or NaCl is added to the bulk water the SH signal
generated at the interface increases. Since the SHG technique is sensitive to
the degree of interfacial polarization and its anisotropy, this observation indicates
that some degree of interfacial polarization has occurred. Comparing the
increases in SH signal of the HCI, LiCI, and the NaCl argues that the polarization
is cation dependent. In order to understand the nature of the SH response
further, we have examined the polarization dependence of the SHG.
Figure 5.4 shows the SH polarization curves observed for a bulk HCI
concentration of 2.70 x M. While varying the polarization of the input light,
the SH response was monitored. The filled circles represent the experimental
data for the p-polarized signal, the empty circles represent the experimental data
for the s-polarized signal. The lines represent theoretical fits. The error in these
points is less than ten percent in the y direction and two degrees or less in the x
direction. The uncertainty associated with these points was determined by
repeating measurements to determine their reproducibility.
Figures 5.5 and 5.6 show the orientation curves for 3.0 x 10" M LC1 and
1.4 x 1 o4 M NaCI, respectively. The symbols and the errors are as previously
explained for the HCI case. As can be noted in all three polarization curves, the
p - polarized signals all have a maximum at 80•‹+ n(90)", where n = 0, 1, 2, 3.
This is the same phase that was observed for pNA and the opposite phase
observed for the neat interface.
Polarization Curve for the Water/ CC14 lnterface in the Presence of HCI
0 9 0 180 270 360
lnput Polarization Angle
/ p-polarized o s-polarized
-Fit. P-pol
Figure 5.4: Orientation curves for HCI (concentration = 2.7 x M) of s-and p- polarized SH signal, where filled circles represent p-polarized and hollow circles represent s-polarized. Lines represent theoretical fits. The ratio of X X X ~ : X ~ : X ~
is 1.0f 0.17 : 1.3k0.16 : 1.0k0.12.
Polarization Curve for the Water/ CC14 lnterface in the Presence of LiCl
0 90 180 270 360
lnput Polarization Angle
/ p-polarized 1 o s-polarized 1 - Fit. P-pol
Fit. S-pol
Figure 5.5: Orientation curves for LiCl (concentration = 3.0 x 1 0-4 M) where filled circles represent p-polarized and hollow circles represent s-polarized. Lines
represent theoretical fits. The ratio of X X X Z : X ~ : X Z Z Z is 1.0 + 0.12 : 1.18 k 0.28 : 1.98 f 0.34.
Polarization Curve for the Water1 CC14 Interface in the Presence of NaCl
I p-polarized I o s-polarized / - Fit. P-pol
Fit. S-pol
0 90 180 270 360
Input Polarization Angle
Figure 5.6: Orientation curves for NaCl (concentration = 1.4 x 1 0-4 M) where filled circles represent p-polarized and hollow circles represent s-polarized.
Lines represent theoretical fits. The ratio of X X X Z : ~ : X Z Z Z is 1.0If:0.12: 1.1 &0.28:2.0+0.34.
5.4) lnterface Structure
We would like to understand the nature of our signal. This is very
complicated and it is useful to discuss several possibilities as to how the signal is
generated. Figure 5.7 is a schematic representation of various possibilities.
Figure 5.7: Schematic representation of the interface. The gray circles are negative ions, the small black circles are positive ions and the ovals are water. Arrows represent possible dipoles. D.D. represents the diffuse double layer.
We have determined through our adsorption studies that the change in
signal is a cationic effect. There are several possible ways that this may be
taking place. One possibility is that ion pairs are forming at the interface and
creating an interface polarization as depicted in figure 5.7. Another possibility is
that the cation can interact with a chlorine from the CCI4 and a small polarization
arises, also depicted in figure 5.7. In both of these cases, what is called a
diffuse double layer is likely to have formed and an electric field induced SH
signal is observed. The water solution is thought to be made up of layers. The
layer closest to the interface contains solvent and solute molecules, specifically
ions, and is said to be specifically adsorbed. The next layer is one that contains
nonspecifically adsorbed species, for example counterions. This layer is called
the diffuse double layer 30, and is represented in figure 5.7. In the case of a
liquid - liquid interface, there is a possibility of having two such diffuse layers,
one in each phase. Although this is a possibility, it would not have a huge
effect in our particular case because the water phase would much more readily
solvate the ions. The dielectric constant for water is approximately 80, compared
to that of CC4 approximately 2.24. 31
Another possible reason for the increase in signal upon addition of ions
may be the reorganization of the water molecules to solvate the ions. The signal
described in chapter 3 for the neat interface was extremely small due to the
unique order at the interface. This order is disrupted when ions are placed in
solution and the signal increases. This might be a result of the reorganization of
the water molecules to accommodate the ions. Varying the size of the ion may
lead to more or less reorientation of the water molecules causing the signal to
increase or decrease.
Knowing that this is a cation effect and that it is an electric dipole induced
SH signal leaves open the possibility for future experiments to learn more about
the electric field component without the molecular component. A method of
doing this is to perform an absolute molecular orientation measurement to
determine the phase of X , by comparing the signal generated by the sample
compared to the signal generated from a reference. 29
Chapter 6 : Conclusion
Using second harmonic generation, we have studied the structure and
adsorption at the water / carbon tetrachloride liquid - liquid interface. First, the
neat interface was examined by carrying out polarization dependent studies.
From these studies the values for the interfacial susceptibilities were determined
and upon analysis it was concluded that a large fraction of the interfacial water
molecules lie with their dipole parallel to the interface.
Second harmonic generation was then used to study the adsorption
energetics and the averaged orientation of an organic probe molecule, p-
nitroaniline. p-Nitroaniline showed a large negative Gibbs free energy of
adsorption (-9.48 kcal/mol), suggesting a preference for these molecules to
reside at the interface. It was also found that the molecules have a strong
orientation preference corresponding to an averaged orientation where the
symmetry axis of pNA is at 48" + 2" with respect to the surface normal. The pH
dependence of p-nitroaniline was also examined to learn about the adsorption
energetics and orientation of the p-nitroaniline ion. The repulsions caused by ion
formation were insufficient to perturb the orientation observed for neutral pNA.
The Gibbs free energy of adsorption decreased significantly in magnitude to
-6.62 kcal/mol. This increase is the result of the extra work involved in bringing
an ion from a solvated state to an interface where it could not be solvated as
well, and by the extra work involved in bringing a charged species to an already
charged interface.
In addition, the water 1 CCl4 interface was further characterized by the
investigation of the adsorption of small ions, namely hydrogen, lithium, and
sodium. The Gibbs free energy of adsorption were small positive numbers for all
of the ions, indicating a preference for being in solution. The adsorption of the
ions indicated a size dependence but further studies must be carried out to form
a definite conclusion on this. The nature of the SH response in the case of small
ion adsorption is a result of an electric field induced process and was effected by
the reorientation of the water molecules to solvate these ions.
Works Cited
K. B Eisenthal, Acc. Chem. Res., 26, 636, (1993)
A. G. Volkov, D. W. Deamer, "Liquid-Liquid Interfaces: Theory and Methods", ( Chapters 4 and 6), CRC Press, New York, 1996
F. Zernicke, J. E. Midwinter "Applied Nonlinear Optics", John Wiley and Sons Inc., (Chapter I ) , Toronto, 1973
P. N. Prasad, D. J. Williams, "Introduction to Nonlinear Optical Effects in Molecules and Polymers", (Chapter I ) , John Wiley and Sons Inc., Toronto, 1991
T. F. Heinz, C. K. Chen, D. Richards, and Y. R. Shen, Phys. Rev. Lett., 46,1010, (1981)
D. A. Higgens, M. B. Abrams, S. K. Byerly and R. M. Corn, Langmuir, 8, 1994, (1 992)
E. V. Stizman, K. B. Eisenthal, J. Phys. Chem., 90, 2831, (1989)
E. N. Svendsen, C. S. Willand, A. C. Albrecht, J. Chem. Phys., 83, 5760, (1 985)
S. R. Marder, D. N. Beratan, L. T. Cheng, Science, 252, 103, (1 991)
10) T. F. Heinz, H. W. K. Tom, Y. R. Shen, Phys. Rev. A, 28(3), 1883, (1983)
11) D. A. Higgens, R. M. Corn, J. Phys. Chem., 97,489, (1 993)
12) R. R. Naujok, D. A. Higgens, D. G. Hankan, and R. M. Corn, J. Chem, Soc. Faraday Trans., 91 (lo), 141 1, (1 995)
H. J. Paul and R. M. Corn, J. Phys. Chem. B,101,4494, (1997)
K. Bhattacharyya, A. Castro, E. V. Sitzmann, and K. B. Eisenthal, J. Chem. Phys., 89(5), 3376, (1 988)
A. Castro, K. Bhattacharyya, and K. B. Eisenthal, J. Chem. Phys., 95(2), 1310, (1991)
J. C. Conboy, J. L. Daschbach, and G. L. Richmond, J. Phys. Chem., 98, 9688, (1 994)
T. Rasing, and Y.R. Shen, Phys. Rev. A, 31(1), 537, (1985)
K. Bhattacharyya, E. V. Sitzmznn, K. B. Eisenthal, J. Chem. Phys., 87(2), 1442, (1 987)
M. C. Goh, J. M. Hicks, K. Kemmitz, G. R. Pinto, T. F. Heinz, K. Bhattacharyya, and K. B. Eisenthal, J. Phys. Chem., 92, 5074, (1 988)
S. R. Meech, K. Yoshihara, Chem. Phys. Lett., 174, 423, (1990)
S. R. Meech, K.Yoshihara, J. Phys. Chem.,94,4913, (1990)
N. J. Hartwick, "Internal Reflection Spectroscopy", Interscience Publishers, (Chapter I ) , New York, 1967
J. Israelachvili, " Intermolecular and Surface Forces", (Chapter 8), Academic Press, Toronto, 1992
24) B. U. Felderhof, A. Bratz, G. Marowsky, 0. Roders, and F. Sieverdes, J. Opt. Am, B., 10(1), 1824, (1 993)
G. D. Purvis, R. J. Bartlett, J. Phys. Rev, A, 23, 2429, (1981)
Q. Du, E. Fresysz, Y. R. Shen, Science, 264, 826, (1994)
Q. Du, R. Superfine, E. Freysz, Y. R. Shen, Phys. Rev. Lett., 10(15), 2313, (1 993)
P. W. Atkins, "Physical Chemistry", (Chapter 28), W. H. Freeman and Company, New York, 1994
A. Ulman, "Characterization of Organic Thin Films", (Chapter 1 2), Manning Publications Co., Greenwich, CT, 1995
A. J. Bard, L. R. Faul kner, "Electrochemical Methods: Fundamentals and Applications", (Chapter 12), John Wiley and Sons, Toronto, 1980
D. R. Lide, "CRC Handbook of Chemistry and Physics", CRC Press, 1 992
R. H. Harris, " Nuclear Magnetic Resonance Spectroscopy", (Chapters 4 and 6), Longman Scientific and Technical, New York, 1994