43
Structure and dynamics of RNA polymerase II C- terminal domain in complex with cancer-linked FET protein assemblies Abigail Janke Sc.B. Computational Biology, 2016 Brown University
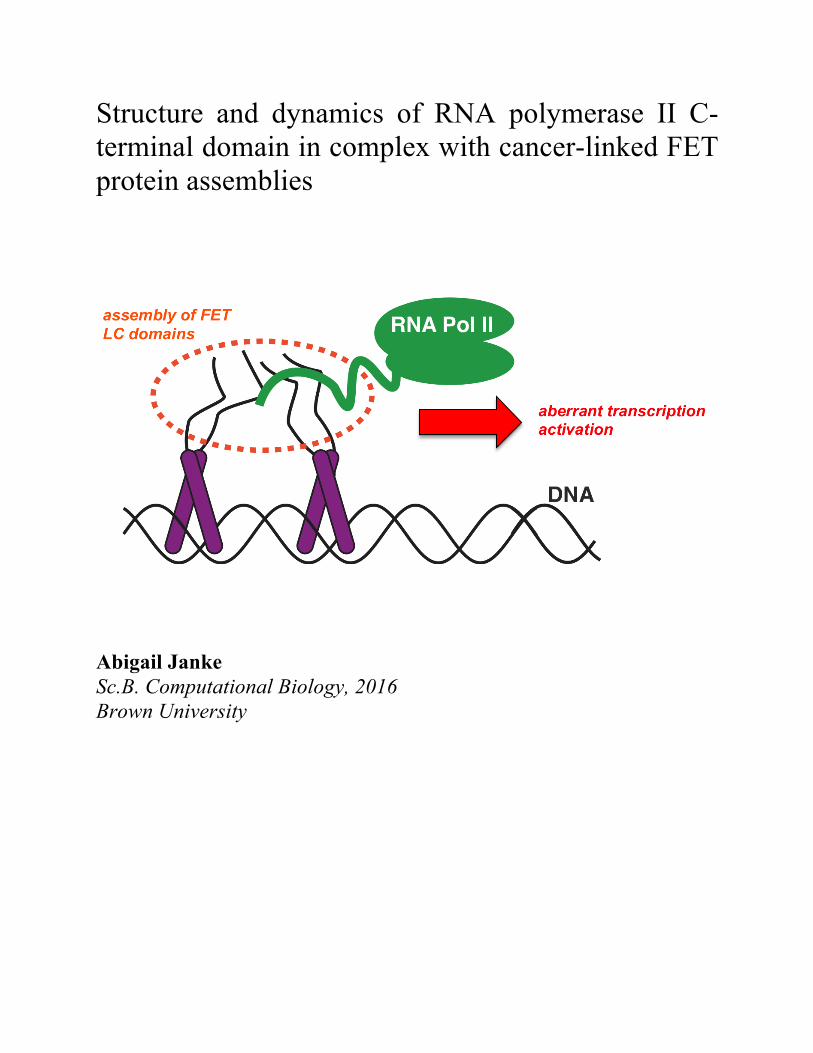
Structure and dynamics of RNA polymerase II C-terminal domain in complex with cancer-linked FET protein assemblies
Abigail Janke Sc.B. Computational Biology, 2016 Brown University

1
TABLE OF CONTENTS ACKNOWLEDGEMENTS ...................................................................................... 2 STATEMENT OF CONTRIBUTIONS .................................................................... 3 GLOSSARY .............................................................................................................. 4 ABSTRACT .............................................................................................................. 5 INTRODUCTION ..................................................................................................... 6 MATERIALS AND METHODS ............................................................................ 12 RESULTS ................................................................................................................ 18 DISCUSSION ......................................................................................................... 34 REFERENCES ........................................................................................................ 37 APPENDIX A ......................................................................................................... 41

2
ACKNOWLEDGEMENTS
! I thank my thesis readers, Professor Nicolas Fawzi and Professor Rebecca Page.
! I thank Professor Nicolas Fawzi, Rute Silva, Dr. Kathleen Burke, Alexander Conicella,
and Veronica Ryan for their invaluable mentorship, patience, and kindness.
! I thank Dr. Michael "Sparky" Clarkson for his assistance with NMR experiments.
! I thank Charlene Chabata and Daniel Ramirez Montero for helpful course discussions and
academic advising.
! Last but not least, I thank RJJ, DMJ, CEJ, and YAK.
3
STATEMENT OF CONTRIBUTIONS
" The title page graphic was adapted from Dr. Fawzi. Unless otherwise noted, all other
figures are my own and were generated from data I personally collected.
" NMR experiments: Dr. Fawzi, Dr. Burke, Alexander Conicella, and Dr. Clarkson set up
and helped me run all relaxation and triple resonance experiments. I independently ran
most HSQC experiments.
" Bacterial plasmids: Rute Silva and Dr. Burke cloned MBP-FUS FL. CTD27-52 was
synthesized by DNA2.0, and I cloned CTD27-37, CTD38-52, and CTD43-52. mCherry-
FUS LC and mCherry-TAF15 LC were gifts from the McKnight lab.
" Dr. Burke contributed to assignments of CTD27-52.

4
GLOSSARY
• β-turns: Common protein structural motif that is most often defined as a sequence of four amino acid residues containing a hydrogen bond between the carbonyl of the first residue and the amide of the fourth residue
• CARM1: Coactivator-associated arginine methyltransferase 1; enzyme that has been shown to methylate RNA polymerase II CTD's single arginine residue (R1810)
• CON spectrum: 13C-15N NMR spectrum that correlates resonances of carbonyl carbons with resonances of amide nitrogens; provides a fingerprint of a protein much like an HSQC
• CTD: RNA polymerase II carboxy-terminal domain • CTD degenerate repeats: In the mammalian RNA polymerase II CTD, heptad repeats 27-52 deviate
from the YSPTSPS consensus sequence • EWS: Ewing Sarcoma Breakpoint Region 1, an RNA-binding protein in the FET family • FET: Family of proteins important in RNA biogenesis (FUS, EWS, TAF15) • FUS: Fused in Sarcoma, an RNA-binding protein in the FET family • HSQC spectrum: 1H-15N heteronuclear single quantum coherence NMR spectrum; correlates amide
proton resonances with amide nitrogen resonances and provides a 'fingerprint' of a protein • Intrinsically disordered proteins: Proteins without an ordered or fixed three-dimensional structure
(includes random coils, pre-molten globules, and partially unstructured multi-domain proteins); disorder is not due to denaturation or unfolding
• Left-handed polyproline II helix (PPIII): Type of protein secondary structure in which adjacent amino acid residues adopt backbone dihedral angles near 𝜙 = -75°, 𝜓 = 150°
• Low-complexity (LC) domain: Protein domain with a simple amino acid sequence; FUS, EWS, and TAF15 each have a LC domain that is thought to act as a transcriptional activator
• mRNA: Messenger ribonucleic acid that is transcribed from deoxyribonucleic acid (DNA) by RNA Polymerase II; the ribosome translates mRNA into proteins
• NOE: Nuclear Overhauser effect; NMR measurement that can be used to study protein structure and interactions and relies on the transfer of energy through dipole-dipole couplings
• PIC: Pre-initiation complex; complex of RNA polymerase II and general transcription factors that assembles at the promoters of genes before transcription begins in eukaryotes and archaea
• R1: Rate of longitudinal relaxation; reciprocal of T1, the time it takes for the z component of nuclear spin magnetization to recover its thermal equilibrium value
• R2: Rate of transverse relaxation; reciprocal of T2, the time it takes for nuclear spin magnetization to decohere
• ΔR2: Difference in rate of transverse relaxation; if 15N ΔR2 measurements are calculated for a monomer in the presence and absence of larger, NMR-invisible fibrils, 15N ΔR2 can be interpreted as a lower bound for the first order on-rate for the monomer binding the fibrils
• TAF15: TATA Box Binding Protein (TBP)-Associated Factor 15, an RNA-binding protein in the FET family
• TEV protease: Tobacco Etch Virus protease that specifically cleaves at EXXYXQ(G/S) motifs; we use TEV protease to cleave MBP and histidine tags from our proteins
• Triple resonance experiments: CBCA(CO)NH, HNCACB, HNCO, HN(CA)CO, HNCA, HNN; these 1HN-detected NMR experiments correlate C𝛼 and C𝛽chemical shifts with NH groups by transferring magnetization between amide protons, amide nitrogens, and carbon atoms, and they are used to assign the backbone of a protein

5
ABSTRACT Translocations of FET protein (FUS, EWS, TAF15) low complexity (LC) domains onto
transcription factor DNA-binding domains are known to cause cancer (Arvand and Denny,
2001; Guipaud et al., 2006; Lessnick and Ladanyi, 2012). Because FET LC domains are believed
to be potent transcriptional activators, FET LC fusions are thought to cause aberrant transcription
of genes related to cell growth and survival (Kwon et al., 2013). But what makes FET LC
domains such potent transcriptional activators? Various in vitro models have suggested that
higher order assemblies of FET LC domains recruit RNA Polymerase II CTD to promoters,
leading to formation of the pre-initiation complex (Kwon et al., 2013; Schwartz et al., 2013;
Burke et al., 2015). While others have shown that TAF15 LC fibrils recruit the degenerate half of
RNA polymerase II carboxy-terminal domain (CTD), structural details of the complex formed
between self-assembled FET proteins and the CTD remain unknown.
Here we detail the first nuclear magnetic resonance (NMR) study of the intact degenerate
repeat half of the CTD (CTD27-52). We report 1H, 15N backbone resonance assignments as well
as key structural and dynamic parameters of CTD27-52, which verify that the unphosphorylated
degenerate half of the CTD exists in an entirely disordered conformation. We then characterize
the dynamics of the RNA polymerase II CTD27-52 in complex with TAF15 LC fibrils. In the
presence of TAF15 LC fibrils, backbone resonances within the first 7 heptads of the degenerate
half of RNA polymerase II CTD exhibit heightened transverse relaxation, consistent with regions
mediating direct binding of TAF15 LC fibrils. Our findings help characterize the mechanism by
which higher order assemblies of FET LC domains recruit RNA polymerase II CTD, which is
critical for understanding the role of FET translocations in cancer. Separately, and perhaps more
significantly, our backbone resonance assignments of unphosphorylated CTD27-52 facilitate
future investigations of residue-specific interactions between the CTD and numerous
transcription initiation factors.
6
INTRODUCTION
Discovery of the RNA Polymerase II CTD. RNA polymerase II is the principle enzyme
mediating gene expression in eukaryotic cells. Its most significant role is catalysis of
transcription of pre-mRNA from DNA. RNA polymerase II's long, flexible carboxy-terminal
domain (CTD) was first discovered in 1985 (Corden et al., 1985; Allison et al., 1985). Although
essential for life (Nonet et al., 1987), the CTD is often not required for transcription initiation
and mRNA synthesis in vitro (Payne et al., 1989; Zehring et al. 1990; Buratowski et al.
1990; Kang et al., 1993; Akoulitchev et al., 1995), suggesting it is not the 'catalytic essence' of
RNA polymerase II (Corden et al., 2013).
The CTD distinguishes RNA Polymerase II from its enzymatic relatives, RNA
Polymerase I and RNA Polymerase III, which catalyze transcription of pre-rRNA in the
nucleolus and pre-tRNA in the nucleoplasm, respectively (Corden et al., 2013). The CTD is
thought to help coordinate interactions between RNA Polymerase II and various proteins critical
for transcription and co-transcriptional activities. Besides recruiting RNA polymerase II to the
pre-initiation complex through interaction with the Mediator and general transcription factors
(GTFs) bound to gene promoters, the CTD may help: 1) recruit pre-mRNA 5'-end capping
enzymes; 2) facilitate efficient splicing alongside transcription; 3) coordinate proper cleavage
and polyadenylation of pre-mRNA 3'-ends; 4) initiate transport of mRNA to the cytoplasm; and
5) contribute to DNA damage repair (Corden et al., 2013).
Cracking the CTD Code. The mystique of the CTD has prevailed for more than three
decades, largely because no consensus has been reached on the CTD's structure or the unique
roles of its numerous post-translational modifications. In fact, the potential complexity of the
CTD code has increased exponentially since its discovery, as newly significant posttranslational

7
modifications continue to emerge. Models of the CTD code rely on the assumption that the
CTD's pattern of posttranslational modifications coordinates specific steps of the transcription
cycle (Jasnovidova et al., 2013). Phosphorylation of residues Tyr1, Ser2, Thr4, Ser5, and Ser7
within each of 52 imperfect Y1S2P3T4S5P6S7 heptad repeats is the most widely studied
modification. Briefly, researchers believe that unphosphorylated CTD interacts with Mediator
and recruits RNA polymerase II to the pre-initiation complex (PIC); phosphorylation of Ser5
then helps release CTD from the PIC as well as recruit 5'-end capping enzymes. Next, RNA
polymerase II enters the elongation phase of transcription, and pSer5 levels decrease while
pSer2, pThr4, and pTyr1 levels rise, facilitating recruitment of splicing factors and chromatin-
modifying enzymes. Lastly, pThr4 levels decrease near the 3'-end of the gene while pSer2 levels
peak, allowing the CTD to associate with cleavage and polyadenylation machinery. Following
termination of transcription, the CTD is rapidly dephosphorylated (Corden et al., 2013).
Besides phosphorylation of the CTD, many other post-translational modifications have
been observed. Glycosylation of Ser5 and Ser7 within each heptad may prevent aberrant
phosphorylation during formation of PICs (Ranuncolo et al., 2012). Methylation of the CTD's
single arginine residue by CARM1 inhibits expression of small nuclear RNAs (snRNAs) and
small nucleolar RNAs (snoRNAs) (Sims et al., 2011), and CTD with methylated lysine residues
is highly enriched at promoters of active genes (Dias et al., 2015). Since methylation and
glycosylation introduce steric blocks and preclude formation of hydrogen-bonds and salt bridges,
it is plausible that such modifications occlude high-specificity binders of the CTD during the
earliest stages of transcription. In this way, they may prevent induced folding of the CTD and
preserve its random coil structure, discussed in more detail below.

8
Solving the CTD's Structure. The structure of the CTD continues to stump researchers
because its Y1S2P3T4S5P6S7 consensus sequence introduces complications in the interpretation of
circular dichroism (CD) spectra and nuclear magnetic resonance (NMR) data. Furthermore, the
disorder and flexibility of the CTD precludes visualization by either X-ray crystallography or
cryo-electron microscopy. Hence, even though the cryo-electron microscopy structure of the
RNA polymerase II elongation complex was recently solved at 3.4 angstrom resolution, the CTD
was invisible within the structure (Bernecky et al., 2016). Theoretical studies have proposed a
compact yet flexible conformation based on energy minimization of a polyproline helix
(Matsushima et al., 1990), while early NMR studies have proposed a unique β-spiral
conformation based on nuclear Overhauser effects (NOEs) that suggest the CTD forms β-turns at
its two SPXX (SPTS, SPSY) motifs (Cagas et al., 1995). By generating CD spectra of the same
eight-consensus-repeat fragment that Cagas et al. studied with NMR spectroscopy, Bienkiewicz
et al. contested Cagas et al.'s proposed β-spiral conformation. Since the CD spectra of the
synthetic CTD peptide did not exhibit "classical" structural components, they used convex
constraint analysis (CCA) to conclude that at equilibrium, CTD monomers are primarily
unordered with a small fraction adopting a left-handed polyproline II helix (PPII) conformation.
Interestingly, the same unordered + PPII conformation dominated CD spectra of full-length
murine CTD. Bienkiewicz et al. argue that Cagas et al.'s use of NOEs biased their observation of
β-turns, because transient β-turn populations could lead to distinctive NOEs even if the peptide is
primarily disordered. Thus, they concluded that under physiological conditions, neither β-turns
nor PPII conformations were heavily populated in either CTD fragments or full-length CTD.
However, they caution that different regions of the CTD may adopt distinct conformations, a
phenomenon unobservable by low-resolution CD studies (Bienkiewicz et al., 2000).
9
Complexes of CTD and Binding Partners. Crystal structures of the CTD in complex
with binding partners show that interactions between the CTD and specific transcription factors,
phosphatases, and mRNA capping enzymes often couple CTD binding and CTD folding
(Jasnovidova et al., 2013). Because interactions requiring a transition from disorder to order are
generally of low affinity but high specificity, these domains' interactions with the CTD are most
likely transient. Consequently, the CTD has been compared to a fly casting apparatus that
localizes RNA polymerase II to transcription factories by increasing local concentrations of
interacting proteins. This theory may help explain why RNA polymerase I doesn't have a CTD,
since it is already trapped within the nucleolus (Corden et al., 2013).
Role of CTD in Transcription Initiation. The dominance of the CTD's folded state
among well-studied interactions does not imply it is more physiologically relevant than the
CTD's unfolded state. This dominance merely reflects the challenges inherent in studying
intrinsically disordered proteins. New reports show that a random coil conformation of the CTD
is avidly recruited by purportedly amyloid-like fibrils of both full-length FUS protein and FET
protein low complexity (LC) domains in vitro (Schwartz et al., 2013; Kwon et al., 2013). These
studies have hypothesized that higher order assemblies of FET LC domains recruit the CTD to
promoters, leading to formation of the pre-initiation complex. The pathological significance of
this interaction is discussed in more detail below. Because the structural disorder of the CTD
may facilitate interaction with other intrinsically disordered proteins during transcription
initiation, it is important to note that the CTD is predominantly unphosphorylated during
recruitment to promoters (Corden et al., 2013). Given that phosphorylation extends the CTD,
making it a more suitable platform for enzymes and other factors that bind with high-specificity
(Laybourn et al., 1989; Zhang et al., 1991), it is plausible that a compact, random coil

10
conformation heightens the CTD's affinity for transcription activation factors while
simultaneously occluding binding partners that induce a more structured conformation.
Role of FET Proteins in Cancer. The FET family of proteins consists of fused in
sarcoma (FUS), Ewing sarcoma breakpoint region 1 (EWS), and TATA Box Binding Protein
(TBP)-Associated Factor 15 (TAF15). FUS, EWS, and TAF15 are abundant heterogeneous
nuclear ribonucleoprotein particle (hnRNP) proteins that bind both RNA and DNA and affect
multiple steps of RNA biogenesis (Schwartz et al., 2015). FET proteins share a similar domain
structure (Figure 1A), which includes a low complexity (LC), putatively disordered SYQG-rich
N-terminal domain known to promote FET protein self-assembly as well as a folded RNA
Recognition Motif (RRM) and zinc-finger domain believed to mediate RNA binding.
1Figure 1. Translocations of FET protein low complexity (LC) domains on DNA-binding domains cause cancer. (A) FET family proteins (FUS, EWS, TAF15) share a similar domain structure. Their low-complexity (LC) SYGQ-rich N-terminal domains are putatively disordered and seed FET self-assembly. Their RNA recognition motifs (RRMs) and zinc fingers (ZnF) are folded and bind RNA. (B) Translocations of FET LC domains onto DNA-binding domains of transcription factors are linked to numerous types of cancer. Yellow triangles mark examples of breakpoints in sarcoma and leukemia.
1 Figure 1 was adapted from a presentation given by N.L. Fawzi. at Columbia University in January of 2016.
NLSG-rich/RGG1 RRM656
Low Comp SYGQ-rich 1
RGG2 ZnF RGG3 NLSG-rich/RGG1 RRM592
Low Comp SYGQ-rich 1 163 267 285 371 422 453 501
FUS/TLS
Fusion partnersDDIT3/CHOP Myxoid/Round cell liposarcomaCREB3L1,2 Low grade fibromyxoid sarcomaERG Acute myeloid leukemiaZNF384 Acute lyphoblastic leukemiaFLI1ETV1 Ewing’s sarcomaETV4FEV Angiomatoid malignant fibrous histocytomaATF1 Clear cell sarcomaWT1 Desmoplastic small round cell tumorPATZ1 NR4A3 Extraskeletal myxoid chondrosarcoma
Low Comp SYGQ-rich 1
RGG2 ZnF RGG3EWS
TAF15
RGG2 ZnF RGG3 NLSG-rich/RGG1 RRM526
RRM
Breakpoints in sarcoma and leukemia BA
11
Previous studies have shown that polymerization of FET LC domains into amyloid-like
fibrils correlates with not only recruitment of the CTD but also transcription activation. Given
that fusions of FET LC domains to transcription factor DNA-binding domains are known
oncoproteins, it is plausible that interaction between FET assemblies and the CTD directly leads
to aberrant transcription of growth factor and cell survival genes implicated in various cancers
(Kwon et al., 2013). Interestingly, Kwon et al. observed that FET LC assemblies more readily
bind the CTD's degenerate repeat half than its tandem consensus repeat half, further supporting a
unique role for the CTD's degenerate repeats in transcription activation. Surprisingly, they found
that TAF15 LC assemblies bind the CTD with greater affinity than FUS LC assemblies (Kwon et
al., 2013). They hypothesized that charge attraction between aspartic acids in the TAF15 LC
domain (absent from FUS LC) and lysines in degenerate CTD repeats mediates the heightened
affinity (Kwon et al., 2013). However, the heightened affinity may also be explained by lesser
polymerization of FUS LC assemblies compared to TAF15 LC assemblies. Other studies of full-
length FUS protein report that its RNA-binding domain is critical for polymerization (Schwartz
et al., 2013). Schwartz et al. found that fibrillar FUS assemblies, seeded by RNA, readily recruit
the CTD in vitro. Since RNA does not seed FUS LC assembly (Burke et al., 2015), it is plausible
that different interactions mediate polymerization of FUS LC and native FUS. Moreover, FUS
may require both its LC and RNA-binding domains to form higher order assemblies comparable
to that of TAF15 LC.
The prevalence of oncogenic FET LC fusions (Figure 1B) suggests that FET LC
domains are particularly potent transcriptional activation domains. The combined work of the
Cech and McKnight labs indicates that polymerization of FET LC domains may explain their
noteworthy transcriptional activation capabilities. Even so, structural details of the complex

12
formed between self-assembled FET LC fibrils and the CTD are largely unknown. Thus, our
characterization of the structure and dynamics of the degenerate half of RNA polymerase II CTD
in complex with TAF15 LC fibrils seeks to answer two questions posed by Kwon et al.: 1) Why
do TAF15 LC fibrils bind the CTD with greater affinity than FUS LC fibrils?; and 2) Why do
TAF15 LC fibrils bind degenerate CTD repeats more avidly than consensus repeats?
MATERIALS AND METHODS
Bacterial Plasmids. My primary DNA construct, CTD27-52, is a codon-optimized form
of the degenerate repeat half of the CTD of DNA-directed RNA polymerase II subunit RPB1
(residues 1773-1970) incorporating a TEV cleavable N-terminal leader sequence and
hexahistidine tag (Peti and Page, 2007) and synthesized by DNA2.0. All other CTD DNA
constructs were generated from CTD27-52 by either PCR site-directed mutagenesis or restriction
enzyme subcloning. For instance, mutant CTD26 T66A refers to CTD27-52 with an alanine
substituted for a threonine at position 66 in CTD27-52 (which matches to residue 1835 of DNA-
directed RNA polymerase II subunit RPB1). Table 1 of Appendix A contains my full library of
CTD constructs. mCherry-TAF15 LC and mCherry-FUS LC constructs were provided by the
McKnight lab.
Protein Expression. RNA polymerase II CTD/MBP-FUS full-length: Expression
plasmids were transformed into BL21 Star (DE3) cells (Life Technologies) and grown overnight
in starter cultures. Uniformly 15N-labeled protein (or 15N/13C-labeled or unlabeled protein) was
expressed in either M9 media with 15N ammonium chloride and 13C glucose as the sole nitrogen
and carbon sources, respectively, or LB. One liter cultures were inoculated with 50 mL starter
cultures and grown at 37 °C, 200 rpm to an OD600 between 0.6-0.8. Cultures were then induced
13
with 0.5 mM IPTG and harvested after growing 4 hours at 37°C, 200 rpm. Bacteria were pelleted
and stored at -80 °C until purification.
mCherry-FUS/TAF15 LC: Expression plasmids were transformed into BL21 Star (DE3)
cells (Life Technologies) and grown overnight in starter cultures. One liter LB cultures were
inoculated with 50 mL starter cultures and grown at 37 °C, 200 rpm to an OD600 between 0.6-
0.8. Cultures were then induced with 0.5 mM IPTG and harvested after growing overnight at
16°C, 200 rpm. Bacteria were pelleted and stored at -80 °C until purification.
Protein Purification. RNA polymerase II CTD: Cell pellets were resuspended in 30 mL
of pH 7.4 20 mM sodium phosphate, 300 mM sodium chloride, 10 mM imidazole and lysed in an
Emulsiflex C3. Cell lysate was cleared by centrifugation (20,000 rpm for 1 hour at 4 °C). Protein
remained soluble in the supernatant following centrifugation. The supernatant was then filtered
with a 0.22 µm syringe filter and loaded onto a 5 mL HisTrap HP column. Protein was eluted
with a gradient of 10 to 300 mM imidazole in pH 7.4 20 mM sodium phosphate. Fractions
containing protein (as determined by protein gel) were pooled and dialyzed overnight at room
temperature into pH 7.4 20 mM sodium phosphate 10 mM imidazole. TEV protease was added
to samples (at a ratio of roughly 2 mL of .3 mg/mL TEV protease per 30 mL of ~40 µM protein
sample) at the start of dialysis in order to cleave the protein's hexahistidine tag. The storage
buffer of TEV protease was pH 7.5 50 mM Tris-HCl, 1 mM EDTA, 5 mM DTT, 50% glycerol,
and 0.1% Triton-X-100. Following dialysis and TEV cleavage, samples were again filtered with
a 0.2 µM syringe filter and loaded onto a 5 mL HisTrap HP column. Cleaved protein was
retrieved from the flow-through. Purity was confirmed to be >99% by protein gel, ratio of
absorbance at 280 nm to 260 nm, and two-dimensional NMR. Protein was then concentrated to
between .5 to 1 mM using centrifugal filtration with a 10 kDa cutoff (Amicon, Millipore) and

14
buffer exchanged at 4 °C into pH 7 20 mM Tris-HCl, 200 mM sodium chloride, 20 mM BME,
0.5 mM EDTA. Samples were then flash frozen and stored at -80 °C.
mCherry-FUS/TAF15 LC (Protocol adapted from Kwon et al., 2013): Cell pellets were
resuspended in 30 mL of pH 7.5 20 mM Tris-HCl, 500 mM sodium chloride, 10 mM imidazole,
5 mM DTT and lysed in an Emulsiflex C3. Cell lysate was cleared by centrifugation (20,000 rpm
for 1 hour at 4 °C). Protein remained soluble in the supernatant following centrifugation. The
supernatant was then filtered with a 0.22 µm syringe filter and loaded onto a 5 mL HisTrap HP
column. Protein was eluted with a gradient of 10 to 500 mM imidazole in pH 7.5 20 mM Tris-
HCl. Fractions containing protein (as determined by protein gel) were pooled and dialyzed
overnight at room temperature into pH 7.5 20 mM Tris-HCl, 200 mM sodium chloride, 0.5 mM
EDTA, and 20 mM BME.
MBP-FUS full-length: For use in turbidity experiments, MBP-FUS cell pellets were re-
suspended in 20 mM sodium phosphate, 10 mM imidazole, and 300 mM sodium chloride pH 7.4
buffer and lysed in an Emulsiflex C3 and the cell lysate was cleared by centrifugation (20,000 g
for 60 minutes). The lysate was then loaded onto a HisTrap HP 5 ml column and protein was
eluted with a gradient of 10 to 300 mM imidazole. Fractions containing the most pure MBP-FUS
as determined by protein gel were pooled and loaded onto a HiLoad™ 26/600 Superdex™ 200
prep grade size exclusion chromatography column and washed with 20 mM sodium phosphate
300 mM sodium chloride pH 7.4 buffer. Fractions containing solely MBP-FUS were again
determined by protein gel and then concentrated to roughly 10 mg/mL using centrifugal filtration
with a 10 kDa cutoff (Amicon®, Millipore®) and stored at 4 °C. Purity was confirmed to be
>99% by protein gel and ratio of absorbance at 280 nm to 260 nm.

15
Hydrogel Formation. (Protocol adapted from Kwon et al., 2013). Following dialysis,
mCherry-FET LC protein was concentrated to roughly 65 mg/mL at room temperature using
centrifugal filtration with a 10 kDa cutoff (Amicon, Millipore). 100 µL aliquots were incubated
at 4 °C for 2 days.
Transmission Electron Microscopy. Aliquots for microscopy studies were taken from
100 µL aliquots of ~65 mg/mL mCherry-TAF15 LC hydrogels that were first diluted with 100
µL of pH 7 20 mM Tris-HCl, 200 mM sodium chloride, 20 mM BME, 0.5 mM EDTA. Aliquots
were taken before and after sonication. 4 µL of solution was spotted onto ultrathin carbon film on
holey carbon support grids (product code 01824, Ted Pella, Reading, CA), washed three times
with deionized water, stained with 5 µL of 3% uranyl acetate (Electron Microscopy Sciences,
Hatfield, PA) for approximately 1 minute, blotted, and air-dried. Sample grids were imaged with
a Philips 410 transmission electron microscope (Protocol adapted from Conicella et al., 2014).
Preparation of NMR Samples. CTD27-52: For the purposes of HSQC spectra
comparison, uniformly 15N-labeled CTD samples were diluted to 50 µM in pH 7 20 mM Tris-
HCl, 200 mM sodium chloride, 20 mM BME, 0.5 mM EDTA and a 90% H2O/10% D2O mixture
and kept at 4 °C. For use in assignment experiments, uniformly 13C/15N-labeled CTD27-52
samples were diluted to either 523 µM (for CBCA(CO)NH, HNCACB, HNCO, HN(CA)CO, and
HNCA experiments) or 700 µM (for the HNN experiment) in the same buffer and temperature
conditions listed above. For measurement of backbone motions of CTD27-52, 15N-labeled
CTD27-52 samples were diluted to 250 µM in pH 7 20 mM Tris-HCl, 200 mM sodium chloride,
20 mM BME, 0.5 mM EDTA and a 90% H2O/10% D2O mixture and kept at 4 °C. Extinction
efficients calculated by ProtParam (Wilkins et al., 1999) were used to estimate sample
concentrations.

16
CTD27-52+mCherry-TAF15 LC fibrils: For binding experiments, 100 µL aliquots of ~65
mg/mL mCherry-TAF15 LC hydrogels were first diluted with 100 µL of pH 7 20 mM Tris-HCl,
200 mM sodium chloride, 20 mM BME, 0.5 mM EDTA. I then sonicated the diluted hydrogel
sample for 5 10-second cycles at 12% power, with 50-second breaks in between. NMR samples
consisted of 250 µM CTD27-52+8mg/mL of sonicated mCherry-TAF15 LC fibril diluted in pH
7 20 mM Tris-HCl, 200 mM sodium chloride, 20 mM BME, 0.5 mM EDTA and a 90%
H2O/10% D2O mixture and kept at 4 °C.
Solution NMR Experiments. All NMR experiments were recorded at 4 °C using a
Bruker Avance III HD NMR spectrometer operating at either 850 or 500 MHz 1H frequency
equipped with a Bruker TCI z-axis gradient cryogenic probe. Experimental sweep widths and
acquisition times (i.e. resolution) and the number of transients were optimized for the necessary
resolution, experiment time, and signal-to-noise for each experiment type but kept constant for
the same experiment conducted with different peptide samples (i.e., CTD27-52, CTD27-43,
CTD38-52, CTD26 A66T, etc.) (Protocol adapted from Burke et al., 2015).
Triple resonance assignment experiments (CBCA(CO)NH, HNCACB, HNCO,
HN(CA)CO, a high resolution HNCA, and HNN) were performed on samples of uniformly
13C/15N-labeled CTD27-52. Sweep widths were 10 ppm in 1H, 20 ppm in 15N, 6.5 ppm in 13C', 56
ppm in 13C for Cα/Cβ experiments and 22 ppm for the HNCA. Experiments comprised 2048*,
42-50*, 60*, 128*, and 25* complex data pairs in the direct 1H, indirect 15N, indirect 13Cα/Cβ,
indirect 13Cα, and indirect 13CO dimensions, respectively, and were processed with NMRPipe
using default linear prediction parameters for either constant time or real time indirect
dimensions and assigned in CARA (Keller, 2005). For the purposes of HSQC spectra
comparison among 50 µM CTD samples, data were apodized with a cosine squared bell function
17
in the 1H dimension and a cosine bell function in the 15N dimensions. For the purposes of peak-
picking in CARA, an HSQC of 523 µM CTD27-52 was measured at 850 MHz 1H frequency
with 4096 direct 1H points and 512 indirect 15N points and sweep widths of 13 ppm and 20 ppm,
centered at 4.9 ppm and 116.8 ppm, respectively. This high resolution HSQC was processed by
first apodizing data with 5 Hz exponential line broadening for the 1H and 15N dimensions before
applying the same cosine bell function in both the 1H and 15N dimensions (Protocol adapted from
Burke et al., 2015).
Motions of the backbone of CTD27-52 were probed using 15N R1, temperature-
compensated 15N R2, and heteronuclear NOE experiments using standard pulse sequences
(hsqct1etf3gpsi3d, hsqct2etf3gpsitc3d, hsqcnoef3gpsi, respectively, from Topspin 3.2, Bruker).
Each interleaved experiment comprised 128*×2048* complex data pairs in the indirect 15N and
direct 1H dimensions, respectively, with sweep widths of 15 ppm and 10.5 ppm, centered at
118.783 ppm and 4.973 ppm. 15N R2 experiments had a Carr-Purcell-Meiboom-Gill (CPMG)
field of 556 Hz and an interscan delay of 2.5 s. The seven interleaved CPMG R2 relaxation times
(i.e., loop lengths) were 16.3 ms, 260.8 ms, 179.3 ms, 32.6 ms, 114.1 ms, 81.5 ms, and 163 ms at
850 MHz and 16.3 ms, 260.8, 32.6, 130.4, 97.8, 179.3, and 65.2 ms at 500 MHz. Data were
processed with NMRPipe (Delaglio et al., 1995) and apodized with a cosine squared bell
function in the 1H dimension and a cosine bell function in the 15N dimension. Best-fit R2
relaxation rates were calculated using least squares optimization of 1H/15N peak intensities to a
single exponential function (Protocol adapted from Burke et al., 2015).
Turbidity Assays. To assess the effect of increasing protein concentration on the
turbidity of FUS, MBP-FUS protein was diluted into 20 mM Tris-HCl 150 mM sodium chloride
pH 7.4 buffer and 2.5 µL of TEV protease (0.3 mg/mL, final concentration in sample is 0.015

18
mg/mL) or its storage buffer (50 mM Tris pH 7.5, 1 mM EDTA, 5 mM DTT, 50% glycerol,
0.1% Triton-X-100) was added for a final volume of 50 µL in 96 well clear plates (Costar®). To
assess the effect of RNA on FUS turbidity, yeast RNA was first desalted into 20 mM Tris-HCl
150 mM sodium chloride pH 7.4 buffer using Thermo Scientific™ Zeba™ Spin Desalting
Columns. Desalted RNA (0.25 mg/mL) was then added to 0.5 mg/mL MBP-FUS in the prep
described above. To assess the effect of salt on FUS turbidity, MBP-FUS protein was diluted
into 20 mM Tris-HCl pH 7.4 buffer with various sodium chloride concentrations. Upon the
addition of TEV protease or its storage buffer, turbidity measurements were recorded every five
minutes using a SpectraMax® M5 Microplate Reader for a total of 6 readings in a 30 minute
period. Experiments were conducted in triplicate and then averaged (Protocol adapted from
Burke et al., 2015).
RESULTS
1H, 15N Backbone Resonance Assignments of RNA Polymerase II CTD27-52. The
carboxy-terminal domain (CTD) of the largest subunit of human RNA polymerase II is
composed of 52 tandem heptad repeats modeled after the consensus sequence Y1S2P3T4S5P6S7.
Unlike heptad repeats proximal to the catalytic core of RNA polymerase II, heptad repeats in the
distal half of the CTD deviate significantly from the consensus sequence, with the majority of
heptads containing at least one residue substitution. While the yeast CTD contains only 26
heptad repeats with few degeneracies, mammalian degeneracies have been conserved throughout
175 million years of evolution (Corden et al., 2013) and increase the CTD's potential for
posttranslational modifications. While inconclusive, previous structural studies suggest that the
CTD exists in equilibrium between a dominant unordered conformation and less populous β-turn

19
and PPII helix conformations (Matsushima et al., 1990; Cagas et al., 1990; Bienkiewicz et al.,
2000). However, these studies have relied on synthetic peptides composed of solely consensus
repeats to model the structure of the full CTD. Therefore, the effect of degeneracies on the
structure of the CTD has not been studied with high resolution.
We analyzed the intact degenerate repeat half of the CTD (CTD27-52) using solution
NMR spectroscopy in order to measure secondary structure population on a residue-by-residue
level. Since NMR chemical shifts are sensitive reporters of the overall structure of a protein, we
first assigned the backbone amide resonances of the HSQC to residues of CTD27-52. CTD27-
52's highly repetitive and proline-rich sequence (Figure 2A) made these assignments particularly
challenging. Since proline residues lack an amide proton, they are not visible in an HSQC
spectrum and prevent resonance transfer in traditional triple resonance experiments, thus
impeding sequential assignments. We briefly pursued using carbon detect experiments to assign
CTD27-52, but due to significant overlap of peaks in the 13C, 15N CON spectrum (as well as the
prohibitive expense of carbon labeling multiple samples), this route was abandoned. We also ran
(H)N(COCO)NH experiments (Yoshimura et al., 2015) in an attempt to obtain i+2 nitrogen
shifts by using CO mixing to transfer resonance through proline residues (COi <->
COi+1(proline) <-> COi+2), but unfortunately the concentration of our sample did not provide
adequate signal-to-noise. Since CTD27-52 aggregates at concentrations above 1 mM, we
abandoned this route as well.
Ultimately, we used standard 1HN detected triple resonance experiments (HNCO,
HN(CA)CO, CBCA(CO)NH, HNCACB, a high resolution HNCA, and HNN) in combination
with HSQCs of 19 CTD variants to assign all non-overlapped backbone resonances of CTD27-
52 (Figure 2B). See the appendix for a catalog of CTD variants (Table S1). Sixteen CTD27-52
20
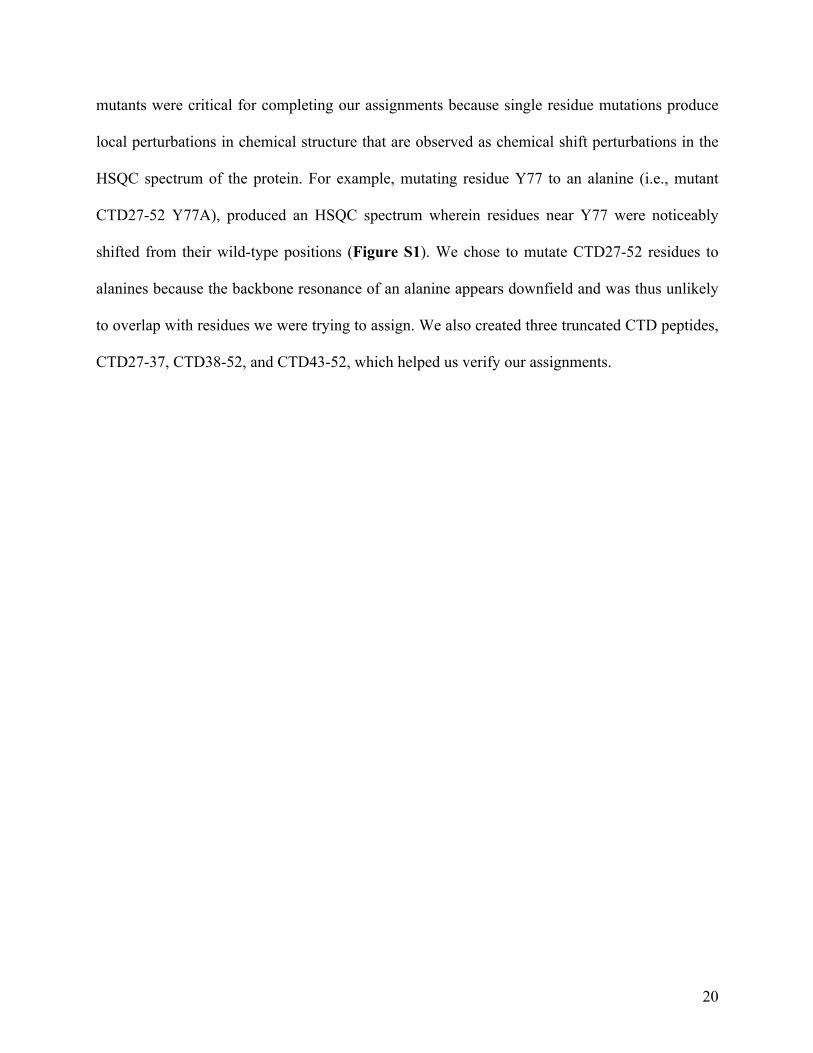
mutants were critical for completing our assignments because single residue mutations produce
local perturbations in chemical structure that are observed as chemical shift perturbations in the
HSQC spectrum of the protein. For example, mutating residue Y77 to an alanine (i.e., mutant
CTD27-52 Y77A), produced an HSQC spectrum wherein residues near Y77 were noticeably
shifted from their wild-type positions (Figure S1). We chose to mutate CTD27-52 residues to
alanines because the backbone resonance of an alanine appears downfield and was thus unlikely
to overlap with residues we were trying to assign. We also created three truncated CTD peptides,
CTD27-37, CTD38-52, and CTD43-52, which helped us verify our assignments.

21
Figure 2. The NMR spectrum (1H-15N heteronuclear single quantum coherence, HSQC) of CTD27-52 is remarkably well-resolved given its highly repetitive, proline-rich sequence. (A) Sequence of human RNA polymerase II CTD heptads 27-52. Degeneracies from the consensus YSPTSPS repeat are shown in red and truncated CTD peptides are labeled on the right. Note that residues 1-3 are left over after TEV cleavage of the protein's hexahistidine tag (i.e., res. 1-3 are not part of the native sequence). (B) HSQC overlay of CTD27-52 (black), CTD27-37 (blue), and CTD38-52 (red). Assignments of all non-overlapped backbone resonances are shown in black. Assignments in overlapped regions are omitted for clarity.
N201Y133
E200D198
S197
A191
T188
L187
S186
Y185
S179
G177
Y171
T170
G168
K167T134
T184
S169
T71
S67
A66
T50
Y49
T48
S46
Q45
Y14
N13N6
Y7
T8
T174
T10T181
T122
T73 S38S59,S80
S52
S53S81S39S60
S11S74 S123
E83 D195R41
S193
K118Y119 Y70Y42 Y84
T43T85 Y178
Y147Y126,Y161
E199I192D196 K69
T17
CTD27-37: res. 1-83
CTD38-52: res. 84-201
CTD27-52: res. 1-201
S4
T150T157
T129
S34S55
1 GHMSPN
7 YTPTSPN
14 YSPTSPS
21 YSPTSPS
28 YSPTSPS
35 YSPSSPR
42 YTPQSPT
49 YTPSSPS
56 YSPSSPS
63 YSPASPK
70 YTPTSPS
77 YSPSSPE
84 YTPTSPK
91 YSPTSPK
98 YSPTSPK
105 YSPTSPT
112 YSPTTPK
119 YSPTSPT
126 YSPTSPV
133 YTPTSPK
140 YSPTSPT
147 YSPTSPK
154 YSPTSPT
161 YSPTSPKGST
171 YSPTSPG
178 YSPTSPT
185 YSLTSPA
192 ISPDDSDEEN
CT
D27-3
7C
TD
38-5
2
CT
D43-5
2
Human RNA polymerase II
CTD heptads 27-52
27
28
29
30
31
32
33
43
35
36
37
38
39
40
41
42
43
44
45
46
47
48
49
50
51
52
RES.HEPTAD
BA

22
RNA Polymerase II CTD27-52 is structurally disordered. The narrow chemical shift
dispersion (centered around ~8.3 ppm) observed in the HSQC of CTD27-37 is indicative of a
disordered protein. Additionally, measurements of protein backbone motions provide further
evidence for the uniform disorder of CTD27-52. NMR relaxation experiments (15N R2, 15N R1)
and heteronuclear nuclear Overhauser (hetNOE) effects are sensitive to motions on the
picosecond to nanosecond timescale, and irregularities in these measurements within a protein
reflect slower rotational diffusion of structured regions. Since 15N R2, 15N R1, and hetNOE values
are uniform across CTD27-52 (Figure 3A), it is most likely uniformly disordered.
Interestingly, CTD27-52's 15N R2 values are field-dependent - relaxation of backbone
resonances is uniformly higher at a field strength of 850 MHz compared to 500 MHz (Figure
3B). Even so, since 15N R2 measurements at 850 MHz and 500 MHz are highly correlated with
no obvious outliers, this data further suggests that CTD27-52 does not sample significant
populations of structured conformation on the microsecond to millisecond timescale.

23
Figure 3. RNA Polymerase II CTD27-52 is structurally disordered. (A) 15N R2, 15N R1, and hetNOE values (top, middle, and bottom panels, respectively) for dispersed CTD27-37 protein are consistent with disorder across the entire domain. (B) Transverse relaxation of CTD27-52 (15N R2) is field dependent: 15N R2 measurements at 850 MHz are uniformly higher than 15N R2 measurements at 500 MHz. (C) Correlation of 15N R2 at 850 MHz versus 15N R2 at 500 MHz. The absence of outliers further suggests CTD27-52 is entirely disordered.
0
2
4
6
8
10
0 2 4 6 8 10
02468
10
R2 (s
-1)
0
1
2
R1 (s
-1)
0 20 40 60 80 100 120 140 160 180 200residue number
0
1
NOE
60 80 100 120 140 160 180 200residue number
0
2
4
6
8
10
20 400
R2 (s
-1)
850 MHz
500 MHz
R2 (s
-1) @
850
MHz
@ 500 MHzR2 (s-1)
A B
C
24
Sonicated mCherry-TAF15 LC hydrogel fibrils bind RNA polymerase II CTD27-52
in a residue-specific manner. The McKnight lab was the first to develop a protocol for 4°C
polymerization of mCherry-tagged FET LC domains into hydrogels of purportedly amyloid-like
fibrils (Han et al., 2012; Kato et al., 2012). While using fluorescence microscopy to monitor FET
LC hydrogel trapping of the CTD, they discovered that polymerization of FET LC domains
correlates with recruitment of the CTD (Kwon et al., 2013).
In light of these exciting findings, the Fawzi lab obtained the McKnight lab's mCherry-
tagged FET LC constructs. Using NMR spectroscopy, we sought out to test whether mCherry-
TAF15 LC fibrils recruit CTD27-52 in a residue-specific manner. Incubating high concentrations
(roughly 65 mg/ml) of mCherry-TAF15 LC monomer at 4°C for approximately 48 hours
produced a hydrogel as expected (Figure 4A). We then sonicated the mCherry-tagged TAF15
LC hydrogel in order to make NMR samples of CTD27-52+8mg/mL of polymerized mCherry-
TAF15 LC. We carefully recorded the concentration of mCherry-TAF15 LC at the start of
incubation (i.e., before hydrogel formation) and thus estimated the final concentration of
mCherry-TAF15 LC in our NMR samples based on the volume of sonicated hydrogel added.
Using transmission electron microscopy, we verified that mCherry-TAF15 LC fibrils were not
destroyed by sonication (Figure 4B).

25
Figure 4. mCherry-TAF15 LC forms a hydrogel of polymeric fibers that are not destroyed by sonication. (A) 48-hour incubation at 4°C causes mCherry-TAF15 LC monomer to form a hydrogel, recapitulating McKnight lab results. (B) mCherry-TAF15 LC hydrogel fibrils are not destroyed by sonication. Hydrogel samples pre- and post-sonication are visualized by transmission electron microscopy. Polymeric fibers are roughly 500 nM in length before sonication. Adding sonicated mCherry-TAF15 LC fibrils to CTD27-52 did not produce any chemical
shift differences in the HSQC spectrum of CTD27-52. However, we observed large differences
in the R2 of CTD27-52 resonances in the presence and absence of sonicated mCherry-TAF15 LC
fibrils. We then measured the difference in transverse relaxation rate (ΔR2) of CTD27-52 in the
presence and absence of mCherry-TAF15 LC fibrils in order to characterize the fibril-bound
state of CTD27-52. When a monomeric species (i.e., CTD27-52) is bound to a much larger
species (i.e., mCherry-TAF15 LC fibrils), R2 is exceptionally fast, relaxing (i.e.
decaying/destroying) transverse magnetization much faster in the bound state than in the
unbound state. Hence, lifetime line broadening, the decay in transverse magnetization due to
mCherry-TAF15 LC
hydrogel
BEFORE SONICATION AFTER SONICATION
500 nm 500 nmcarbon support grid
A
B

26
visiting the bound state, gives rise to a measurable increase in R2, ΔR2. If R2 in the bound state
were infinitely fast, the value of ΔR2 would be equal to the first order “apparent” kinetic on-rate,
konapp. Therefore ΔR2 can be interpreted as a lower bound for the first order on-rate for a
monomeric species binding a much larger, NMR invisible 'dark' state such as a hydrogel fibril. In
this way, measurements of 15N ΔR2 reflect the rate at which a monomer reversibly binds a much
larger species (Fawzi et al., 2011; Fawzi et al., 2012; Fawzi et al., 2014).
We report that ΔR2 values are maximal for heptads 27-33 of CTD27-52. Our data suggest
that the N-terminal half of CTD27-52 more frequently mediates CTD binding of TAF15 fibrils
than the C-terminal half of CTD27-52. Backbone amide resonances for residues Asn6, Tyr7,
Thr8, Asn13, Tyr14, Arg41, Tyr42, Thr43, and Gln45 in CTD27-52 consistently have the largest
ΔR2 values. Furthermore, the first 6-7 heptads of CTD27-52 show heightened ΔR2 values relative
to the rest of CTD27-52 independent of magnetic field strength (Figure 5A). Because these ΔR2
measurements reflect the rate at which CTD27-52 residues reversibly bind to mCherry-TAF15
LC hydrogel fibers, they suggest that residues near the N-terminus of CTD27-52 more readily
interact with mCherry-TAF15 LC fibrils.

27
While we do observe a magnetic field dependence in ΔR2 of CTD27-52, the dependency
is linear with no significant deviations (Figure 5B), so there is no evidence of any intermediate
chemical exchange (i.e., interaction of
residues) within the CTD27-52
monomer itself. The field dependence
of ΔR2 allows us to draw a few
additional conclusions about the
dynamics of CTD27-52 in complex
with mCherry-TAF15 LC fibrils -
namely, the lower values of ΔR2 at
lower magnetic field tell us that R2 of
CTD27-52 in its bound state must be
on the order of the dissociation rate
(koff) of the complex. The rationale for
this conclusion is R2 typically has a
linear field dependence for large
molecules. R2 of CTD27-52 in its
bound state is on the order of or slower
than koff, because if R2 were
significantly faster, there would be
complete lifetime line broadening at
both fields. Field dependence of ΔR2
indicates that, at least at the lower
Figure 5. CTD heptads 27-33 (residues 1- 50 of CTD27-52) mediate recruitment by mCherry-TAF15 LC fibrils. (A)
15N ΔR
2 reflects the rate at which CTD27-37 residues
reversibly bind mCherry-TAF15 LC fibrils. Independent of magnetic field strength, the first 6-7 heptads of CTD27-52 show heightened ΔR
2 values relative to the rest of
CTD27-52. (B) Linear field dependency of 15
N ΔR2.
0 20 40 60 80 100120140160180200
0
10
20
850 MHz
500 MHz
15N
R
2 (
s-1
)
residue number
0 5 10 15 200
5
10
15
20
15N
R
2 (
s-1
) @
850 M
Hz
15N R2 (s-1) @ 500 MHz
A
B

28
magnetic field, the R2 rate is not much faster than koff. Also, since we know that maximal ΔR2
values provide a lower bound for the association rate (kon) of CTD27-52 in complex with
mCherry-TAF15 LC fibrils, we can conclude that CTD27-52 monomers visit the NMR-invisible
mCherry-TAF15 LC fibril state with an on-rate of more than 11 s-1.
For our first set of NMR experiments, we calculated ΔR2 by subtracting R2 values of
CTD27-52 in buffer alone from R2 values of CTD27-52 in the presence of sonicated mCherry-
TAF15 LC fibrils. As a result, this set of experiments failed to test whether monomeric mCherry-
TAF15 LC or other contaminants within our sonicated mCherry-TAF15 LC hydrogel samples
caused our observed residue-specific differences in ΔR2 of CTD27-52. In order to account for
this possibility, we devised a new set of experiments. By centrifuging a freshly sonicated
mCherry-TAF15 LC hydrogel sample, we were able to pellet all polymerized fibrils (Figure
6A). We then carefully removed the supernatant. The clear color of the pelleted sample's
supernatant suggests that our sonicated samples contain negligible amounts of free mCherry-
tagged monomer. Thus, almost all mCherry-TAF15 LC must partition into the hydrogel species.
We then compared the R2 values of CTD27-52+supernatant to R2 values of CTD27-52+sonicated
mCherry-TAF15 LC fibrils (Figure 6B). Since our ΔR2 calculations from this set of experiments
are almost identical to that of our first set of experiments, it is clear that polymeric fibrils of
mCherry-TAF15 LC are responsible for the residue-specific differences in ΔR2 of CTD27-52.

29
Figure 6. mCherry-TAF15 LC fibrils (rather than monomeric mCherry-TAF15 LC or contaminants) are responsible for residue-specific recruitment of CTD27-52 (A) Centrifugation (60 min, 20,800xg, 4°C) of a freshly sonicated mCherry-TAF15 LC hydrogel sample pellets all polymerized fibrils. Supernatant is entirely clear (i.e., free of mCherry-TAF15 LC monomer). (B) Comparison of different sets of solution NMR data verifies reproducibility of data. R2 of CTD27-52+supernatant of mCherry-TAF15 LC fibrils is indistinguishable from R2 of CTD27-52+buffer control. Soluble contaminants and/or monomeric mCherry-TAF15 LC are not responsible for residue-specific increases in 15N ΔR2 of CTD27-52. Separately, the heightened ΔR2 of backbone amide resonances corresponding to residues
Asn6, Asn13, and Gln45 led us to wonder whether asparagine and glutamine side chains help
mediate recruitment of CTD27-52 by mCherry-TAF15 LC fibrils. Since amide resonances
derived from the side chains of asparagine and glutamine residues are visible in the HSQC
spectrum, we quantified their 1H/15N chemical shift propensities (CSPs) in the presence of
mCherry-TAF15 LC fibrils (Figure 7). CSPs of CTD27-52 amide backbone resonances are
approximately zero throughout the protein, and the amide resonances of asparagine and
0 60 80 100 120 140 160 180 200residue number
0
10
20
20 40 0 60 80 100 120 140 160 180 200residue number
20 40
CTD27-52 + sonicated TAF15 LC hydrogel (Sample Set 1)CTD27-52 + sonicated TAF15 LC hydrogel (Sample Set 2)CTD27-52 + TAF15 LC hydrogel supernatant (Sample Set 2)CTD27-52 + TAF15 LC hydrogel buffer (Sample Set 1)
0
10
20CTD27-52 + sonicated TAF15 LC hydrogel Sample Set 1 Sample Set 2
B
A
After centrifugation (60 min, 20,800xg, 4C)
Before centrifugation
(s-1
15N
R
2)
(s-1
15N
R
2)

30
glutamine side chains exhibit this same trend. We also quantified the intensity ratios of Asn6,
Asn13, and Gln45 side chain resonances in the presence and absence of mCherry-TAF15 LC
fibrils. The low intensity ratios of Asn6, Asn13, and Gln45 side chain resonances are
approximately equivalent to the low intensity ratios of their corresponding backbone resonances.
New studies must be devised to more rigorously test whether asparagine and glutamine side
chains are critical mediators of the interaction between CTD27-52 and mCherry-TAF15 LC
fibrils.
Figure 7. Quantification of chemical shift perturbations and loss of intensity in the HSQC of CTD27-52 in the presence of mCherry-TAF15 LC fibrils. (Left panels) 1H/15N chemical shift propensities (CSPs) of CTD27-52 in the presence of mCherry-TAF15 LC fibrils. CSPs of CTD27-52 amide backbone resonances are approximately zero throughout the protein, and the amide resonances of asparagine and glutamine side chains exhibit this same trend. Low intensity ratios of Asn6, Asn13, and Gln45 side chain resonances are approximately equivalent to the low intensity ratios of their corresponding backbone resonances. (Right panel) Overlay of HSQC spectra of CTD27-52 in the presence and absence of mCherry-TAF15 LC fibrils. Significant loss of intensity is observed for residues interacting with mCherry-TAF15 LC fibrils.
-0.1
0
0.1
1H
CS
P
-0.1
0
0.1
15N
CS
P
0 20 40 60 80 100 120 140 160 180 200
residue number
0
0.2
0.4
0.6
0.8
1
Inte
ns
ity
Ra
tio
Q/N Side chains
N201N6, N13, Q45 CTD27-52+TAF15 LC hydrogel

31
Given our above characterization of RNA polymerase II CTD27-52 in complex with
mCherry-TAF15 LC fibrils, we now return to the two questions posed by Kwon et al.: 1) Why
do TAF15 LC fibrils bind the CTD with greater affinity than FUS LC fibrils?; and 2) Why do
TAF15 LC fibrils bind degenerate CTD repeats more avidly than consensus repeats? At this
point, it is still unclear whether lesser polymerization of FUS LC can fully explain why TAF15
LC fibrils more avidly bind the CTD. Curiously, sonicated samples of mCherry-FUS LC
hydrogel produced no difference in transverse relaxation of CTD27-52 (our unpublished data).
Conversely, our ΔR2 measurements clearly show that CTD27-52 binds TAF15 LC fibrils in a
residue-specific manner. It is possible that these residue-specific interactions are unique to the
CTD27-52:TAF15 LC fibril complex. Nonetheless, it is also possible that FUS LC fibrils are
simply smaller and/or less stable than TAF15 LC fibrils. Our observations of mCherry-FUS LC
hydrogels hint that FUS LC hydrogels may be less stable than TAF15 LC hydrogels, because
despite having approximately equivalent concentrations at the start of 4°C incubation, FUS LC
hydrogels more readily solubilized, even before sonication.
Native FUS self-assembles to form a liquid phase-separated state. Our recently
published work on interactions mediating self-assembly of native FUS offers additional insight
into this dilemma. The Fawzi lab has extensively characterized interactions mediating phase
separation of FUS LC domain into liquid droplets. We report that much like mCherry-FUS
hydrogels, FUS LC droplets are stabilized by low temperatures and high salt (Burke et al., 2015).
Using turbidity assays, I tested the effect of protein concentration, salt and RNA on self-
assembly of native protein. I found that native protein self-assembles to form a liquid phase-
separated state at concentrations as low as 1 µM (Figure 8, top panel), whereas FUS LC requires
a concentration of at least 50 µM to phase separate under similar buffer and temperature

32
conditions. While increasing salt concentration aids phase separation of FUS LC, a 3-fold
increase in sodium chloride concentration had little effect on phase separation of native FUS
(Figure 8, bottom left panel). Additionally, low mass ratios of RNA:full-length FUS promote
self-assembly of the native protein (Figure 8, bottom right panel), whereas RNA does not affect
self-assembly of FUS LC domain (our unpublished data).
Figure 8. Interactions mediating self-assembly of native FUS are distinct from that of FUS LC (Top) FUS forms a liquid phase-separated state at concentrations as low as 1 µM after an N-terminal maltose binding protein (MBP) fusion is cleaved with TEV protease. (Bottom left) Low RNA:MBP-FUS ratios by mass enhance FUS droplet formation. (Bottom right): Changing ionic strength by increasing NaCl concentration does not affect droplet formation at [NaCl] < 300 mM, suggesting that interactions between FUS molecules are not held together primarily by electrostatic interactions. Bar chart turbidity values were measured 15 minutes after the addition of TEV protease.

33
In summary, my work on interactions mediating droplet formation of native FUS
complements Schwartz et al.'s findings on fibrillization of native FUS, since they showed that
RNA seeds fibrillization and consequently claimed that FUS's RNA-binding domains promote
polymerization. My work also indicates that different interactions mediate self-assembly of FUS
LC versus native FUS. As a result, fibrils of mCherry-FUS LC may be quite different from
fibrils of native FUS. Future studies on interactions mediating phase separation of TAF15 LC
will be necessary for understanding whether TAF15 LC polymerizes more readily than FUS LC.
In regards to the second question posed by Kwon et al., degeneracies within CTD heptad
repeats 27-33 may provide important clues for why TAF15 LC fibrils preferentially bind the
degenerate half of the CTD. Given that amide backbone resonances for residues Asn6, Asn13,
and Gln45 consistently show heightened transverse relaxation in the presence of TAF15 LC
fibrils, it is plausible that TAF15 LC fibrils actively recruit the side chains of the CTD's
degenerate asparagine and glutamine residues.

34
DISCUSSION
Our investigation of the structure of the intact degenerate repeat half of the CTD of
human RNA polymerase II represents the first NMR study of the CTD's non-consensus repeats.
Our report of CTD27-52's disordered structure, verified by the narrow chemical shift dispersion
of its HSQC spectrum as well as uniform relaxation rates and heteronuclear Overhauser effects
across the entire protein, is not surprising. Bienkiewicz et al. predicted that full-length CTD
exists in a predominantly disordered conformation almost twenty years ago. However, their
prediction was made based on low-resolution CD studies.
Previous NMR studies of the CTD have focused solely on the CTD's consensus repeats.
Since peptides containing more than one consensus repeat produce NMR spectra with almost
entirely overlapped resonances (Cagas et al., 1995), researchers have never attempted to assign
the resonances of a multiple-repeat CTD peptide. Fortuitously, the degenerate repeat half of the
CTD produces a remarkably well-resolved and disperse HSQC spectrum at a field strength of
850 MHz, allowing me to assign 103 of CTD27-52's 148 non-proline residues. 67 of these 103
assignments correspond to non-overlapped, well-resolved peaks. Our truncated CTD27-52
proteins produce even better resolved HSQC spectra - for instance, we have assigned 50 of
CTD43-52's 59 non-proline residues, and 38 out of these 50 assignments correspond to non-
overlapped, well-resolved peaks.
Our assignments of the backbone resonances of CTD27-52 provide a structural
fingerprint of the intact, unphosphorylated degenerate repeat half of the RNA polymerase II
CTD. These assignments are particularly useful for two reasons: 1) Recent work has shown that
the majority of CTD heptads are not phosphorylated in vivo (Suh et al., 2016; Schuller et al.,
2016), making characterization of the CTD's unphosphorylated state even more relevant to

35
understanding the transcription cycle; and 2) Post-translational modifications associated with the
earliest steps of transcription localize to the degenerate repeat half of the CTD, making CTD27-
52 pertinent to understanding transcription initiation. Up until very recently, phosphorylation
studies of the CTD have been exclusively performed using CTD-phospho-specific antibodies.
Antibody detection does not allow high-resolution analysis of the CTD's phosphorylation pattern
because individual heptads within the CTD cannot be distinguished; therefore, it is impossible to
determine how many heptads are phosphorylated and at what sites, not to mention the
problematic effects of antibody cross-reactivity and variable affinity (Corden et al., 2016). Using
genetic and mass spectrometric approaches in an effort to overcome the limitations of antibody
detection, Schuller et al. and Suh et al. report that the vast majority of the CTD's phosphorylation
sites are unphosphorylated. Their work underscores the physiological relevance of the CTD's
unphosphorylated heptads, and our assignments of the unphosphorylated degenerate repeat half
of the CTD perfectly complement high-resolution genomic and mass spectrometric approaches.
This is because our assignments facilitate residue-specific analysis of the effects of post-
translational modifications on CTD27-52's interactions with RNA-processing and transcription
factors. For example, phosphomimetic mutations can easily be introduced into our CTD27-37
construct. By measuring differences in transverse relaxation of individual backbone resonances
of mutated CTD27-37 proteins in the presence and absence of target proteins, the effect of
phosphorylation on binding of individual residues can be investigated. In this way, our
assignments of CTD27-37 promote residue-specific investigations of the CTD code.
Our structural characterization of CTD27-52 in complex with TAF15 LC fibrils is the
first residue-specific investigation of the CTD's role in transcription initiation. In the presence of
TAF15 LC fibrils, backbone resonances corresponding to residues in the N-terminal half of
36
CTD27-52 exhibit increased transverse relaxation relative to residues in the C-terminal half.
Since differences in transverse relaxation can be interpreted as the rate at which CTD27-52
monomer reversibly binds to TAF15 LC fibrils, our data suggests that degenerate heptads 27-33
more rapidly bind TAF15 LC fibrils. Since the CTD's eight lysine residues are distributed among
heptads 35-49, our data does not support Kwon et al.'s hypothesis that lysine residues in the
degenerate half of the RNA polymerase II CTD mediate interactions with TAF15 LC fibrils.
Unfortunately, backbone resonances for the CTD's eight lysines are almost all overlapped in the
HSQC of CTD27-52, which complicates our interpretation of transverse relaxation rates.
However, bulk R2 analysis of overlapped lysine resonances parallels the general trend in ΔR2 -
that is, the closer a residue is to the acidic tail of CTD27-52, the less it interacts with TAF15 LC
fibrils.

37
REFERENCES Akoulitchev, S.; Makela, T. P.; Weinberg, R. A.; Reinberg, D. (1995). Requirement for TFIIH kinase activity in transcription by RNA polymerase II. Nature 377, 557. Allison, L. A.; Moyle, M.; Shales, M.; Ingles, C. J. (1985). Extensive homology among the largest subunits of eukaryotic and prokaryotic RNA polymerases. Cell 42, 599. Arvand, A., and Denny, C.T. (2001). Biology of EWS/ETS fusions in Ewing’s family tumors. Oncogene 20, 5747–5754. Bernecky, C.; Herzog, F.; Baumeister, W.; Plitzko, J.M.; Cramer, P. (2016). Structure of transcribing mammalian RNA polymerase II. Nature 529, 551. Bienkiewicz EA, Moon Woody A-Y, Woody RW. (2000). Conformation of the RNA polymerase II C-terminal domain: circular dichroism of long and short fragments. J Mol Biol 297, 119–133. Buratowski, S.; Sharp, P. A. (1990). Transcription initiation complexes and upstream activation with RNA polymerase II lacking the C-terminal domain of the largest subunit. Mol. Cell. Biol. 10, 5562. Burke, K.A.; Janke, A.M; Rhine, C.L; Fawzi, N.L. (2015). Residue-by-Residue View of In Vitro Fus Granules that Bind the C-terminal Domain of RNA Polymerase II. Mol. Cell 60, 231-241. Cagas PM, Corden JL. (1995). Structural studies of a synthetic peptide derived from the carboxyl-terminal domain of RNA polymerase II. Proteins 21, 149–160. Conicella A.E., Fawzi, N.L. (2014). The C-terminal Threonine of Aβ43 Nucleates Toxic Aggregation and Dynamical Changes in Monomers and Protofibrils. Biochemistry 53, 3095-3105. Corden, J.L. (2013). RNA polymerase II C-terminal domain: tethering transcription to transcript and template, Chem. Rev. 113, 8423–8455. Corden, J. L.; Cadena, D. L.; Ahearn, J. M., Jr.; Dahmus, M. E. (1985). A unique structure at the carboxyl terminus of the largest subunit of eukaryotic RNA polymerase II. Proc. Natl. Acad. Sci. U.S.A. 82, 7934. Corden, J.L. (2016). Pol II CTD Code Light. Mol. Cell 61, 183-184. Delaglio, F., Grzesiek, S., Vuister, G.W., Zhu, G., Pfeifer, J., and Bax, A. (1995). NMRPipe: a multidimensional spectral processing system based on UNIX pipes. J Biomol NMR 6, 277-293.
38
Dias, J.D.; Rito, T.; Torlai, Triglia E.; Kukalev, A.; Ferrai, C.; Chotalia, M.; Brookes, E.; Kimura, H.; Pombo, A. (2015). Methylation of RNA polymerase II non-consensus lysine residues marks early transcription in mammalian cells. Elife. Fawzi, Nicolas L, Jinfa Ying, Dennis A Torchia, and G Marius Clore. (2012). Probing Exchange Kinetics and Atomic Resolution Dynamics in High-molecular-weight Complexes Using Dark-state Exchange Saturation Transfer NMR Spectroscopy. Nature Protocols 7.8, 1523-533. Fawzi, N.L.; Libich, D.S.; Ying, J.; Tugarinov, V.; Clore, G.M. (2014). Characterizing methyl-bearing side chain contacts and dynamics mediating amyloid β protofibril interactions using ¹³C(methyl)-DEST and lifetime line broadening. Angew Chem Int Ed Engl 53, 10345-9. Fawzi, N.L.; Ying, J.; Chirlando, R.; Clore, G.M. (2011). Atomic-resolution dynamics of the surface of amyloid-beta protofibrils probed by solution NMR. Nature 480, 268-72. Guipaud, O., Guillonneau, F., Labas, V., Praseuth, D., Rossier, J., Lopez, B., and Bertrand, P. (2006). An in vitro enzymatic assay coupled to proteomics analysis reveals a new DNA processing activity for Ewing sarcoma and TAF(II)68 proteins. Proteomics 6, 5962–5972. Han, Tina W., Masato Kato, Shanhai Xie, Leeju C. Wu, Hamid Mirzaei, Jimin Pei, Min Chen, Yang Xie, Jeffrey Allen, Guanghua Xiao, and Steven L. McKnight. (2012). Cell-free Formation of RNA Granules: Bound RNAs Identify Features and Components of Cellular Assemblies. Cell 149, 768-79. Kato, M., Han, T.W., Xie, S., Shi, K., Du, X., Wu, L.C., Mirzaei, H., Goldsmith, E.J., Longgood, J., Pei, J., et al. (2012). Cell-free formation of RNA granules: low complexity sequence domains form dynamic fibers within hydrogels. Cell 149, 753-767. Jasnovidova, Olga, and Richard Stefl. (2013). The CTD Code of RNA Polymerase II: A Structural View. Wiley Interdisciplinary Reviews: RNA 4, 1-16. Laybourn, P. J.; Dahmus, M. E. (1989). Transcription-dependent structural changes in the C-terminal domain of mammalian RNA polymerase subunit IIa/o. J. Biol. Chem. 264, 6693. Kang, M. E.; Dahmus, M. E. (1993). RNA polymerases IIA and IIO have distinct roles during transcription from the TATA-less murine dihydrofolate reductase promoter. J. Biol. Chem., 268, 25033. Keller, R.L.J. (2005). Optimizing the process of nuclear magnetic resonance spectrum analysis and computer aided resonance assignment. (Zürich, ETH), p. 147S. Kwon, Ilmin, Masato Kato, Siheng Xiang, Leeju Wu, Pano Theodoropoulos, Hamid Mirzaei, Tina Han, Shanhai Xie, Jeffry L. Corden, and Steven L. McKnight. (2013). Phosphorylation-Regulated Binding of RNA Polymerase II to Fibrous Polymers of Low-Complexity Domains. Cell 155, 1049-060.

39
Lessnick, S.L., and Ladanyi, M. (2012). Molecular pathogenesis of Ewing sarcoma: new therapeutic and transcriptional targets. Annu. Rev. Pathol. 7, 145–159. Liuqing Yang, Jozsef Gal, Jing Chen, and Haining Zhu. (2014). Self-assembled FUS binds active chromatin and regulates gene transcription. Proc Natl Acad Sci U S A. 111, 17809-14. Matsushima, N.; Creutz, C. E.; Kretsinger, R. H. (1990). Polyproline, beta-turn helices. Novel secondary structures proposed for the tandem repeats within rhodopsin, synaptophysin, synexin, gliadin, RNA polymerase II, hordein, and gluten. Proteins 7, 125. Nonet, M.; Sweetser, D.; Young, R. A. (1987). Functional redundancy and structural polymorphism in the large subunit of RNA polymerase II. Cell 50, 909. Payne, J. M.; Laybourn, P. J.; Dahmus, M. E. (1989). The transition of RNA polymerase II from initiation to elongation is associated with phosphorylation of the carboxyl-terminal domain of subunit IIa. J. Biol. Chem. 264, 19621. Peti, W., and Page, R. (2007). Strategies to maximize heterologous protein expression in Escherichia coli with minimal cost. Protein expression and purification 51, 1-10. Ranuncolo, S. M.; Ghosh, S.; Hanover, J. A.; Hart, G. W.; Lewis, B. A. (2012). Evidence of the involvement of O-GlcNAc-modified human RNA polymerase II CTD in transcription in vitro and in vivo. J. Biol. Chem. 287, 23549. Schwartz JC, Cech TR, Parker RR. (2015). Biochemical properties and biological functions of FET proteins. Annu Rev Biochem. 84, 355–379. Schwartz, J. C., C. C. Ebmeier, E. R. Podell, J. Heimiller, D. J. Taatjes, and T. R. Cech. (2012). FUS Binds the CTD of RNA Polymerase II and Regulates Its Phosphorylation at Ser2. Genes & Development 26.24, 2690-695. Schwartz, J. C., E. R. Podell, S. S. W. Han, J. D. Berry, K. C. Eggan, and T. R. Cech. (2014). FUS is sequestered in nuclear aggregates in ALS patient fibroblasts. MBoC 25, 2571-2578. Schwartz, J. C., Xueyin Wang, E. R. Podell, and T. R. Cech. (2013). RNA Seeds Higher-Order Assembly of FUS Protein. Cell Reports 5, 918-25. Sims RJ, Rojas LA, Beck D, Bonasio R, Schuller R, Drury WJ, Eick D, Reinberg D. (2011). The C-Terminal domain of RNA polymerase II is modified by site specific methylation. Science 332, 99–103. Suh, H.; Ficarro, S.B.; Kang, U.; Chun, Y.; Marto, J.A.; Buratowski, S. (2016). Direct Analysis of Phosphorylation Sites on the Rpb1 C-terminal Domain of RNA Polymerase II. Mol. Cell 61, 297-304. Schuller, R.; Forne, I.; Straub, T.; Cramer, P.; Imhof, A.; Eick, D. (2016). Heptad-specific

40
phosphorylation of RNA Polymerase II CTD. Mol. Cell 61, 305-314. Yoshimura, Y.; Kulminskaya, N.V.; Mulder, F.A. (2015). Easy and unambiguous sequential assignments of intrinsically disordered proteins by correlating the backbone 15N or 13C' chemical shifts of multiple contiguous residues in highly resolved 3D spectra. J Biomol NMR 61, 109-21. Wilkins, M.R., Gasteiger, E., Bairoch, A., Sanchez, J.C., Williams, K.L., Appel, R.D., and Hochstrasser, D.F. (1999). Protein identification and analysis tools in the ExPASy server. Methods Mol Biol 112, 531-552. Zehring, W. A.; Greenleaf, A. L. (1990). The carboxyl-terminal repeat domain of RNA polymerase II is not required for transcription factor Sp1 to function in vitro. J. Biol. Chem. 265, 8351. Zhang, J.; Corden, J. L. (1991). Phosphorylation causes a conformational change in the carboxyl-terminal domain of the mouse RNA polymerase II largest subunit. J. Biol. Chem. 266, 2290.
41
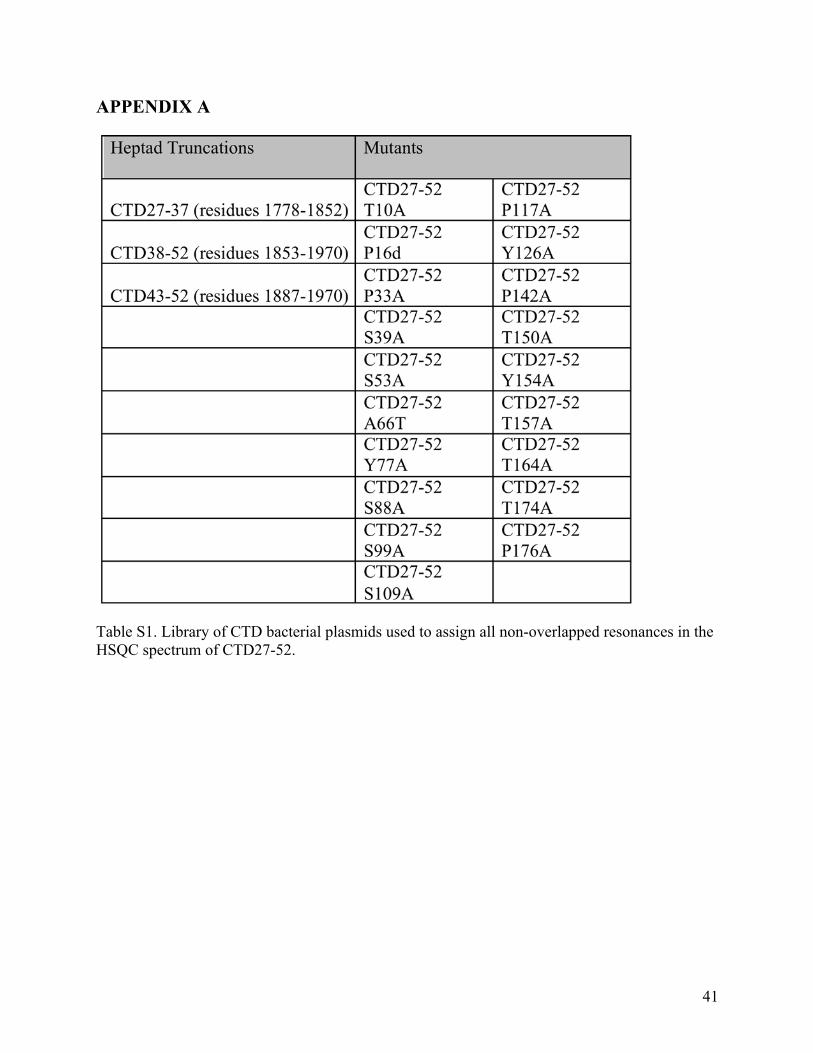
APPENDIX A
Table S1. Library of CTD bacterial plasmids used to assign all non-overlapped resonances in the HSQC spectrum of CTD27-52.
42
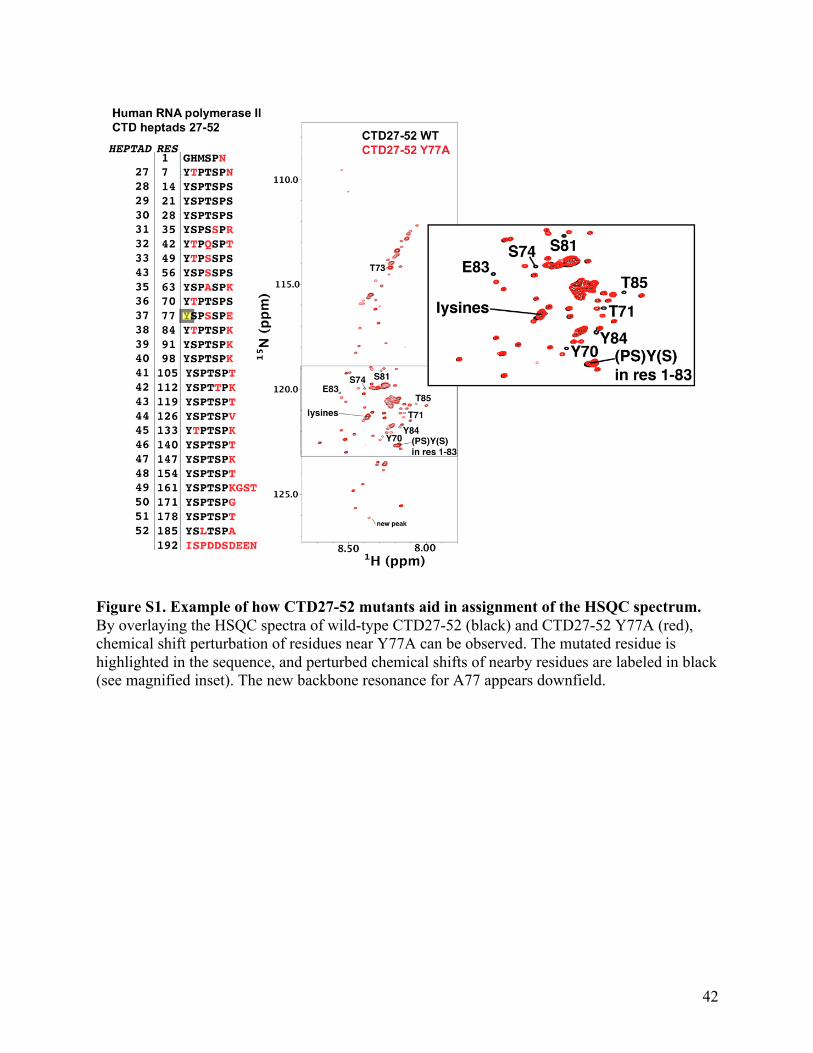
Figure S1. Example of how CTD27-52 mutants aid in assignment of the HSQC spectrum. By overlaying the HSQC spectra of wild-type CTD27-52 (black) and CTD27-52 Y77A (red), chemical shift perturbation of residues near Y77A can be observed. The mutated residue is highlighted in the sequence, and perturbed chemical shifts of nearby residues are labeled in black (see magnified inset). The new backbone resonance for A77 appears downfield.


