Structure, expression differentiation andevolution of duplicated fiber developmentalgenes in Gossypium barbadense and G. hirsutumHuayu Zhu, Xiaoyong Han, Junhong Lv, Liang Zhao, Xiaoyang Xu, Tianzhen Zhang, Wangzhen Guo*
Abstract
Background: Both Gossypium hirsutum and G. barbadense probably originated from a common ancestor, but theyhave very different agronomic and fiber quality characters. Here we selected 17 fiber development-related genesto study their structures, tree topologies, chromosomal location and expression patterns to better understand theinterspecific divergence of fiber development genes in the two cultivated tetraploid species.
Results: The sequence and structure of 70.59% genes were conserved with the same exon length and numbers indifferent species, while 29.41% genes showed diversity. There were 15 genes showing independent evolutionbetween the A- and D-subgenomes after polyploid formation, while two evolved via different degrees ofcolonization. Chromosomal location showed that 22 duplicate genes were located in which at least one fiberquality QTL was detected. The molecular evolutionary rates suggested that the D-subgenome of the allotetraploidunderwent rapid evolutionary differentiation, and selection had acted at the tetraploid level. Expression profiles atfiber initiation and early elongation showed that the transcripts levels of most genes were higher in Hai7124 thanin TM-1. During the primary-secondary transition period, expression of most genes peaked earlier in TM-1 than inHai7124. Homeolog expression profile showed that A-subgenome, or the combination of A- and D-subgenomes,played critical roles in fiber quality divergence of G. hirsutum and G. barbadense. However, the expression ofD-subgenome alone also played an important role.
Conclusion: Integrating analysis of the structure and expression to fiber development genes, suggests selectivebreeding for certain desirable fiber qualities played an important role in divergence of G. hirsutum andG. barbadense.
BackgroundCotton (Gossypium spp.) is the world’s most importantfiber crop plant. While most of the > 50 Gossypium spe-cies are diploid (n = 13), five are allopolyploids (n = 26),originating from an interspecific hybridization eventbetween A- and D-genome diploid species. Humanshave independently domesticated four different speciesfor their fiber, two of which are diploids, Gossypium her-baceum and G. arboreum, and two are allopolyploids,G. hirsutum and G. barbadense [1].Alhough G. hirsutum and G. barbadense probably
originated from a single hybridization event between
A- and D- diploid species, the two have very differentagronomic and fiber quality characteristics. The highyield potential and diverse environmental and produc-tion system adaptability of G. hirsutum make it themost widely cultivated species, accounting for about97% of the world’s cotton fiber [2]. G. barbadense is amore modern species possessing superior fiber quality.Novel alleles are responsible for the improved fiberquality in G. barbadense. Despite its higher fiber quality,however, the narrow adaptation range and low yield ofG. barbadense limit its cultivation. The two Gossypiumspecies are sexually compatible, although partial sterility,longer maturity, and hybrid breakdown are oftenobserved in later generations [3]. Nonetheless, the intro-gression of favorable alleles from G. barbadense toG. hirsutum would likely improve the fiber quality of
* Correspondence: [email protected] Key Laboratory of Crop Genetics & Germplasm Enhancement,Cotton Research Institute, Nanjing Agricultural University, Nanjing 210095,China
Zhu et al. BMC Plant Biology 2011, 11:40http://www.biomedcentral.com/1471-2229/11/40
G. hirsutum while simultaneously maintaining its highfiber yield [4].The cotton fiber is a single cell without the complex
cell division and multicellular development that developsfrom ovule’s epidermal cells. Fiber development occursin four distinct, but overlapping stages: initiation, elon-gation, secondary wall synthesis, and maturation [5]. Todate, many of the genes predominantly expressed in cot-ton fiber development have been isolated and character-ized. Gh14-3-3L was found to be predominantlyexpressed during early fiber development, and may beinvolved in regulating fiber elongation [6]. Yoder et al.[7] defined pectate lyase (PEL) as a cell wall modifica-tion enzyme. GhPel was found to play an essential rolein fiber cell elongation by degradation of the de-esterified pectin for cell wall loosening [8]. Ruan et al.[9] suggested the sucrose synthase gene (Sus) played animportant role in the initiation and elongation of single-celled fibers by influencing carbon partitioning to cellu-lose synthesis. GhBG (b-1,4-glucosidase), one of threecellulases, was specifically expressed in fiber cells andplays an important role in degradation of the primarycell wall and promotion of secondary cell wall synthesis[10]. Cotton CelA1 and CelA2 genes, encoding the cata-lytic subunit of cellulose synthase, are expressed at highlevels during active secondary wall cellulose synthesis indeveloping cotton fibers [11]. Two cotton Rac genes,GhRacA and GhRacB, expressed in the fibers at theinitiation and elongation stages, might play an importantrole in early fiber development [12]. In addition, severalgenes are expressed specifically or preferentially in fibers[13-18], although their exact functional roles remainunclear.In theory, there are two homologs in tetraploid cotton
species, representing descendants from the A-genomeand D-genome donors at the time of polyploidy forma-tion. The goals of this study were to: 1) better under-stand the genetic basis of cotton fiber development,2) identify the structural difference of duplicated genes,and 3) reveal the expression and evolution of fiber qual-ity differences between upland and sea-island cotton. Tocomplete this study, we selected 17 fiber developmentgenes accessioned in National Center for BiotechnologyInformation (NCBI, http://www.ncbi.nlm.nih.gov) tostudy structure and expression differences of the twocultivated tetraploid species. To investigate their frameand sequence divergence, we initially cloned these genesin the genome DNA of the G. hirsutum accession TM-1, the G. barbadense cultivar Hai7124, and their twoputative diploid progenitors. The chromosomal locationsof each homeolog of several studied genes, having effec-tive single nucleotide polymorphism (SNP) or amplifica-tion polymorphism loci between TM-1 and Hai7124were determined by linkage analysis in allotetraploid
cotton using an interspecific BC1 mapping population(TM-1×Hai7124)×TM-1] [19-22]. Finally, expressionpatterns of each gene and each homeolog were explored.A more thorough understanding of interspecific diver-gence of cotton will provide a solid foundation fromwhich key fiber quality genes may be exploited in cottonmolecular breeding.
ResultsSequence and structure analysis of fiber developmentgenesThe orthologs of each of the 17 genes were cloned andsequenced (GenBank accession numbers (GQ340731-GQ340736, HQ142989-HQ143048, and HQ143055-HQ143090; Table 1). Phylogenetic groupings andsequence comparisons allowed the copy number for allgenes, except Exp1 in the Hai7124 cultivar, to be inde-pendently isolated with a single copy from the diploidspecies and two homeologs from each tetraploid speciesfor each gene. There was a single copy of Exp1 in thediploid species and two distinct copies in TM-1, how-ever, the Exp1 sequence from Hai7124 was of only onetype, though more than 10 clones were selected ran-domly to sequence. This result was further validated bya different primer pair of this gene (see Additional file1: Supplemental Table S1 for list of primer pairs). Thesequence from Hai7124 has a closer relationship withG. raimondii than with G. herbaceum. Further, southernblotting of Exp1 performed on the four species, showedtwo distinct hybridizing bands after digestion with EcoRIand HindI in Hai7124 and TM-1, and one hybridizingband in G. herbaceum and G. raimondii (Figure notshown), which indicated that Exp1 had two copies inboth TM-1 and Hai7124. Combining sequence andsouthern blot analysis, the homeolog of Exp1 in theA-subgenome of Hai7124 was colonized to a typeresembling that of the D-subgenome via nonreciprocalhomoeologous exchange [23].The lengths of the genomic DNA sequences isolated
from the four species varied from 1020 bp (Exp1) to6126 bp (CelA3) (Table 2). Based on the alignmentsbetween the genomic DNA and the cDNA sequences inorthologs, twelve genes (70.59%) shared the sameintron/exon structures in different genomes, and varia-tions in length were mainly caused by insertion/deletionevents within introns (Additional file 2: SupplementalFigure S1A). The remaining five genes (29.41%), CIPK1,CAP, BG, ManA2 and CelA3, produced some structuredifferences caused by different exon length or numbers(Additional file 2: Supplemental Figure S1B).Seventeen gene trees were constructed using the NJ
method to distinguish the duplicated genes independentof evolution or local interlocus recombination after tet-raploid formation. Two major clades, one including
Zhu et al. BMC Plant Biology 2011, 11:40http://www.biomedcentral.com/1471-2229/11/40
G. herbaceum and the A-subgenomes of TM-1 andHai7124, the other including G. raimondii and theD-subgenomes of TM-1 and Hai7124, were formed for15 genes (Additional file 3: Supplemental Figure S2A).High bootstrap values supported duplicated genes inde-pendent of evolution after tetraploid formation. Two
genes were determined to have local interlocus recombi-nation or colonization after tetraploid formation (Addi-tional file 3: Supplemental Figure S2B). ACT1 fromG. raimondii was more closely related to ACT1s fromG. herbaceum and the A-subgenomes than with ACT1sfrom the D-subgenomes. This relationship suggests that
Table 1 Names and characteristics of fiber development-related genes
Gene Accessioncode
Potential function
14-3-3L
DQ402076 14-3-3-like, may participate in the regulation of fiber elongation.
CAP AB014884 adenylyl cyclase associated protein, may play a functional role during early stages of cotton fiber development.
CEL AY574906 endo-1,4-beta-glucanase, necessary for plant cellulose biosynthesis.
Pel DQ073046 pectate lyase, exclusively degrade the de-esterified pectin, may play an important role in the process of normal fiberelongation in cotton.
POD2 AY074794 bacterial-induced peroxidase
RacA DQ667981 small GTPase gene, might play an important role in the early stage of fiber development.
RacB DQ315791 small GTPase gene, might play an important role in the early stage of fiber development.
Sus1 U73588 sucrose synthase, play an important role in the initiation and elongation of cotton fiber by influencing carbon partitioningto cellulose synthesis.
LTP3 AF228333 Lipid transfer protein gene, involved in cutin synthesis during the fiber primary cell wall synthesis stage
Table 2 Structure analysis for orthologs of fiber development genes in four cotton species
Gene Numbers of exon Length of ORF(bp)/numbers of derived amino acids
14-3-3L 7 762/253
CAP A1, Ath and Atb: 10; D5, Dth and Dtb: 9 A1, Ath and Atb: 1416/471; D5, Dth and Dtb: 1338/445
CEL 6 1860/619
CIPK1 1 A1, Ath and Atb: 1341/446; D5, Dth and Dtb: 1347/448
BG Dth: 7; Dtb: 8; A1, D5, Ath and Atb: 9 Dth: 1050/349; Dth: 1365/454; A1, D5, Ath and Atb: 1884/627
CelA3 Ath and Atb: 8; A1, D5, Dth and Dtb: 14 Ath and Atb: 2055/684; A1, D5, Dth and Dtb: 3204/1067
ACT1 4 1134/377
LTP3 1 363/120
A1 = G. herbaceum L. var. africanum, D5 = G. raimondii Ulbr, Ath = A subgenome of G. hirsutum L. acc. TM-1, Dth = D subgenome of G. hirsutum L. acc. TM-1,Atb = A subgenome of G. barbadense L. cv. 7124, Dtb = D subgenome of G. barbadense L. cv. 7124.
Zhu et al. BMC Plant Biology 2011, 11:40http://www.biomedcentral.com/1471-2229/11/40
Page 3 of 15
ACT1s from the D-subgenomes evolved at an acceler-ated rate, relative to ACT1s from the A-subgenomes.The Exp1 sequence in Hai7124 was closer to that foundin G. raimondii.To locate all 17 homeolog gene pairs on our backbone
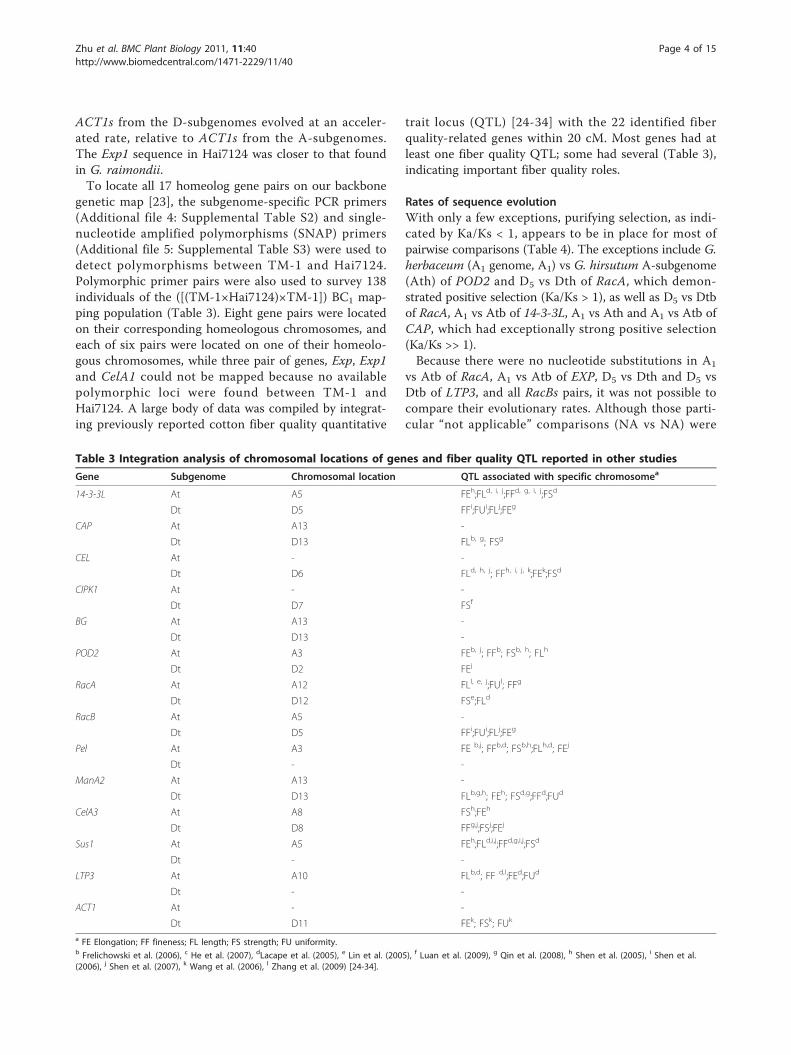
genetic map [23], the subgenome-specific PCR primers(Additional file 4: Supplemental Table S2) and single-nucleotide amplified polymorphisms (SNAP) primers(Additional file 5: Supplemental Table S3) were used todetect polymorphisms between TM-1 and Hai7124.Polymorphic primer pairs were also used to survey 138individuals of the ([(TM-1×Hai7124)×TM-1]) BC1 map-ping population (Table 3). Eight gene pairs were locatedon their corresponding homeologous chromosomes, andeach of six pairs were located on one of their homeolo-gous chromosomes, while three pair of genes, Exp, Exp1and CelA1 could not be mapped because no availablepolymorphic loci were found between TM-1 andHai7124. A large body of data was compiled by integrat-ing previously reported cotton fiber quality quantitative
trait locus (QTL) [24-34] with the 22 identified fiberquality-related genes within 20 cM. Most genes had atleast one fiber quality QTL; some had several (Table 3),indicating important fiber quality roles.
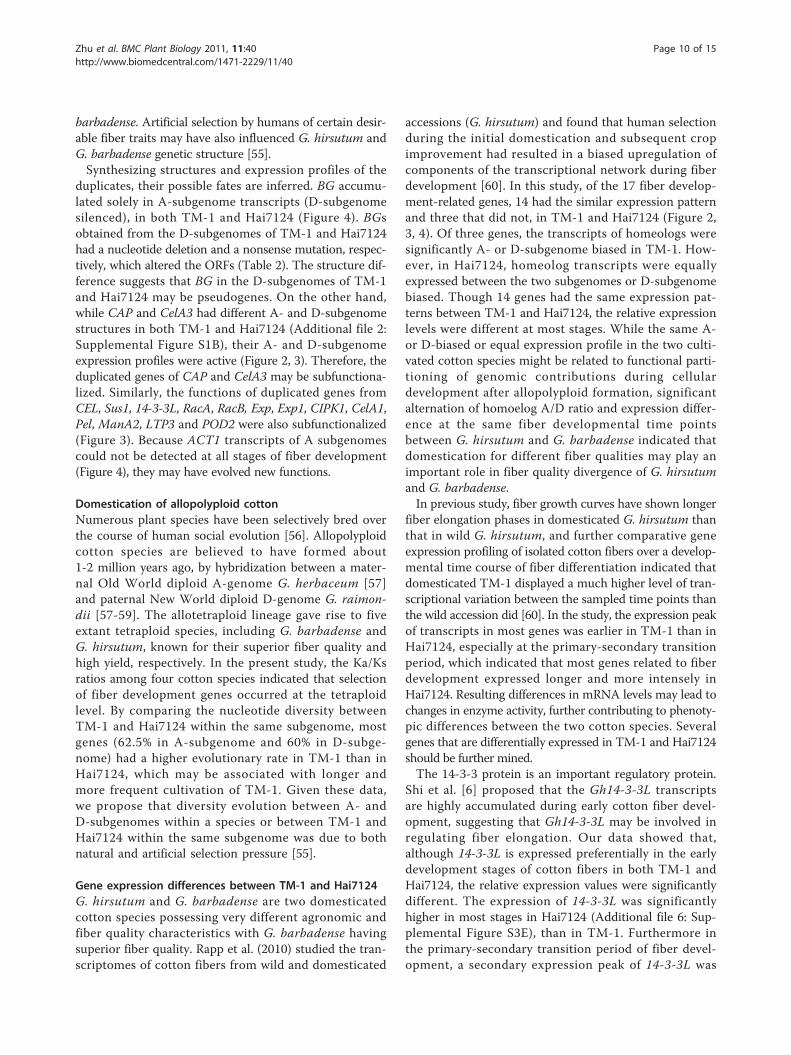
Rates of sequence evolutionWith only a few exceptions, purifying selection, as indi-cated by Ka/Ks < 1, appears to be in place for most ofpairwise comparisons (Table 4). The exceptions include G.herbaceum (A1 genome, A1) vs G. hirsutum A-subgenome(Ath) of POD2 and D5 vs Dth of RacA, which demon-strated positive selection (Ka/Ks > 1), as well as D5 vs Dtbof RacA, A1 vs Atb of 14-3-3L, A1 vs Ath and A1 vs Atb ofCAP, which had exceptionally strong positive selection(Ka/Ks >> 1).Because there were no nucleotide substitutions in A1
vs Atb of RacA, A1 vs Atb of EXP, D5 vs Dth and D5 vsDtb of LTP3, and all RacBs pairs, it was not possible tocompare their evolutionary rates. Although those parti-cular “not applicable” comparisons (NA vs NA) were
Table 3 Integration analysis of chromosomal locations of genes and fiber quality QTL reported in other studies
Gene Subgenome Chromosomal location QTL associated with specific chromosomea
14-3-3L At A5 FEh;FLd, i, j;FFd, g, i, j;FSd
Dt D5 FFi;FUi;FLj;FEg
CAP At A13 -
Dt D13 FLb, g; FSg
CEL At - -
Dt D6 FLd, h, j; FFh, i, j, k;FEk;FSd
CIPK1 At - -
Dt D7 FSf
BG At A13 -
Dt D13 -
POD2 At A3 FEb, j; FFb; FSb, h; FLh
Dt D2 FEj
RacA At A12 FLl, e, j;FUl; FFg
Dt D12 FSe;FLd
RacB At A5 -
Dt D5 FFi;FUi;FLj;FEg
Pel At A3 FE b,j; FFb,d; FSb,h;FLh,d; FEj
Dt - -
ManA2 At A13 -
Dt D13 FLb,g,h; FEh; FSd,g;FFd;FUd
CelA3 At A8 FSh;FEh
Dt D8 FFg,j;FSj;FEj
Sus1 At A5 FEh;FLd,i,j;FFd,g,i,j;FSd
Dt - -
LTP3 At A10 FLb,d; FF d,l;FEd;FUd
Dt - -
ACT1 At - -
Dt D11 FEk; FSk; FUk
a FE Elongation; FF fineness; FL length; FS strength; FU uniformity.b Frelichowski et al. (2006), c He et al. (2007), dLacape et al. (2005), e Lin et al. (2005), f Luan et al. (2009), g Qin et al. (2008), h Shen et al. (2005), i Shen et al.(2006), j Shen et al. (2007), k Wang et al. (2006), l Zhang et al. (2009) [24-34].
Zhu et al. BMC Plant Biology 2011, 11:40http://www.biomedcentral.com/1471-2229/11/40
Page 4 of 15
excluded from our analysis, the “NAs” were consideredzero when they were compared with others whose Kswere not NA. In all pairwise comparisons of nucleotidediversity for each gene between subgenomes within aspecies [32 pairs, 16 in TM-1 and 16 in Hai7124 (RacBwas excluded)], 62.5% (10 in TM-1 and 10 in Hai7124)had a higher evolutionary rate in the D-subgenome thanin the A-subgenome. Furthermore, in the 16 gene pairs(excluding RacB) from the A-subgenomes of TM-1 andHai7124, 62.5% (10 out of 16) had a higher evolutionaryrate in TM-1 than in Hai7124, 31.25% (5 of 15) and werereversed and 6.25% (1 of 16, ACT1) showed an equivalentevolutionary rate between TM-1 and Hai7124. Similarly,in the 15 gene pairs (RacB and LTP3 were excluded)from the D-subgenomes of TM-1 and Hai7124, 60% (9 of15) had a higher evolutionary rate in TM-1 than inHai7124, 26.67% (4 of 15) and were reversed and 13.33%
(2 of 15, Pel and Exp) showed an equivalent evolutionaryrate between TM-1 and Hai7124.Phylogenetic relationships are reflected in the nucleo-
tide substitution results (Additional file 3: SupplementalFigure S2). Based on branch length, all of homeologsfrom the two tetraploid species had unequal rates ofsequence evolution following allopolyploid formation.The rates at which the deviations occurred in allopoly-ploids are sufficient to generate branch length inequalitybetween the A- and D-subgenomes [35].Ka/Ks ratio comparisons showed that selection had
altered the molecular evolutionary rate of some genesdue to allopolyploid formation. Four genes, Pel, RacA,Exp and Sus1, in TM-1, and five genes, Pel, CIPK1, 14-3-3L, CAP and CelA3, in Hai7124, yielded higher Ka/Ksratios in A-At, D-Dt and At-Dt comparisons than in theA-D comparison, indicating that selection for some
Table 4 Synonymous and nonsynonymous substitution rates in various comparisons among different cotton species
Gene Ka/Ks/Ka:Ks ratio
A1 VS D5 A1 VS Ath D5 VS Dth A1 VS Atb D5 VS Dtb Ath VS Dth Atb VS Dtb
BG 0.0081/0.0360/0.2243
9.75E-05/0.0098/0.001
0.0025/0.0362/0.0694
1.24E-05/0.0124/0.001
0.0029/0.0135/0.2127
0.0048/0.0282/0.1694
0.0076/0.0403/0.1875
Pel 0.0021/0.0910/0.0228
0.0024/0.0204/0.1198
0.0021/0.0041/0.5064
0.0012/0.0111/0.1106
0.0021/0.0041/0.5064
0.0022/0.0542/0.0398
0.0032/0.0912/0.0348
ManA2 0.0061/0.0218/0.2798
0.0041/0.0137/0.2960
0.0031/0.0085/0.3613
0.0040/0.0164/0.2419
0.0034/0.0076/0.4475
0.0049/0.0177/0.2769
0.0077/0.0183/0.4179
POD2 0.0119/0.0218/0.5457
0.0075/0.0069/1.0812
0.0113/0.0164/0.6852
0.0086/0.0195/0.4392
0.0131/0.0192/0.6829
0.0158/0.0313/0.5065
0.0131/0.0349/0.3753
CIPK1 0.0076/0.0308/0.2460
0.0026/0.0130/0.2040
0.0032/0.0134/0.2348
0.0035/0.0083/0.4179
0.0030/0.0117/0.2563
0.0077/0.0344/0.2240
0.0074/0.0247/0.3009
RacA 0.0117/0.0417/0.2811
0.0020/0.0061/0.3270
0.0093/0.0052/1.7812
NA/NA/NA a 0.0067/0.0001/50 0.0143/0.0402/0.3554
0.0096/0.0391/0.2467
RacB 1.49E-05/0.0149/0.001
NA/NA/NA a NA/NA/NA a NA/NA/NA a NA/NA/NA a 1.49E-05/0.0149/0.001
1.49E-05/0.0149/0.001
EXP 0.0018/0.0372/0.0482
0.0017/0.0335/0.0496
0.0034/0.0259/0.1305
NA/NA/NA a 0.0034/0.0259/0.1305
0.0033/0.0064/0.5184
0.0016/0.0408/0.0394
Exp1 0.0156/0.0562/0.2784
0.0038/0.0166/0.2269
0.0032/0.0221/0.1457
0.0101/0.0650/0.1548
0.0085/0.0174/0.4899
0.0120/0.0607/0.1977
NA/NA/NAa
14-3-3L
0.0025/0.0299/0.0820
5.08E-06/0.0051/0.001
0.0039/0.0109/0.3589
0.0019/3.74E-05/50
0.0047/0.0233/0.2012
0.0024/0.0407/0.0590
0.0046/0.0036/1.2832
CAP 0.0144/0.0477/0.3016
0.0029/5.93E-05/48.97
0.0036/0.0063/0.5721
0.0019/3.84E-05/50
0.0059/0.0065/0.9093
0.0129/0.0437/0.2961
0.0143/0.0423/0.3369
CEL 0.0032/0.0270/0.1171
0.0014/0.0058/0.2392
7.80E-06/0.0078/0.001
0.0009/0.0038/0.2293
0.0007/0.0051/0.1342
0.0029/0.0400/0.0724
0.0028/0.0275/0.1030
Sus1 0.0045/0.0318/0.1420
0.0013/0.0054/0.2425
0.0015/0.0070/0.2072
0.0020/0.0039/0.5236
6.31E-06/0.0063/0.001
0.0053/0.0253/0.2079
0.0013/0.0054/0.2425
CelA1 0.0028/0.0406/0.0689
0.0005/0.0097/0.0479
0.0005/0.0027/0.1965
1.06E-05/0.0106/0.001
4.40E-06/0.0044/0.001
0.0038/0.0403/0.0939
0.0027/0.0443/0.0612
CelA3 0.0066/0.0406/0.1615
0.0035/0.0074/0.4772
0.0027/0.0284/0.0967
0.0043/0.0069/0.6208
0.0037/0.0219/0.1683
0.0025/0.0230/0.1067
0.0050/0.0264/0.1904
LTP3 0.0631/0.0752/0.8401
2.37E-05/0.0237/0.001
NA/NA/NA a 1.00E-05/0.0100/0.001
NA/NA/NA a 0.0610/0.0858/0.7111
0.0620/0.0667/0.9289
ACT1 0.0013/0.0445/0.0284
0.0012/0.0088/0.1381
4.43E-05/0.0443/0.001
0.0012/0.0088/0.1381
4.08E-05/0.0408/0.001
6.53E-05/0.0653/0.001
5.37E-05/0.0537/0.001
Letter designations are the same as in Table 2.a no synonymous and nonsynonymous site.
Zhu et al. BMC Plant Biology 2011, 11:40http://www.biomedcentral.com/1471-2229/11/40
Page 5 of 15
genes related with fiber development had acted at thetetraploid level.
Differential expression fiber development genesAfter the specificity of homeolog-specific primer pairs wereconfirmed by PCR amplification of genomic DNA fromG. herbaceum (A-genome), G. raimondii (D-genome),TM-1 and Hai7124 (Figure 1), their homeolog transcriptsin young tetraploid cotton fiber were further detected byqPCR analysis. The relative expression values at 10 differ-ent fiber development stages were obtained by combiningthe homeolog transcripts of each gene at the same stage.Expression for the 17 genes could be broken down intofive categories (Additional file 6: Supplemental Figure S3):1) fiber initiation and early elongation (0-8 DPA), such asExp, POD2 and ManA2 (Additional file 6: SupplementalFigure S3A); 2) fiber elongation (3-17 DPA), such as Exp1,Pel, and LTP3 (Additional file 6: Supplemental Figure S3B);3) primary-secondary transition period (17-23 DPA), suchas BG, CEL and CelA1 (Additional file 6: SupplementalFigure S3C); 4) both at fiber initiation and early elongation
period (0-8DPA) and secondary cell wall thickening period(20-23DPA), such as Sus1, 14-3-3L and RacB (Additionalfile 6: Supplemental Figure S3D); 5) the whole fiber devel-opmental period, such as CelA3, CAP, ACT1, RacA andCIPK1 (Additional file 6: Supplemental Figure S3E). In thelast category, however, transcript preference was shown atsome stages. For example, CelA3 and CAP were expressedpreferentially at the fiber elongation and secondary cellwall thickening stages (8-23 DPA), but had moderateexpression at 0-5 DPA.Gene expression differences in TM-1 and Hai7124
were further clarified by statistical analysis of least sig-nification difference (LSD). Greater expression inHai7124 than in TM-1 was observed for 14-3-3L exceptat 20 DPA, and for CelA3 except at 5, 17 and 23 DPA.Other gene transcripts showed different expressionadvantages in the two cotton species at various fiberdevelopmental stages.At fiber initiation and early elongation (0-8 DPA),
most genes, including Exp, ManA2, Sus1, RacB, CelA3,CAP and RacA, had significantly higher expression levels
Figure 1 Amplification products in four cotton species using subgenome-specific qPCR primer pairs. First line includes amplifiedresults from A-genome specific primers; second line includes amplified results from D-genome specific primers. “M” represents marker,“A” represents G. herbaceum var. africanum, “D” represents G. raimondii, “T” represents G. hirsutum acc. TM-1, “H” represents G. barbadense cv.Hai7124. Numbers represent the sizes of the makers (bp).
Zhu et al. BMC Plant Biology 2011, 11:40http://www.biomedcentral.com/1471-2229/11/40
Page 6 of 15
in Hai7124 than in TM-1. During fiber elongation (5-14DPA), the expression profiles of genes preferentiallyexpressed during that period were either biased to TM-1 or Hai7124 or were equally expressed between thetwo. Five genes, Exp1, Pel, CAP, CIPK1 and RacA, wereexpressed preferentially in TM-1 or equally betweenTM-1 and Hai7124, except at 8 DPA, that these samegenes showed significantly greater expression levels inHai7124; LTP3 and ACT1 showed significantly higherexpression levels in TM-1 than in Hai7124; expressionof CelA3 was higher in Hai7124.During primary-secondary cell wall transition (17-23
DPA), peak expression occurred earlier in TM-1 than inHai7124 for most genes (CAP, CelA3, CIPK1, CEL, BG,RacB, Sus1 and 14-3-3L). ACT1 and RacA expressedequally in TM-1 and Hai7124 at 17 and 20 DPA, butsignificantly greater in Hai7124 at 23 DPA. Theextended fiber development period, as indicated byhigher expression at a later DPA, may help explain whyG. barbadense has an extra long staple cotton. Onegene, CelA1, showed no significant expression differencebetween TM-1 and Hai7124.
Genome-specific expression of the homeologsBased on the homeolog expression profile, 17 diagnosticgenes in TM-1 and 17 in Hai7124 were further evalu-ated. Of the 34 genes, 32.35% (11) were equallyexpressed between the A- and D-subgenomes, 41.18%(14) were A-subgenome biased, 20.59% (7) were D-sub-genome biased and 5.88% (2) were A- or D-biased atdifferent stages.
The 17 fiber development genes were clustered intothree comparison patterns between TM-1 and Hai7124.First, homeologs for CelA3, Exp, Exp1 and CIPK1 in bothTM-1 and Hai7124 were equally expressed between theA- and D-subgenomes in the preferentially-expressedstages (Figure 2). Of these, Exp1 had equal transcript levelsfrom the two homeologs in TM-1 and Hai7124, with twodistinguishable copies in TM-1 and two undistinguishablecopies in Hai7124. These data were consistent with thefact that the duplicated loci for Exp1 in Hai7124 had thesame sequence as the D-subgenome (Figure 2).Second, the transcripts of 11 genes, CEL, Pel, Sus1, 14-3-
3L, RacA, CelA1, ManA2, RacB, CAP, LTP3 and POD2,were A- or D-subgenome biased (Figure 3). Among these,CEL, Pel, Sus1, 14-3-3L and RacA were A-subgenomebiased and CelA1, ManA2 and RacB were D-subgenomebiased in both TM-1 and Hai7124 at all stages. The tran-scripts of the homeologs of CAP, LTP3 and POD2 weresignificantly altered in the preferentially expressed stagesin TM-1 and Hai7124. In TM-1, the transcripts of CAPand LTP3 were significantly A-subgenome biased. How-ever, the transcripts of the two genes in Hai7124 wereequivalently expressed at most stages, only D-subgenomebias in LTP3 in the primary-secondary cell wall transitionperiod detected. Expression of POD2 was A-subgenomebiased at 0, 3 and 10 DPA and D-subgenome biased at 1DPA in TM-1. In Hai7124, POD2 expression was A-sub-genome biased at 0, 3 and 10 DPA and D-subgenomebiased at 1, 5 and 8 DPA.Third, BG was significantly (P < 0.001) affected only
from the A-subgenome, and ACT1 was significantly (P <
Figure 2 Q-PCR analysis for homeologous expression of genes expressed equally between A- and D-subgenomes. Significant valueswere obtained by comparison between the two subgenomes. * P < 0.05, ** P < 0.01. See Table 2 for abbreviation designations. Vertical barsrepresented standard deviation (STD).
Zhu et al. BMC Plant Biology 2011, 11:40http://www.biomedcentral.com/1471-2229/11/40
Page 7 of 15
0.001) affected from the D-subgenome at all stages inboth TM-1 and Hai7124 (Figure 4). Based on the com-parison patterns and the structural analysis of the twogenes, we proposed that the homeolog of BG from theD-subgenome might be silenced and that of ACT1 fromthe A-subgenome may have novel roles in other species(neofunctionalization).
Differences between TM-1 and Hai7124 in transcrip-tome contributions of the subgenome at key fiber devel-opmental stages were detected. During initiation andearly elongation of the fiber, 10 gene transcriptionsshowed greater expression levels in Hai7124 than inTM-1. Of those, the D-subgenome contributed higheramounts of ACT1, RacB and Man2, while the A-
Figure 3 Q-PCR analysis for homeologous expression of genes with A or D-subgenome biased expression. Significant values and verticalbars were same with Figure 2.
Zhu et al. BMC Plant Biology 2011, 11:40http://www.biomedcentral.com/1471-2229/11/40
Page 8 of 15
subgenome contributed higher amounts of Sus1, CIPK1and 14-3-3L. CelA3, Exp, CAP and RacA were equallysupplied by both subgenomes.At 8 DPA, corresponding to the close of fiber plasmodes-
mate [36], the transcriptions of 12 genes (Exp1, Pel, POD2,CelA3, BG, Sus1, CAP, Exp, RacA, RacB, 14-3-3L andCIPK1) were sharply accumulated in Hai7124. Of those,the transcripts of RacB and POD2 were contributed mainlyfrom D-subgenome, that of BG, Pel, Sus1 and RacA fromA-subgenome and others by both A- and D-subgenomes.At the primary-secondary transition period, the
expression of 10 genes, CelA3, CAP, ACT1, RacA,CIPK1, 14-3-3L, Sus1, RacB, CEL and BG, occurred ear-lier in TM-1 than in Hai7124. The transcripts of ACT1and RacB were mainly from D-subgenomes; those ofBG, CEL and Sus1 were mainly from A-subgenomes,and other genes were from both A- and D-subgenomes.Based on these data we inferred that the expressionaccumulation of the A-subgenome, or the combinationof A- and D-subgenomes, played critical roles in fiberquality divergence of G. hirsutum and G. barbadense.However, the expression of D-subgenome alone alsoplayed an important role.
DiscussionEvolutionary fate of duplicated genesFor each gene that was studied, allopolyploid speciesshould have two homelogs, representing descendantsfrom the A-genome and D-genome donors at the timeof polyploidy formation. Cronn et al. [35] indicated thatmost duplicated genes in allopolyploid cotton evolvedindependently of each other. Our phylogenetic analysessupport this hypothesis, and the independent evolutionof several genes was distinctively evident in their struc-ture, in our study. For example, CAPs and RacBs hadthe same structure between each diploid and its coun-terpart in allopolyploid cotton (A- and At-subgenome,D- and Dt-subgenome), but the different structureswere apparent in the A-D comparison (Additional file 2:Supplemental Figure S1B). Though expression of ManA2
from the At-subgenome of Hai7124 ceased rather earlyin the growth process, the structure difference betweenthe A-, At-subgenomes and D-, Dt-subgenomes was alsodistinct. The fact that the structure of the At- andDt-subgenomes mirrored their putative ancestral diploidspecies suggested the difference may have occurred beforeallopolyploid formation and evolved independently in allo-polyploid cotton. CelA3s from At-subgenome of TM-1and Hai7124 displayed the same mutation, which alteredtheir coding regions, indicating not only independent evo-lution, but also parallel evolution between TM-1 andHai7124. This change, however, was not detected in theirputative ancestral diploid species, suggesting acceleratedevolution of CelA3 in the At-subgenome after allopoly-ploid formation. Though most genes independentlyevolved in allopolyploid cotton, there were some excep-tions. For example, Exp1 from At-subgenome werecolonized in Hai7124 by Dt-subgenomes.Relative to expression, duplicate genes can follow one of
three evolutionary paths. First, one copy may evolve into anonfunctional pseudogene [37-41]. Second, the multiplecopies can contribute to an increase in the gene expressionlevel [42,43] or both copies can suffer mutations but thecombined action of both gene copies is necessary to main-tain original function and expression levels (subfunctiona-lization) [40,44,45]. Third, one copy may gain a novelbeneficial function (neofunctionalization) that is selectivelymaintained within the genome [40,46-48]. We measuredhomeolog-specific contributions to the transcriptome inallopolyploid cotton fiber by Q-PCR analysis. Because themajority (64.70%) of diagnostic genes exhibited subge-nome-specific bias to the A or D-subgenome, subgenome-biased expression in cotton fiber developmental stages wasconsidered commonplace. This result was consistent withprevious studies [49-55]. Most of genes in our study exhib-ited the same expression bias in the two cultivated cottonspecies, TM-1 and Hai7124. However, some inconsisten-cies were detected in three genes (CAP, LTP3 and POD2),suggesting that these genes may have had different roles inthe interspecific divergence between G. hirsutum and G.
Figure 4 Q-PCR analysis for homeologous expression of genes with subgenome-specific expression. Significant values and vertical barswere same with Figure 2.
Zhu et al. BMC Plant Biology 2011, 11:40http://www.biomedcentral.com/1471-2229/11/40
Page 9 of 15
barbadense. Artificial selection by humans of certain desir-able fiber traits may have also influenced G. hirsutum andG. barbadense genetic structure [55].Synthesizing structures and expression profiles of the
duplicates, their possible fates are inferred. BG accumu-lated solely in A-subgenome transcripts (D-subgenomesilenced), in both TM-1 and Hai7124 (Figure 4). BGsobtained from the D-subgenomes of TM-1 and Hai7124had a nucleotide deletion and a nonsense mutation, respec-tively, which altered the ORFs (Table 2). The structure dif-ference suggests that BG in the D-subgenomes of TM-1and Hai7124 may be pseudogenes. On the other hand,while CAP and CelA3 had different A- and D-subgenomestructures in both TM-1 and Hai7124 (Additional file 2:Supplemental Figure S1B), their A- and D-subgenomeexpression profiles were active (Figure 2, 3). Therefore, theduplicated genes of CAP and CelA3 may be subfunctiona-lized. Similarly, the functions of duplicated genes fromCEL, Sus1, 14-3-3L, RacA, RacB, Exp, Exp1, CIPK1, CelA1,Pel, ManA2, LTP3 and POD2 were also subfunctionalized(Figure 3). Because ACT1 transcripts of A subgenomescould not be detected at all stages of fiber development(Figure 4), they may have evolved new functions.
Domestication of allopolyploid cottonNumerous plant species have been selectively bred overthe course of human social evolution [56]. Allopolyploidcotton species are believed to have formed about1-2 million years ago, by hybridization between a mater-nal Old World diploid A-genome G. herbaceum [57]and paternal New World diploid D-genome G. raimon-dii [57-59]. The allotetraploid lineage gave rise to fiveextant tetraploid species, including G. barbadense andG. hirsutum, known for their superior fiber quality andhigh yield, respectively. In the present study, the Ka/Ksratios among four cotton species indicated that selectionof fiber development genes occurred at the tetraploidlevel. By comparing the nucleotide diversity betweenTM-1 and Hai7124 within the same subgenome, mostgenes (62.5% in A-subgenome and 60% in D-subge-nome) had a higher evolutionary rate in TM-1 than inHai7124, which may be associated with longer andmore frequent cultivation of TM-1. Given these data,we propose that diversity evolution between A- andD-subgenomes within a species or between TM-1 andHai7124 within the same subgenome was due to bothnatural and artificial selection pressure [55].
Gene expression differences between TM-1 and Hai7124G. hirsutum and G. barbadense are two domesticatedcotton species possessing very different agronomic andfiber quality characteristics with G. barbadense havingsuperior fiber quality. Rapp et al. (2010) studied the tran-scriptomes of cotton fibers from wild and domesticated
accessions (G. hirsutum) and found that human selectionduring the initial domestication and subsequent cropimprovement had resulted in a biased upregulation ofcomponents of the transcriptional network during fiberdevelopment [60]. In this study, of the 17 fiber develop-ment-related genes, 14 had the similar expression patternand three that did not, in TM-1 and Hai7124 (Figure 2,3, 4). Of three genes, the transcripts of homeologs weresignificantly A- or D-subgenome biased in TM-1. How-ever, in Hai7124, homeolog transcripts were equallyexpressed between the two subgenomes or D-subgenomebiased. Though 14 genes had the same expression pat-terns between TM-1 and Hai7124, the relative expressionlevels were different at most stages. While the same A-or D-biased or equal expression profile in the two culti-vated cotton species might be related to functional parti-tioning of genomic contributions during cellulardevelopment after allopolyploid formation, significantalternation of homoelog A/D ratio and expression differ-ence at the same fiber developmental time pointsbetween G. hirsutum and G. barbadense indicated thatdomestication for different fiber qualities may play animportant role in fiber quality divergence of G. hirsutumand G. barbadense.In previous study, fiber growth curves have shown longer
fiber elongation phases in domesticated G. hirsutum thanthat in wild G. hirsutum, and further comparative geneexpression profiling of isolated cotton fibers over a develop-mental time course of fiber differentiation indicated thatdomesticated TM-1 displayed a much higher level of tran-scriptional variation between the sampled time points thanthe wild accession did [60]. In the study, the expression peakof transcripts in most genes was earlier in TM-1 than inHai7124, especially at the primary-secondary transitionperiod, which indicated that most genes related to fiberdevelopment expressed longer and more intensely inHai7124. Resulting differences in mRNA levels may lead tochanges in enzyme activity, further contributing to phenoty-pic differences between the two cotton species. Severalgenes that are differentially expressed in TM-1 and Hai7124should be further mined.The 14-3-3 protein is an important regulatory protein.
Shi et al. [6] proposed that the Gh14-3-3L transcriptsare highly accumulated during early cotton fiber devel-opment, suggesting that Gh14-3-3L may be involved inregulating fiber elongation. Our data showed that,although 14-3-3L is expressed preferentially in the earlydevelopment stages of cotton fibers in both TM-1 andHai7124, the relative expression values were significantlydifferent. The expression of 14-3-3L was significantlyhigher in most stages in Hai7124 (Additional file 6: Sup-plemental Figure S3E), than in TM-1. Furthermore inthe primary-secondary transition period of fiber devel-opment, a secondary expression peak of 14-3-3L was
Zhu et al. BMC Plant Biology 2011, 11:40http://www.biomedcentral.com/1471-2229/11/40
Page 10 of 15
also detected, indicating 14-3-3L may also be involved inthickening of the secondary cell wall, a function that hasbeen reported in other species [61]. At 23 DPA, theexpression of 14-3-3L decreased in TM-1, but was stillincreasing in Hai7124, suggesting a longer transcrip-tional period.CelA1 was solely expressed during secondary wall cel-
lulose synthesis, with no significant expression differencebetween TM-1 and Hai7124 (Additional file 6: Supple-mental Figure S3C). The importance of CelA genes insecondary wall cellulose synthesis in developing cottonfibers has been reported by other researchers [16].Expression of CelA3 at 17 DPA was significantly higherin TM-1 than in Hai7124. However, strength droppedmuch faster in TM-1 (e.g., at 20 DPA, Additional file 6:Supplemental Figure S3E) than in Hai7124 after that,which more stable expression was detected over a longerperiod of time in Hai7124.Rac genes (coding for GTP-binding Rac proteins) are
involved in various physiological processes, includingcell polar growth [62-65], synthesis of the secondarywall [66-68], resistance response [69,70] and signaltransduction [71-73]. In the present study, RacAs werepredominantly expressed at the fiber elongation and sec-ondary wall synthesis stages (Additional file 6: Supple-mental Figure S3E), indicating that the role of RacAmay be similar to that of Rac13, which is involved inthe signal transduction pathway for cytoskeleton organi-zation [66]. Similarly, RacB was predominantlyexpressed at the secondary wall synthesis stage in TM-1,and preferentially expressed at the initiation of fiberdevelopment and secondary wall synthesis in Hai7124(Additional file 6: Supplemental Figure S3D), suggestingmultiple roles for RacB. Because RacA and RacB expres-sions were consistently higher at most stages in Hai7124relative to TM-1, the two genes may be contributing tofiber quality diversity.Sucrose synthase (Sus) affects initiation and elongation
of the single-celled fibers, and also has a major role incell wall cellulose synthesis [9,74-77]. Cotton fiber cellinitiation and elongation are very sensitive to changes inSus activity [9]. The expression peak of cotton sucrosesynthase genes transcripts was earlier in wild cotton thanin TM-1[60]. Our study showed that greater Sus1 expres-sion in Hai7124 than in TM-1 at initiation (0 and 1 DPA)and 8 DPA and at 3 and 5 DPA was reversed. At 20 DPA,Sus1 expression was significantly higher in TM-1, possi-bly as a result of earlier termination of fiber elongationand earlier initiation of cell wall synthesis in TM-1.Recent studies of comparative gene expression profil-
ing of isolated cotton fibers [60,78] have identified genescontrolling differences in fiber growth between wild anddomesticated cotton [e.g., genes encoding tubulin iso-forms, endotransglycosylase/hydrolases, cytochrome
P(450) monooxygenase, and antioxidant enzymes].These studies will provide new clues in the future stu-dies to better understand the interspecific divergence offiber development in the two cultivated tetraploid cottonspecies, G. barbadense and G. hirsutum.
Putative role of D-subgenome in interspecific divergenceMost genes (62.5% in TM-1 and 62.5% in Hai7124) exhib-ited a higher evolutionary rate in the D-subgenome thanin the A-subgenome, indicating that the D-subgenome ofthe allotetraploid evolved faster than the A-subgenome[59,79-82]. Considering the weight of evidence providedby genome-specific expression of homeologs, chromosomelocation of genes and QTL distribution for fiber qualities(Table 3), we also determined the subgenome transcrip-tome contribution in interspecific divergence betweenTM-1 and Hai7124. In the integration interval of genesand QTLs, the gene transcripts were significantly A-subge-nome biased, and the QTLs associated with fiber qualitieswere detected in corresponding A-subgenome chromo-some bins. Similarly, the gene transcripts were significantlyD-subgenome biased and relative fiber QTLs weredetected in corresponding D-subgenome chromosomebins. While the transcripts of CAP was significantlyA-subgenome biased in TM-1, but equally expressed inHai7124 in the fiber developmental period, implying animportant D-subgenome contribution for elite fiber qualitytraits in Hai7124. Integration of CAP duplicated loci withfiber length and strength QTLs in D13, indicates domesti-cation and artificial selection of tetraploid plants for super-ior fiber quality resulted in more significant evolutionarydynamics in the D-subgenome than in the A-subgenome.
ConclusionThe study provided us the systematic report on theinterspecific divergence for fiber development betweenGossypium barbadense and G. hirsutum by analyzingstructures, molecular evolution and transcripts levels offiber development-related genes. The results indicatedthat selective breeding for certain desirable fiber quali-ties may have played an important role in divergence ofthe two cultivated tetraploid cotton species.
MethodsPlant materialsOf the 17 genes selected for this study (Table 1) weredescribed in previous reports as being expressed indeveloping cotton fibers; their sequence information wasdeposited in GenBank. The orthologous loci of each ofthe 17 genes were isolated from two allotetraploid cot-tons, G. hirsutum acc. TM-1, G. barbadense cv.Hai7124, and living models of their two ancestral gen-ome donors, G. herbaceum var. africanum (A-genome)and G. raimondii Ulbrich (D-genome). For expression
Zhu et al. BMC Plant Biology 2011, 11:40http://www.biomedcentral.com/1471-2229/11/40
Page 11 of 15
analysis, developing cotton ovules and attached fiberswere harvested from three replicates of TM-1 andHai7124 on 0, 1, 3, 5, 8, 10, 14, 17, 20 and 23 days post-anthesis (DPA). The mapping population was comprisedof 138 BC1 individuals generated from the cross [(TM-1×Hai7124) ×TM-1] [19].
PCR amplification, cloning and sequencingBased on GenBank deposited sequences, gene-specificPCR primer pairs were individually designed for PCR-amplification of full-length sequences of the 17 genes.For the smaller genes, we designed one primer pair; atleast two nested primer pairs were designed for the lar-ger genes (Additional file 1: Supplemental Table S1).Standard polymerase chain reaction (PCR) was com-
pleted using High-fidelity ExTaq DNA polymerase(TaKaRa Biotechnology (Dalian) Co., Ltd., China). ThePCR products were cloned into pMD18-T Vector(TaKaRa) according to the manufacturer’s instructions,and sequenced from plasmid DNA templates. In orderto obtain the sequence from both the A-subgenome andD-subgenome, at least 10 clones for each gene from eachof the tetraploid species, TM-1 and Hai7124, were pickedrandomly and sequenced. Homeologs were identified bycomparison to sequences from their diploid progenitors.To avoid possible complications originating from PCRrecombination in allopolyploid cotton [83], a minimum ofthree clones was used to determine the gene sequence ineach duplicated copy. In cases where PCR recombinationoccurred, 10 additional clones were sequenced to verifythe corresponding correct sequence [83]. When the copynumber of genes was difficult to identify by sequencing, itwas confirmed by southern blot analysis.Lengths were determined using alignment analysis,
which was applied to each relevant sequence of applic-able gene. For genes with one primer pair, the A- andD-subgenome sequences were clustered using theNeighbor-Joining method in MEGA3.1 http://www.megasoftware.net/. For those genes having more thanone primer pair, sequence segments from the same gen-omes and subgenomes were contiged by CAP3 software.
Gene structure and phylogenetic analysesSix DNA sequences for each gene, including homeologsand orthologs, isolated from the four species (A-,D-genome and the A and D subgenome from the allote-traploid), were aligned by ClustalX http://www.ebi.ac.uk/Tools/msa/clustalw2/. Based on the sequences of geno-mic DNA and the cDNA, the structure of each genewas illustrated by the Gene Structure Display Server(GSDS, http://gsds.cbi.pku.edu.cn/chinese.php). Phyloge-netic analyses of the orthologs for each gene were per-formed using the Neighbor-Joining method in MEGA3.1http://www.megasoftware.net/.
Chromosomal locationIn order to locate all 17 pairs of homeologs on ourgenetic map, PCR primers were designed according tothe sequence size difference between the two allotetra-ploid cottons (Additional file 4: Supplemental Table S2).For homeologs with no size polymorphism, single-nucleotide amplified polymorphism (SNAP) primerswere designed based on a SNP between the TM-1 andHai7124 sequences at a putative locus (Additional file 5:Supplemental Table S3). SNAP is a modified allele-spe-cific amplified method, it introduce an additional basepair change in the primer to increase the specificity ofthe primer [84]. All SNAP primers was designed follow-ing Drenkard et al. [84] and using SNAPER http://ausu-bellab.mgh.harvard.edu.All the primer pairs exhibiting polymorphisms
between TM-1 and Hai7124 were used to survey 138individuals of the BC1 mapping population. The poly-morphic loci were integrated in our backbone map [22]using Joinmap 3.0 software [85].
Evolution and ratios of sequence formsFor each gene, synonymous substitution rates (Ks),nonsynonymous substitution rates (Ka) and their ratios(Ka/Ks) in various comparisons among the four species(A1 VS D5, A1 VS At, D5 VS Dt, At VS Dt) were calcu-lated for the coding region using KaKs_Calculatorhttp://sourceforge.net/projects/kakscalculator2/. Ks isthe rate of evolution and the Ka/Ks ratio indicates theselective force acting on the protein [86]. A Ka/Ksratio of 1 represents neutral evolution, that is, thenumber of nonsynonymous changes at each possiblenonsynonymous site is the same as the number ofsynonymous changes per synonymous site. Ka/Ks < 1indicates a purifying selection (selection generally elim-inates deleterious mutations and maintains protein sta-tus quo); Ka/Ks > 1 indicates positive selection, whereselection may be modifying the protein. The higher theratio is, the stronger the evidence that selection isoccurring.
Development of homeolog-specific PCR primer pairsHomeolog-specific primers were designed and appliedbased on sequence differences between duplicated loci(Additional file 7: Supplemental Table S4). Specificity ofthose primers was detected by PCR amplification of geno-mic DNA from G. herbaceum (A-genome), G. raimondii(D-genome), TM-1 and Hai7124. Primers specific for theA-genome resulted in amplifications from G. herbaceum,TM-1 and Hai7124, but not from G. raimondii, whichindicated that the amplification products of TM-1 andHai7124 were from their A-subgenomes. Conversely,the D-genome specific primers only amplified fromG. raimondii and D-subgenome of the allopolyploid.
Zhu et al. BMC Plant Biology 2011, 11:40http://www.biomedcentral.com/1471-2229/11/40
RNA isolation and Q-PCR analysisTotal RNA was extracted from young fibers of G. hirsutumacc. TM-1 and G. barbadense cv. Hai7124 at 0, 1, 3, 5, 8,10, 14, 17, 20 and 23 DPA using the CTAB-acid phenolextraction method [87]. RNA samples were treated withDNase I (Ambion, Austin, TX, USA) according to manu-facturer’s instructions to remove trace contaminants ofgenomic DNA. Total RNA samples (1 μg per reaction)were reversely transcribed into cDNAs by avian myeloblas-tosis virus (AMV) reverse transcriptase, and the cDNAswere used as templates in Q-PCR reactions.For each gene, the homeolog-specific primers were
designed based on the SNP between A- and D-subge-nome homeologs (Additional file 7: Supplemental TableS4). A cotton elongation factor (EF1a) gene was used asa standard control in the Q-PCR reactions (Additionalfile 7: Supplemental Table S4). The Q-PCR reaction andcalculated relative value for expression level of eachhomeolog were determined as described by Wang et al.[8]. The information of the Q-PCR analysis based onthe MIQE checklist was submitted in Additional file 8.
Additional material
Additional file 1: Table S1. Primer pairs used for amplifying the full-length genomic sequences of each gene.
Additional file 2: Figure S1. Structure analysis of fiber development-related genes in four cotton species. A: G. herbaceum L. var. africanum; D:G. raimondii Ulbr; TM-1-At: A subgenome of G. hirsutum L. acc. TM-1; TM-1-Dt: D subgenome of G. hirsutum L. acc. TM-1; 7124-At: A subgenomeof G. barbadense L. cv. 7124; 7124-Dt: D subgenome of G. barbadense L.cv. 7124. A. Orthologs having the same structures among four differentcotton species. B. Orthologs having different structures among fourdifferent cotton species.
Additional file 3: Figure S2. The phylogenetic trees of 17 genes in fourcotton species. Bootstrap values (%) based on 1000 replicates areindicated beside the nodes. A. Genes that evolved independentlybetween the A- and D-subgenomes. B. Genes that evolved throughdifferent degrees of colonization between the A- and D-subgenome.
Additional file 4: Table S2. PCR primer pairs used for gene location.
Additional file 5: Table S3. SNP primer pairs used for gene location.
Additional file 6: Figure S3. Q-PCR analysis for total expression ofgenes. Significant differences between TM-1 and Hai7124 at the samestages indicated by * P > 0.05, ** P > 0.01. Vertical bars representedstandard deviation (STD). A. Genes expressed preferentially at fiberinitiation and early elongation (0-8 DPA). B. Genes expressedpreferentially at fiber elongation (3-17 DPA). C. Genes expressedpreferentially at primary-secondary transition (17-23 DPA). D. Genesexpressed both at fiber initiation and early elongation period (0-8DPA)and secondary cell wall thickening period (20-23DPA). E. Genesexpressed coving the whole fiber developmental period.
AcknowledgementsWe thank RJ Kohel at U. S. Department of Agriculture-Agricultural ResearchService, Southern Plains Agricultural Research Center, ZJ Chen at Institute forCellular and Molecular Biology and Center for Computational Biology andBioinformatics, University of Texas, and JE Zalapa at Department ofHorticulture, University of Wisconsin for helpful comments and key editing.This program was financially supported in part by National ScienceFoundation in China (30730067), the State Key Basic Research andDevelopment Plan of China (2011CB109300), Natural Science Foundation inJiangsu Province (BK2008036), the National High-tech Program(2006AA10Z111), and the Program for 111 project (B08025).
Authors’ contributionsExperiments were designed by WZG with suggestions from TZZ. WZG andHYZ conceived the experiments and analyzed the results. HYZ carried outmost of the experiments and all computational analyses. Q-PCR Analysis wasperformed by XYH. JHL, LZ, and XYX participated in part of experiments.HYZ and WZG drafted the manuscript and TZZ revised the manuscript. Allauthors read and approved the final manuscript.
Received: 26 October 2010 Accepted: 25 February 2011Published: 25 February 2011
References1. Brubaker CL, Bourland FM, Wendel JF: The origin and domestication of
cotton. In Cotton: origin, history, technology and production. Volume 1. 1edition. Edited by: Smith WC, Cothren TJ. New York: John Wiley and Sons;1999:3-31.
2. NCCoA: World cotton database. National Cotton Council of America; 2006[http://www.cotton.org/econ/cropinfo/cropdata/index.cfm].
3. Stephens SG: The genetics of ‘’Corky’’. The New World alleles and theirpossible role as an interspecific isolating mechanism. J Genet 1946,47:150-161.
4. Chee P, Draye X, Jiang CX, Decanini L, Delmonte TA, Bredhauer R,Smith CW, Paterson AH: Molecular dissection of interspeciffic variationbetween Gossypium hirsutum and G. barbadense (cotton) by a backcross-self approach: I. Fiber elongation. Theor Appl Genet 2005, 111:757-763.
5. Basra AS, Malik CP: Development of the cotton fiber. Int Rev Cytol 1984,89:65-113.
6. Shi HY, Wang XL, Li DD, Tang WK, Wang H, Xu WL, Li XB: Molecularcharacterization of cotton 14-3-3L gene preferentially expressed duringfiber elongation. J Genet and Genomics 2007, 34:151-159.
7. Yoder MD, Keen NT, Jurnak F: New domain motif: the structure of pectatelyase c, a secreted plant virulence factor. Science 1993, 260:1503-1507.
8. Wang HH, Guo Y, Lv FN, Zhu HY, Wu SJ, Jiang YJ, Li FF, Zhou BL, Guo WZ,Zhang TZ: The essential role of GhPEL gene, encoding a pectate lyase incell wall loosening by depolymerization of the de-esterified pectinduring fiber elongation in cotton. Plant Mol Biol 2010, 72:397-406.
10. Ma GJ, Zhang TZ, Guo WZ: Cloning and characterization of cotton GhBGgene encoding B-glucosidase. DNA Sequence 2006, 17:355-362.
11. Pear JR, Kawagoe Y, Schreckengost WE, Delmer DP, Stalker DM: Higherplants contain homologs of the bacterial celA genes encoding thecatalytic subunit of cellulose synthase. Proc Natl Acad Sci USA 1996,93:12637-12642.
12. Li XB, Xiao YH, Luo M, Hou L, Li DM, Luo XY, Pei Y: Cloning andexpression analysis of two Rac genes from cotton (Gossypium hirsutumL.). Acta Genetica Sinica 2005, 32:72-78.
13. Li XB, Fan XP, Wang XL, Cai L, Yang WC: The cotton ACTIN1 gene isfunctionally expressed in fibers and participates in fiber elongation.Plant Cell 2005, 17:859-875.
14. Orford SJ, Timmis JN: Specific expression of an expansin gene duringelongation of cotton fibers. Biochin Biophy Acta 1998, 1398:342-346.
15. Laosinchai W, Cui X, Brown RM: A full cDNA of cotton cellulose synthasehas high homology with the Arabidopsis RSW1 gene and cotton CelA1(Accession No. AF 200453) (PGR 00-002). Plant Physiol 2000, 122:291.
16. Cui X, Shin H, Song C, Laosinchai W, Amano Y, Brown RM: A putative planthomolog of the yeast beta-1, 3-glucan synthase subunit FKS1 fromcotton (Gossypium hirsutum L.) fibers. Planta 2001, 213:223-230.
Zhu et al. BMC Plant Biology 2011, 11:40http://www.biomedcentral.com/1471-2229/11/40
17. Gao P, Zhao PM, Wang J, Wang HY, Wu XM, Xia GX: Identification ofgenes preferentially expressed in cotton fibers: A possible role ofcalcium signaling in cotton fiber elongation. Plant Sci 2007, 173:61-69.
18. He YJ, Guo WZ, Shen XL, Zhang TZ: Molecular cloning andcharacterization of a cytosolic glutamine synthetase gene, a fiberstrength-associated gene in cotton. Planta 2008, 228:473-483.
19. Song XL, Wang K, Guo WZ, Zhang J, Zhang TZ: A comparison of geneticmaps constructed from haploid and BC1 mapping populations from thesame crossing between Gossypium hirsutum L.×G. barbadense L. Genome2005, 48:378-390.
20. Han ZG, Guo WZ, Song XL, Zhang TZ: Genetic mapping of EST-derivedmicrosatellites from the diploid Gossypium arboreum in allotetraploidcotton. Mol Genet Genomics 2004, 272:308-327.
21. Han ZG, Wang CB, Song XL, Guo WZ, Guo JY, Li CH, Chen XY, Zhang TZ:Characteristics, development and mapping of Gossypium hirsutumderived EST-SSR in allotetraploid cotton. Theor Appl Genet 2006,112:430-439.
22. Guo WZ, Cai CP, Wang CB, Han ZG, Song XL, Wang K, Niu XW, Wang C,Lu KY, Shi B, Zhang TZ: A microsatellite-based, gene-rich linkage mapreveals genome structure, function, and evolution in Gossypium. Genetics2007, 176:527-541.
23. Armel S, Flagel L, Ying B, Udall JA, Wendel JF: Homoeologousnonreciprocal recombination in polyploid cotton. New Phytologist 2010,186:123-134.
24. Frelichowski JE Jr, Palmer MB, Main D, Tomkins JP, Cantrell RG, Stelly DM,Yu J, Kohel RJ, Ulloa M: Cotton genome mapping with newmicrosatellites from Acala ‘Maxxa’ BAC-ends. Mol Gen Genomics 2006,275:479-491.
25. He DH, Lin ZX, Zhang XL, Nie YC, Guo XP, Zhang YX, Li W: QTL mappingfor economic traits based on a dense genetic map of cotton with PCR-based markers using the interspecific cross of Gossypium hirsutum ×Gossypium barbadense. Euphytica 2007, 153:181-197.
27. Lin Z, He D, Zhang X, Nie Y, Guo X, Feng C, Stewart JM: Linkage mapconstruction and mapping QTL for cotton fiber quality using SRAP, SSRand RAPD. Plant Breeding 2005, 124:180-187.
28. Luan M, Guo X, Zhang Y, Yao J, Chen W: QTL mapping for agronomic andfiber traits using two interspecific chromosome substitution lines ofupland cotton. Plant Breding 2009, 128:671-679.
29. Qin HD, Guo WZ, Zhang YM, Zhang TZ: QTL mapping of yield and fibertraits based on a four-way cross population in Gossypium hirsutum L.Theor Appl Genet 2008, 117:883-894.
30. Shen XL, Guo WZ, Zhu XF, Yuan YL, Yu JZ, Kohel RJ, Zhang TZ: Molecularmapping of QTLs for fiber qualities in three diverse lines in Uplandcotton using SSR markers. Mol Breeding 2005, 15:169-181.
31. Shen XL, Zhang TZ, Guo WZ, Zhu XF, Zhang XY: Mapping fiber and yieldQTLs with main, epistatic, and QTL x Environment interaction effects inrecombinant inbred lines of Upland cotton. Crop Sci 2006, 46:61-66.
32. Shen XL, Guo WZ, Lu QX, Zhu XF, Yuan YL, Zhang TZ: Genetic mapping ofquantitative trait loci for fiber quality and yield trait by RIL approach inUpland cotton. Euphytica 2007, 155:371-380.
33. Wang BH, Guo WZ, Zhu XF, Wu YT, Huang NT, Zhang TZ: QTL mapping offiber quality in an elite hybrid derived-RIL population of upland cotton.Euphytica 2006, 152:367-378.
34. Zhang ZS, Hu MC, Zhang J, Liu DJ, Zheng J, Zhang K, Wang W, Wan Q:Construction of a comprehensive PCR-based marker linkage map andQTL mapping for fiber quality traits in upland cotton (Gossypiumhirsutum L.). Mol Breeding 2009, 24:49-61.
35. Cronn RC, Small RL, Wendel JF: Duplicated genes evolve independentlyfollowing polyploid formation in cotton. Proc Natl Acad Sci USA 1999,96:14406-14411.
36. Ruan YL, Lewellyn DJ, Furbank RT: The control of single-celled cottonfiber elongation by developmentally reversible gating of plasmadesmataand coordinated expression of sucrose and K+ transporters andexpansin. Plant Cell 2001, 13:47-60.
37. Nei M, Gu X, Sitnikova T: Evolution by the birth-and-death process inmultigene families of the vertebrate immune system. Proc Natl Acad SciUSA 1997, 94:7799-7806.
38. Petrov DA, Chao YC, Stephenson EC, Hartl DL: Pseudogene evolution inDrosophila suggest high rate of DNA loss. Mol Biol Evol 1998, 15:1562-1567.
39. Force A, Lynch M, Pickett FB, Amores A, Yan YL, Postlethwait J:Preservation of duplicate genes by complementary, degenerativemutations. Genetics 1999, 151:1531-1545.
40. Blumensteil JP, Hartl DL, Lozovsky ER: Patterns of insertion and deletion incontrasting chromatin domains. Mol Biol Evol 2002, 19:2211-2225.
41. Lynch M, Conery JS: The origins of genome complexity. Science 2003,302:1401-1404.
42. Kondrashov FA, Kondrashov AS: Role of selection in fixation of geneduplications. J Theor Biol 2006, 239:141-151.
43. Lynch M, Force A: The probability of duplicate-gene preservation bysubfunctionalization. Genetics 2000, 154:459-473.
44. Lynch M, O’Hely M, Walsh B, Force A: The probability of preservation of anewly arisen gene duplicate. Genetics 2001, 159:1789-1804.
45. Clark AG: Invasion and maintenance of a gene duplication. Proc Natl AcadSci USA 1994, 91:2950-2954.
46. Walsh JB: How often do duplicated genes evolve new fuctions? Genetics1995, 139:421-428.
47. Bergthorsson U, Andersson DI, Roth JR: Ohno’s dilemma: evolution of newgenes under continuous selection. Proc Natl Acad Sci USA 2007,104:17004-17009.
48. Adams KL, Cronn R, Percifield R, Wendel JF: Genes duplicated bypolyploidy show unequal contributions to the transcriptome and organ-specific reciprocal silencing. Proc Natl Acad Sci USA 2003, 100:4649-4654.
49. Adams KL, Percifield R, Wendel JF: Organ-specific silencing of duplicatedgenes in a newly synthesized cotton allotetraploid. Genetics 2004,168:2217-2226.
50. Adams KL, Wendel JF: Allele-specific, bidirectional silencing of an alcoholdehydrogenase gene in different organs of interspecific diploid cottonhybrids. Genetics 2005, 171:2139-2142.
51. Udall JA, Swanson JM, Nettleton D, Percifield RJ, Wendel JF: A novelapproach for characterizing expression levels of genes duplicated bypolyploidy. Genetics 2006, 173:1823-1827.
52. Samuel Yang S, Cheung F, Lee JJ, Ha M, Wei NE, Sze SH, Stelly DM,Thaxton P, Triplett B, Town CD, Jeffrey Chen Z: Accumulation of genome-specific transcripts, transcription factors and phytohormonal regulatorsduring early stages of fiber cell development in allotetraploid cotton.Plant J 2006, 47:761-775.
55. Chaudhary B, Flagel L, Stupar RM, Udall JA, Verma N, Springer NM,Wendel JF: Reciprocal silencing, transcriptional bias and functionaldivergence of homeologs in polyploid cotton (Gossypium). Genetics 2009,182:503-517.
56. Raven P, Evert R, Eichhorn S: Biology of Plants New York: Worth Publisherspress; 1992.
57. Endrizzi JE, Turcotte EL, Kohel RJ: Genetics, cytology, and evolution ofGossypium. Adv Genet 1985, 23:271-375.
58. Wendel JF: New world tetraploid cottons contain Old World cytoplasm.Proc Natl Acad Sci USA 1989, 86:4132-4136.
59. Zhu HY, Zhang TZ, Yang LM, Guo WZ: EST-SSR sequences revealed therelationship of D-genome in diploid and tetraploid Species inGossypium. Plant Sci 2009, 176:397-405.
60. Rapp RA, Haigler CH, Flagel L, Hovav RH, Udall JA, Wendel JF: Geneexpression in developing fibres of Upland cotton (Gossypium hirsutumL.) was massively altered by domestication. BMC Biology 2010, 8:139.
61. Voigt J, Frank R: 14-3-3 proteins are constituents of the insolubleglycoprotein framework of the chlamydomonas cell wall. Plant Cell 2003,15:1399-1413.
62. Li H, Wu G, Ware D, Davis KR, Yang ZB: Arabidopsis Rho-related GTPases:differential gene expression in pollen and polar localization in fissionyeast. Plant Physiol 1998, 118:407-417.
63. Kost B, Lemiche E, Spielhofer P, Hong Y, Tolias K, Carpenter C, Chua NH:Rac homologues and compartmentalized phosphatidylinositol 4, 52bisphosphate act in a common pathway to regulate polar pollen tubegrowth. J Cell Biol 1999, 145:317-330.
Zhu et al. BMC Plant Biology 2011, 11:40http://www.biomedcentral.com/1471-2229/11/40
64. Molendijk AJ, Bischoff F, Rajendrakumar CSV, Friml J, Braun M, Gilroy S,Palme K: Arabidopsis thaliana Rop GTPase are localized to tips of roothairs and control polar growth. EMBO J 2001, 20:2279-2288.
65. Jones MA, Shen JJ, Fu Y, Li H, Yang ZB, Grierson CS: The Arabidopsis Rop-GTPase is a positive regulator of both root hair initiation and tipGrowth. Plant Cell 2002, 14:763-776.
66. Delmer DP, Pear JR, Andrawis A, Stalker DM: Genes encoding small GTP-binding proteins analogous to mammalian rac are preferentiallyexpressed in developing cotton fibers. Mol Gen Genet 1995, 248:43-51.
67. Potikha TS, Collins CC, Johnson DJ, Delmer DP, Levine A: The involvementof hydrogen peroxide in the differentiation of secondary walls in cottonfibers. Plant Physiol 1999, 119:849-858.
68. Nakanomyo I, Kost B, Chua NH, Fukuda H: Preferential and asymmetricalaccumulation of a Rac small GTPase mRNA in differentiating xylem cellsof Zinnia elegans. Plant Cell Physiol 2002, 43:1484-1492.
69. Kawasaki T, Henmi K, Ono E, Hatakeyama S, Iwano M, Satoh H,Shimamoto K: The small GTP-binding protein rac is a regulator of celldeath in plants. Proc Natl Acad Sci USA 1999, 96:10922-10926.
70. Ono E, Wong HL, Kawasaki T, Hasegawa M, Kodama O, Shimamoto K:Essential role of the small GTPase Rac in disease resistance of rice. ProcNatl Acad Sci USA 2001, 98:759-764.
71. Li H, Shen JJ, Zheng ZL, Lin YK, Yang ZB: The Rop GTPase switch controlsmultiple developmental processes in Arabidopsis. Plant Physiol 2001,126:670-684.
72. Tao LZ, Cheung AY, Wu HM: Plant Rac-like GTPases are activated byauxin and mediate auxin-responsive gene expression. Plant Cell 2002,14:2745-2760.
73. Zheng ZL, Nafisi M, Arvin T, Li H, Crowell DN, Chary SN, Schroeder JI,Shen JJ, Yang ZB: Plasma membrane-associated ROP10 small GTPase is aspecific negative regulator of abscisic acid responses in Arabidopsis.Plant Cell 2002, 14:2787-2797.
74. Amor Y, Haigler CH, Johnson S, Walnscott M, Delmer DP: A membrane-associated form of Sus and its potential role in synthesis of celluloseand callose in plants. Proc Natl Acad Sci USA 1995, 92:9353-9357.
75. Nolte KD, Hendrix DL, Radin JW, Koch KE: Sucrose synthase localizationduring initiation of seed development and trichome differentiation incotton ovules. Plant Physiol 1995, 109:1285-1293.
76. Ruan YL, Chourey PS, Delmer DP, Perez-Grau L: The differential expressionof sucrose synthase in relation to diverse patterns of carbon portioningin developing cotton seed. Plant Physiol 1997, 115:375-385.
77. Ruan YL, Chourey PS: A fiberless seed mutation in cotton is associatedwith lack of fiber cell initiation in ovule epidermis and alterations insucrose synthase expression and carbon partitioning in developingseeds. Plant Physiol 1998, 118:399-406.
78. Chaudhary B, Hovav R, Flagel L, Mittler R, Wendel JF: Parallel expressionevolution of oxidative stress-related genes in fiber from wild anddomesticated diploid and polyploidy cotton (Gossypium). BMC Genomics2009, 10:378.
79. Small RL, Ryburn JA, Wendel JF: Low levels of nucleotide diversity athomoelogous Adh loci in allotetraploid cotton (Gossypium L.). Mol BiolEvol 1999, 16:491-501.
80. Liu Q, Brubaker CL, Green AG, Marshall DR, Sharp PJ, Singh SP: Evolution ofthe FAD2-1 fatty acid desaturase 5’UTR intron and the molecularsystematics of Gossypium (Malvaceae). Am J Bot 2001, 88:92-102.
81. Small RL, Wendel JF: Differential evolutionary dynamics of duplicatedparalogous Adh loci in alloteraploid cotton (Gossypium). Mol Biol Evol2002, 19:597-607.
82. An C, Saha S, Jenkins JN, Ma DP, Scheffler BE, Kohel RJ, Yu JZ, Stelly DM:Cotton (Gossypium spp.) R2R3-MYB transcription factors SNPidentification, phylogenomic characterization, chromosome localization,and linkage mapping. Theor Appl Genet 2008, 116:1015-1026.
83. Cronn RC, Small RL, Haselkorn T, Wendel JF: Rapid diversification of thecotton genus (Gossypium: Malvaceae) revealed by analysis of sixteennuclear and chloroplast gene. Am J Bot 2002, 89:707-725.
84. Drenkard E, Richter BG, Rozen S, Stutius LM, Angell NA, Mindrinos M,Cho RJ, Oefner PJ, Davis RW, Ausubel FM: A simple procedure for theanalysis of single nucleotide polymorphisms facilitates Map-BasedCloning in Arabidopsis. Plant Physiol 2000, 124:1483-1492.
85. Van-Ooijen JW, Vorrips RE: JoinMapR Version 3.0: Software for theCalculation of Genetic Linkage Maps. CPRO-DLO, Wageningen; 2001.
86. Hurst LD: The Ka/Ks ratio: diagnosing the form of sequence evolution.TRENDS in Genetics 2002, 91:8486-487.
87. Jiang JX, Zhang TZ: Extraction of total RNA in cotton tissues with CTAB-acidic phenolic method. Cotton Sci 2003, 15:166-167.
doi:10.1186/1471-2229-11-40Cite this article as: Zhu et al.: Structure, expression differentiation andevolution of duplicated fiber developmental genes in Gossypiumbarbadense and G. hirsutum. BMC Plant Biology 2011 11:40.
Submit your next manuscript to BioMed Centraland take full advantage of:
• Convenient online submission
• Thorough peer review
• No space constraints or color figure charges
• Immediate publication on acceptance
• Inclusion in PubMed, CAS, Scopus and Google Scholar
• Research which is freely available for redistribution
Submit your manuscript at www.biomedcentral.com/submit
Zhu et al. BMC Plant Biology 2011, 11:40http://www.biomedcentral.com/1471-2229/11/40