Outline Stellar Populations Classification Surface photometry STRUCTURE OF GALAXIES 2. Stellar Populations, classification, surface photometry Piet van der Kruit Kapteyn Astronomical Institute University of Groningen the Netherlands February 2010 Piet van der Kruit, Kapteyn Astronomical Institute Stellar Populations, classification, surface photometry
Transcript
OutlineStellar Populations
ClassificationSurface photometry
STRUCTURE OF GALAXIES2. Stellar Populations, classification, surface photometry
Piet van der KruitKapteyn Astronomical Institute
University of Groningenthe Netherlands
February 2010
Piet van der Kruit, Kapteyn Astronomical Institute Stellar Populations, classification, surface photometry
OutlineStellar Populations
ClassificationSurface photometry
Outline
Stellar PopulationsOrigin of the conceptVatican SymposiumThe current situation
ClassificationDefinition by Hubble and later extensionsCorrelations along the Hubble sequenceOther classification systems
Surface photometryPhotographic surface photometryDigital surface photometryExamples of surface photometry
Piet van der Kruit, Kapteyn Astronomical Institute Stellar Populations, classification, surface photometry
OutlineStellar Populations
ClassificationSurface photometry
Origin of the conceptVatican SymposiumThe current situation
Stellar Populations
Piet van der Kruit, Kapteyn Astronomical Institute Stellar Populations, classification, surface photometry
OutlineStellar Populations
ClassificationSurface photometry
Origin of the conceptVatican SymposiumThe current situation
Origin of the concept
Lindblad1 in 1925 argued that the Galaxy is made up of a set ofcomponents with a continuous range of flattening.
Baade2 in 1944 resolved red stars in the central regions of M32and the elliptical companions and introduces the concept of twostellar populations, mainly based on the characteristics of their H-Rdiagrams. Population I is in the disk and has blue stars and
Population II in the halo with globular cluster type H-R diagramswith red stars the brightest.
Piet van der Kruit, Kapteyn Astronomical Institute Stellar Populations, classification, surface photometry
OutlineStellar Populations
ClassificationSurface photometry
Origin of the conceptVatican SymposiumThe current situation
Piet van der Kruit, Kapteyn Astronomical Institute Stellar Populations, classification, surface photometry
OutlineStellar Populations
ClassificationSurface photometry
Origin of the conceptVatican SymposiumThe current situation
Piet van der Kruit, Kapteyn Astronomical Institute Stellar Populations, classification, surface photometry
OutlineStellar Populations
ClassificationSurface photometry
Origin of the conceptVatican SymposiumThe current situation
Piet van der Kruit, Kapteyn Astronomical Institute Stellar Populations, classification, surface photometry
OutlineStellar Populations
ClassificationSurface photometry
Origin of the conceptVatican SymposiumThe current situation
The Galaxy as consisting of two basic populations can be seen inthe distribution on the sky of globular (red) versus galactic clusters.
Piet van der Kruit, Kapteyn Astronomical Institute Stellar Populations, classification, surface photometry
OutlineStellar Populations
ClassificationSurface photometry
Origin of the conceptVatican SymposiumThe current situation
and in the near-infrared image of the Galaxy with the DIRBEexperiment on board the Cosmic Background Explorer COBE.
Piet van der Kruit, Kapteyn Astronomical Institute Stellar Populations, classification, surface photometry
OutlineStellar Populations
ClassificationSurface photometry
Origin of the conceptVatican SymposiumThe current situation
Vatican Symposium
In 1957 the Vatican Symposium on stellar populations defined fivestellar populations with a decreasing age, increasing flattening andincreasing metal abundance.
Population |z| |Vz| Typical members(pc) (km/s)
Extreme Pop. I 120 8 Gas, Young stars associated with spiral structure,Supergiants, Cepheids, T Tauri stars, GalacticClusters of Trumpler’s Class I
Older Pop. I 160 10 A-Type stars, Strong-line starsDisk Population 400 17 Stars of galactic nucleus, Planetary Nebulae, no-
vae, RR Lyrae stars with periods below 0.4 days,Weak-line stars
Interm. Pop. II 700 25 “High-velocity stars” with z-velocities exceeding30 km/sec, Long-period variables <M5e with pe-riods below 250 days
Halo Pop. II 2000 75 Subdwarfs, Globular clusters with high z-velocity,RR Lyrae stars with periods longer than 0.4 days
Piet van der Kruit, Kapteyn Astronomical Institute Stellar Populations, classification, surface photometry
OutlineStellar Populations
ClassificationSurface photometry
Origin of the conceptVatican SymposiumThe current situation
The current situation.
I Dark halo, presumably non-baryonic.
I Population II.
I Thick disk.
I Old disk, sometimes called thin disk.
I Population I.
Piet van der Kruit, Kapteyn Astronomical Institute Stellar Populations, classification, surface photometry
OutlineStellar Populations
ClassificationSurface photometry
Definition by Hubble and later extensionsCorrelations along the Hubble sequenceOther classification systems
Classification
Piet van der Kruit, Kapteyn Astronomical Institute Stellar Populations, classification, surface photometry
OutlineStellar Populations
ClassificationSurface photometry
Definition by Hubble and later extensionsCorrelations along the Hubble sequenceOther classification systems
Definition by Hubble and later extensions
Classification systems have been described in detail by AllanSandage in Volume IX of “Stars and Stellar Systems”3.
The Hubble classification scheme starts with Hubble’s scheme ofthe 1920’s (his well-known tuning fork).
3Available at http://nedwww.ipac.caltech.edu/level5/Sandage/frames. htmlPiet van der Kruit, Kapteyn Astronomical Institute Stellar Populations, classification, surface photometry
OutlineStellar Populations
ClassificationSurface photometry
Definition by Hubble and later extensionsCorrelations along the Hubble sequenceOther classification systems
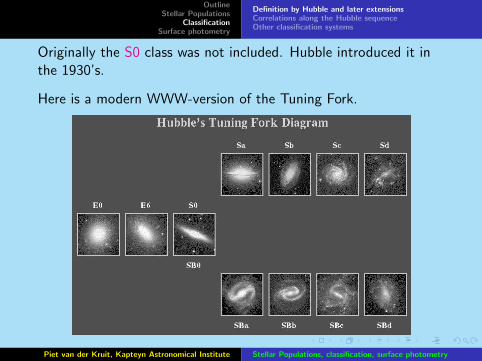
Originally the S0 class was not included. Hubble introduced it inthe 1930’s.
Here is a modern WWW-version of the Tuning Fork.
Piet van der Kruit, Kapteyn Astronomical Institute Stellar Populations, classification, surface photometry
OutlineStellar Populations
ClassificationSurface photometry
Definition by Hubble and later extensionsCorrelations along the Hubble sequenceOther classification systems
The Hubble Classification System has the following criteria:
I Ellipticals – E0 to E7 depending on the apparent flattening(En with n = 10× (a− b)/a).
I Spirals either with or without a bar (S or SB) and subclasses ato c depending on
I Bulge-to-disk ratioI Pitch angle of spiral armsI Development of arms (“strength” of HII regions)
I Irregulars Irr
The following figures from Sandage’s paper illustrate the system.
Piet van der Kruit, Kapteyn Astronomical Institute Stellar Populations, classification, surface photometry
OutlineStellar Populations
ClassificationSurface photometry
Definition by Hubble and later extensionsCorrelations along the Hubble sequenceOther classification systems
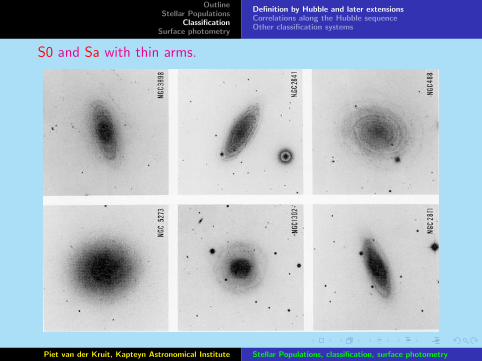
S0 and Sa with thin arms.
Piet van der Kruit, Kapteyn Astronomical Institute Stellar Populations, classification, surface photometry
OutlineStellar Populations
ClassificationSurface photometry
Definition by Hubble and later extensionsCorrelations along the Hubble sequenceOther classification systems
Sb and Sc with thin arms.
Piet van der Kruit, Kapteyn Astronomical Institute Stellar Populations, classification, surface photometry
OutlineStellar Populations
ClassificationSurface photometry
Definition by Hubble and later extensionsCorrelations along the Hubble sequenceOther classification systems
Sa to Sc with heavy arms.
Piet van der Kruit, Kapteyn Astronomical Institute Stellar Populations, classification, surface photometry
OutlineStellar Populations
ClassificationSurface photometry
Definition by Hubble and later extensionsCorrelations along the Hubble sequenceOther classification systems
Irregulars Irr , later called Sd and Sm.
Piet van der Kruit, Kapteyn Astronomical Institute Stellar Populations, classification, surface photometry
OutlineStellar Populations
ClassificationSurface photometry
Definition by Hubble and later extensionsCorrelations along the Hubble sequenceOther classification systems
Spirals with small bars (SAB).
Piet van der Kruit, Kapteyn Astronomical Institute Stellar Populations, classification, surface photometry
OutlineStellar Populations
ClassificationSurface photometry
Definition by Hubble and later extensionsCorrelations along the Hubble sequenceOther classification systems
Spirals with heavy bars (SB).
Piet van der Kruit, Kapteyn Astronomical Institute Stellar Populations, classification, surface photometry
OutlineStellar Populations
ClassificationSurface photometry
Definition by Hubble and later extensionsCorrelations along the Hubble sequenceOther classification systems
It is not possible to classify interacting galaxies.
Piet van der Kruit, Kapteyn Astronomical Institute Stellar Populations, classification, surface photometry
OutlineStellar Populations
ClassificationSurface photometry
Definition by Hubble and later extensionsCorrelations along the Hubble sequenceOther classification systems
Some pictures of galaxies with modern telescopes.
Piet van der Kruit, Kapteyn Astronomical Institute Stellar Populations, classification, surface photometry
OutlineStellar Populations
ClassificationSurface photometry
Definition by Hubble and later extensionsCorrelations along the Hubble sequenceOther classification systems
A set of pictures of edge-on galaxies along the Hubble sequence.
Piet van der Kruit, Kapteyn Astronomical Institute Stellar Populations, classification, surface photometry
OutlineStellar Populations
ClassificationSurface photometry
Definition by Hubble and later extensionsCorrelations along the Hubble sequenceOther classification systems
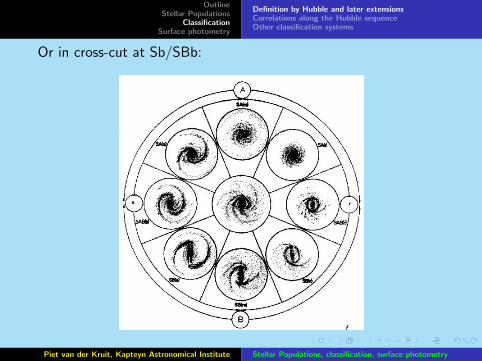
De Vaucouleurs later introduced Sd and Im (“Magellanicirregulars) to replace many of the Irr. Also he used theintermediate classification SAB.
He also introduced the varieties r (arms begin from an internalring, often at the end of a bar) and s (no internal ring).His three-dimensional system then looked as follows.
Piet van der Kruit, Kapteyn Astronomical Institute Stellar Populations, classification, surface photometry
OutlineStellar Populations
ClassificationSurface photometry
Definition by Hubble and later extensionsCorrelations along the Hubble sequenceOther classification systems
Or in cross-cut at Sb/SBb:
Piet van der Kruit, Kapteyn Astronomical Institute Stellar Populations, classification, surface photometry
OutlineStellar Populations
ClassificationSurface photometry
Definition by Hubble and later extensionsCorrelations along the Hubble sequenceOther classification systems
There are also disturbed and interacting galaxies, collected in theArp Atlas. Here are the antennae (Arp 244 or NGC 4038/9).
Piet van der Kruit, Kapteyn Astronomical Institute Stellar Populations, classification, surface photometry
OutlineStellar Populations
ClassificationSurface photometry
Definition by Hubble and later extensionsCorrelations along the Hubble sequenceOther classification systems
Correlations along the Hubble sequence
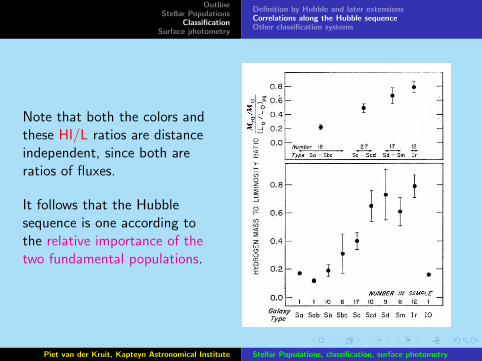
Hubble classification correlates with integrated colors4 and relativeHI content5, so is apparently related to the history of starformation.
The colors of E-galaxies are about (B − V ) ∼ 0.9, (U − B) ∼ 0.6and those for late type galaxies (B − V ) ∼ 0.4, (U − B) ∼ −0.3.
The HI content is expressed as the hydrogen mass to luminosityratio
Piet van der Kruit, Kapteyn Astronomical Institute Stellar Populations, classification, surface photometry
OutlineStellar Populations
ClassificationSurface photometry
Definition by Hubble and later extensionsCorrelations along the Hubble sequenceOther classification systems
The Hubble Atlas has normal galaxies; the Arp Atlas has disturbedand interacting galaxies.
Piet van der Kruit, Kapteyn Astronomical Institute Stellar Populations, classification, surface photometry
OutlineStellar Populations
ClassificationSurface photometry
Definition by Hubble and later extensionsCorrelations along the Hubble sequenceOther classification systems
Note that both the colors andthese HI/L ratios are distanceindependent, since both areratios of fluxes.
It follows that the Hubblesequence is one according tothe relative importance of thetwo fundamental populations.
Piet van der Kruit, Kapteyn Astronomical Institute Stellar Populations, classification, surface photometry
OutlineStellar Populations
ClassificationSurface photometry
Definition by Hubble and later extensionsCorrelations along the Hubble sequenceOther classification systems
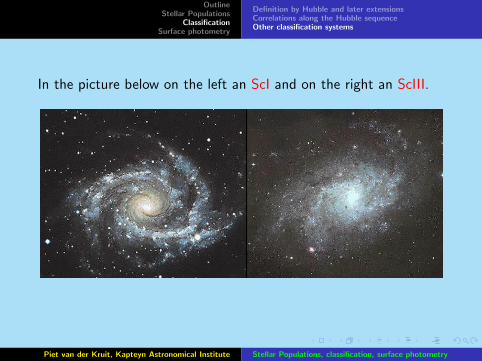
Other classification systems
Van den Bergh introduced luminosity classes on the basis of thedevelopment of the spiral structure.
For late types it partly coincides with de Vaucouleurs’ types:Sd ∼ ScIII-IV ; Sm ∼ ScV/IrrV.
There is indeed a general correlation between luminosity andvandenBergh class within a particular Hubble type.
Piet van der Kruit, Kapteyn Astronomical Institute Stellar Populations, classification, surface photometry
OutlineStellar Populations
ClassificationSurface photometry
Definition by Hubble and later extensionsCorrelations along the Hubble sequenceOther classification systems
In the picture below on the left an ScI and on the right an ScIII.
Piet van der Kruit, Kapteyn Astronomical Institute Stellar Populations, classification, surface photometry
OutlineStellar Populations
ClassificationSurface photometry
Definition by Hubble and later extensionsCorrelations along the Hubble sequenceOther classification systems
The Yerkes or Morgan classification is now mainly of historicalinterest.The complete scheme uses three criteria:
I Concentration of the light to the center, which was found tocorrelate with the occurence of features in the absorptionspectra. It is designated by the closest stellar spectral type asa, af, f, fg, g, gk or k.
I Form as S (spiral), B (barred), E (elliptical), I (irregular), R(rotationally symmetric), or D (diffuse outer envelope).
I Flattening, indicated by a number from 0 to 6.
Also the prefix c is sometimes used for a supergiant galaxy.The only surviving indication is cD for giant galaxies in the centersof clusters.
Piet van der Kruit, Kapteyn Astronomical Institute Stellar Populations, classification, surface photometry
OutlineStellar Populations
ClassificationSurface photometry
Photographic surface photometryDigital surface photometryExamples of surface photometry
Surface photometry
Piet van der Kruit, Kapteyn Astronomical Institute Stellar Populations, classification, surface photometry
OutlineStellar Populations
ClassificationSurface photometry
Photographic surface photometryDigital surface photometryExamples of surface photometry
Photographic surface photometry
Photographic surface photometry is mentioned only for historicalinterest.
It relies on the possibility to derive an accurate characteristic curveof the photographic plate.
This is done by taking on the same plate exposures of a set ofspots with known intensity ratios or a continuous wedge withknown intensity gradient.
This has to be done for about the same exposure time because oflow intensity reciprocity failure.
Piet van der Kruit, Kapteyn Astronomical Institute Stellar Populations, classification, surface photometry
OutlineStellar Populations
ClassificationSurface photometry
Photographic surface photometryDigital surface photometryExamples of surface photometry
The procedure of photographic surface photometry is:
I Digitize the plate. You need a machine to accurately measurethe “photographic density” D over many pixels. Density isminus the logarithm of the percentage of light comingthrough the emulsion, so D = 0 means completely clear,D = 1 only 10%, etc.
I Determine the characteristic curve. This is the relationbetween D and the “exposure” E . This is the total amount oflight that fell onto the emulsion.
I Fit the sky background. This is a polynomial fit to the densityof sky outside the object and in between stars.
I Zero-point calibration of the magnitude scale. This must bedone separately from aperture photometry (usually from theliterature).
Piet van der Kruit, Kapteyn Astronomical Institute Stellar Populations, classification, surface photometry
OutlineStellar Populations
ClassificationSurface photometry
Photographic surface photometryDigital surface photometryExamples of surface photometry
D
log E
���
��
��
��
���
sky
sky + objectslope γ
The photographic plate is a-linear and has a limited dynamic range.
Piet van der Kruit, Kapteyn Astronomical Institute Stellar Populations, classification, surface photometry
OutlineStellar Populations
ClassificationSurface photometry
Photographic surface photometryDigital surface photometryExamples of surface photometry
Digital surface photometry.
Charge Coupled Devices (CCD’s) are now the detectors usedalmost exclusively.
Each pixel has a number of electrons proportional (or almostequal) to the number of photons received.
The procedure of CCD surface photometry is:I Bias subtraction. Even when not exposed, the CCD records
electrons. So, you have to take separate “bias-frames” withthe shutter closed.
I Remove bad pixels. These are due to cosmic rays. In practicethe maximum exposure is of order half an hour. So, you takeseparate frames and add these later.
I Flat-fielding. Correction for sensitivity changes between pixels.For this you take an exposure on a uniformly illuminatedscreen in the dome or an exposure of the twilight sky.
Piet van der Kruit, Kapteyn Astronomical Institute Stellar Populations, classification, surface photometry
OutlineStellar Populations
ClassificationSurface photometry
Photographic surface photometryDigital surface photometryExamples of surface photometry
I Sky subtraction. Fit the background sky and subtract.
I Calibration. You take frames during the same night ofstandard stars with known magnitudes.
Photographic plates have a large size in terms of pixels anda-linearity is not a fundamental problem.
The disadvantages of photographic plates that have beenovercome by digital techniques are:• Need to digitize.• Low quantum efficiency (no more than 15% or so, while CCD’sgo up to close to 100%).• Background non-uniformities cannot be corrected for.• Limited dynamic range.• Separate zero-point calibration required using aperturephotometry.
Piet van der Kruit, Kapteyn Astronomical Institute Stellar Populations, classification, surface photometry
OutlineStellar Populations
ClassificationSurface photometry
Photographic surface photometryDigital surface photometryExamples of surface photometry
Examples of surface photometry
(a.) Photographic.
This is NGC 4258a.
The scale on theazimuthally averagedradial profile is inmagnitudes per squarearcsec.
For the sky this is about22.5 B-mag arcsec−2 ata dark site.
aP.C. van der Kruit,A.&A.Suppl. 38, 15 (1979)
Piet van der Kruit, Kapteyn Astronomical Institute Stellar Populations, classification, surface photometry
OutlineStellar Populations
ClassificationSurface photometry
Photographic surface photometryDigital surface photometryExamples of surface photometry
(b.) CCD photometry.6
6R.S. de Jong & P.C. van der Kruit, A.&A.Suppl. 106, 451 (1994)Piet van der Kruit, Kapteyn Astronomical Institute Stellar Populations, classification, surface photometry