31
STRUCTURE OF THE CIVIL SERVICE EMPLOYMENT IN SEVEN OECD COUNTRIES

STRUCTURE OF THE CIVIL SERVICE EMPLOYMENTIN SEVEN OECD COUNTRIES

OECD 19992
TABLE OF CONTENTS
Summary..................................................................................................................................................... 3Introduction................................................................................................................................................. 4Section 1 - Civil service employment trends: overview............................................................................. 5Section 2 - Women in the civil service....................................................................................................... 7
The representation of women in the civil service and in the economy as a whole................................. 7The breakdown of women by occupational groups ................................................................................ 8
Section 3 - Part-time work ........................................................................................................................ 15Part-time work in the civil service ........................................................................................................ 15Part-time work in the civil service as opposed to in the economy as a whole...................................... 16
Section 4 - The age structure of civil service employment ...................................................................... 17Age of entry into the civil service......................................................................................................... 23
Section 5 - Civil service inflows and outflows......................................................................................... 24
ANNEX 1: STATISTICAL SOURCES....................................................................................................... 27
ANNEX 2: DATA ........................................................................................................................................ 28
Tableau A1: Changes in civil service employment, public sector, and economy as a whole (% changesover the period) ......................................................................................................................................... 28Table A2: Percentage of women in the civil service and the economy as a whole.................................. 29Table A3: Number of managers in the civil service ................................................................................. 30Table A4: Civil service inflows and outflows .......................................................................................... 31

OECD 19993
Summary
As in the market sector, there has been a significant change in the public workforce mix sincethe late 1980s. Some of these developments are due to demographic trends and far-reaching changes inthe labour market as a whole. Others are the outcome, intentional or otherwise, of public managementreform in OECD countries.
This report presents the structure of civil service employment in 7 OECD countries—Australia,Canada, France, Spain, Sweden, the United Kingdom and the United States. Since the late 1980s, thenumber of jobs in the civil service has been declining in most of the countries in the study. This trendshould of course be viewed in the light of structural reform and organisational change, in particular withregard to the supply of public goods and services. In most cases too, constraints on public spending havealso affected the size of the civil service. Apart from the purely quantitative evidence (i.e. trends in thenumber of civil servants), there are signs of structural change in the workforce.
This report looks in particular at specific changes in the female workforce in the civil service.Women’s participation in the labour market rose in the early 1990s, during a period of recession. In thecivil service their participation had already been higher than average. Women now account for around halfof all civil servants in most of the countries in the sample, whereas for the economy as a whole the figureis slightly lower. Over the past 10 years the proportion of women in the civil service has been rising, andit is increasingly common to find women in positions requiring a high level of qualification.
Another feature of the civil service is part-time work, which primarily concerns women. In thecivil service, this type of work is still a matter of choice in terms of flexible time management, whereas inthe rest of the economy it may be considered as imposed by employers.
Trends in the age structure of civil service employment foreshadow the problems thatgovernments will be facing in the longer run. Most public administrations are experiencing a generalageing of the workforce and the age of entry is rising. Finally, staff inflows and outflows clearly reflectthe downsizing occurring almost everywhere, with more departures and restricted entries.
This rapid (and incomplete) overview of trends in civil service employment should help to drawthe attention of decision-makers in human resource management to the new expectations of staff on issuessuch as training, pay, working-time arrangements and mobility etc., and to the need for staff managementsystems that are flexible enough to provide real-time solutions to human capital requirements.

OECD 19994
Introduction
In connection with PUMA’s work in the area of public employment management, a number of hypotheseshave been advanced regarding structural changes in civil service employment and their repercussions formanagement. This document will analyse selected characteristics of civil service employment: theposition of women, part-time work, the age structure and civil service inflows and outflows. In respect ofsome criteria, the analysis provides elements of comparison with the employment structure of theeconomy as a whole. A sample of seven countries was chosen—due primarily to the availability ofrelatively comparable statistics: Australia, Canada, France, Spain, Sweden, the United Kingdom and theUnited States.
After an overview of civil service employment in Section 1, Section 2 looks at the position of women inthe civil service. Section 3 examines part-time work and endeavours to compare its use in the civil serviceand in the economy as a whole. The age criterion is probed in Section 4, which looks at how both the agepyramid and the age of entry have evolved in the civil service. Lastly, Section 5 analyses civil serviceinflows and outflows.
The analysis focuses on the civil service, which is just one part of the broader public sector. From onecountry to another, the size of civil service, relative to the aggregate public sector workforce, is not thesame. The scope used for each country is described briefly in the box below, and sources are listed inAnnex 1. It is essentially in the civil service that people with civil servant status (where such a statusexists) are to be found.
Box 1. Scope chosen for each country
AUSTRALIA: Australian public service employees covered by the Australian Public Service Act of 1922.The workforce includes persons working full time and part time, with no consolidation (i.e. figures are notin full time equivalent).
CANADA: The scope comprises federal civil service employees who are paid by the Treasury Board ofCanada, full time plus part time.
FRANCE: Only employees of civil ministries of the Central Government are included (i.e., employees ofnational public establishments, La Poste and France Télécom, and private schools are excluded). Theworkforce is counted in terms of actual employees (full time plus part time) on 31 December of the year inquestion.
SPAIN: The scope covers persons working for the ministries (full time plus part time), i.e. the centralgovernment. It does not include teachers, university staff, government security forces, the armed forces,and employees of the judicial system or statutory Social Security employees.
SWEDEN: The scope corresponds to the central government, which includes central government agencies,whether they are financed by appropriations or by income-producing activities, and public utilities. Itdoes not include municipalities or county councils.

OECD 19995
UNITED KINGDOM: The scope consists of the Civil Service, i.e. government departments, executiveagencies in Great Britain and the diplomatic service. The data correspond to serving staff expressed infull time equivalent.
UNITED STATES: Federal government employees, excluding Postal Service, expressed in full timeequivalent.
Section 1 - Civil service employment trends: overview
This section shows the evolution of the workforce and the downsizing measures undertaken by thecountries studied. Both points are important to understand some changes in the structure of the civilservice employment. Figure 1 (below) shows how the volume of the civil service has evolved, and Box 2reviews the reforms carried out or under way in the countries in question.
Figure 1. Changes in civil service employment, 1988-1997
Base 100 = 1988
50
60
70
80
90
100
110
1988 1989 1990 1991 1992 1993 1994 1995 1996 1997
Sweden
Australia
UK
Canada
US
France
Box 2. Measures taken to downsize the civil service in the 1990s
AUSTRALIA: There is no overall downsizing programme, but each department must achieve specificbudget-cutting objectives. These cutbacks lead to measures (different in each department) to reduce staff.Most of the cutbacks are due to a rationalisation of departments; only some units have frozen they’rerecruiting.
CANADA: In 1990, the White Paper on Civil service provided the framework for an initial reform. In1995, a budget-cutting programme was implemented, leading to an audit of all programmes and services
OECD 19996
and a downsizing plan. Early retirement incentive programmes exist only in those departments deemed tobe overstaffed.
FRANCE: This country had no large-scale workforce reduction plan. Cutbacks are achieved by hiringfreezes decided through ministerial channels. Because post eliminations in some sectors are offset by postcreations in priority sectors, there are no staff redundancies, but rather transfers of abilities.
SPAIN: In 1994-95, five employment restructuring plans were introduced (for the postal andtelecommunications service, the employment agency, the tax agency, civilian employees of the Ministryof Defence and CIEMAT). Early retirement is possible from age 60.
SWEDEN: The restructuring of the ministries has been accompanied by staff cutbacks and measures toenhance flexibility and enable agencies to adjust their workforce. The 1993 Civil service Act increasedpersonnel management flexibility and lessened the differences between the public and private sectors. Thesubstantial staff cutbacks (see Figure1) resulted in redundancies (in about a quarter of the cases), functionsbeing transferred to other sectors (municipalities, counties), and conversion of certain services into publicor private enterprises
UNITED KINGDOM: There has been no real workforce reduction programme, but rationalisationprogrammes that have meant increased productivity, transfers of skills to other levels of government,privatisation and elimination of duplicate effort. Agencies have had to absorb budget cuts, which have ledto reductions in employment. Early retirement is possible from age 50.
UNITED STATES: In 1994, Congress passed legislation calling for a 12 per cent cut in the total number ofFederal civil service employees by 1999. The reductions have led to voluntary departure incentives (andparticularly early retirement incentives) and the use of non-voluntary departures only as a last resorts. Thefederal government’s National Performance Review (NPR) has played a very important role in theimplementation of measures to downsize the federal civil service.
The choice of scope was dictated by data availability. The main source of information on the structure ofemployment is personnel registers (but they cover only the civil service). Table 1 shows the size of thechosen scope in relation to the public sector as a whole.
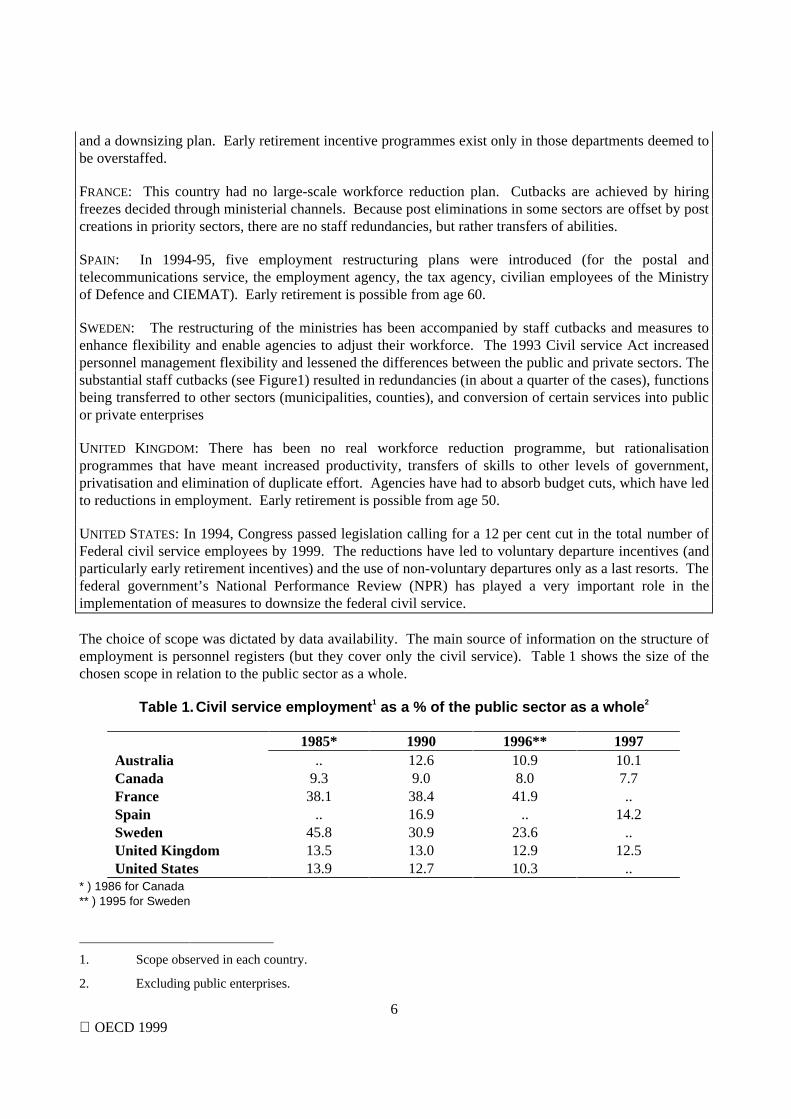
Table 1.Civil service employment1 as a % of the public sector as a whole2
1985* 1990 1996** 1997Australia .. 12.6 10.9 10.1Canada 9.3 9.0 8.0 7.7France 38.1 38.4 41.9 ..Spain .. 16.9 .. 14.2Sweden 45.8 30.9 23.6 ..United Kingdom 13.5 13.0 12.9 12.5United States 13.9 12.7 10.3 ..
* ) 1986 for Canada** ) 1995 for Sweden
1. Scope observed in each country.
2. Excluding public enterprises.
OECD 19997
Section 2 - Women in the civil service
The employment situation for women has changed significantly over the past ten years, in the civil serviceand in the economy as a whole. The general trend in the OECD countries has been for an increase inactivity rates for women. While it is a known fact that women tend to hold low-skilled and insecure jobsmore than men do, it must be noted that more women are attaining responsible positions than ever before.In order to highlight these changes, we looked first at women’s share in civil service employment ascompared to the economy as a whole, and then we examined the jobs that women hold in the civil service.
The representation of women in the civil service and in the economy as a whole
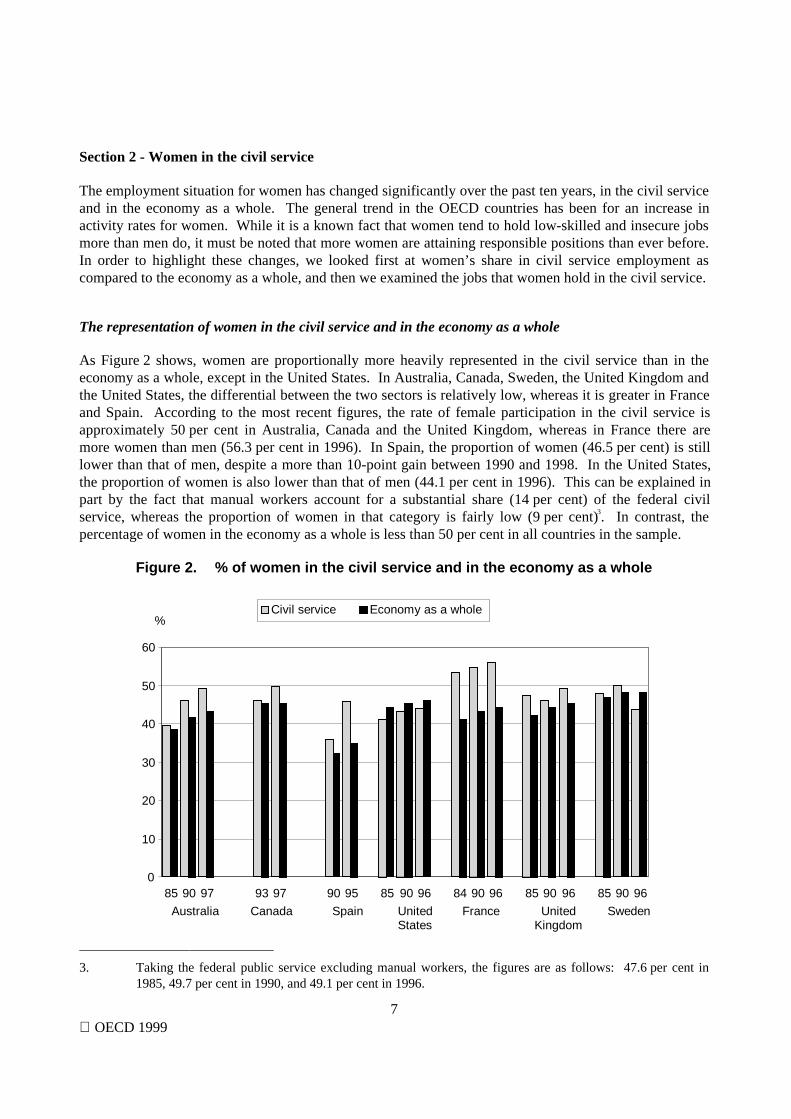
As Figure 2 shows, women are proportionally more heavily represented in the civil service than in theeconomy as a whole, except in the United States. In Australia, Canada, Sweden, the United Kingdom andthe United States, the differential between the two sectors is relatively low, whereas it is greater in Franceand Spain. According to the most recent figures, the rate of female participation in the civil service isapproximately 50 per cent in Australia, Canada and the United Kingdom, whereas in France there aremore women than men (56.3 per cent in 1996). In Spain, the proportion of women (46.5 per cent) is stilllower than that of men, despite a more than 10-point gain between 1990 and 1998. In the United States,the proportion of women is also lower than that of men (44.1 per cent in 1996). This can be explained inpart by the fact that manual workers account for a substantial share (14 per cent) of the federal civilservice, whereas the proportion of women in that category is fairly low (9 per cent)3. In contrast, thepercentage of women in the economy as a whole is less than 50 per cent in all countries in the sample.
Figure 2. % of women in the civil service and in the economy as a whole
0
10
20
30
40
50
60
85 90 97 93 97 90 95 85 90 96 84 90 96 85 90 96 85 90 96
Civil service Economy as a whole
Australia Canada Spain UnitedStates
France UnitedKingdom
Sweden
%
3. Taking the federal public service excluding manual workers, the figures are as follows: 47.6 per cent in
1985, 49.7 per cent in 1990, and 49.1 per cent in 1996.
OECD 19998
Over a period of approximately ten years, the share of women in the civil service and in the economy as awhole remained fairly stable in France, the United Kingdom and the United States. Even so, differenttendencies can be spotted in the make-up of the workforce in these three countries. In France and theUnited States, there was a very slight increase in the proportion of women in the civil service. In theUnited Kingdom, a drop was recorded between 1985 and 1990, followed by an increase in 1996 (46.0 percent women in 1990 and 49.1 per cent in 1996). The situation in Australia is different. There was asubstantial increase in the percentage of women in the civil service, which rose from 39.5 per cent in 1985to 47.8 per cent in 1990, followed by a stabilising trend in the 1990s. Also in Australia, it can be notedthat the rise in the presence of women has been fairly slight in the economy as a whole. In Canada andSpain, there has been a clear increase in the proportion of women in the civil service (a 3.4-point rise inCanada between 1993 and 1997, a 9.9-point rise in Spain between 1990 and 1995). For these twocountries, there were no substantial changes regarding the economy as a whole. Sweden stands out fromthe countries studied previously insofar as the proportion of women in the civil service declined between1990 and 1996 (from 49.8 to 43.7 per cent). This reduction is the consequence of the privatisation ofsome public utilities, and in particular the postal sector, in which women were very well represented. Theproportion of women varies sharply from one sector of the civil service to another. If enterprises that weresubsequently privatised are excluded from the scope of observation, the proportion of women was 42 percent in 1990 (versus 49.8 per cent if privatised enterprises are included).This data verify the assumptionthat the activities which require the least skilled jobs, mainly held by women, have been privatised
Among the reasons why women are proportionally more heavily represented in the civil service than inthe economy as a whole, one that is cited frequently is the greater options for reconciling career andfamily considerations, through part-time work for example. The civil service hiring process may beanother factor conducive to the recruitment of women. In some cases, recruiting is done differently thanin the rest of the economy, through competitive examinations or integration after attending special schoolsfor example. It could be considered that the risk of gender discrimination in hiring does not exist in suchcases. Another notable case is that of Australia, where the fact that until recently it was only in the civilservice that female employees were entitled to paid maternity leave could also have constituted anincentive for women to become public servants.
The breakdown of women by occupational groups
While there is now near parity between men and women in the civil service as a whole, this does not holdtrue for particular occupational groups. As a rule, there are proportionally more women in job categoriesrequiring relatively lower levels of skills (except in blue collars jobs and, to a lesser extent, technical jobs,a majority of which are held by men). Nevertheless, the number of women in managerial and seniormanagerial positions is tending to rise. There is a redistribution (slight) of female employees among thevarious job categories, with a shift towards more highly qualified positions. The extent of this trend variesfrom one country to another. The figures below show the particularities of each country in this area.
OECD 19999
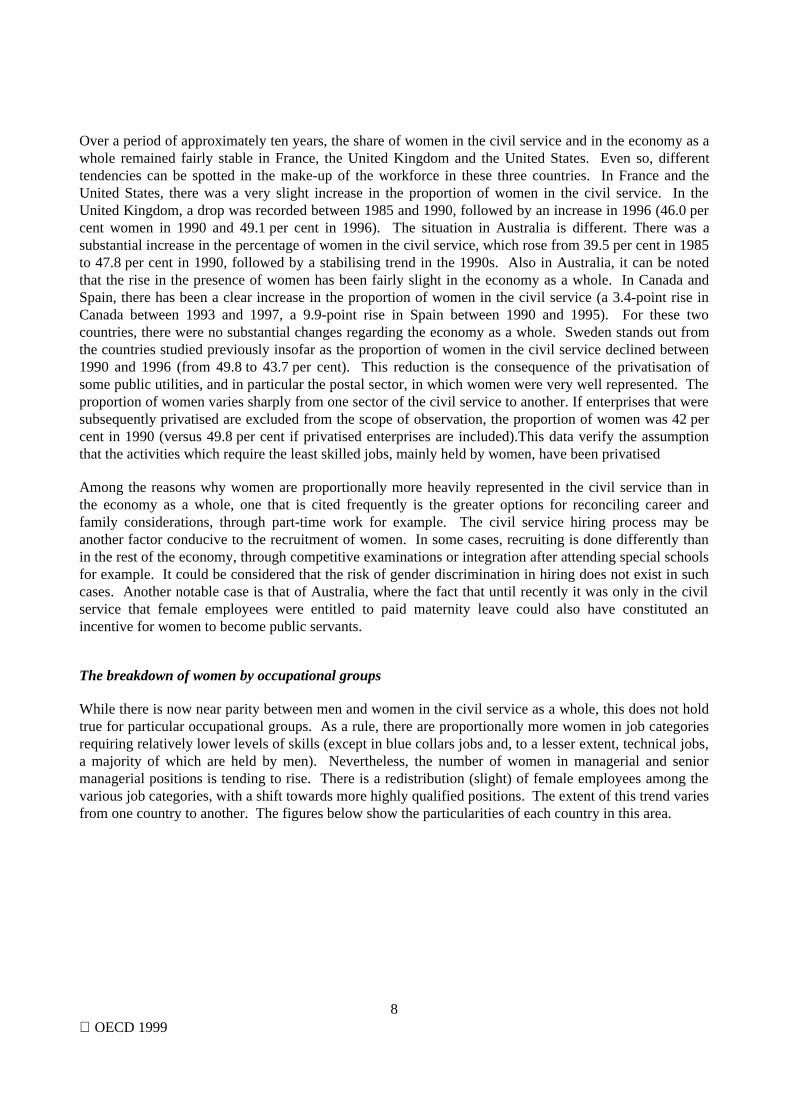
Figure 3. Percentage of women by occupational group
3.1 Australia - % of women by occupational group
0
20
40
60
80
100
Senior Service Senior officer Administrativ serviceclass 4 to 6
Administrativ serviceclass 1 to 3
%
1988 1997
In Australia, the proportion of women in the senior service (20.7 per cent) remains lower than that of men,even though it has more than doubled since 1988. Despite a slight decline, the proportion remainsrelatively high (67 per cent) in the category of class 1-3 administrative service, which is the lowest.
3.2 Canada - % of women by occupational group
0
20
40
60
80
100
Executive Scientific andprofessional
Administrativeand Foreign
Service
Technical Administrativesupport
Operational
%
1994 1997
Between 1997 and 1994 in Canada, the proportion of women increased in the four groups in which thepercentage of women was lower than that of men. But it remained flat in the administrative supportcategory. Women are not very well represented in the “technical” and “operational” groups, they accountfor one-third of the scientific and professional category and just over one-fifth of executive personnel,versus four-fifths of administrative support staff.

OECD 199910
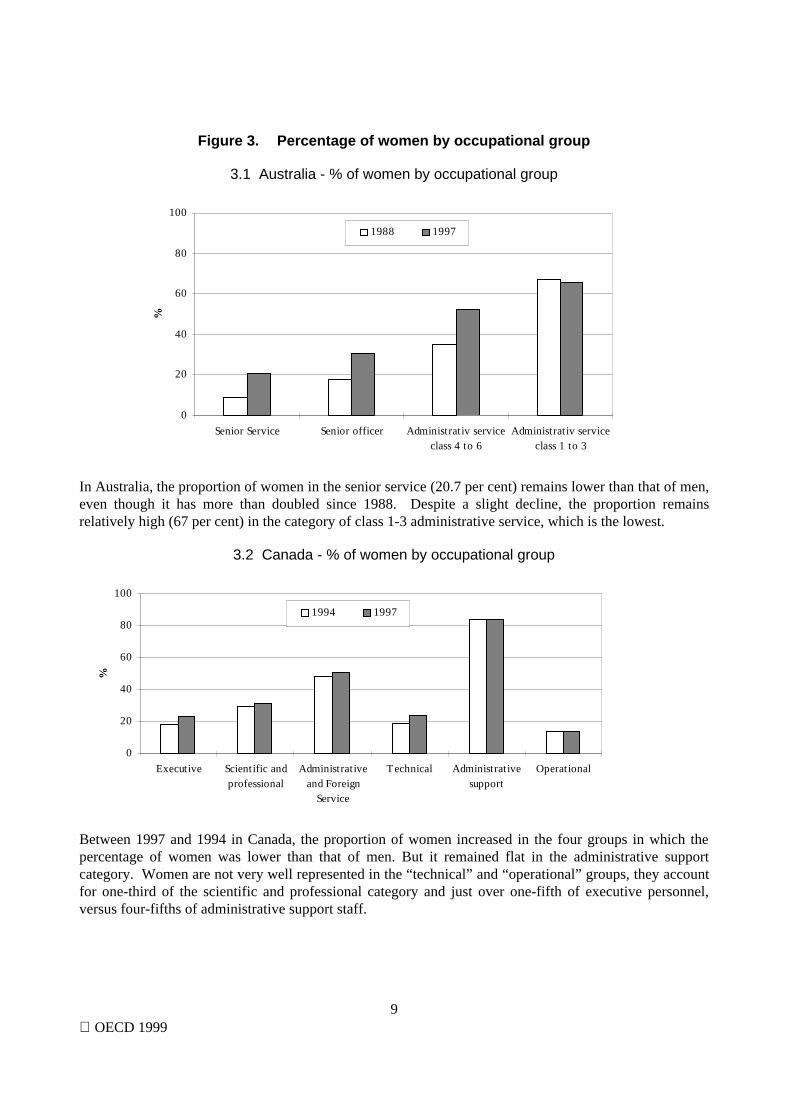
3.3 United States - % of women by occupational group
0
20
40
60
80
100
Professional Administrative Technical Clerical
%
1986 1996
Definitions: - Professional: Jobs requiring a bachelor’s degree and specialisation in a relevant field. These areessentially managerial and research jobs.- Administrative: Jobs requiring no particular specialisation, but good judgement, a sense of responsibilityand good general knowledge.- Technical: Support staff for managers and administrators, requiring specialised experience or training butnot extensive knowledge of a particular field.- Clerical: Office assistance work.
In the United States, it can be seen that the proportion of women is rising in the “professional”,“administrative” and “technical” groups. The “clerical” category has seen a slight drop in femaleparticipation, although women continue to dominate with 83 per cent in 1996.
3.4 France - % of women by occupational group
0
20
40
60
80
100
Managers Intermediate jobs Intermediatetechnical jobs
Clerical Blue Collars
%
1985 1995
Definitions: - Senior managers and professionals: executives, magistrates, administrative officers, engineers, professors,secondary-school teachers and professeurs des écoles (a certain category of primary school teachers, for 1995 only).

OECD 199911
- Intermediate jobs: primary school teachers (in 1995, some primary school teachers were granted the status ofprofesseurs des écoles), intermediate health care occupations, social workers, police, foremen and non-commissionedofficers
In France, we see relatively less disparity between men and women than in the other countries, except fortechnical occupations and manual jobs, which are traditionally filled by men. There are slightly morewomen than men among clerical workers. With respect to intermediate occupations, the division betweenmen and women became more even between 1985 and 1995. There was a significant increase in theproportion of women managers, from 37.2 per cent in 1990 to 47.8 per cent in 1996—a 10-point rise.This increase is due in part to a change in the status of some primary school teachers (a high proportion ofwhom are women), who were moved from the “intermediate jobs” group to that of managers andprofessionals.
3.5 United Kingdom - % of women by occupational group
0
20
40
60
80
100
Senior civilservice
Level 6 & 7 Senior and higherexecutive officer
Executive officer Administrativeofficer
Administrativeassistant
%
1985 1997
The “Senior Civil Service” group did not exist in 1985.Definitions: - Grades 6 & 7 and some Senior Executive posts: desk officers, e.g. policy development; heads of executive supportsections, operational units and specialist areas.- Senior Executive Officer, Higher Executive Officer: executive and policy support; research analysis and casework.Managers of junior executive and clerical/support operations. Personal assistants to senior staff.- Administrative Officer, Administrative Assistant: typing, secretarial, clerical and support roles.
In line with what has been seen in respect of the countries above, Figure 3.5, which ranks jobs indecreasing order of the level of skills required, shows that, in the United Kingdom, the presence of womenis inverse proportion to the level of these requirements. For the two levels calling for the highestqualifications (apart from Senior Civil Service posts, for which data are unavailable), the percentage ofwomen rose quite significantly between 1985 and 1997 (by 14.2 points for “Grades 6 and 7” and by8.4 points for Senior Executive Officers). The proportion of women remained stable at the intermediatelevels and diminished at levels with lesser skills requirements.

OECD 199912
3.6 Sweden - % of women by occupational group
1997
0
20
40
60
80
100
Grade 3 Grade 4 Grade 5 Grade 6 Grade 7
1997
Data for prior years are unavailable because the TNS classification system used in the above figure was revised in1995.Definitions: Grade 3: Jobs requiring advanced ability to solve complex, crucial problems. These posts involve the shaping of long-term strategies and working methods and determining what resources are needed.Grade 4: Jobs requiring advanced ability in a particular field, and which are performed with minimal supervision.Grade 5: Jobs involving the application of experience and know-how to solve specific complex problems.Grade 6: Jobs in which general instructions are carried out.Grade 7: Jobs involving routine work.
In contrast to the situation in the other countries cited above, in Sweden there are no categories in whichwomen outnumber men, even in respect of the lowest-skilled jobs. However, the same tendency aselsewhere regarding the representation of women is observed in Sweden—i.e., that the higher the requiredlevel of skills, the lower the representation of women in that category.
In order to get a comparative perspective on how the distribution of women across occupational groupshas evolved, the ratio of the percentage of women in the group requiring the highest qualifications to thepercentage of women in the group requiring the lowest qualifications was calculated for two differentyears (Table 2). It gives an indication of how women’s jobs have been redistributed by occupationalgroup.

OECD 199913
Table 2. Index of the representation of women by occupational group
Ratio of the % of women in the highest group to their % in the lowest group
1985 1997(or the most recent
year available)Australia 0.13 0.32Canada - 0.27France excluding primary andsecondary school teachers
0.70
0.49
0.83
0.54Sweden - 0.32United Kingdom 0.06 0.30United States 0.34 0.45
The highest group comprises: senior services for Australia, executives for Canada, senior managers and professionalsfor France, Grade 3 for Sweden, Grades 6 & 7 for the United Kingdom and professionals for the United States.The lowest group comprises: Class 1-3 administrative staff for Australia, administrative support staff for Canada,clerical workers for France and the United States, Grade 7 for Sweden and administrative assistants for the UnitedKingdom.
The results confirm the previous observations. Between 1985 and 1997, the ratio increased in allcountries: the disparities in the representation of women by socio-professional categories diminished.However, the fact that the value of the index is less than 1 in all cases signifies that the proportion ofwomen is still largest in the least-skilled socio-professional categories. In France, as seen above, womenare relatively more evenly distributed. The value of the index for 1997 (0.83) means that France is wellplaced compared to the other countries. Although this is due in part to the fact that the education sector isincluded in the Civil Service in France, which is not the case in the other countries in the sample. A largenumber of teachers (categories in which the proportion of women is fairly high) are classified asmanagers.
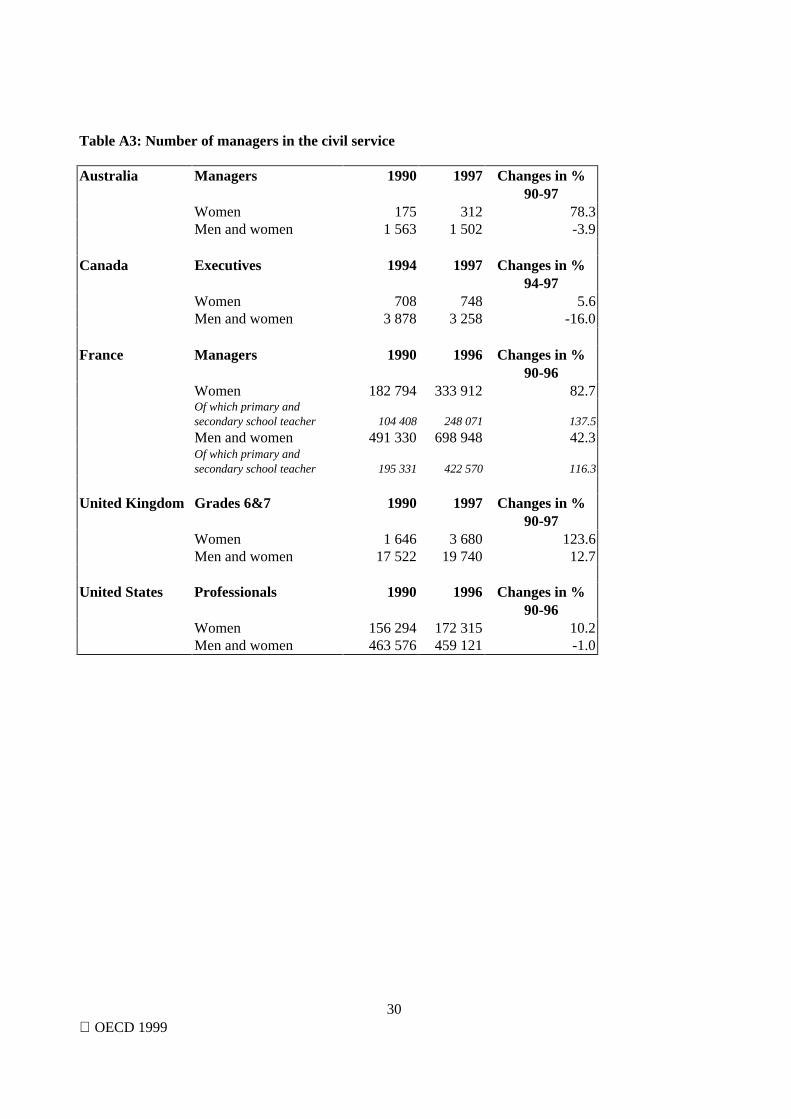
In some countries, steps have been taken to promote equal employment opportunity between men andwomen. Programmes have been set up to increase the number of women in executive positions. Figure 4shows the respective variations in the number of posts in executive categories, for men and womencombined and then for women.
OECD 199914
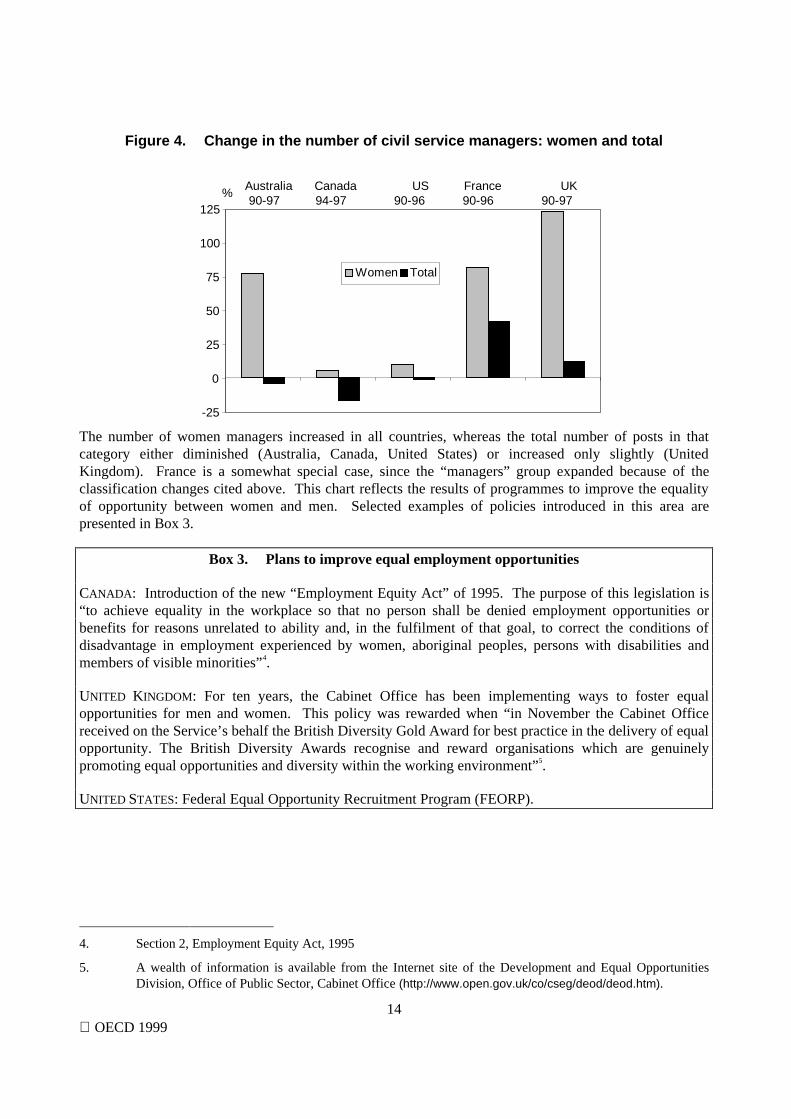
Figure 4. Change in the number of civil service managers: women and total
-25
0
25
50
75
100
125
Women Total
Australia90-97
Canada94-97
US90-96
France90-96
UK90-97
%
The number of women managers increased in all countries, whereas the total number of posts in thatcategory either diminished (Australia, Canada, United States) or increased only slightly (UnitedKingdom). France is a somewhat special case, since the “managers” group expanded because of theclassification changes cited above. This chart reflects the results of programmes to improve the equalityof opportunity between women and men. Selected examples of policies introduced in this area arepresented in Box 3.
Box 3. Plans to improve equal employment opportunities
CANADA: Introduction of the new “Employment Equity Act” of 1995. The purpose of this legislation is“to achieve equality in the workplace so that no person shall be denied employment opportunities orbenefits for reasons unrelated to ability and, in the fulfilment of that goal, to correct the conditions ofdisadvantage in employment experienced by women, aboriginal peoples, persons with disabilities andmembers of visible minorities”4.
UNITED KINGDOM: For ten years, the Cabinet Office has been implementing ways to foster equalopportunities for men and women. This policy was rewarded when “in November the Cabinet Officereceived on the Service’s behalf the British Diversity Gold Award for best practice in the delivery of equalopportunity. The British Diversity Awards recognise and reward organisations which are genuinelypromoting equal opportunities and diversity within the working environment”5.
UNITED STATES: Federal Equal Opportunity Recruitment Program (FEORP).
4. Section 2, Employment Equity Act, 1995
5. A wealth of information is available from the Internet site of the Development and Equal OpportunitiesDivision, Office of Public Sector, Cabinet Office (http://www.open.gov.uk/co/cseg/deod/deod.htm).

OECD 199915
Section 3 - Part-time work
Over the past ten years, part-time work has developed both in the private sector and in the economy as awhole, and for both men and women (except in Sweden). As a rule, the proportion of women workingpart-time is preponderant both in the civil service and in the economy as a whole. In contrast, while in thecivil service the percentage of men working part-time is low and rising only slowly, this is not the case inthe private sector. It is estimated that 8 per cent6 of men work part-time in the OECD area as a whole, andthis proportion rises essentially during periods of recession. This tendency has not been observed in thecivil service, where part-time work is generally a matter of employee demand, whereas in the privatesector it is mainly decided by employers7 8.
Part-time work in the civil service
Figure 5. Proportion of part-time workers in the civil service and breakdown by gender(in %)
0
10
20
30
40
50
%
Men Women Total
88 97 86 96 87 97 85 9787 97Australia Canada United Kingdom SwedenFrance
Part-time work in the civil service is observed in five countries (Australia, Canada, France, Sweden andthe United Kingdom). Figure 5 shows that part-time work is more widespread among women than amongmen. The proportion of men working part-time is around 1 per cent, and has changed little if at all, inrecent years. The only notable exception is Sweden, where 14 per cent of men worked part-time in 1997.With regard to women, the situation varies more widely from country to country. The proportion of
6. Unweighted average (OECD Employment Outlook, June 1998).
7. “In establishment surveys in a number of European countries, the majority of managers said that theprimary reason for the introduction of part-time working was to meet the needs of the firm.” (OECDEmployment Outlook, June 1998)
8 . For example, in France 42 per cent of employees working part-time would like to work more

OECD 199916
women working part-time rose slightly in France (from 12.3 per cent in 1986 to 14.5 per cent in 1996) andAustralia (from 6.7 per cent in 1988 to 8.8 per cent in 1997). In the United Kingdom, the proportion morethan doubled. In this regard, the report Civil Service Statistics9 points out that, while the proportion ofwomen working part-time is highest in the least-skilled jobs, it is nonetheless 12 per cent in the “seniorcivil servant” category. In Sweden, the percentage of women working part-time was still very high, at31.4 per cent in 1997, despite a sharp drop since 1985 (down 12.7 points).
Part-time work in the civil service as opposed to in the economy as a whole
Table 3.Comparison of the proportion of part-time workers in the civil service and in theeconomy as a whole between 1986 and 1996 (in %)
Men Women Total
1986 1996 1986 1996 1986 1996Australia
civil service a
0.8 1.3 6.7 8.8 3.3 5.0whole economy 6.7 11.7 37.9 42.6 18.9 25.0
Canadacivil service
b- 1.5 - 7.6 2.0 4.6
whole economy - 10.7 - 28.9 16.9 18.9France
civil service 0.7 1.1 12.3 14.5 7.0 8.7whole economy 3.4 5.3 23.3 29.5 11.7 16.0
Swedencivil service
c13.0 14.8 44.1 31.4 27.9 22.0
whole economy 6.0 9.3 42.8 39.0 23.5 23.6United Kingdom
civil service b
0.5 1.3 8.7 22.0 4.6 11.3whole economy 4.6 8.1 45.0 44.8 21.6 24.6
a) 1988 and 1997.b) 1987 and 1997.c) 1985 and 1997.In Australia, Canada, France and the United Kingdom, in 1986 and 1996, part-time work was morewidespread in the economy as a whole than in the civil service. The gap remained fairly stable over theperiod in Australia and France. In the United Kingdom, the disparities between the public and privatesectors tended to lessen, because the proportion of staff working part-time increased substantially in thecivil service (up by 6.2 points between 1986 and 1996). In Sweden, the situation was the opposite of thatof the four other countries, with a larger proportion of men working part-time in the civil service than inthe economy as a whole, and an equivalent situation for women in both sectors. It would appear that thepercentage of part-time workers in Sweden had reached a very high level in both sectors and that the trendis now downward.
9. Civil Service Statistics 1997, Cabinet Office, p. 16.

OECD 199917
Section 4 - The age structure of civil service employment
In general, an ageing of the workforce is observed in OECD countries. The purpose here is to look atwhether the civil service profile reflects this same tendency. The charts below show the age pyramids forcivil service employees for two different years separated by roughly a decade. The trends are fairlydissimilar from one country to another. One common tendency that does emerge, however, is that the ageat which people join the civil service is increasing. Virtually no one enters civil service before the age of20—not only because people are staying in school longer, but because the requisite qualifications havealso become stricter. The labour market situation is another factor. This is the case in France, where in acontext of underemployment young job seekers choose the civil service as a safe choice in terms of jobsecurity. In fact, this results in a trend towards over-qualification of new recruits, and creates a gapbetween the level of recruiting and the jobs on offer, which could ultimately pose personnel managementproblems 10.
Figure 6. Changes in the breakdown by age and by gender
6.1 Australia
< 20
20-24
25-29
30-34
35-39
40-44
45-49
50-54
55-59
60 +
1988 1997
0 3% 6% 9% 12%3%6%9%12%
Women Men
In Australia, among older groups, there were more men than women in 1988, but the difference wasgetting blurred in 1997. Among the younger age groups, there were more women than men, in both 1988and 1997. Figure 6.1 shows an evening out of the split between men and women in the civil service, witha tendency towards feminization. It can also be seen that the age pyramid is shifting towards an ageing ofthe civil service, for women and men alike, since in 1988 the median age groups were 35-39 for men and30-34 for women, but in 1997 they were 40-44 and 35-39 respectively.
10. Service Public No. 56, March 1998

OECD 199918
6.2 Canada
16-19
25-29
35-39
45-49
55-59
65+
1997
0 3% 6% 9% 12%3%6%9%12%
Women Men
With regard to the gender mix in Canada in 1997, the age groups of 40-44 and younger showed morewomen than men, whereas in older groups, there were fewer women. The proportion of womendiminishes with age: women make up 59.5 per cent of the 20-24 bracket, 52 per cent of those aged 40-44,and 27.8 per cent of those over 65. The increase in the percentage of women in the Canadian federal civilservice seen in Figure 2 is attributable to the younger age groups. The Annual Report on EmploymentEquity in the Canadian federal civil service pointed out that the population of public servants is stillageing (41.3 per cent of officials are aged 45 or older), and that this is essentially due to the limitednumber of employment opportunities for young people.
6.3 United States
<31
31-40
41-49
51-59
60-69
70+
1987 1997Women Men
0 5% 10% 15% 20%5%10%15%20%

OECD 199919
The US federal civil service has aged substantially. In 1987, 31-40 year-olds accounted for a third of allpublic servants, in 1997 they accounted for only a quarter. Those under 31 made up 18 per cent of thecivil service in 1987, versus 10 per cent in 1997. The younger the age group, the higher the proportion ofwomen. In 1997, women accounted for 52 per cent of those under 31 and only 37 per cent of those over60.
6.4 Spain
18-29
30-41
42-53
54+
1990 1998
Women Men
0 5% 10% 15% 20% 25%5%10%15%20%25%
In Spain, the 18-29 age group has shrunk significantly for both men and women. The number of womenhas increased in the 30-41 and 42-53 brackets, corresponding to the heavy rise in the percentage of womenseen in Figure 2. From Figure 6.4, it would seem that the age at which these women entered the civilservice was fairly high. In contrast, the proportion of men in these two age groups remained stable. Theover-54 category was stable for women and in decline for men. Unlike the other countries, Spain showedno ageing of employees in the civil service.

OECD 199920
6.5 France
< 24
25-29
30-34
35-39
40-44
45-49
50-54
55-59
60+
1988 1996
0 3% 6% 9% 12%3%6%9%12%
Women Men
As in Australia and the United States, a tendency towards the ageing of employees in the civil service canbe observed in France, characterised by an increase in the proportion of over-45 age groups and at thesame time a decrease in those under 35. The civil service is ageing differently, depending on whether onelooks at the male or female population. For women, the decline in the proportion of under-35 age groupsis less pronounced, and in fact there was a slight increase in the percentage of women aged 25-29. Itwould appear that more women than men joined the civil service in 1996, whereas it was the reverse in1988 (based on the assumption that under-29 brackets consist mainly of new entrants). The median agebracket was identical for men and women, rising from 35-39 in 1988 to 40-44 in 1996.

OECD 199921
6.6 United Kingdom - Age structure in the civil service *
0 3 6 9 12 15 18
16-19
25-29
35-39
45-49
55-59
%
1987 1997
Total
* The breakdown by gender is not available.
In the United Kingdom, the age structure in the civil service has changed over the past ten years. Therehas been an increase in the number of civil servants in the 30-34-age bracket, along with a reduction in theunder-25 bracket. This stems in part from the fact that the proportion of people recruited at age 25 orolder has increased in recent years. Early retirement incentive programmes and the small number of thosewho work beyond the legal retirement age have diminished the over-55 age bracket. In 1997, the averageage of public servants was 38.1 for women and 40.5 for men.
6.7 Sweden
<24
25-29
30-34
35-39
40-44
45-49
50-54
55-59
60+
1985 1997
Women Men
0 2% 4% 6% 8% 10%2%4%6%8%10%
OECD 199922
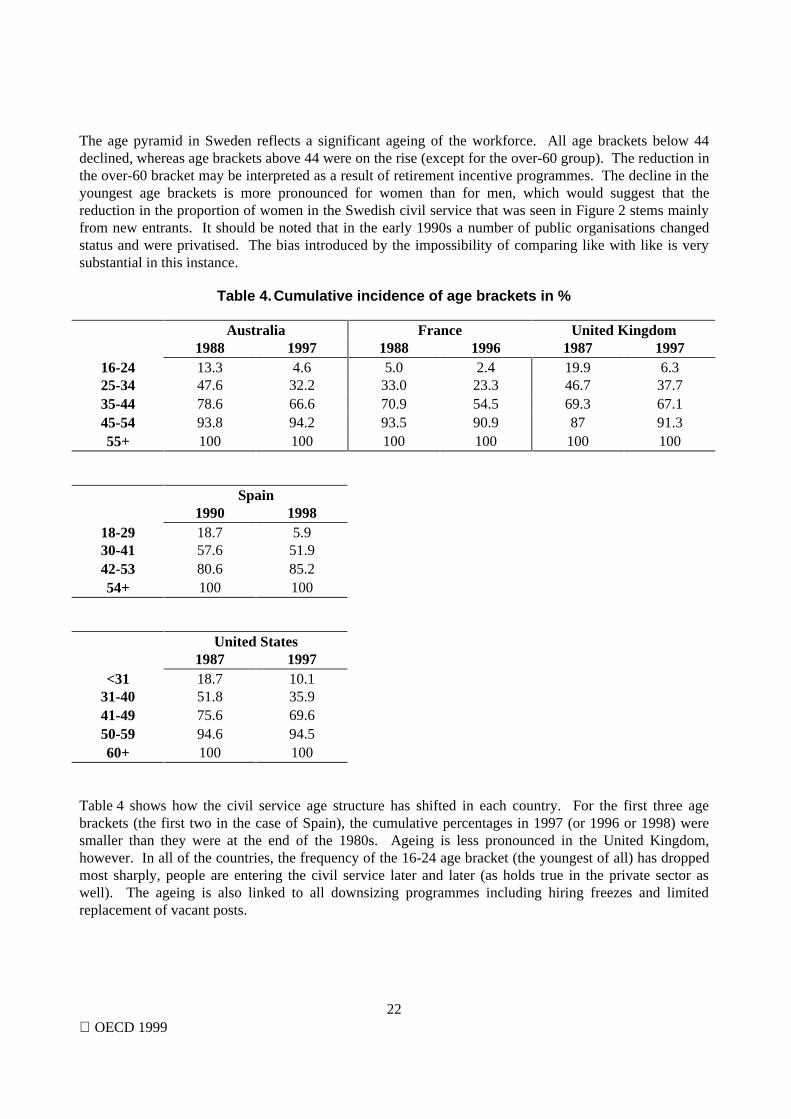
The age pyramid in Sweden reflects a significant ageing of the workforce. All age brackets below 44declined, whereas age brackets above 44 were on the rise (except for the over-60 group). The reduction inthe over-60 bracket may be interpreted as a result of retirement incentive programmes. The decline in theyoungest age brackets is more pronounced for women than for men, which would suggest that thereduction in the proportion of women in the Swedish civil service that was seen in Figure 2 stems mainlyfrom new entrants. It should be noted that in the early 1990s a number of public organisations changedstatus and were privatised. The bias introduced by the impossibility of comparing like with like is verysubstantial in this instance.
Table 4.Cumulative incidence of age brackets in %
Australia France United Kingdom1988 1997 1988 1996 1987 1997
16-24 13.3 4.6 5.0 2.4 19.9 6.325-34 47.6 32.2 33.0 23.3 46.7 37.735-44 78.6 66.6 70.9 54.5 69.3 67.145-54 93.8 94.2 93.5 90.9 87 91.355+ 100 100 100 100 100 100
Spain1990 1998
18-29 18.7 5.930-41 57.6 51.942-53 80.6 85.254+ 100 100
United States1987 1997
<31 18.7 10.131-40 51.8 35.941-49 75.6 69.650-59 94.6 94.560+ 100 100
Table 4 shows how the civil service age structure has shifted in each country. For the first three agebrackets (the first two in the case of Spain), the cumulative percentages in 1997 (or 1996 or 1998) weresmaller than they were at the end of the 1980s. Ageing is less pronounced in the United Kingdom,however. In all of the countries, the frequency of the 16-24 age bracket (the youngest of all) has droppedmost sharply, people are entering the civil service later and later (as holds true in the private sector aswell). The ageing is also linked to all downsizing programmes including hiring freezes and limitedreplacement of vacant posts.

OECD 199923
Age of entry into the civil service
Most often, the civil service offered new recruits long-term career prospects. In the private sector, jobinsecurity is currently on the rise (with fixed-term contracts, temping, internships, etc.), and workermobility is increasing. These trends are not as great in the civil service, even if in some countries theauthorities are introducing incentive programmes for mobility, between the public and private sectors inparticular.
Table 5. Incidence of entries into the civil service, by age bracket
Australia United Kingdom1988 1997 1987 1997
(16-24) 30.0 22.1 57.0 32.1(25-34) 32.7 34.4 19.0 30.6(35-44) 23.4 26.9 14.0 19.4
45+ 14.0 16.6 10.0 17.9
In Australia and The United Kingdom, more than half of the employees enter the civil service prior to age34 (respectively, 56 per cent and 63 per cent in 1997). Between 1988 and 1997, the incidence of entrydeclined significantly for people under 24 years of age. There was a notable rise in the proportion ofpeople over 45 (who in 1997 accounted for 17.9 per cent in the United Kingdom and 16.6 per cent inAustralia). The table below shows the ratio of the percentage of entrants to the percentage of servingstaff, by age bracket.
Table 6.Relative hiring intensity, by age bracket *
Australia United Kingdom1988 1997 1987 1997
(16-24) 2.44 4.80 2.87 5.13(25-34) 0.95 1.25 0.71 0.97
(35-44) 0.75 0.78 0.62 0.66
45-54 0.62 0.50 .. ..
45 + .. .. 0.33 0.54
55 + 0.72 0.47 .. ..* Ratio of the percentage of new hires to the percentage of jobs in the age bracket.
In this two countries, the proportion of young people (aged 16-24) in new hires was about 2.5 times theirshare in the workforce in 1988, and about 5 times as great in 1997. This means that young people accountfor a much higher percentage of new hires than of the workforce as a whole. For the other age brackets,this ratio is always less than 1. In the 25-34 age bracket, the ratio rose in both countries, reflecting theincreasing age of entry into the civil service. The older the age bracket, the lower the hiring intensity.Older civil servants make up a lesser proportion of new hires than of total employment.

OECD 199924
In the case of France, there are no data on the age of entry into the civil service. Nevertheless, theDGAFP explains that the average age of entry into the civil service has been stable since 1990. Theaverage age of entry is estimated to be 26.1 for men and 25.6 for women.
Section 5 - Civil service inflows and outflows
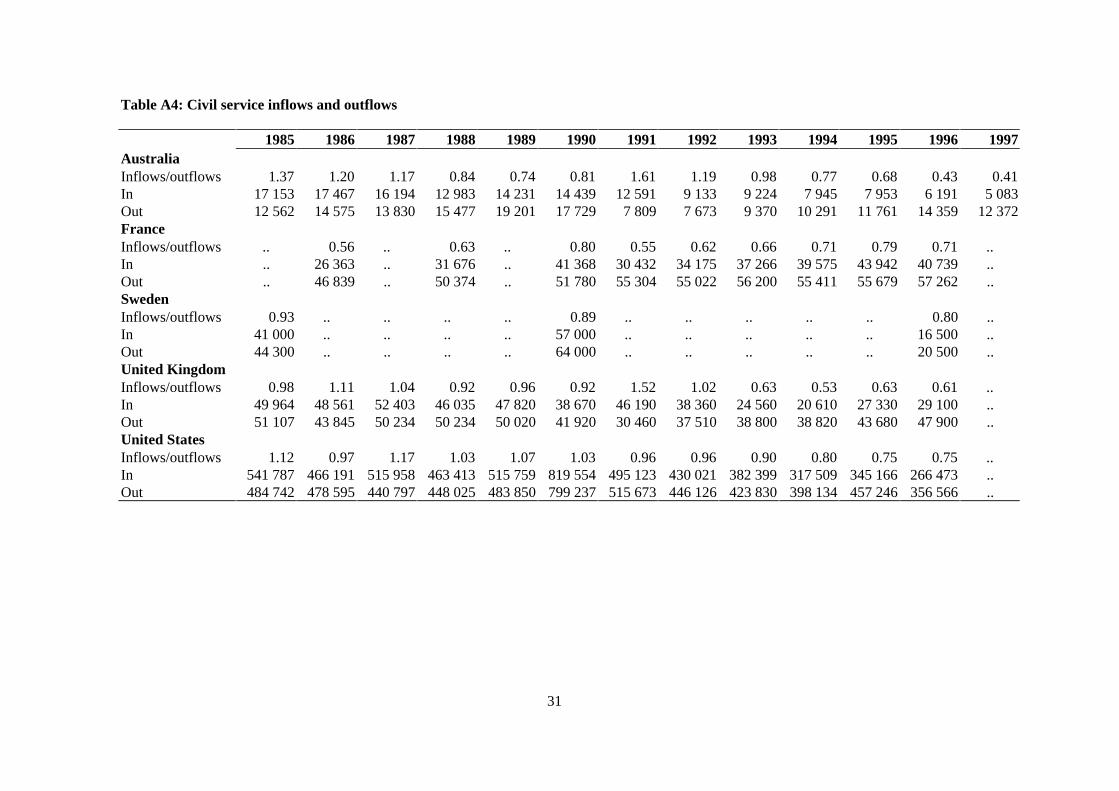
The renewal rate of civil service employees is an important indicator of growth, and of the determinationto renew the workforce. Figure 7 shows how civil service inflows and outflows have evolved. ForSweden, we do not have data for all years.

OECD 199925
Figure 7. Flows: the ratio of inflows to outflows
United States
0
0.2
0.4
0.6
0.8
1
1.2
1.4
1.6
1985 1987 1989 1991 1993 1995 1997
0
300 000
600 000
900 000
In Out Inflows / outflows
United Kingdom
0
0.2
0.4
0.6
0.8
1
1.2
1.4
1.6
1985 1987 1989 1991 1993 1995 1997
0
20 000
40 000
60 000France
0
0.2
0.4
0.6
0.8
1
1.2
1.4
1.6
1985 1987 1989 1991 1993 1995 1997
0
20 000
40 000
60 000
Australia
0
0.2
0.4
0.6
0.8
1
1.2
1.4
1.6
1985 1987 1989 1991 1993 1995 1997
0
6 000
12 000
18 000
Sweden
0
0.2
0.4
0.6
0.8
1
1.2
1.4
1.6
1985 1987 1989 1991 1993 1995 1997
0
20 000
40 000
60 000
80 000
For France: Inflows = number of people passing the competitive examination for entry into the civil service, Outflows =number of people retiring (with entitlement). The competitive examination is the primary (but not the only) way to enterthe civil service. When all recruiting processes are taken into account, the volume of the civil service increases.In the United States, the peaks of inflows and outflows in 1990 correspond to a temporary increase in staffing levels toconduct the 1990 population census.

OECD 199926
For the period 1985-1997, it is difficult to detect a trend regarding the renewal rate. Only the UnitedStates shows a continuous trend towards workforce reduction over the entire period. In Australia, therewas a decline from 1985 until 1990, and then in 1991 and 1992 the renewal rate was once again greaterthan 1. This change in trend was due mainly to a sharp fall-off in departures. Nevertheless, since 1991there was a steady drop in the renewal rate. In the United Kingdom, the trend was the same as inAustralia, but the reasons were different. The 1991 increase stemmed both from a decline in departuresand a rise in entries. In France, the renewal rate was less than 1 over the period as a whole and the numberof departures was fairly stable, but the number of entries fluctuated from one year to another. In Sweden,the rate was less than 1 for the period as a whole and recorded a slight decline.
Beginning in 1993, the renewal rates were less than 1 in all of the countries represented in the charts. Thismeans that not all people who left the civil service were replaced. In 1996, in France and the UnitedStates, there were approximately three entries for every four departures, and in the United Kingdom therenewal rate was less than three departures for every two entries. It is Australia that shows the lowest rate,with five departures for every two entries in 1997.

OECD 199927
ANNEX 1: STATISTICAL SOURCES
Australia:
− Australian Public Service, Statistical Bulletin, Department of Finance (1987 to 1997)
Canada:
− Employment Statistics for the Federal Public Service
− Employment Equity in the Federal Public Service – Annual Report
France:
− La Fonction Publique de l’Etat, INSEE Résultats
− Séries longues sur l’emploi dans la fonction publique (1980-1996), DGAFP
− La fonction publique de l’Etat, Ministère de la Fonction Publique
Spain:
− Boletín Estadístico del Registro Central de Personal (1990, 1995 and 1998)
Sweden:
− Statistics Sweden
− Swedish Agency for Government Employers
United Kingdom:
− Civil Service Statistics, Government Statistical Service (1987, 1989-90, 1996 and 1997)
United States:
− The Fact Book 1997, Federal Civilian Workforce Statistics, United States Office ofPersonnel Management.
− Office of Personnel Management
Data concerning the economy as a whole are taken from:
− OECD Labour Force Statistics and OECD Employment Outlook, June 1998
OECD 199928
ANNEX 2: DATA
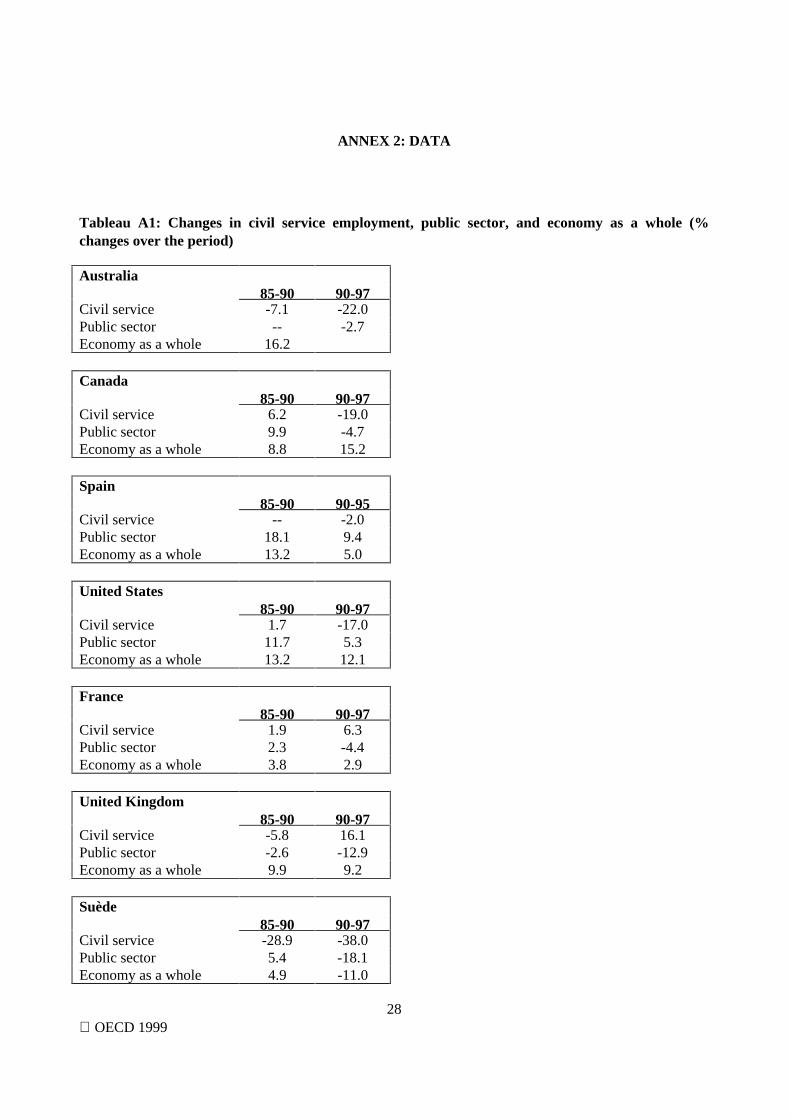
Tableau A1: Changes in civil service employment, public sector, and economy as a whole (%changes over the period)
Australia85-90 90-97
Civil service -7.1 -22.0Public sector -- -2.7Economy as a whole 16.2
Canada85-90 90-97
Civil service 6.2 -19.0Public sector 9.9 -4.7Economy as a whole 8.8 15.2
Spain85-90 90-95
Civil service -- -2.0Public sector 18.1 9.4Economy as a whole 13.2 5.0
United States85-90 90-97
Civil service 1.7 -17.0Public sector 11.7 5.3Economy as a whole 13.2 12.1
France85-90 90-97
Civil service 1.9 6.3Public sector 2.3 -4.4Economy as a whole 3.8 2.9
United Kingdom85-90 90-97
Civil service -5.8 16.1Public sector -2.6 -12.9Economy as a whole 9.9 9.2
Suède85-90 90-97
Civil service -28.9 -38.0Public sector 5.4 -18.1Economy as a whole 4.9 -11.0
OECD 199929
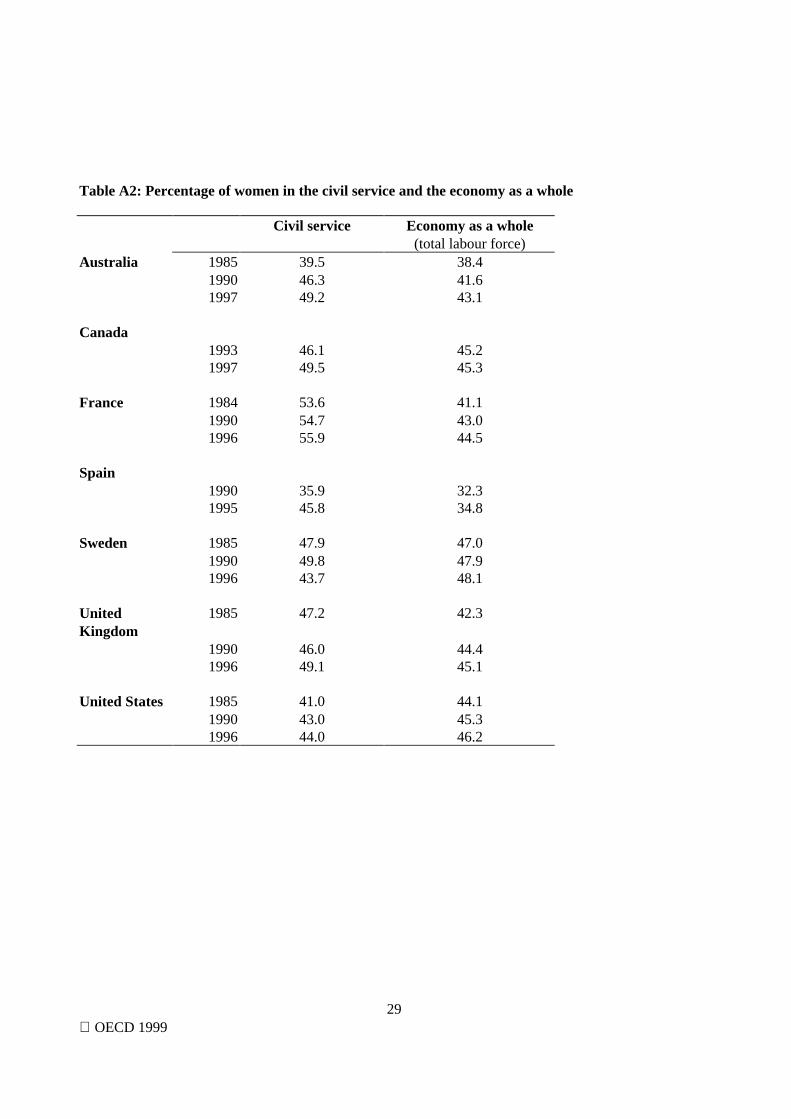
Table A2: Percentage of women in the civil service and the economy as a whole
Civil service Economy as a whole(total labour force)
Australia 1985 39.5 38.41990 46.3 41.61997 49.2 43.1
Canada1993 46.1 45.21997 49.5 45.3
France 1984 53.6 41.11990 54.7 43.01996 55.9 44.5
Spain1990 35.9 32.31995 45.8 34.8
Sweden 1985 47.9 47.01990 49.8 47.91996 43.7 48.1
UnitedKingdom
1985 47.2 42.3
1990 46.0 44.41996 49.1 45.1
United States 1985 41.0 44.11990 43.0 45.31996 44.0 46.2
OECD 199930
Table A3: Number of managers in the civil service
Australia Managers 1990 1997 Changes in %90-97
Women 175 312 78.3Men and women 1 563 1 502 -3.9
Canada Executives 1994 1997 Changes in %94-97
Women 708 748 5.6Men and women 3 878 3 258 -16.0
France Managers 1990 1996 Changes in %90-96
Women 182 794 333 912 82.7Of which primary andsecondary school teacher 104 408 248 071 137.5
Men and women 491 330 698 948 42.3Of which primary andsecondary school teacher 195 331 422 570 116.3
United Kingdom Grades 6&7 1990 1997 Changes in %90-97
Women 1 646 3 680 123.6Men and women 17 522 19 740 12.7
United States Professionals 1990 1996 Changes in %90-96
Women 156 294 172 315 10.2Men and women 463 576 459 121 -1.0
31
Table A4: Civil service inflows and outflows
1985 1986 1987 1988 1989 1990 1991 1992 1993 1994 1995 1996 1997AustraliaInflows/outflows 1.37 1.20 1.17 0.84 0.74 0.81 1.61 1.19 0.98 0.77 0.68 0.43 0.41In 17 153 17 467 16 194 12 983 14 231 14 439 12 591 9 133 9 224 7 945 7 953 6 191 5 083Out 12 562 14 575 13 830 15 477 19 201 17 729 7 809 7 673 9 370 10 291 11 761 14 359 12 372FranceInflows/outflows .. 0.56 .. 0.63 .. 0.80 0.55 0.62 0.66 0.71 0.79 0.71 ..In .. 26 363 .. 31 676 .. 41 368 30 432 34 175 37 266 39 575 43 942 40 739 ..Out .. 46 839 .. 50 374 .. 51 780 55 304 55 022 56 200 55 411 55 679 57 262 ..SwedenInflows/outflows 0.93 .. .. .. .. 0.89 .. .. .. .. .. 0.80 ..In 41 000 .. .. .. .. 57 000 .. .. .. .. .. 16 500 ..Out 44 300 .. .. .. .. 64 000 .. .. .. .. .. 20 500 ..United KingdomInflows/outflows 0.98 1.11 1.04 0.92 0.96 0.92 1.52 1.02 0.63 0.53 0.63 0.61 ..In 49 964 48 561 52 403 46 035 47 820 38 670 46 190 38 360 24 560 20 610 27 330 29 100 ..Out 51 107 43 845 50 234 50 234 50 020 41 920 30 460 37 510 38 800 38 820 43 680 47 900 ..United StatesInflows/outflows 1.12 0.97 1.17 1.03 1.07 1.03 0.96 0.96 0.90 0.80 0.75 0.75 ..In 541 787 466 191 515 958 463 413 515 759 819 554 495 123 430 021 382 399 317 509 345 166 266 473 ..Out 484 742 478 595 440 797 448 025 483 850 799 237 515 673 446 126 423 830 398 134 457 246 356 566 ..


