Page 1
University of South FloridaScholar Commons
Graduate Theses and Dissertations Graduate School
1-1-2013
Structured Materials for Catalytic and SensingApplicationsSelma HokenekUniversity of South Florida, [email protected]
Follow this and additional works at: http://scholarcommons.usf.edu/etd
Part of the Biomedical Engineering and Bioengineering Commons, Chemical EngineeringCommons, and the Materials Science and Engineering Commons
This Dissertation is brought to you for free and open access by the Graduate School at Scholar Commons. It has been accepted for inclusion inGraduate Theses and Dissertations by an authorized administrator of Scholar Commons. For more information, please [email protected] .
Scholar Commons CitationHokenek, Selma, "Structured Materials for Catalytic and Sensing Applications" (2013). Graduate Theses and Dissertations.http://scholarcommons.usf.edu/etd/4507
Page 2
Structured Materials for Catalytic and Sensing Applications
by
Selma Hokenek
A dissertation submitted in partial fulfillment
of the requirements for the degree of
Doctor of Philosophy
Department of Chemical and Biomedical Engineering
College of Engineering
University of South Florida
Major Professor: John N. Kuhn, Ph.D.
Scott W. Campbell, Ph.D.
Jeffrey A. Cunningham, Ph.D.
W. Garrett Matthews, Ph.D.
Venkat R. Bhethanabotla, Ph.D.
Date of Approval:
March 27, 2013
Keywords: nanoparticle shape control, nanoparticle size control, bimetallic, nickel,
palladium, silver
Copyright © 2013, Selma Hokenek
Page 3
2
Dedication
I would like to dedicate this work to my advisor, Dr. John Kuhn, without whom
none of this would have been remotely possible, to my wonderful supportive family and
friends, who have helped keep me focused through all the stressful moments, to my co-
workers, who helped me out when I hit a roadblock or supplied ice cream when the
occasion demanded, and to those students who take up the thread of this research after
me, may their roads be smooth.
Page 4
3
Acknowledgments
Funding for this work, provided by NREL subcontract No.8 XGB-0-40646-01,
Hinkley Center for Solid and Hazardous Waste Management, a Florida Energy Systems
Consortium Seed Grant, and the USF Internal Awards Program under Grant No.
0074332, are gratefully acknowledged. Portions of this work were performed at the
DuPont-Northwestern-Dow Collaborative Access Team (DND-CAT) located at Sector 5
of the Advanced Photon Source (APS). DND-CAT is supported by E.I. DuPont de
Nemours & Co., The Dow Chemical Company and the State of Illinois. Use of the APS
was supported by the U.S. Department of Energy, Office of Science, Office of Basic
Energy Sciences, under contract number DEAC02-06CH11357. Assistance from the
DND-CAT beamline scientists, especially to Qing Ma, is greatly appreciated. For their
assistance in nanoparticle synthesis, we would like to acknowledge undergraduates John
Ammerman, Crystal Bennett, and Curtis Thompson. Additionally, we would like to thank
Mr. Edward Haller for providing access to and troubleshooting for TEM imaging and Mr.
Jay Bieber for his valuable advice and technical know-how. We would like to
acknowledge the USF Nanotechnology Research and Education Center for providing
access to and support for XRD, high resolution TEM, and STEM-EDX.
And last, but certainly not least, the wonderful Ms. Catherine Burton and the rest
of the thesis format team who helped make writing this document as painless as possible.
Page 5
i
Table of Contents
List of Tables ..................................................................................................................... iii
List of Figures .................................................................................................................... iv
Abstract ............................................................................................................................. vii
Chapter 1: Introduction ....................................................................................................... 1 1.1. Motivation and Objectives ............................................................................... 1
1.1.1. Objectives ......................................................................................... 4 1.1.2. Hypotheses ........................................................................................ 5
1.2. Background and Significance .......................................................................... 6 1.2.1. Polyol Synthesis ................................................................................ 6 1.2.2. Active Site Correlation with Surface Planes ................................... 10
1.2.3. Surface Plasmon Resonance (SPR) ................................................ 11 1.2.4. Ni-Pd Size and Shape Effects ......................................................... 11
1.2.5. Ni-Pd Segregation ........................................................................... 13 1.2.6. Ag-Pd Nanoparticles ....................................................................... 14
1.2.7. Ni-Pd Composition Effects ............................................................. 17
Chapter 2: Analysis Techniques ....................................................................................... 19 2.1. Transmission Electron Microscopy (TEM) ................................................... 19 2.2. X-Ray Diffraction (XRD) .............................................................................. 20
2.3. Energy Dispersive X-ray Spectroscopy (EDS or EDX) ................................ 21 2.4. Ultraviolet-Visible Spectrometry (UV-VIS).................................................. 21
2.5. Mass Spectrometry (MS) ............................................................................... 22 2.5.1. Temperature Programmed Reduction (TPR) .................................. 22
2.5.2. Temperature Programmed Reaction Spectroscopy (TPRS) ........... 23 2.5.3. Temperature Programmed Oxidation (TPO) .................................. 23
2.6. X-Ray Absorption Spectroscopy (XAS) ........................................................ 23
Chapter 3: Role of Pd Nanoparticle Size in Methanol Decomposition Reaction ............. 25 3.1. Experimental Details ...................................................................................... 25
3.1.1. Polyol Synthesis .............................................................................. 25
3.1.2. Silica Support .................................................................................. 26 3.2. Characterisation Techniques .......................................................................... 27 3.3. Results and Discussion .................................................................................. 30 3.4. Conclusions .................................................................................................... 38
Page 6
ii
Chapter 4: Synthesis and Characterization of Shape-Controlled Ni-Pd Nanoparticles .... 40 4.1. Experimental Details ...................................................................................... 40 4.2. Characterisation Techniques .......................................................................... 41 4.3. Results and Discussion .................................................................................. 42
4.4. Conclusions .................................................................................................... 49
Chapter 5: Effect of Shape and Composition on SPR in Ag and Pd Nanoparticles ......... 51 5.1. Experimental Details ...................................................................................... 52 5.2. Characterisation Techniques .......................................................................... 54
5.3. Results and Discussion .................................................................................. 55 5.4. Conclusions .................................................................................................... 66
Chapter 6: Conclusions and Outlook ................................................................................ 68
References ......................................................................................................................... 71
Appendices ........................................................................................................................ 85
Appendix 1: EXAFS Experimental Details .......................................................... 86 Appendix 2: Casino Monte Carlo Simulations ..................................................... 87 Appendix 3: Journal Reprint Permissions............................................................. 90
About the Author ................................................................................................... End Page
Page 7
iii
List of Tables
Table 1: Molar Ratios and Calculated mg Amounts of Pd(II) and Pd(IV) Precursors ..... 26
Table 2: Change in Coking Rate with Particle Size .......................................................... 38
Table 3: Bimetallic NiPd Nanocube Synthesis Characteristics ........................................ 42
Table 4: Ag Nanoparticle Shape Distributions. ................................................................ 55
Page 8
iv
List of Figures
Figure 1: Schematic representation of a polyol synthesis for the production of Ag
nanoparticles. ...........................................................................................................6
Figure 2: Surface planes of differently shaped nanoparticles ..............................................7
Figure 3: Generalised representation of the La Mer model of nucleation ...........................8
Figure 4: Effect of synthesis conditions on surface facet growth rate .................................9
Figure 5: Principles of XAS. ..............................................................................................24
Figure 6: Schematic representation of the one-pot polyol synthesis method for
fabricating monometallic Pd nanoparticles of controlled sizes .............................27
Figure 7: XRD spectra of Pd nanoparticles synthesized through the one-pot polyol
synthesis .................................................................................................................31
Figure 8: Average diameter measured in TEM and calculated Scherrer diameter of
synthesized Pd nanoparticles .................................................................................32
Figure 9: XANES region as a function of percentage of Pd particle size..........................33
Figure 10: Hydrogen production during methanol dry reforming as a function of
reaction temperature, and (inset) peak methanol conversion TOF versus
particle size calculated in terms of mol sec-1 atom-1 ............................................35
Figure 11: TPRS results for the methanol decomposition reaction run on the smallest
(0% Pd(IV)) Pd catalysts. ......................................................................................36
Figure 12: Reaction network as determined through TPRS studies ..................................37
Figure 13: (left) HRTEM of a nanocube synthesized at a reduction temperature of
160°C, with a TTAB molar ratio of 30:1 ...............................................................43
Page 9
v
Figure 14: Influence of molar ratio of bromide ion to metal atom on shape distribution
in NiPd alloy nanoparticles (A: 15:1, B: 30:1, and C: 50:1) at a reduction
temperature of 160°C .............................................................................................44
Figure 15: Influence of reduction temperature on shape distribution in NiPd alloy
nanoparticles (A: 140°C, B: 160°C, and C: 180°C) with a TTAB:precursor
molar ratio of 30:1 .................................................................................................44
Figure 16: (left) The bright field STEM image of particles in the sample with the
most cubes ..............................................................................................................45
Figure 17: (left) The bright field STEM image of particles in the sample with the
most cubes and rods ...............................................................................................46
Figure 18: XRD profiles of all NiPd nanoparticle samples ...............................................48
Figure 19: TEM images of Ag nanocubes and polyhedra taken at an acceleration
voltage of 60 kV and a magnification of (A,C) 44kx, and (B,D) 180kx. ..............56
Figure 20: TEM images of Pd nanoboxes with (A) 10 nm Pd shell, (B) 6 nm Pd shell,
and (C) 5 nm Pd shell.............................................................................................57
Figure 21: X-ray diffractograms of (A)Ag nanocubes, (E)Ag polyhedra, and Pd
nanoboxes with (B)10 nm, (C) 6 nm, and (D) 5 nm wall thicknesses. ..................58
Figure 22: Deconvolution of Ag(111) and AgO(111) XRD peaks observed in Ag
nanocubes. ..............................................................................................................59
Figure 23: SEM image of Ag nanocubes synthesized. ......................................................61
Figure 24: SEM image of an Ag nanocube and its corresponding EDS line scan.............62
Figure 25: UV-Vis spectra of Ag nanocubes, polyhedra, and hollow Pd nanocubes. .......63
Figure 26: UV-Vis spectra of physical mixtures of Ag polyhedra and as-synthesized
Pd nanoboxes .........................................................................................................63
Figure 27: Variation in UV-Vis peak positions of physical mixtures of Ag polyhedra
and fractionated Pd nanoboxes ..............................................................................64
Page 10
vi
Figure 28: Variation in UV-Vis peak positions of physical mixtures of Ag cubes and
fractionated 6 nm wall Pd nanoboxes ....................................................................65
Figure A2-1: Simulated Ag nanocube under a 25 kV electron beam with 5 nm
diameter................................................................................................................. 87
Figure A2-2: Simulated Ag nanocube under a 10 kV electron beam with 5 nm
diameter................................................................................................................. 88
Figure A2-3: Simulated Ag nanocube under a 5 kV electron beam with 5 nm
diameter................................................................................................................. 89
Page 11
vii
Abstract
The optical and chemical properties of the materials used in catalytic and sensing
applications directly determine the characteristics of the resultant catalyst or sensor. It is
well known that a catalyst needs to have high activity, selectivity, and stability to be
viable in an industrial setting. The hydrogenation activity of palladium catalysts is known
to be excellent, but the industrial applications are limited by the cost of obtaining catalyst
in amounts large enough to make their use economical. As a result, alloying palladium
with a cheaper, more widely available metal while maintaining the high catalytic activity
seen in monometallic catalysts is, therefore, an attractive option. Similarly, the optical
properties of nanoscale materials used for sensing must be attuned to their application. By
adjusting the shape and composition of nanoparticles used in such applications, very fine
changes can be made to the frequency of light that they absorb most efficiently.
The design, synthesis, and characterization of (i) size controlled monometallic
palladium nanoparticles for catalytic applications, (ii) nickel-palladium bimetallic
nanoparticles and (iii) silver-palladium nanoparticles with applications in drug detection
and biosensing through surface plasmon resonance, respectively, will be discussed. The
composition, size, and shape of the nanoparticles formed were controlled through the use
of wet chemistry techniques. After synthesis, the nanoparticles were analyzed using
physical and chemical characterization techniques such as X-Ray Diffraction (XRD),
Transmission Electron Microscopy (TEM), and Scanning Transmission Electron
Page 12
viii
Microscopy- Energy-Dispersive Spectrometry (STEM-EDX). The Pd and Ni-Pd
nanoparticles were then supported on silica for catalytic testing using mass spectrometry.
The optical properties of the Ag-Pd nanoparticles in suspension were further investigated
using ultraviolet-visible spectrometry (UV-Vis).
Monometallic palladium particles have been synthesized and characterized to
establish the effects of nanoparticle size on catalytic activity in methanol decomposition.
The physicochemical properties of the synthesized palladium-nickel nanoparticles will be
discussed, as a function of the synthesis parameters. The optical characteristics of the Ag
and Pd nanoparticles will be determined, with a view toward tuning the response of the
nanoparticles for incorporation in sensors. Analysis of the monometallic palladium
particles revealed a dependence of syngas production on nanoparticle size. The peak and
steady state TOFs increased roughly linearly with the average nanoparticle diameter. The
amount of coke deposited on the particle surfaces was found to be independent on the
size of the nanoparticles. Shape control of the nickel-palladium nanoparticles with a high
selectivity for (100) and (110) facets (≤ 80%) has been demonstrated. The resulting alloy
nanoparticles were found to have homogeneous composition throughout their volume and
maintain FCC crystal structure. Substitution of Ni atoms in the Pd lattice at a 1:3 molar
ratio was found to induce lattice strains of ~1%. The Ag nanocubes synthesized exhibited
behavior very similar to literature values, when taken on their own, exhibiting a pair of
distinct absorbance peaks at 350 nm and 455 nm. In physical mixtures with the Pd
nanoparticles synthesized, their behavior showed that the peak position of the Ag
nanocubes’ absorbance in UV-Vis could be tuned based on the relative proportions of the
Ag and Pd nanoparticles present in the suspension analysed. The Ag polyhedra
Page 13
ix
synthesized for comparison showed a broad doublet peak throughout the majority of the
visible range before testing as a component in a physical mixture with the Pd
nanoparticles. The addition of Pd nanoparticles to form a physical mixture resulted in
some damping of the doublet peak observed as well as a corresponding shift in the
baseline absorbance proportional to the amount of Pd added to the mixture.
Page 14
1
Chapter 1: Introduction
1.1. Motivation and Objectives
The motivation behind this work has its roots in several different aspects of the
current research into the shape control of nanoparticles synthesized for catalytic and
sensing applications. Control of nanoparticle shape has the effect of allowing for the
selective preparation of crystallites with specific atomic planes at the particle surface.
Through the use of ions or capping agents during the synthesis of the nanoparticle
catalyst, specific surface planes can be selected for[40-46]. By selecting for specific
surface planes during the synthesis procedure, the catalytic properties of the nanoparticles
formed can be tuned to allow the reaction under consideration to run more quickly by
increasing the prevalence of available active sites. This bottom-up synthesis strategy can
also be applied in the development of nanoparticles for SPR and magnetic sensing
applications[47] as a result of the influence of nanoparticle shape on their optical
properties.
Currently, as is well known, there is a search for economical and reliable methods
of producing renewable energy. The primary driving force behind this search is the
fundamentally finite nature of the use of existing fossil fuel deposits for the generation of
energy. This has led to the investigation of a wide variety of different technologies,
including solar cells, geothermal energy, fuel cells, and hydrogen generation. None of
these technologies is truly mature yet, however. There are a wide variety of problems that
Page 15
2
must be addressed before their implementation in place of fossil fuels is viable. The cost
is perhaps the toughest barrier to overcome, though other issues such as efficiency and
product lifetime also play important roles. The specific properties of the materials utilized
then come into play. In catalytic applications, as in sensing, the material surface
characteristics become extremely important.
In the work which will be discussed herein, the generation of hydrogen and
synthesis gas (syngas) will be addressed as the primary focus of chapter 3. The catalysts
that are currently most frequently used to generate hydrogen and syngas on a scale as is
feasible for testing in a laboratory setting are synthesized from noble metals, such as
platinum (Pt), and palladium (Pd). It is the rarity of these materials, and the cost of
mining and refining them, which is a major factor limiting their widespread use in large
scale industrial processes. The use of bimetallic Pt[1-15] and Pd[1-3, 5, 10, 11, 13, 15-38]
catalysts, which combine one of the two metals with a second, more widely available,
metal, has been investigated in recent years. Popular choices of bimetallic catalysts to
investigate include Pt-Pd[2, 3, 5, 10], Ni-Pt[4, 6, 8, 9, 11-13, 39], and Ni-Pd[11, 13, 23,
25, 28, 31, 33, 34].
Size control of the synthesized nanoparticles has been shown to provide a
mechanism which can be used to tune the optical properties of photocatalysts and
nanoparticles synthesized for applications in luminescence enhancement, as well as their
catalytic properties. In the preparation of cubic Ag nanoparticles, it has been shown that a
particle size of greater than 50 nm gives the highest response[48-50]. A wide variety of
catalytic reactions have been shown to proceed with rates corresponding to the size of the
nanoparticle catalyst[46, 51-61].
Page 16
3
Methanol dry reforming and methanol decomposition were used as model
reactions for the production of hydrogen in the work presented herein, as well as for the
production of syngas, as both products can be formed through these reactions. The effect
of Pd nanoparticle size on catalytic activity in both reactions has not yet been established
in the literature.
Similarly, the effects of shape and size of NiPd nanoparticles on their properties
as sensor materials have not been investigated in depth in the literature. Ni particles have
been used in biosensing applications such as the detection of acetaminophen[62] and
cancer cells[63]. However, there is not yet a clear methodology for the synthesis of
shape-controlled bimetallic NiPd nanoparticles in the literature. A synthesis procedure for
the fabrication of shape-controlled NiPd nanoparticles will therefore be developed, in
order to allow for the determination of the relationship between the nanoparticles’
morphology and their behavior as sensing materials.
Ag and Pd nanoparticles were tested for their optical properties, for potential
applications in sensing and plasmon-aided photocatalysis. Ag has been shown to be
sensitive to incident photons, resulting in the oscillation of surface electrons and the re-
radiation of the imparted energy as light through the generation of surface plasmons. This
effect can be used to advantage in the development of highly sensitive analysis
techniques such as Surface-Enhanced Raman Scattering (SERS) and biomedical
applications such as biosensing[64-66], and immunoassays[67].
Page 17
4
1.1.1. Objectives
The objectives of this work can be stated to be as follows in the context of the
current state of the field:
To determine whether the methanol decomposition reaction is structure sensitive
when Pd nanoparticle catalyst is used, with and without co-fed CO2, with the
long-term goal of using the knowledge gained to improve existing industrial
catalysts for the production of syngas.
To develop a synthetic procedure based on the polyol technique to synthesize
shape-controlled nanoparticles with bimetallic NiPd composition, because shape
control of bimetallic nanoparticles has not yet been investigated in detail in the
literature and the knowledge of how to achieve this would advance efforts to
lower the cost of producing bimetallic nanoparticles for applications in catalysis
or nickel-based biosensors.
To elucidate the effects of physically mixing monometallic nanoparticles on the
location and intensity of the observed surface plasmon resonances. This is
envisioned as a step toward the long-term goal of producing finely tuned SPR
biosensors. Scaling up a monometallic synthesis may be simpler than a bimetallic
synthesis and still may maintain a high degree of homogeneity in the
nanoparticles produced.
Page 18
5
1.1.2. Hypotheses
Three hypotheses will be tested, each correlating with one of the stated objectives.
Hypothesis 1: The methanol decomposition reaction will show increased turnover
frequency as the diameter of the Pd nanoparticles used increases. Further, the size
of nanoparticles synthesized can be tuned through the use of Pd precursors with
different oxidation states by taking advantage of the difference in the reduction
temperatures of the precursors and the associated nucleation rates.
Hypothesis 2: Ni-Pd nanoparticles with shape control can be synthesized using a
modified polyol procedure. Cubic and rod-shaped nanoparticles will be formed
with higher frequency than polyhedral particles when using capping agents in the
synthesis which favor the stabilization of (100) and (110) surface planes in
monometallic syntheses of both Ni and Pd.
Hypothesis 3: The location and intensity of SPR peaks generated by Ag
nanocubes, Ag polyhedra, and Pd nanoboxes, respectively, will be affected by
nanoparticle size and relative concentrations when combined into physical
mixtures. It is expected that Ag nanocubes will generate a higher response than
Ag polyhedra.
Page 19
6
1.2. Background and Significance
1.2.1. Polyol Synthesis
A polyol synthesis is a procedurally simple methodology used to make
nanoparticles. It is possible to ensure that the nanoparticles synthesized are of uniform
size, shape, or composition, as needed, through the addition of stabilizing agents, as well
as through the careful control of the synthesis conditions. The name of the technique
originated as a result of the particular chemistry involved. A polyol is a compound that
contains multiple hydroxyl (-OH) functional groups. The polyol is generally used as a
solvent in the synthesis, and must be carefully chosen to solvate the metal precursors
used. Ethylene glycol (EG) and 1,5-pentanediol are frequently used. The metal precursors
are generally metal-organic compounds that decompose when heated, freeing the metal
atoms they contain, thus allowing the metal atoms to diffuse through the polyol solvent
and coalesce at available nucleation sites. In order to stabilize the metallic nanoparticles
formed, a polymeric capping agent is sometimes added, to enhance the stability of the
nanoparticles in solution and prevent agglomeration. A commonly used capping agent is
poly(vinyl pyrrolidone) (PVP).
Figure 1: Schematic representation of a polyol synthesis for the production of Ag
nanoparticles.
Page 20
7
The combination of the concentration of metal precursors used, the reduction
temperature set for the synthesis, and the concentration of the capping agent allows for
control over the size and composition of the formed nanoparticles[1-3]. In order to
control the shape of the nanoparticles, other compounds must sometimes be added to the
synthesis. These vary widely based on the composition of the nanoparticles that are being
synthesized and the desired shape. For example, it was reported by Harris that spherical
Pt nanoparticles became nanocubes when the sample was exposed to H2 gas containing a
trace amount of H2S[4]. In the case of Ag nanoparticles, Cl- ions are generally
preferred[5, 6]. The surface planes of a nanoparticle catalyst are defined as those crystal
planes present at the surface of the particle, and are a function of the shape of the
Figure 2: Surface planes of differently shaped nanoparticles. (100) faces are in blue,
(110) faces are in green, and (111) faces are in red.
Page 21
8
nanoparticle. In the case of a cubic particle, for example, the surface planes would all be
(100) planes.
A number of models have been developed to describe the synthesis of
nanoparticles in solution through wet chemistry methods such as the polyol method. One
of these is the La Mer model, as presented in Figure 3. The La Mer model consists of
three phases of crystal growth: (i) induction, (ii) nucleation, and (iii) growth. In phase
one, the concentration of reactant atoms rises steadily with time until it reaches
supersaturation levels, which are essential for nucleation. Once the solution’s saturation
point is reached, phase two begins and spontaneous nucleation occurs. The spontaneous
nucleation events continue until the solution concentration dips back below the saturation
point, at which point phase three begins and the nanoparticles formed enter the growth
stage. In addition to the critical reactant concentration which is required for particle
Figure 3: Generalised representation of the La Mer model of nucleation. Reprinted with
permission from reference [6]. Copyright 2008 John Wiley and Sons.
Page 22
9
nucleation, for the formation of homogenous nanoparticle morphologies a single, rapid
nucleation event is needed.
The morphologies of the nanoparticles produced can be described as a function of
the relative growth rates and energies of the low-index facets of the material in use. Using
the example of a material with an FCC (face-centered cubic) crystal structure possessing
a cuboctahedral shape, the surface facets present are of the {100} or {111} planes. The
final nanoparticle morphology will depend on whether the growth of {100} or {111}
facets is favored under the synthetic conditions used. These growth rates can be
controlled through the use of specific capping agents or solvated ions[7-14]. For example,
it has been shown in the literature that single crystalline Ag seeds grow to different
shapes depending on the binding strength of the capping agents used[15, 16].
Figure 4: Effect of synthesis conditions on surface facet growth rate. Reprinted with
permission from reference[15]. Copyright 2010 American Chemical Society.
The synthesis of hollow nanoparticles is also possible using this methodology, as
a result of phenomena such as selective chemical etching, template-mediated synthesis,
Page 23
10
and the Kirkendall effect[16]. In selective chemical etching, the etchants are used to
selectively remove specific elements of the nanoparticles or facets through chemical
reactions. Template mediated synthesis can be subdivided into two types: (i) core-shell
syntheses, where the template remains intact, and (ii) sacrificial template mediated
syntheses, where the template is partially or completely dissolved, typically with a redox
reaction. If both components involved are metals, the process is termed galvanic
displacement or electroless plating, as the process is primarily driven by the differences
in standard electrode potential of the respective metals. The less noble metal serves as a
presynthesized template and is oxidized under the loss of electrons, resulting in its
dissolution[17]. This process has been taken advantage of by research groups to create
hollow nanoscale materials[18-20].
1.2.2. Active Site Correlation with Surface Planes
A given catalytically active material, be it metal or oxide, will have surface active
sites. The active site that is ‘seen’ by a given chemical reaction that can be driven with
said catalytically active material differs from one reaction to another. The number of
surface sites available will also vary based on the exposed crystal planes at the surface of
the material. Crystal planes have differing atomic packing factors, and, as a result, a
differing electronic structure and also differing numbers of sites with the correct
electronic configuration to drive the reaction being studied. Thus, the shape of the
synthesized nanoparticles will have an impact on their activity and selectivity toward a
reaction of interest[21-28].
Page 24
11
1.2.3. Surface Plasmon Resonance (SPR)
Surface plasmons are electromagnetic waves that propagate along the surface of a
metal. Surface plasmons are very sensitive to changes in the dielectric constant of the
environment the metal is in contact with. This applies to very localized variations, such as
the adsorption of a molecule on the metal surface, as well as to macroscopic changes,
such as putting the metal under high vacuum. In the case of a metal nanoparticle, surface
plasmons can be excited by incident light, and the intensity of the surface plasmons can
be enhanced by tuning the wavelength of the incident photons to the resonance
wavelength of the metal. This frequency can be determined using UV-Vis spectroscopy
in the form of absorbance peaks. Where the metal particles absorb light the most
efficiently, the most surface plasmons will be generated. The position of the absorbance
peak for metal nanoparticles can be tuned by changing the size, shape, and composition
of the nanoparticles[11, 29]. Most metals show little or no plasmonic activity. The
coinage metals gold (Au), silver (Ag), and copper (Cu), show the highest activity, though
other materials can be used.[10, 11, 30-33]
1.2.4. Ni-Pd Size and Shape Effects
Shape control of nanoscale catalysts is important in determining their activity and
selectivity. The crystal faces present at the nanoparticle surface determine the number
and type of active site that the catalyst has. This phenomenon has been established
experimentally in the case of Pd catalyst[34-36]. It has been demonstrated that the
synthesis of shape controlled Pd nanoparticles with a narrow size distribution and high
percentage of the desired shape can be achieved using polyol synthesis in combination
Page 25
12
with a stabilizing agent[37, 38]. Choo et al.[39] showed that by slightly changing the
synthesis conditions, the specific nanoparticle shape obtained could be changed. Further,
the molar ratios of the precursor salt to the polymer, the reducing agent used, and the
synthesis temperature, among others, were all factors influencing the outcome of the
synthesis. As cited in the review by Tao et al.[6], the polymer PVP has been shown to act
as an excellent shape control agent for such metals as Ag[6, 14, 40-42], Au[40, 41], and
Pt[43, 44], among others. Others have shown that PVP can be used in the synthesis of
shape-controlled Pd nanoparticles, as well[34, 35, 38, 42, 45].
To achieve shape control of Ni nanoparticles, a variety of approaches have been
used, including wet chemistry techniques[46-52]. The main factors influencing the size
and shape appear to be a combination of pH, reduction temperature, solvent, and
precursor concentration. As cited in the review by Semagina and Kiwi-Minsker[53], Ni
nanocubes have been synthesized by Telkar et al.[54] using ethanol as a reducing agent
in the presence of a polymeric stabilizing agent, such as poly(vinyl pyrrolidone) (PVP),
or poly(vinyl alcohol) (PVA). Bimetallic Ni-Pd nanoparticles have also been previously
synthesized by the polyol method[55, 56]. However, while synthesis techniques for a
variety of alloys of precious metals have been investigated[57], including Ni-Pt
bimetallic nanoparticles[58], shape controlled Ni-Pd bimetallic catalysts have not.
Additionally, size control of Ni[51, 59-66] and Pd[38, 67, 68] nanoparticles can be
achieved through careful control of the synthesis conditions[67].
The shape of the nanoparticles determines the nature of active sites present and
available for use in a reaction, and thus also the kinetics of the reaction. Since each
catalyzed chemical reaction has a different active site, each reaction will therefore also
Page 26
13
have a preferred crystal face on which it proceeds the most quickly. It has been shown in
the literature that a Ni-Pt alloy will segregate under oxidizing conditions[69]. The
different low index planes of Pt have been shown to have differing kinetics in the
HCOOH oxidation reaction[70]. The low index crystal planes of Pd, on the other hand,
have been tested in the oxygen reduction reaction[71, 72] and demonstrated to have
different properties based on their surface crystal planes. Ni activity in methanol
decomposition has been studied with DFT by Zhou et al[73]. They found that the
mechanism by which the reaction proceeds varies for different low index planes,
suggesting that the reaction is structure sensitive. Based on these results, a change in
activity is expected for different shapes of synthesized Ni-Pd bimetallic particles.
1.2.5. Ni-Pd Segregation
Ni-Pd layer segregation through Low Energy Electron Diffraction Spectroscopy
(LEEDS) shows that Pd is on the surface and Ni is in the second layer under vacuum.[74]
Further, LEEDS also shows that for both the Ni-Pd(100) and Ni-Pd(111) planes the
composition is oscillatory, with the outermost layer containing mostly Pd and the next
Ni[75, 76] as is predicted through surface energy and bond-breaking arguments[76].
Based on the DFT calculations and experimental results of Menning et al.[77] the
segregation of a transition metal such as Ni or Co to the surface of a Pt-M-Pt (111) or
(100) plane is thermodynamically favored in the presence of oxygen. This result is likely
to hold for Pd as well, given the similarities of their properties. Further, under reaction
conditions, the catalyst particles are likely to segregate more due to external forces in the
form of adsorbates, oxidizing agents, or reducing agents, rather than due to the properties
Page 27
14
of the metals themselves. The adsorption-induced segregation behavior of Ni-Pd alloy
particles is not clearly described in the literature. Most experimental studies that address
surface segregation are done under high vacuum prior to or without catalytic testing[74-
76, 78-80], and thus eliminate any influence adsorbates would have on the system under
reaction conditions. Helfensteyn et al found, through a theoretical study using Monte-
Carlo simulation methods, that Pd atoms became surface segregated[81]. Løvvik[82]
performed a DFT band-structure study whose results were in good agreement with those
of Helfensteyn et al. Their results do not take into account adsorbate effects, however.
Menon et al.[83] did a computational study that showed Ni atoms were surface
segregated in the presence of oxygen. Ma et al.[84] did a computational study on Pt3Ni
that showed that there was no segregation of metals with a ¼ monolayer coverage of
oxygen. Menning and Chen have calculated using DFT that the thermodynamic potential
for surface segregation increases with the Pauling electronegativity for a group of
selected adsorbates[85]. No studies have been found on the effects of size and shape on
adsorption-induced nanoparticle segregation effects on Ni and Pd. This information
would be instrumental in helping refine our knowledge of how a bimetallic catalyst’s
activity and selectivity are influenced by composition.
1.2.6. Ag-Pd Nanoparticles
Ag nanoparticles have been found to significantly enhance Raman scattering as a
result of their higher polarizability relative to bulk materials [30]. The nanoparticles
effectively act as antennae to ‘focus’ incident light on the sub-wavelength scale. This
makes possible the sensitivity increase of 106 seen in surface-enhanced Raman scattering
Page 28
15
(SERS) relative to conventional Raman scattering. Nanoparticles of suitable size and
composition to detect single molecules have been demonstrated[31]. The sensitivity
increase is dependent on the size of the nanoparticles used. For nanoparticles of 30nm
and more in diameter, the amount of incident light that is absorbed is much larger than
the amount of scattered light. For particle sizes of less than 30 nm in diameter, more light
is scattered than absorbed.
The synthesis of Ag nanoparticles for use in such applications can be done in a
variety of ways, including the polyol synthesis[14, 42, 86, 87]. The shape of the
nanoparticles synthesized in such a manner is generally controlled through the use of a
polymeric capping agent[12, 86] or solvated halide ions such as Cl-[6, 86]
and Br-[14, 86].
Pd nanoparticles have not been as popular for such applications because they
exhibit a low broad absorbance peak throughout the range of the near-infrared, visible,
and near-UV portions of the light spectrum[1], rather than a sharply defined peak over a
narrow range of wavelengths. As a result, it is not easily possible to tune the wavelength
of the incident light such that the energy is efficiently converted into a usable form. For
metals, such as Ag or Au, that have a sharply defined absorbance peak, the wavelength of
the incident light can be adjusted such that more of it is used effectively. Bimetallic
nanoparticles have been shown to make highly sensitive biochemical sensors[88, 89], and
hydrogen sensors[90-92]. The size and shape of the particles allows the position of the
narrow absorption band to be tuned[1, 6, 30, 40, 45, 86, 93]. As shown by Si et al[32], as
the size of the silver particles synthesized decreases, their absorbance peak is blue-
shifted. However, as the size of the particles was reduced, the shape distribution changed,
with the larger particles having a very uniform size and shape, and the smaller particles
Page 29
16
having spheres and truncated polyhedra present in addition to those particle shapes
desired. Chen et al.[94] synthesized Ag nanoparticles of differing shapes and investigated
their optical properties using UV-Vis spectroscopy. It was found that the shape has a
profound effect on the nanoparticles’ absorption, with the nanocubes exhibiting a broad
absorption peak that spanned most of the visible range, between wavelengths of 400 and
750nm. The synthesized nanospheres had a sharper absorption peak at a wavelength of
440 nm, and the nanoplates also showed a broad absorption peak throughout the visible
range, but with roughly half the absorbance of the nanocubes. Thus, in order to achieve
optimal conversion of incident radiation into surface plasmons, the best particle shape to
use, of those studied, would be a cube. Lu et al.[10] performed a similar study, using
nanocubes and nanobars to study the effect of aspect ratio on the absorption peak, finding
that a higher aspect ratio resulted in a red-shift of the absorption peak.
The addition of Pd to Ag nanocubes shifts the absorption peak. Lee et al.[95]
synthesized hollow Ag-Pd nanoparticles using a displacement reaction, and found that
though monometallic Pd nanoparticles did not show an absorbance peak, the hollow
bimetallic particles did. The absorbance peak of the bimetallic particles was red-shifted,
relative to the absorbance peak of the monometallic Ag nanoparticles synthesized, and
less intense. Chen et al.[19] synthesized Ag-Pd nanoboxes with varying amounts of Pd
added to Ag nanocubes in solution. UV-Vis analysis showed that the more Pd was added,
the more the absorbance peak was red-shifted.
These bimetallic nanoparticles have been used in the design of novel
biosensors[88, 89, 96]. By tuning the absorbance peaks of the nanoparticles used and
increasing their sensitivity to changes in the dielectric interface at their surfaces, the
Page 30
17
efficiency and applicability of nanoparticles as sensors is improved. Thus, by combining
the effects of composition, shape, and size, it is predicted that cubic Ag-Pd nanoparticles
with high sensitivity and well-defined absorbance peak can be synthesized.
1.2.7. Ni-Pd Composition Effects
A recent review on the effect of the physical and chemical characteristics of a
catalyst on its activity[93] was done by Cuenya, citing changes in catalyst activity based
on size, shape, composition, oxidation state, and support effects. In the case of Pt catalyst,
it has been shown that by alloying with other metals, such as Fe, Ru, Ni, and Co, among
others, the catalysts formed show enhanced hydrogenation activity[97-100]. Moreover,
recent theoretical and experimental studies done by Chen’s group[100], show that a Pt-
Ni-Pt structure has superior hydrogenation activity compared to Ni-Pt-Pt. They found that
the presence of Ni atoms at the surface of layered catalysts induced a shift in the d-band
towards the Fermi level, resulting in a stronger surface-adsorbate interaction. By contrast,
when the Ni atoms were subsurface, the opposite trend was observed.
Due to the chemical similarities between Pt and Pd, similar trends can be expected
to be exhibited by synthesized catalyst, and indeed, in reactions such as the oxygen
reduction reaction (ORR) which is of paramount importance in such areas as fuel cell
research, the transfer of electrons from the adatoms of the alloying metal to the Pd to fill
the d-band decreases the density of states (DOS) at the Fermi level[101]. This change in
the DOS affects the adsorption strength of O and OH species on the catalyst surface,
effectively lowering it. This in turn decreases the likelihood that Pd oxide species will
form on the catalyst surface, allowing its activity to be maintained. Similarly, the
Page 31
18
composition of the Pd alloy particles has an effect on their activity[56, 102-104]. For
example, it was shown by Singh et al.[103] that the dependence of hydrogen selectivity
in the decomposition of hydrous hydrazine varied with the ratio of Ni to Pd used in their
catalyst, with the highest selectivities being achieved at compositions containing between
35%-45% Pd.
Page 32
19
Chapter 2: Analysis Techniques
2.1. Transmission Electron Microscopy (TEM)
TEM is an imaging technique similar to light microscopy, but which uses
electrons as its source of illumination, rather than photons. The advantage of using
electrons is that they have a far greater resolving power than photons, due to their much
shorter wavelengths. The resolving power of a microscope is defined by the wavelength
of the source of illumination, as in equation 1, where d is used to denote the maximum
achievable resolution.
Eq. 1
In the case of a light microscope, the resolving power is limited by the
wavelengths visible to the human eye. This is not the case when using electrons for
illumination, as the electrons’ wavelength can be tuned by changing the accelerating
voltage used. The higher the accelerating voltage, the shorter the electrons’ wavelength,
and thus the higher the achievable resolution. When electrons are used, however, other
methods of displaying the image are necessary, such as a phosphorus screen or a CCD
camera. Further, in order to use electrons for imaging, the sample must be placed under
vacuum and be prepared in such a way that it is transparent to the electrons. For most
materials, this falls into the range of 50-200 nm.
Page 33
20
2.2. X-Ray Diffraction (XRD)
XRD is an analytical technique used to identify materials and crystal structures.
Bragg diffraction is most commonly executed, as it allows for the investigation of three
dimensional lattice structures. Bragg diffraction takes advantage of the constructive and
destructive interference of electromagnetic waves being reflected by the crystal planes
present in a single crystal or powder sample. The condition that must be satisfied for
constructive interference to occur is given by Bragg’s Law:
Eq. 2
If a non-integral number of oscillations of the electromagnetic field occur
between crystal planes, the diffracted x-rays interfere destructively. The distance that the
x-rays must travel is determined by the interplanar distance (d), and the angle of
incidence (θ).
Essentially, the peak position in degrees (θ) corresponding to a given crystal plane
is determined by the wavelength of the incident x-rays (λ), and the interplanar distance
(d). This allows for accurate determination of composition due to the high degree of
sensitivity to changes in lattice parameters from element to element. Further, each type of
crystal structure has a characteristic set of ‘allowed’ reflections. Not all crystal planes
present in a sample will generate a diffraction peak as a result of the structure factor of
the lattice[105]. For example, in the case of a face-centered cubic material, only crystal
planes having either all odd indices (e.g. (111), (311)), or all even indices (e.g. (200),
(222)), will be observed.
Page 34
21
2.3. Energy Dispersive X-ray Spectroscopy (EDS or EDX)
EDX is used to determine the elemental composition of a sample. As a result of
the quantized nature of the energy levels of electron orbitals, it is possible to determine
what elements are present in a sample by exciting their electrons. The electrons are
excited using x-rays of high enough energies to ionize the atom by removing an electron
from one of the core orbitals. This, in turn, causes an electron from a higher orbital to
drop down to fill the hole created. When this occurs, an x-ray of characteristic energy is
emitted. The energy of the emitted x-ray is a specific to the element and the orbital
transition occurring. EDX can also be used to determine the locations of specific
elements within a sample through the use of techniques known as elemental mapping and
line-scanning.
2.4. Ultraviolet-Visible Spectrometry (UV-VIS)
UV-VIS spectrometry is used to determine the wavelengths of light, ranging from
190nm - 1200nm, that a sample absorbs. The wavelengths absorbed correspond to the
quantized energies required to induce electrons to transition from an occupied orbital to
an unoccupied one. In the case of molecules, the most common such transition is from
the highest occupied molecular orbital (HOMO) to the lowest unoccupied molecular
orbital (LUMO). When working with optically active metals, such as silver, the
wavelengths at which the material absorbs light correspond to the wavelengths at which
other phenomena, such as localized surface plasmon resonance, occur.
Page 35
22
2.5. Mass Spectrometry (MS)
Mass spectrometry is used to identify molecules and measure concentrations, and
is, at its most basic level, comprised of three steps. First, the molecules to be analyzed are
bombarded with high energy electrons in order to ionize them. The ionized molecules are
then separated according to their mass-to-charge ratios (m/z) using a magnetic or electric
field. The electric or magnetic field is also used to accelerate the molecules toward the
detector, and can be adjusted such that only molecules with a specific mass-to-charge
ratio are striking the detector at any given time. The resulting signal is amplified and then
recorded, generally using a computer.
MS can be used to analyze a wide variety of sample types. The studies presented
in subsequent chapters are based on the analysis of gas-phase chemical reactions. When
used in combination with a flow system and a furnace, catalytic systems can be studied in
detail. The use of a flow system allows for fine control of the gases flowing over the
catalytic material being studied, and the furnace enables control of the temperature at
which the reaction is occurring. In essence, by studying the changes between the inlet and
effluent streams, the activity of the catalyst can be observed and quantified. In the study
of catalytic materials, three temperature-dependent techniques are commonly used.
2.5.1. Temperature Programmed Reduction (TPR)
Temperature programmed reduction is used primarily to determine the degree of
oxidation of a catalyst sample. In some cases, only the reduced metal atom is catalytically
active, and the oxide phase is not. In cases such as these, it is necessary to reduce the
Page 36
23
catalyst before its catalytic properties can be determined. This is typically done by
heating the catalyst sample under reducing conditions.
2.5.2. Temperature Programmed Reaction Spectroscopy (TPRS)
Temperature programmed reaction spectroscopy is commonly used to quantify
the activity of a catalytic material in a given reaction. By adjusting the composition of the
inlet stream to contain the reactants and monitoring the composition of the effluent
stream, the conversion and reaction rate, among other parameters, can be calculated.
When done in combination with the use of a furnace, the changes in catalytic activity
with temperature can be quantified.
2.5.3. Temperature Programmed Oxidation (TPO)
Temperature programmed oxidation is typically used to determine the extent of
carbon deposition on a catalyst sample (coking) post-reaction. The degree of coking can
be quantitatively determined by heating the sample under oxidizing conditions, and
subsequently integrating the area under the CO and CO2 traces, as these are directly
proportional to the amount of coke deposited on the catalyst surface.
2.6. X-Ray Absorption Spectroscopy (XAS)
XAS is a technique based on the same fundamental principles as EDX, but adds a
second layer of complexity. By exciting a core shell electron with enough energy to
create a vacancy, the absorbing atom is brought out of its ground state. This causes an
electron from a higher orbital to drop down to fill the vacancy, and emit a photo-electron
Page 37
24
with characteristic energy, as shown in Figure 5. The emitted photo-electron can be
scattered by neighboring atoms, introducing what is known as a phase-shift. As a result,
the scattering event can cause the photo-electron’s wave function to interfere with itself.
This interference varies with the energy of the incident radiation, causing oscillations in
the probability that the incident radiation will be absorbed. As a result, the sample’s
valence state can be directly measured, and for crystalline structures information about
coordination number can be gained through careful analysis of the data using Fourier
transforms[106].
Figure 5: Principles of XAS.
Page 38
25
Chapter 3: Role of Pd Nanoparticle Size in Methanol Decomposition Reaction
In this chapter, a detailed description of the methods used to synthesize and
characterize size-controlled Pd nanoparticles is given. The first objective is to synthesize
Pd nanoparticles with a narrow size distribution and support them on silica. This is
achieved through use of a one-pot polyol synthesis and a controlled molar ratio of Pd(IV)
and Pd(II) precursors. The nanoparticles synthesized using these techniques were
supported on silica at 2%wt for TPR and TPO analysis as well as catalytic activity
testing.
To determine the physicochemical and catalytic properties of the synthesized
particles, a variety of characterization techniques will be used. In order to ascertain the
physical characteristics of the nanoparticles -- size, shape, crystallinity, and atomic
composition -- TEM, SEM, XRD, and UV-Vis spectroscopy will be utilized. The
catalytic properties will be explored using temperature programmed techniques: TPR,
TPO, and TPSR.
3.1. Experimental Details
3.1.1. Polyol Synthesis
The Pd(II) precursor Ammonium tetrachloropalladate (Formula: (NH4)2PdCl4)
and Pd(IV) precursor Ammonium hexachloropalladate (Formula: (NH4)2PdCl6) were
used in varying molar ratios as shown in Table 1. An excess of PVP (m.w. 40,000) at a
Page 39
26
molar ratio of 40:1 relative to the moles of Pd metal was added to the Pd precursors, and
then everything was dissolved in 10 mL of ethylene glycol. The solution was heated to
220°C under argon atmosphere and held at temperature for 20 minutes, as shown in
Figure 6.
Table 1: Molar Ratios and Calculated mg Amounts of Pd(II) and Pd(IV) Precursors
Molar ratio of
Pd(IV)
Pd(IV) precursor
(mg)
Molar ratio of Pd(II) Pd(II) precursor
(mg)
0% 0 100% 14.2
20% 3.6 80% 11.4
40% 7.1 60% 8.5
60% 10.7 40% 5.7
80% 14.2 20% 2.9
100% 17.8 0% 0
The solution, initially a light yellow-orange color, turns black or dark brown,
indicating that reduction of the precursors has taken place and a suspension of metallic Pd
nanoparticles has formed. At the end of 20 minutes, the solution is allowed to slowly cool
in the oil bath.
The particles are then precipitated with an excess (80 mL) of acetone. The
supernatant is then removed, and the particles are resuspended in ethanol and washed
three times, alternating hexane and ethanol to remove excess PVP. After washing, the
particles are resuspended in 20 mL of ethanol.
3.1.2. Silica Support
The polyol synthesis described in Section 3.1.1 makes a batch of approximately
25.5 mg of nanoparticles, assuming all of the Pd contained in the precursors is present in
the synthesized particles. Thus, 10 mL of the 20 mL ethanol suspension was combined
Page 40
27
with powdered silica support (~200 m2/g) and sonicated at room temperature for 60
minutes to produce a supported catalyst with a metal loading of 2% by weight.
Figure 6: Schematic representation of the one-pot polyol synthesis method for fabricating
monometallic Pd nanoparticles of controlled sizes. Adapted with permission from
reference [107]. Copyright 2012 American Chemical Society.
The resulting slurry was centrifuged at 6500 RPM for 15 minutes, and the
supernatant discarded. The resulting gel was dried and crushed into a fine powder for use
in temperature programmed techniques.
3.2. Characterisation Techniques
Physical characterization of nanoparticles was done using XAS, TEM, and XRD.
XAS was performed at DuPont-Northwestern-Dow (DND) Collaborative Access Team
(CAT) beamline 5-BM-D (BM = bending magnet, http://www.dnd.aps.anl.gov/) at the
Advanced Photon Source, Argonne National Laboratory using the procedures, including
the Athena software package[108, 109], as described in Appendix 1. TEM and XRD were
Page 41
28
performed on unsupported particles whereas XAS was conducted on the silica-supported
particles. TEM samples were prepared by depositing a drop of nanoparticles suspended in
ethanol on a carbon formvar grid (200 mesh, Electron Microscopy Sciences, PA), and
measurements were performed on an FEI Morgagni 268D using an acceleration voltage
of 60 kV. A Philips X’pert Pro materials research diffractometer was used to analyze the
crystal structure of the synthesized Pd nanoparticles. Samples were prepared for XRD by
drying the ethanol-suspended nanoparticles on a clean glass slide.
The catalytic properties and surface characteristics of the nanoparticles were
ascertained using TPR, TPO, and TPSR. TPR was used to determine the amount of
surface oxide formed on the nanoparticles during synthesis, based on the amount of
hydrogen that is converted to water. TPO was used for two purposes: to calculate the
amount of amorphous carbon accumulating on the nanoparticle surface during
temperature programmed reaction studies on the dry reforming and decomposition of
methanol, respectively, and to gain a preliminary understanding of potential size effects
based on the temperature at which the PVP functionalized on the nanoparticle surface is
combusted. TPSR was utilized to determine the catalytic properties, such as TOF, of the
fabricated nanoparticles for methanol dry reforming.
The catalytic decomposition and dry reforming of methanol were done with a
bench scale fixed bed quartz U-tube flow reactor placed in a Thermolyne tube furnace
controlled by a type-K thermocouple. Calibrated mass flow controllers manufactured by
Alicat Scientific were used to control the reactor inlet stream composition. Prior to
catalytic testing, a pretreatment step was performed, during which the catalysts were
exposed to a flow of 5 SCCM of oxygen and 45 SCCM of helium during a temperature
Page 42
29
ramp from room temperature to 350 °C with a ramp rate of 10 °C/min and a 1 h hold.
This step was done to remove excess capping agent and make contact between the inlet
stream and the catalyst’s active sites possible.
The total volumetric flowrate of the inlet stream was held constant at 76 SCCM
for experiments run with and without carbon dioxide, respectively. In the absence of
carbon dioxide, the inlet stream was comprised of 3.8 SCCM of methanol and 72.2
SCCM of helium. When carbon dioxide was introduced, the respective flowrates of the
inlet stream components were 3.8 SCCM of methanol, 3.8 SCCM of carbon dioxide, and
68.4 SCCM of helium. In both sets of experiments, the inlet stream was introduced to the
reactor at atmospheric pressure, and the composition of the effluent stream was analyzed
in real time using a mass spectrometer (MKS Cirrus) with an electron multiplier detector.
The reactions were studied using a temperature program increasing from room
temperature to 350 °C at a ramp rate of 10 °C/min and incorporating a 2 h hold at 350 °C.
The TOFs were determined for each size of nanoparticles by quantifying the conversion
of methanol (from the m/z = 31) obtained under differential conditions, attained by
adjusting the mass of catalyst used to limit the steady-state conversion to 15% or less.
These results were then normalized per surface atom, using the dispersion calculated
from the measured nanoparticle size, in order to correct for the surface-to-bulk ratio of
the atoms contained in the nanoparticles.
Two different types of post-reaction experiments were performed. In the first
type, the catalyst was cooled under helium, then the reaction step was repeated under the
same experimental conditions. In the second, the catalyst was cooled under helium, then
TPO was performed to measure carbon dioxide generation due to the combustion of coke
Page 43
30
deposits. TPO experiments, performed using the same apparatus as described above in
the reaction studies, used a flow of 5 SCCM of oxygen and 45 SCCM of helium. A
temperature program from room temperature to 500 °C with a ramp rate of 10 °C/min
and a 1 h hold at 500 °C was used, and the carbon dioxide signal (m/z = 44) was used to
calculate the grams of coke deposited per gram catalyst.
3.3. Results and Discussion
XRD spectra were taken for all six ratios of precursor used in particle synthesis to
verify that the particles formed are metallic. The results are plotted in Figure . The
notation used gives the percent of the total precursor amount that is Pd(IV), with the
balance being comprised of Pd(II) precursor. The peaks present are characteristic of
metallic palladium, with no oxide peaks appearing, showing good agreement with JCPDS
entry 46-1043. The peak positions for all samples, at (40.1°, 46.6°, 68.0°, and 82.0° 2θ)
correspond to an FCC lattice with unit cell length 3.89 Å. Some peak broadening is
observed, indicating that the nanoparticles synthesized are small. Typical TEM images of
the six samples are shown alongside the plotted XRD spectra. Qualitatively, it is clear
that the nanoparticle size increases with increasing Pd(IV):Pd(II) ratio. A statistical
analysis confirms this observed trend. Pd nanoparticle sizes calculated from XRD data
using the Scherrer equation (shown below) for each precursor ratio are plotted in Figure
8, with the corresponding average diameter calculated from TEM images.
Eq. 3
The Scherrer equation terms include the shape factor, K, x-ray wavelength, ,
full-width half maximum, , and the Bragg angle in radians, . Very good agreement was
Page 44
31
found between the calculated Scherrer diameter and the measured TEM diameter, with
the Scherrer diameter values lying within one standard deviation of the measured values.
As was expected, the standard deviation rose with increasing nanoparticle diameter,
however, it remained below 35% of the mean measured diameter for all samples,
indicating that the distribution of sizes remained narrow throughout the range
synthesized.
The measured particle diameters in TEM and the calculated Scherrer diameters
show the expected trend towards larger particles with increasing Pd(IV) content. It is
worth noting that the Scherrer equation calculates the average crystallite size; given a
polycrystalline material, this would yield the average grain size. In the case of single
crystalline and isotropic materials, such as nanoparticle catalysts, the Scherrer equation
Figure 7: XRD spectra of Pd nanoparticles synthesized through the one-pot polyol
synthesis. Precursor ratios of (A) 0%, (B) 20%, (C) 40%, (D) 60%, (E) 80%, and (F)
100% Pd(IV) are shown along with corresponding TEM images taken at 60kV and a
magnification of 180kx. Scale bars represent 200nm.
Page 45
32
Figure 8: Average diameter measured in TEM and calculated Scherrer diameter of
synthesized Pd nanoparticles. Reprinted with permission from reference [107]. Copyright
2012 American Chemical Society.
calculates the average particle size, assuming a spherical nanoparticle. It is evident from
images taken with TEM that the assumption of a spherical particle does not hold for all
samples, as shown in the images in Figure 7. As the observed particle size increases, so
too does the proportion of polyhedral particles relative to the number of spherical ones.
Further, the calculations of the nanoparticle diameters using the Scherrer equation
incorporate some error in the form of contributions to the XRD signal from agglomerated
nanoparticles, whereas measurements taken from the TEM images do not, as any groups
of agglomerated particles were not measured. As a result, the measured and calculated
values do not exactly correspond.
After immobilization of the Pd nanoparticles on silica, XAS and catalytic
characterization were done. In XAS results, both the XANES and the EXAFS regions
Page 46
33
were shown to be characteristic of the metallic zero-valence state of the Pd. This
indicates that the valence state of the nanoparticles was maintained, regardless of size.
The lower intensity of the peak at 24365 eV relative to the first EXAFS region peak at
24390 eV, as shown in Figure 9, is indicative of a metallic nanoparticle, rather than a
metal oxide. The presence of a metal oxide is observed in XAS as an increase in the
relative intensity of the XANES region features relative to the EXAFS region intensity.
This occurs as a result of the increase in oxidation state of the metal atoms due to the
increased proximity of bonding atoms to said metal atom. This, in turn, results in an
increase in the likelihood of multiscattering events[110]. Additionally, the observed
Figure 9: XANES region as a function of percentage of Pd particle size. Spectra are offset
for clarity. Reprinted with permission from reference [107]. Copyright 2012 American
Chemical Society.
Page 47
34
resonance in the EXAFS region matches closely with that of the metallic Pd foil used as a
reference.
Investigations of the catalytic properties of the synthesized catalysts using
temperature programmed techniques of reduction (TPR), oxidation (TPO), and reaction
(TPRS) were done on similarly prepared silica-supported samples. TPR results, not
shown here, show that there was no appreciable amount of surface oxide on the particles,
an observation supported by the absence of PdO peaks in the XRD spectra presented in
Figure 7 Figure and the XAS results. The nanoparticles fabricated did not have a
significant surface oxide layer, as there was no decrease in the amount of H2 seen by the
detector. TPO pretreatments done on each sample prior to running TPRS revealed that the
amount of PVP present in each sample prior to reaction was approximately equal, based
on the integrated areas of the CO2 peaks observed, as would be expected given that the
catalyst loading was held constant. The calculated values are given in Table 2.
In the catalytic studies performed, the methanol decomposition and dry reforming
reactions (Eq. 4a and 4b, respectively) were run. Temperature programmed reaction tests
run on the methanol dry reforming (MDR) reaction (Eq. 2b) over the supported Pd
nanoparticles yields a trend in which the turnover frequency per Pd surface atom
increases roughly linearly with the nanoparticle size, within the range studied, as shown
in Figure 10 (inset).
→ Eq. 4a
→ Eq. 4b
It is interesting to note that once the reaction reaches steady state, the relationship
between particle size and hydrogen production is linear and the amount of hydrogen
Page 48
35
produced decreases with increasing particle size. Further, the only observed products
were carbon monoxide (m/z = 28) and hydrogen (m/z = 2). No conversion of methanol
was observed when using silica (with no Pd nanoparticles) as a catalyst under the same
conditions.
For comparison, the same study was done using the largest and smallest particles
in the methanol decomposition reaction. The peak and steady state TOF calculated
remained comparable to those for MDR, indicating that the additional CO2 flowed during
Figure 10: Hydrogen production during methanol dry reforming as a function of reaction
temperature, and (inset) peak methanol conversion TOF versus particle size calculated in
terms of mol sec-1 atom-1. Blue circles represent the peak TOF during the methanol dry
reforming (MDR) reaction, orange diamonds represent the steady state MDR TOF.
Similarly, green triangles and red squares represent the methanol decomposition peak and
steady state TOFs, respectively.
Page 49
36
the MDR studies did not greatly influence the reaction rate. As shown in Figure 11, the
production of CO2 does not follow the same trends as the hydrogen and carbon monoxide
traces. The peak in the H2 production corresponds to the peak reaction rate. At steady
state, however, the amount of H2 produced by a given sample correlates with the particle
size, with the smallest particles generating the most gas.
Figure 11: TPRS results for the methanol decomposition reaction run on the smallest (0%
Pd(IV)) Pd catalysts.
A plot of the product and reactant traces for methanol decomposition on the
smallest Pd nanoparticles is shown in Figure 11. Other samples tested showed a similar
profile. Based on the results, the expected increase in conversion with temperature is
observed. However, additional information can be gleaned. As the production of CO
begins, a small peak in the CO2 produced appears, along with a corresponding decrease in
Page 50
37
the CO. However, as the reaction rate increases, the production of CO continues to
increase, the production of CO2 returns to its baseline value, indicating that the observed
reaction is no longer occurring. This is indicative of a reaction occurring that converts
CO to CO2. As no new species were observed in the mass spectrometry data, it was
concluded that a CO-disproportionation reaction was taking place, causing carbon to
deposit on the surface of the Pd catalyst. Further, the amount of H2 and CO produced
increased with particle size, unlike in the case of MDR which showed the opposite trend.
The presence of the reverse water-gas shift reaction can be seen in the slight increase in
the water trace. These three pieces of information yield the reaction network presented in
Figure 12.
Figure 12: Reaction network as determined through TPRS studies. The methanol
decomposition reaction is shown in green, the CO-disproportionation reaction in blue,
and the reverse water-gas shift reaction in red. Common elements are in black.
Page 51
38
The post-reaction TPO results show that the coking rate as a function of the Pd
nanoparticle size goes through a maximum, as illustrated in Table 2. The amount of
coking is directly proportional to the integrated area of the TPO carbon dioxide trace. As
particle size increases, the selectivity to coking decreases, plateauing above a threshold
size. This decrease follows from the decrease in the dispersion and the number of active
sites. The reaction rate and methanol conversion follow opposite trends, increasing with
size until a plateau is reached at a particle diameter of approximately 12nm.
Table 2: Change in Coking Rate with Particle Size
Sample Average
Diameter
(nm)
Coking Rate
(micromol C/g cat/sec)
Surface Carbon
pre-reaction
(g/g-cat/hr)
Surface Carbon
post-reaction
(g/g-cat/hr)
0% Pd(IV) 4.29 17.70 0.18 0.70
20% Pd(IV) 5.60 17.86 0.22 0.91
40% Pd(IV) 6.26 20.14 0.17 1.05
60% Pd(IV) 11.41 24.42 0.19 0.87
80% Pd(IV) 9.89 21.13 0.28 0.77
100% Pd(IV) 16.27 16.29 0.18 0.76
3.4. Conclusions
Pd nanoparticles of well-defined sizes were successfully fabricated using the one-
pot polyol synthesis method with varying molar ratios of Pd(II) to Pd(IV) precursor and
characterized with XRD, and TEM. The fabricated particles were then supported on silica
and their catalytic properties were investigated using temperature programmed reaction
techniques.
The size of the Pd nanoparticles was determined kinetically, as the two precursors
used reduce at different rates in solution. As a result, the number of nucleation sites could
be controlled, yielding nanoparticles of well-defined size. Based on the La Mer model, as
Page 52
39
discussed in section 1.2.1, the different rates of reduction of the respective precursors
resulted in a change in the concentration profile with time that caused a longer period of
supersaturation, and thus more nucleation sites, with higher molar ratio of Pd(II)
precursor.
XRD results confirmed the presence of metallic nanoparticles, with no formation
of oxide or hydride phases. The particle size was calculated using the Scherrer equation,
and found to be the same as the size measured in TEM to within one standard deviation.
Further, the size of the nanoparticles fabricated was found through TEM imaging to
correspond to the molar ratio of the precursors used, with a higher percentage of Pd(IV)
precursor yielding larger particles. TPR and TPO runs confirmed the formation of little to
no surface oxide or hydride phases during synthesis. Temperature programmed reaction
results showed that the steady state generation of hydrogen increased with increasing
surface area. This indicates that the methanol decomposition reaction is structure
sensitive on Pd catalyst. The observed TOF both at peak and steady state increases
roughly linearly with nanoparticle size. In contrast, the selectivity to coking decreases
with size.
Page 53
40
Chapter 4: Synthesis and Characterization of Shape-Controlled Ni-Pd
Nanoparticles
4.1. Experimental Details
Similar to the polyol synthesis described in section 3.1.1 for the monometallic Pd
particles, this synthesis uses the Ni(II) precursor nickel acetylacetonate (Formula:
C10H14NiO4), and Pd(IV) precursor ammonium hexachloropalladate (Formula:
(NH4)2PdCl6), and trimethyl(tetradecyl)-ammonium bromide (TTAB, Formula:
C17H38N.Br).
An excess of PVP (m.w. 40,000) was added to the Pd precursors, and then
everything was dissolved in 10 mL of pentanediol. The solution was heated under argon
atmosphere to 220°C and held at temperature for 20 minutes, as shown in Figure 6. In a
typical synthesis, the synthesis vessel was pre-washed using an aqua regia solution, then
rinsed with DI water and dried. One part Ni(acac)2 (0.0125 mmol) and three parts
(NH4)2PdCl6 (0.0375 mmol) with respect to the molar mass of metal, an excess of PVP
(2.0 mmol), and a predetermined ratio of TTAB to metal precursors (15:1 (0.75 mmol),
30:1 (1.5 mmol), 50:1 (2.5 mmol)) were dissolved in 10 mL of 1,5-pentanediol.
The particles are then precipitated with an excess (80 mL) of acetone. The
supernatant is then removed, and the particles are resuspended in ethanol and washed
three times, alternating hexane and ethanol to remove excess PVP. After washing, the
particles are resuspended in 20 mL of ethanol.
Page 54
41
In order to determine the best synthesis conditions for the formation of particles
that would enable the testing of the influence of particle shape on the catalytic activity,
the synthesis was run at three different temperatures: 140ºC, 160ºC, and 180ºC. This was
repeated using three different molar ratios (15:1, 30:1, and 50:1) of TTAB, relative to the
molar amount of precursors used.
4.2. Characterisation Techniques
XRD and TEM analysis was performed after each synthesis batch was made in
order to determine the crystal structure, nanoparticle sizes, and shape distributions under
each set of conditions. Low and high resolution TEM images were taken on an FEI
Morgagni 268D at 60 kV and 180 kx and an FEI G2
at 200 kV at 1.05 Mx, respectively.
XRD was run on a Philips PAN’alytical diffractometer with a Cu Kα x-ray source
(having a wavelength of 1.5418 Å) using scan settings of 45 kV, 40 mA, and a scan speed
of 0.01 °/sec. STEM-EDX was performed on the FEI G2 TEM in STEM mode at an
accelerating voltage of 200 kV and a beam diameter of 2-3 nm. Both Ni and Pd were
tracked during line scans.
The particles synthesized were subsequently supported on silica at 2 %wt. TPRS
was run on two batches of the synthesized nanoparticles to demonstrate the effect of
synthesis conditions on catalytic activity. The nanoparticles synthesized are active in
methanol decomposition and ethylene hydrogenation.
Page 55
42
4.3. Results and Discussion
TEM imaging (FEI Morgagni 268D; Figure 14 and Figure 15) reveals that the
cubic nanoparticles synthesized have an average edge length of between 9 - 11 nm, as
determined by measuring 100 nanoparticles and averaging the measured side lengths.
These values are denoted in Table 3.
Table 3: Bimetallic NiPd Nanocube Synthesis Characteristics
Reduction Temperature (°C) TTAB:precursor
(mol:mol) Average cube side length (nm)
140 30:1 9.7 ± 1.4
160 30:1 10.7 ± 1.2
180 30:1 10.7 ± 1.1
160 15:1 9.7 ± 1.3
160 30:1 10.7 ± 1.2
160 50:1 9.9 ± 0.9
The nanocube side length does not change by more than one standard deviation as
the reduction temperature is changed, or the concentration of bromide ions is increased.
This result suggests that the size of the nanocubes formed is a function of the amount of
precursor used in the synthesis, rather than the synthesis conditions. The selectivity to
nanocubes and nanorods is a strong function of these parameters, however, as shown in
Figure and Figure . The portion of the sample comprised of nanocubes and nanorods is
greater than 85% when a reduction temperature of 160°C and a TTAB-to-metal precursor
ratio of 30:1 are used. Other combinations of synthesis conditions result in a lower
selectivity. High resolution TEM imaging was done of a cube and a rod from this
synthesis, as shown in Figure 13. Measurement of the interplanar distances based on
these images was done by taking the average spacing over ten atomic planes.
Page 56
43
Analysis of the synthesized nanoparticles using STEM-EDX (run on an FEI G2
TEM, in STEM mode) demonstrates that the metal atoms are homogeneously distributed
throughout the bulk of the nanoparticle. A line scan was run across both a cube and a pair
of rods, as shown in Figure 16 and Figure 17, respectively.
Similar concentration profiles were observed for both metals, indicating that there
was no segregation of Ni and Pd atoms into separate phases within the nanoparticles and
confirming that the synthesis method used resulted in the production of Pd-rich
nanoparticles, as would be expected. Based on the relative peak intensities observed in
the Pd and Ni concentrations, a nanoparticle composition of approximately 28% Ni / 72%
Pd is predicted, in good agreement with the precursor ratios used during synthesis.
XRD was run to determine the effect of shape control on the crystal structure of
the synthesized nanoparticles, as well as to investigate the phase purity of the
nanoparticle populations present in the samples synthesized. All synthesized samples
were found to have the expected FCC crystal structure, regardless of reduction
Figure 13: (left) HRTEM of a nanocube synthesized at a reduction temperature of 160°C,
with a TTAB molar ratio of 30:1. (right) HRTEM of a nanorods synthesized under the
same reaction conditions. Scale bars represent 2 nm, magnification used is 1.05 Mx, and
the acceleration voltage used was 200kV.
Page 57
44
Figure 14: Influence of molar ratio of bromide ion to metal atom on shape distribution in
NiPd alloy nanoparticles (A: 15:1, B: 30:1, and C: 50:1) at a reduction temperature of
160°C. Scale bars represent 200 nm.
Figure 15: Influence of reduction temperature on shape distribution in NiPd alloy
nanoparticles (A: 140°C, B: 160°C, and C: 180°C) with a TTAB:precursor molar ratio of
30:1. Scale bars represent 200 nm.
Page 58
45
temperature or bromide ion concentration. If Vegard’s rule is assumed to be valid, an
alloy composed of 25% Ni / 75% Pd should have a diffraction line at approximately 41.1
degrees 2θ, when using a Cu Kα X-ray source. This diffraction line is not observed in the
synthesized samples, however, appearing at 40.7° 2θ instead. This shift in the position of
the diffraction line is indicative of either lattice strain within the nanoparticles as a result
of the differences in atomic radius of the two component metals, or a shift in composition
relative to the proportions of the metal precursors used in the synthesis.
If it is assumed that the crystal lattice of the synthesized nanoparticles is not under
strain, the composition as calculated using Vegard’s rule ranges from 13-17% Ni for the
Figure 16: (left) The bright field STEM image of particles in the sample with the most
cubes. The line scan was run along the red line. (top right) EDX line scan of the
concentration of Ni at different points along the line scan. (bottom right) EDX line scan
of the concentration of Pd at different points in the nanocube.
Page 59
46
synthesized samples. The discrepancy between this value and the results obtained through
STEM-EDX indicates that the no-strain assumption is not valid. Conversely, assuming
that the composition of the nanoparticles is 25% Ni / 75% Pd, the calculated lattice strain
for the samples ranges from 1-2%. The symmetry of the diffraction peaks was unaffected,
signifying that the nanoparticles formed do not contain a high number of lattice defects,
and that the crystal lattice is primarily undergoing uniform strain.
A second FCC phase is observed in all samples synthesized at a temperature of
more than 140°C. This phase is present as a result of the formation of Pd-rich
nanoparticles, as indicated by the close match with the reference Pd (111) diffraction line
at 40.1° 2θ (JCPDS 46-1043). Assuming that the Pd-rich nanoparticles are not under
strain, the calculated composition, using Vegard’s rule is >98% Pd, suggesting that, once
Figure 17: (left) The bright field STEM image of particles in the sample with the most
cubes and rods. The line scan was run along the red line. (top right) EDX line scan of the
Ni concentration. (bottom right) EDX line scan of the Pd concentration.
Page 60
47
lattice strain is accounted for, the Ni content of this phase is likely less than 1%. The
presence of a Pd-rich population of nanoparticles indicates that the bimetallic
nanoparticles are likely formed early in the synthesis, and that, as the Ni atoms in
solution are depleted, nanoparticles primarily composed of Pd atoms begin forming.
The possible formation of NiO is suggested by the remaining diffraction line observed at
circa 36.6° 2θ. However, in the TEM images presented, the presence of an oxide surface
layer would be difficult to distinguish as a result of the amorphous layer of capping
polymer coating present in all samples. Further, the diffraction line observed near 36.6°
2θ does not match up with the literature value of 37.3° 2θ for the NiO (111) plane
(JCPDS 4-835). Based on the observed peak position, a strain of 1.5-2% would be
expected for any pure NiO formed. However, this does not address the reason for the
expansion of the NiO lattice. Assuming that no strain is observed, this diffraction line
would be attributed to a complex oxide composed of NiO where approximately 6% of Ni
lattice sites are occupied by a Pd atom. Given that the no-strain assumption is likely not
applicable to this peak, the composition is known to be less than the calculated 6%. The
precise composition is difficult to determine, however. Therefore, though the exact
composition is not known, the diffraction line at 36.6° 2θ is assigned to the (111) plane of
the formed complex oxide. In some samples, a low intensity peak is seen at
approximately 42.6° 2θ, which correlates to the (200) plane of the observed complex
oxide phase. No higher index planes of the complex oxide are observed, indicating that
the complex oxide is forming either as a population of nanoparticles with very small
diameter, or as a thin surface layer on the bimetallic nanoparticles synthesized. The
Page 61
48
Figure 18: XRD profiles of all NiPd nanoparticle samples. Scans were done at ambient
conditions using a Cu Kα x-ray source at 45 kV and 40 mA, with a scan speed of 0.01
°/sec. Low index peaks of reference materials are shown for comparison.
formation of a population of very small nanoparticles -- with a diameter of about 2-3 nm -
- a significant amount of peak broadening would be expected in the recorded
diffractograms. This is not the case, though, indicating that the diffraction lines detected
are most likely due to oxidation of the nanoparticles’ surface.
HRTEM images of the sample having the highest selectivity toward the formation
of nanocubes and nanorods -- synthesized using a reduction temperature of 160°C and a
TTAB-to-metal precursor molar ratio of 30:1 -- the interplanar distances of the (111) and
(110) planes was measured by averaging the interplanar distance over 10 atomic planes.
Page 62
49
This yielded interplanar distances of 2.4 and 2.5 Å for the (111) and (110) interplanar
spacings, respectively. These interplanar distances correspond to unit cell side lengths of
0.42 and 0.43 nm, respectively. Unit cells of this size would generate diffraction lines at
~36 and 37° for the x-ray source used in these experiments (Cu Kα). These values closely
agree with the diffraction line observed at 36.6° 2θ, demonstrating that the observed
oxide phase is a thin surface layer, rather than a separate population of small
nanoparticles.
4.4. Conclusions
A modified polyol synthesis with shape control has been demonstrated for
bimetallic Pd-based alloy nanoparticle catalyst. The cube and rod shaped nanoparticles
were found to comprise >85% of the synthesized nanoparticles. Further, the synthesized
nanoparticles show bimetallic character, and homogeneous composition over the volume
of a nanoparticle.
Based on the results of x-ray diffractograms collected, the concentration of
bromide ions used to stabilize the (100) and (110) facets of the synthesized nanoparticles
also affects the relative populations of bimetallic and Pd-rich nanoparticles that are
formed. A higher concentration of bromide ions results in a larger population of Pd-rich
nanoparticles, based on the relative intensities of the Pd and bimetallic peaks observed in
XRD. The formation of a thin surface oxide layer was also observed. Control of the
reduction temperature was also shown to have an effect on the shape distribution of the
synthesized nanoparticles, though not to the same degree as the bromide ion
concentration.
Page 63
50
Based on analysis of the shape distributions observed through TEM imaging, it
was concluded that the best synthesis conditions to use to achieve a high selectivity to
nanocube and nanorods formation is a reduction temperature of 160°C and a bromide-to-
precursor molar ratio of 30:1. Conversely, XRD indicates that to avoid the formation of
Pd-rich nanoparticles, a reduction temperature of 140°C is better, as no Pd-rich phase is
observed. This suggests that the relative difference in the reduction rates of the two
precursors used is small enough at the lower temperature to allow for the formation of
primarily bimetallic nanoparticles.
Page 64
51
Chapter 5: Effect of Shape and Composition on SPR in Ag and Pd Nanoparticles
The metal enhanced luminescence properties of silver have been extensively
studied[33, 111-116] as a result of its narrow and intense SPR peaks. Further, gold has
been shown to have size-dependent properties[117-119], while copper has been shown to
enhance luminescence[120]. Both luminescence enhancement and quenching have been
successfully used for a variety of applications, including enhanced wavelength-
ratiometric sensing[23], amplified assay detection[24, 25], optical detection of DNA
hybridization[25, 26], and high throughput immunoassays[27], among others.
Similarly, because bimetallic nanoparticles have excellent optical, electronic, and
catalytic properties relative to their bulk counterparts and have wide ranging applications
in such areas as catalysis, sensing, and SERS, they have been the focus of much attention
in the areas of novel synthetic methods development and nanoscale characterization[2, 6,
19, 29, 42, 56, 58, 69, 74-76, 80, 81, 84, 87, 90, 102, 103, 121-141]. Ag@Pd core-shell
nanoparticles, where the notation describes a core@shell configuration, have been
synthesized with high yield using ultra high vacuum techniques[121], as well as lower-
cost methods such as microwave-assisted reduction[122] or a polyol synthesis[123].
It has been shown in the literature that Au can be used in the design and
implementation of oligonucleotide sensors based on the quenching effect that occurs
when a fluorophore is in close proximity to a gold nanoparticle[142, 143]. The principle
of this sensor is that the donor fluorescence is quenched so long as a loop-like single-
Page 65
52
stranded DNA (ssDNA), remains in its closed position. In this type of sensor, known as a
molecular beacon type sensor, the fluorophore is bound to a strand of ssDNA which is
functionalized to the surface of a noble metal nanoparticle with a thiol group. In the
closed position, the ssDNA loop brings the fluorophore close to the surface of the
nanoparticle, resulting in quenching of the fluorescence. The loop of ssDNA used is
complementary to an ssDNA target that the sensor is meant to detect. When the
complementary ssDNA strand comes into proximity to the sensor, the loop of ssDNA
shifts into its open position, and the quenching effect is lessened.
The aim of this study is to investigate the potential applications of physical
mixtures of Ag and Pd nanoparticles in a similar type of sensing application. The effects
of physical mixtures of differing combinations of the coinage metals have not been
investigated in detail in the literature. In this work, we address the effect of shape control
on the optical response of physical mixtures of Ag and Pd nanoparticles with well-
defined shape and size.
5.1. Experimental Details
In this study, Ag nanocubes and Pd nanoboxes with a range of shell thicknesses
were synthesized using a polyol process. The Ag nanocubes were synthesized as
described by Tao et al[6]. The Pd nanoboxes were subsequently synthesized using a seed
mediated polyol synthesis in which the Ag nanocubes acted as a sacrificial template for
the Pd nanoboxes. Silver nitrate (>99%), and copper(II) chloride dihydrate (>99.999%),
were obtained from Sigma-Aldrich Co., MO, and used as received. Polyvinylpyrrolidone
Page 66
53
(PVP, 58 000 molecular weight) was purchased from Alfa Aesar. All solvents used were
analytical grade and used without further purification.
In a typical Ag nanocube synthesis, the synthesis vessel was pre-washed using an
aqua regia solution, then rinsed with DI water and dried. 500 mg and 86 μg of copper
chloride and silver nitrate were dissolved together in 12.5 mL 1,5-pentanediol. 250 mg of
PVP were separately dissolved in an additional 12.5 mL 1,5-pentanediol. Subsequently,
20 mL of 1,5-pentanediol were heated to a temperature of 180°C in a three necked flask
under Argon atmosphere and stirring. After 10 minutes, the two precursor solutions were
injected into the hot reaction flask at different rates. Every 1 minute, 0.5 mL of AgNO3
solution was injected, and every 0.5 min, 0.25 mL of PVP solution was injected. This was
continued until the solution became opaque (after approximately 6 minutes), indicating
the formation of nanocubes.
The Pd nanoboxes were synthesized by means of an adapted seed mediated polyol
synthesis. Nanoboxes of three different wall thicknesses (5, 8, and 10 nm) were
synthesized for characterization. First, 1 mmol PVP (based on the monomer unit) and the
appropriate amount of Pd precursor (0.005, 0.1125, and 0.025 mmol, respectively) were
added to a three-necked flask pre-cleaned as described above. The PVP and Pd precursor
were dissolved in 9 mL 1,5-pentanediol and bubbled with argon for 10 minutes. 1 mL of
as-synthesized Ag nanocubes were added to the three-necked flask, and allowed to mix
evenly under stirring. The suspension was then heated to 160°C in a pre-heated oil bath
and held at temperature for 20 minutes, maintaining the Ar atmosphere. The nanoparticle
suspension was allowed to cool in the oil bath, then precipitated with acetone.
Page 67
54
Precipitated samples were then washed three times in ethanol and hexanes prior to
characterization. After completion of the synthesis, the precipitated suspension obtained
was centrifuged for 5 minutes at 6500 RPM, and the supernatant acetone was discarded.
The precipitate was resuspended in 1 mL of ethanol. After mixing was ensured through
sonication, 14 mL of hexanes were added to the flask and the resulting suspension was
centrifuged again. This process was repeated two more times. The resulting precipitate
was resuspended in 10mL ethanol for characterization.
An Ag sample without shape control was synthesized as well, for comparison.
The sample was prepared using the same procedure as detailed for the Ag nanocubes,
with the only change being the number of injections of Ag precursor solution and
solvated PVP. Instead of stopping after 6 minutes, the process was continued until the 9
minute mark.
5.2. Characterisation Techniques
TEM images were taken on an FEI Morgagni 268D. Images were taken at 60 kV
and 71 kx. TEM samples were prepared by dispersing a drop of nanoparticle solution
(diluted in ethanol by a factor of 10) on a carbon formvar film supported by 200 mesh
copper grids. XRD was performed using a Philips PAN’alytical diffractometer with
settings of 45 kV, 40 mA, and a scan speed of 0.01 °/sec after the nanoparticle suspension
had been deposited on a cleaned glass slide. A Cu Kα x-ray source with a wavelength of
1.5418 Å was used. EDS analysis was done on a Hitachi SU-70 SEM at an acceleration
voltage of 6 kV and a magnification of 300 kx. A UV-vis spectrometer (Perkin Elmer,
Page 68
55
Lambda 35) was used to measure the absorption spectra of the synthesized nanoparticles
in suspension with neat ethanol used as a background.
5.3. Results and Discussion
Based on TEM results, the Ag nanocubes synthesized were found to have a side
length of 57.5 ± 6.5 nm. This was found by counting and measuring 200 nanocubes and
calculating the mean and standard deviation of the measured side lengths.
The sample exhibited primarily cubic morphology, with a small population of
polyhedral and rod-shaped nanoparticles. The sample synthesized under conditions that
favored the formation of polyhedra showed almost no cubes forming, and a slightly
higher population of rod-shaped nanoparticles, as shown in Table 4.
Table 4: Ag Nanoparticle Shape Distributions.
Sample: Cubes (%) Rods (%) Triangles (%) Polyhedra (%)
Ag Nanocubes 79.70 1.16 5.99 13.15
Ag Polyhedra 1.25 6.06 6.37 86.31
After the Pd nanoboxes were synthesized, the side lengths observed increased,
proportional to the wall thickness, as shown in Figure 20D, and the shape distributions
observed in the Ag nanocubes were maintained. The observed change in contrast between
the Pd nanoboxes formed and the Ag cores as observed in TEM imaging indicates that
the cubes are not core-shell particles, as was expected. Normally Ag and Pd would not
show any change in z-contrast in TEM, due to the similarities of their respective atomic
masses, and so we concluded that during the core-shell synthesis the Ag core of the
Page 69
56
Figure 19: TEM images of Ag nanocubes and polyhedra taken at an acceleration voltage
of 60 kV and a magnification of (A,C) 44kx, and (B,D) 180kx.
nanocubes was sacrificed, yielding hollow Pd cubes with small amounts of silver
substituted into the Pd lattice as a result of the Ag atoms diffusing out through the Pd
layer as it formed. This can be observed in the XRD peaks yielded by the hollow Pd
samples synthesized, as shown in Figure 21. In TEM images of the as-synthesized Pd
nanoboxes a large population of small spherical nanoparticles with a diameter of 10-15
nm can be perceived. These represent the re-nucleation of the ionized Ag atoms due to re-
reduction by the polyol solvent as the synthesis vessel cooled. In order to isolate the
effects of the Pd nanoboxes in UV-Vis measurements, 1 mL of each of the three
Page 70
57
Figure 20: TEM images of Pd nanoboxes with (A) 10 nm Pd shell, (B) 6 nm Pd shell, and
(C) 5 nm Pd shell. All images are taken at 60 kV and 71kx. The scale bar represents 500
nm. All insets are taken at 60 kV and 180kx. The scale bar represents 200 nm. (D) Plot of
histogrammed nanocube side lengths.
synthesized Pd nanobox suspensions was centrifuged for 10 minutes at 1000RPM and
room temperature to separate the nanoboxes from the small spherical Ag nanoparticles.
The collected XRD data shown was taken using the as-synthesized samples
before centrifuge separation of the Pd nanoboxes. It was observed that the Ag nanocubes
synthesized remain mostly in their metallic state, with only a small AgO(311) peak
appearing at 65.3° 2θ, as presented in Figure 21. The AgO(111) peak cannot be resolved
except through peak deconvolution, as it overlaps with the Ag(111) peak. Peak
Page 71
58
deconvolution reveals that a small AgO(111) peak is present, while the bulk of the signal
originates from the Ag nanocubes present in the sample, as shown in Figure 22. The
remaining broad low-intensity peak is attributed to the formation of AgCu alloy
nanoparticles during the synthesis procedure, as a result of the CuCl2 used, as will be
discussed further.
Figure 21: X-ray diffractograms of (A)Ag nanocubes, (E)Ag polyhedra, and Pd
nanoboxes with (B)10 nm, (C) 6 nm, and (D) 5 nm wall thicknesses.
The relative peak intensities exhibited by the Ag nanocubes are also different
from those of single crystalline silver. The relative intensities of the (111) and (200)
peaks in Ag are listed as 100% and 42%, respectively, on JCPDS card 4-783. In the
synthesized Ag nanocubes, the observed intensities were 100% and 95%. As the intensity
Page 72
59
of the signal seen in XRD is directly proportional to the number of and size of the planes
present in a sample with a given index, this change is ascribed to the higher proportion of
(100) planes present in the nanocubes, relative to the lower energy prisms bounded by
(111) facets that Ag would form under synthetic conditions not incorporating shape
control.
The nanocubes synthesized also show minimal oxidation of the exposed (100)
surfaces. The observed AgO peaks are of low intensity, indicating the formation of a very
Figure 22: Deconvolution of Ag(111) and AgO(111) XRD peaks observed in Ag
nanocubes.
Page 73
60
thin surface oxide layer on the surface of an Ag nanocube, rather than the formation of a
metal oxide nanoparticle.
As was briefly mentioned above, it can be demonstrated that the presence of the
CuCl2 precursor has a direct impact on the composition of the nanoparticles formed.
While the chloride ions released into solution by the dissociation of the precursor act to
form the Ag nanocubes observed, the Cu ions become reduced by the polyol solvent
alongside the Ag ions, becoming substituted into the Ag lattice as it forms. Because the
Ag ions are present in excess, relative to the Cu, only a small population of the Ag cubes
synthesized contain Cu atoms within their lattices. Thus, the low intensity of the AgCu
alloy peak relative to the Ag peaks is a direct result of the relative molar amounts of
metal present in the polyol solution during the synthesis. Two peaks appear (at 36.5° and
40.6° 2θ, respectively) that can be attributed to the Cu atoms which become substituted
into the Ag lattice. The lower angle peak at 36.5° is attributed to the surface oxide layer
that forms on the AgCu alloy.
The peaks observed between 38.8° and 39.5° 2θ are AgPd alloy peaks which are
likely a result of both the Pd nanoboxes and the small spherical nanoparticles present in
the solution. The shift in the peak position from 39.5° 2θ to 38.8° 2θ occurs as a result of
the relative molar amounts of Ag and Pd used in the core-shell synthesis. The higher the
molar amount of Pd used in the synthesis, the more the peak is shifted in position toward
the peak position of pure Pd (40.115° 2θ). The persistence of the AgCu alloy peaks in the
Pd nanobox samples indicates that the difference in galvanic potential between the Ag
and Cu atoms is enough to cause the AgCu nanocubes to maintain their stability during
the templated synthesis, unlike the pure Ag nanocubes, whose Ag cores are leeched out
Page 74
61
of the nanoboxes and into solution as a result of the electronegativity differences during
the synthesis procedure. The AgCu peak maintains its intensity and shape, indicating that
the size and crystallinity of the AgCu nanocubes are not measurably affected. The
position of the peak is slightly shifted, however, suggesting that during the synthesis of
the Pd nanoboxes some strain is induced in the AgCu alloy particles.
Figure 23: SEM image of Ag nanocubes synthesized.
SEM imaging confirms the presence of Ag cubes, as shown in Figure 23. EDS
line scans were run, but did not yield quantifiable data, due to the algorithms used by the
EDS software. Because the EDS software assumes a bulk sample, infinitely wide and
thick relative to the electron beam excitation volume, the calculated values of the
Page 75
62
respective metals present, as provided by the software are incorrect. Monte Carlo
simulations used to model the excitation volume were done using the freeware program
Casino 3.2 (http://www.gel.usherbrooke.ca/casino/What.html). Based on the results of the
Monte Carlo simulations, as shown in Appendix 2, the acceleration voltage of 6 kV was
chosen. A set of representative results is shown in Figure 24. Because the software
calculates the composition of the sample based on the relative counts, the non-zero
baseline measured for Cu makes this measurement technique unusable. It is likely that the
nonzero baseline is being caused by the use of the Cu formvar grid during analysis being
excited by part of the electron beam. At 6 kV the excitation volume of the electron beam
is not entirely contained within the nanocube.
Figure 24: SEM image of an Ag nanocube and its corresponding EDS line scan. The
image and scan were taken at an accelerating voltage of 6 kV and a magnification of 300
kx.
The changes in crystal structure correspond to the changes in absorbance
observed in UV-Vis spectroscopy. As would be expected, given that the Ag core was
used as a sacrificial template, the intense Ag absorption peak observed at a wavelength of
Page 76
63
Figure 25: UV-Vis spectra of Ag nanocubes, polyhedra, and hollow Pd nanocubes.
Figure 26: UV-Vis spectra of physical mixtures of Ag polyhedra and as-synthesized Pd
nanoboxes. Ratios noted are volume ratios; respective Ag and Pd nanoparticle stock
concentrations are kept the same, on a mL basis.
Page 77
64
450 nm disappears, and is replaced by a low broad absorption throughout the visible
spectrum as is characteristic of Pd[1].
The UV-Vis data presented in Figure 25 indicates that the synthesized Ag
nanocubes absorb light throughout much of the visible portion of the spectrum with peaks
at 450 nm and 350 nm, and is in good agreement with the behavior observed in the
literature[6, 13]. A slight shoulder appearing at about 410 nm is indicative of the presence
of other prisms in the synthesized sample. After the synthesis of the Pd nanoboxes, the
absorbance peak at 450 nm disappears, and is replaced by a broad absorbance throughout
the visible portion of the spectrum. In the case of the Ag polyhedra, a broad doublet peak
appears that spans much of the visible range, rather than a single well-defined absorbance
Figure 27: Variation in UV-Vis peak positions of physical mixtures of Ag polyhedra and
fractionated Pd nanoboxes. Ratios noted are volume ratios; respective Ag and Pd
nanoparticle stock concentrations are the same.
Page 78
65
peak. Further, the changes in absorbance correlate with the shell thickness. The
nanoboxes synthesized with thicker walls absorb more intensely than those with thinner
shells as a result of the higher amount of Pd per mL of suspension, when calculated on a
mass basis. The number of nanoparticles present per mL is kept the same for all Pd
nanobox suspensions.
The Ag polyhedra did not show any significant peak shifting when combined with
the Pd nanoboxes in a physical mixture, as shown in Figure 27. The ratios of the
respective nanoparticle suspensions added to the cuvette are given on a volume basis, as
Figure 28: Variation in UV-Vis peak positions of physical mixtures of Ag cubes and
fractionated 6 nm wall Pd nanoboxes. Respective Ag and Pd nanoparticle stock
concentrations are the same.
Page 79
66
the concentrations of nanoparticles per mL in the respective solutions was kept constant.
Some damping of the observed peaks was seen, for the 5 nm and 6 nm wall Pd
nanoboxes, in addition to the shift in the baseline absorbance.
The physical mixtures of Ag nanocubes and Pd nanoboxes exhibited different
behavior, as demonstrated in Figure 27 and Figure 28. The addition of varying amounts
of the as synthesized Pd nanoboxes to Ag nanocubes in suspension resulted in a shift in
the absorption peak proportional to the amount of Pd nanoboxes added. When repeated
with separated Pd nanoboxes and AgPd spheres respectively, the same experiment did
not show a similarly large shift in the peak position.
5.4. Conclusions
The synthesis of Ag nanocubes of near-uniform size and high shape selectivity
has been demonstrated and subsequently used for the synthesis of Pd nanoboxes. The
nanocubes were shown to behave as sacrificial templates for the formation of the Pd
nanoboxes as a result of the galvanic displacement effect. The use of CuCl2 to provide the
Cl ions used to achieve control of the morphology of the Ag nanoparticles resulted in the
formation of some AgCu alloy nanocubes within the sample, as confirmed by the peaks
appearing in XRD diffractograms of the pure Ag nanoparticles which do not correspond
with the positions of the pure Ag or AgO phases.
The physical mixture of Ag polyhedra and Pd nanoboxes does not show very
much activity in UV-Vis, with observed phenomena consisting primarily of damping of
the Ag peak and shifting of the baseline absorbance due to the presence of the Pd. The
same physical mixtures, with nanocubes substituted for the Ag polyhedra exhibited
Page 80
67
evidence of coupling of the observed SPR bands in the form of a shift in the peak
position proportional to the amount of Pd nanoboxes added to the suspension. This only
occurred with the as-synthesized Pd nanobox suspensions, and not with the fractionated
samples, indicating that the presence of both the AgPd spheres and the Pd nanoboxes are
necessary to provide the correct conditions for the observed peak shifts to occur.
Page 81
68
Chapter 6: Conclusions and Outlook
Morphological control of metal nanoparticles has become a very active area of
research in the fields of nanoscience and nanotechnology as a direct consequence of the
unique properties such materials possess. Strict and highly selective control of the
morphology of nanoparticles is necessary to achieve the synthesis of nanoscale materials
with well-defined properties. It is worth noting that, though the crystallization of a
nanomaterial into a particular structure is usually kinetically driven, the thermodynamic
factors of the system are known to have a large influence on the morphology of the
nanomaterial, as many materials exist in a variety of polymorphs based on the
environment in which they are synthesized[144]. In addition, the size and morphology of
the nanomaterial generated can have profound impacts on its properties, as has been
demonstrated in the fields of catalysis and plasmonics, where the surface facets present
and the number of sharp corners, respectively, directly determine activity.
Based on the work presented in Chapter 3, we conclude that the size of the Pd
nanoparticles synthesized has a direct impact on the rate of conversion of methanol to
synthesis gas, as a result of the change in nanoparticle dispersion with nanoparticle
diameter. The conversion of methanol increased with increasing surface area-to-bulk
ratio, with the trend observed remaining consistent with and without the presence of
carbon dioxide in the inlet stream.
Page 82
69
Work done on NiPd bimetallic alloy nanocubes (Chapter 4) indicated that control
of alloy nanoparticle morphology is possible, and that the nanocubes synthesized are of
homogeneous composition and size. Further, it was demonstrated that for most of the
synthetic conditions tested, two populations of nanoparticles with differing compositions
formed. In short, the synthetic conditions were shown to have a large impact on the
morphologies and compositions of the nanoparticles generated, as would be expected
based on the kinetic and thermodynamic factors characterizing each synthesis, as
described above.
Lastly, in Chapter 5, it was posited that by controlling the shape and composition
of Ag and Pd nanoparticles, the wavelengths of their respective SPR peaks could be
tuned. Pd nanospheres, which have been shown in the literature to exhibit a low broad
absorbance throughout the visible range exhibited the expected absorbance curve in UV-
Vis measurements. Ag nanocubes synthesized also behaved as predicted. The Ag
polyhedra demonstrated a broad doublet peak most likely a result of the superposition of
the peak positions of the populations of nanoparticles present in the suspension. Physical
mixtures of Ag polyhedra and the fractionated Pd nanoboxes and AgPd spheres
synthesized resulted in a baseline shift and damping of the broad absorbance in the
visible range of the spectrum. In contrast, the mixtures of the Ag nanocubes and the
synthesized nanoboxes showed a shift in the peak position proportional to the amount of
Pd nanobox suspension was added to the physical mixture.
Future directions based on the research presented herein include (i) exploration of
scaled up versions of the syntheses described, to make the techniques more commercially
viable, (ii) more in-depth characterization of the catalytic properties of bimetallic NiPd
Page 83
70
nanocubes as compared to bimetallic nanospheres and (iii) investigation of the response
of physical mixtures of Ag nanocubes and Pd nanoboxes when deposited on a substrate
rather than suspended in a solvent, for applications in the design of finely tuned and
sensitive sensors.
Page 84
71
References
1. Kundu, S., K. Wang, S. Lau, and H. Liang, Photochemical synthesis of shape-
selective palladium nanocubes in aqueous solution. Journal of Nanoparticle
Research, 2010: p. 1-13.
2. Ai, F., A. Yao, W. Huang, D. Wang, and X. Zhang, Synthesis of PVP-protected
NiPd nanoalloys by modified polyol process and their magnetic properties.
Physica E, 2010. 42 p. 1281-1286.
3. Hegde, M.S., D. Larcher, L. DuPont, B. Beaudoin, K. Tekaia-Elhsissen, and J.-M.
Tarascon, Synthesis and chemical reactivity of polyol prepared monodisperse
nickel powders. Solid State Ionics, 1997. 93: p. 33-50.
4. Harris, P.J.F., Sulphur-induced faceting of platinum catalyst particles. Nature,
1986. 323(6091): p. 792-794.
5. Tao, A., P. Sinsermsuksakul, and P. Yang, Polyhedral Silver Nanocrystals with
Distinct Scattering Signatures. Angewandte Chemie International Edition, 2006.
45(28): p. 4597-4601.
6. Tao, A.R., S. Habas, and P. Yang, Shape Control of Colloidal Metal
Nanocrystals. Small, 2008. 4(3): p. 310-325.
7. Im, S.H., Y.T. Lee, B. Wiley, and Y. Xia, Large-Scale Synthesis of Silver
Nanocubes: The Role of HCl in Promoting Cube Perfection and Monodispersity.
Angewandte Chemie International Edition, 2005. 44(14): p. 2154-2157.
8. Lee, Y.T., S.H. Im, B. Wiley, and Y. Xia, Quick formation of single-crystal
nanocubes of silver through dual functions of hydrogen gas in polyol synthesis.
Chemical Physics Letters, 2005. 411(4–6): p. 479-483.
9. Lim, B., M. Jiang, J. Tao, P.H.C. Camargo, Y. Zhu, and Y. Xia, Shape-Controlled
Synthesis of Pd Nanocrystals in Aqueous Solutions. Advanced Functional
Materials, 2009. 19(2): p. 189-200.
10. Lu, X., M. Rycenga, S.E. Skrabalak, B. Wiley, and Y. Xia, Chemical Synthesis of
Novel Plasmonic Nanoparticles. Annual Review of Physical Chemistry, 2009.
60(1): p. 167-192.
Page 85
72
11. Rycenga, M., C.M. Cobley, J. Zeng, W. Li, C.H. Moran, Q. Zhang, D. Qin, and
Y. Xia, Controlling the Synthesis and Assembly of Silver Nanostructures for
Plasmonic Applications. Chemical Reviews, 2011. 111(6): p. 3669-3712.
12. Siekkinen, A.R., J.M. McLellan, J. Chen, and Y. Xia, Rapid synthesis of small
silver nanocubes by mediating polyol reduction with a trace amount of sodium
sulfide or sodium hydrosulfide. Chemical Physics Letters, 2006. 432(4–6): p. 491-
496.
13. Wang, Y., Y. Zheng, C.Z. Huang, and Y. Xia, Synthesis of Ag Nanocubes 18–32
nm in Edge Length: The Effects of Polyol on Reduction Kinetics, Size Control,
and Reproducibility. Journal of the American Chemical Society, 2013. 135(5): p.
1941-1951.
14. Wiley, B., Y. Sun, and Y. Xia, Synthesis of Silver Nanostructures with Controlled
Shapes and Properties. Accounts of Chemical Research, 2007. 40(10): p. 1067-
1076.
15. Zeng, J., Y. Zheng, M. Rycenga, J. Tao, Z.-Y. Li, Q. Zhang, Y. Zhu, and Y. Xia,
Controlling the Shapes of Silver Nanocrystals with Different Capping Agents.
Journal of the American Chemical Society, 2010. 132(25): p. 8552-8553.
16. Sau, T.K. and A.L. Rogach, Colloidal Synthesis of Noble Metal Nanoparticles of
Complex Morphologies, in Complex-Shaped Metal Nanoparticles. 2012, Wiley-
VCH Verlag GmbH & Co. KGaA. p. 7-90.
17. Cui, C.-H. and S.-H. Yu, Controlling Morphology in Noble Metal Nanoparticles
via Templating Approach, in Complex-Shaped Metal Nanoparticles. 2012, Wiley-
VCH Verlag GmbH & Co. KGaA. p. 91-116.
18. Sun, Y., B.T. Mayers, and Y. Xia, Template-Engaged Replacement Reaction: A
One-Step Approach to the Large-Scale Synthesis of Metal Nanostructures with
Hollow Interiors. Nano Letters, 2002. 2(5): p. 481-485.
19. Chen, J., B. Wiley, J. McLellan, Y. Xiong, Z.-Y. Li, and Y. Xia, Optical
Properties of Pd−Ag and Pt−Ag Nanoboxes Synthesized via Galvanic
Replacement Reactions. Nano Letters, 2005. 5(10): p. 2058-2062.
20. Skrabalak, S.E., J. Chen, Y. Sun, X. Lu, L. Au, C.M. Cobley, and Y. Xia, Gold
Nanocages: Synthesis, Properties, and Applications. Accounts of Chemical
Research, 2008. 41(12): p. 1587-1595.
Page 86
73
21. Tanaka, K.-i. and A. Sasahara, Reconstructive activation of bimetallic surfaces:
Catalytic reduction of NO with H2 on Pt(100), Pt(110), Rh(100), Rh(110) and
bimetallic single crystal surfaces of Rh/Pt(100), Rh/Pt(110), Pt/Rh(100), and
Pt/Rh(110). Journal of Molecular Catalysis A: Chemical, 2000. 155(1–2): p. 13-
22.
22. Carberry, J.J., Structure sensitivity in heterogeneous catalysis: Activity and
yield/selectivity. Journal of Catalysis, 1988. 114(2): p. 277-283.
23. Miyamoto, A., M. Miura, Y. Murakami, and K. Mori, Structure Sensitivity in
Catalysis of Vanadium Oxide, in Studies in Surface Science and Catalysis, M.
Che and G.C. Bond, Editors. 1985, Elsevier. p. 371-380.
24. Germain, J.E., Structure-Sensitive Catalytic Reactions on Oxide Surfaces, in
Studies in Surface Science and Catalysis, M. Che and G.C. Bond, Editors. 1985,
Elsevier. p. 355-370.
25. Fischer, N., E. van Steen, and M. Claeys, Structure sensitivity of the Fischer–
Tropsch activity and selectivity on alumina supported cobalt catalysts. Journal of
Catalysis, 2013. 299(0): p. 67-80.
26. Bordes, E., Comparative Study of Structure-Sensitive Oxidations of n-Butane and
1-Butene in Maleic Anhydride on Two Kinds of Catalysts, in Studies in Surface
Science and Catalysis, G. Centi and F. Trifiro, Editors. 1990, Elsevier. p. 585-
593.
27. Cui, Y., H. Xu, Q. Ge, Y. Wang, S. Hou, and W. Li, Structure sensitive
dissociation of CH4 on Ni/α-Al2O3: Ni nano-scale particles linearly compensate
the Ea and ln A for the CH4 pulse kinetics. Journal of Molecular Catalysis
A: Chemical, 2006. 249(1–2): p. 53-59.
28. Tanaka, K.-i. and N. Takehiro, Atomic-scale mechanism for the activation of
catalyst surfaces. Journal of Molecular Catalysis A: Chemical, 1999. 141(1–3): p.
39-55.
29. Chowdhury, S., V.R. Bhethanabotla, and R. Sen, Effect of Ag−Cu Alloy
Nanoparticle Composition on Luminescence Enhancement/Quenching. The
Journal of Physical Chemistry C, 2009. 113(30): p. 13016-13022.
30. Brus, L., Noble Metal Nanocrystals: Plasmon Electron Transfer Photochemistry
and Single-Molecule Raman Spectroscopy. Accounts of Chemical Research,
2008. 41(12): p. 1742-1749.
Page 87
74
31. Guerrero-Martínez, A., S. Barbosa, I. Pastoriza-Santos, and L.M. Liz-Marzán,
Nanostars shine bright for you: Colloidal synthesis, properties and applications
of branched metallic nanoparticles. Current Opinion in Colloid & Interface
Science, 2011. 16(2): p. 118-127.
32. Si, G., W. Shi, K. Li, and Z. Ma, Synthesis of PSS-capped triangular silver
nanoplates with tunable SPR. Colloids and Surfaces A: Physicochemical and
Engineering Aspects, 2011. 380(1-3): p. 257-260.
33. Tam, F., G.P. Goodrich, B.R. Johnson, and N.J. Halas, Plasmonic Enhancement
of Molecular Fluorescence. Nano Letters, 2007. 7(2): p. 496-501.
34. Crespo-Quesada, M., J.-M. Andanson, A. Yarulin, B. Lim, Y. Xia, and L. Kiwi-
Minsker, UV–Ozone Cleaning of Supported Poly(vinylpyrrolidone)-Stabilized
Palladium Nanocubes: Effect of Stabilizer Removal on Morphology and Catalytic
Behavior. Langmuir, 2011. 27(12): p. 7909-7916.
35. Crespo-Quesada, M., A. Yarulin, M. Jin, Y. Xia, and L. Kiwi-Minsker, Structure
Sensitivity of Alkynol Hydrogenation on Shape- and Size-Controlled Palladium
Nanocrystals: Which Sites Are Most Active and Selective? Journal of the
American Chemical Society, 2011. 133(32): p. 12787-12794.
36. Teranishi, T. and M. Miyake, Size Control of Palladium Nanoparticles and Their
Crystal Structures. Chemistry of Materials, 1998. 10(2): p. 594-600.
37. Chen, Y., B. He, T. Huang, and H. Liu, Controlled synthesis of palladium
icosahedra nanocrystals by reducing H2PdCl4 with tetraethylene glycol. Colloids
and Surfaces A: Physicochemical and Engineering Aspects, 2009. 348(1-3): p.
145-150.
38. McLellan, J.M., Y. Xiong, M. Hu, and Y. Xia, Surface-enhanced Raman
scattering of 4-mercaptopyridine on thin films of nanoscale Pd cubes, boxes, and
cages. Chemical Physics Letters, 2006. 417(1-3): p. 230-234.
39. Choo, H., B. He, K.Y. Liew, H. Liu, and J. Li, Morphology and control of Pd
nanoparticles. Journal of Molecular Catalysis A: Chemical, 2006. 244 p. 217–
228.
40. Sun, Y. and Y. Xia, Shape-Controlled Synthesis of Gold and Silver Nanoparticles.
Science, 2002. 298(5601): p. 2176-2179.
41. Kim, F., S. Connor, H. Song, T. Kuykendall, and P. Yang, Platonic Gold
Nanocrystals. Angewandte Chemie International Edition, 2004. 43(28): p. 3673-
3677.
Page 88
75
42. Andrade Sales, E., B. Benhamida, V. Caizergues, J.-P. Lagier, F. Fiévet, and F.
Bozon-Verduraz, Alumina-supported Pd, Ag and Pd-Ag catalysts: Preparation
through the polyol process, characterization and reactivity in hexa-1,5-diene
hydrogenation. Applied Catalysis A: General, 1998. 172(2): p. 273-283.
43. Song, H., F. Kim, S. Connor, G.A. Somorjai, and P. Yang, Pt Nanocrystals:
Shape Control and Langmuir−Blodgett Monolayer Formation. The Journal of
Physical Chemistry B, 2004. 109(1): p. 188-193.
44. Tsung, C.-K., J.N. Kuhn, W. Huang, C. Aliaga, L.-I. Hung, G.A. Somorjai, and P.
Yang, Sub-10 nm Platinum Nanocrystals with Size and Shape Control: Catalytic
Study for Ethylene and Pyrrole Hydrogenation. Journal of the American
Chemical Society, 2009. 131(16): p. 5816-5822.
45. Narayanan, R. and M.A. El-Sayed, Catalysis with Transition Metal Nanoparticles
in Colloidal Solution: Nanoparticle Shape Dependence and Stability. The Journal
of Physical Chemistry B, 2005. 109(26): p. 12663-12676.
46. Li, Y.D., C.W. Li, H.R. Wang, L.Q. Li, and Y.T. Qian, Preparation of nickel
ultrafine powder and crystalline film by chemical control reduction. Materials
Chemistry and Physics, 1999. 59(1): p. 88-90.
47. Hu, H. and K. Sugawara, Selective synthesis of metallic nickel particles with
control of shape via wet chemical process. Materials Letters, 2008. 62(28): p.
4339-4342.
48. Kurihara, L.K., G.M. Chow, and P.E. Schoen, Nanocrystalline metallic powders
and films produced by the polyol method. Nanostructured Materials, 1995. 5(6): p.
607-613.
49. Libor, Z. and Q. Zhang, The synthesis of nickel nanoparticles with controlled
morphology and SiO2/Ni core-shell structures. Materials Chemistry and Physics,
2009. 114(2-3): p. 902-907.
50. Hu, H. and K. Sugawara, Ag-catalyzed synthesis of ultrafine nickel nanoparticles:
A facile way to size control. Materials Letters, 2009. 63(11): p. 940-942.
51. Qiang, L. and D. Weimin, Large-Scale Synthesis and Catalytic Properties of
Nearly Monodispersive Nickel 3D Nanostructures. Rare Metal Materials and
Engineering, 2009. 38(12): p. 2080-2084.
52. Kim, K.H., Y.B. Lee, E.Y. Choi, H.C. Park, and S.S. Park, Synthesis of nickel
powders from various aqueous media through chemical reduction method.
Materials Chemistry and Physics, 2004. 86(2-3): p. 420-424.
Page 89
76
53. Semagina, N. and L. Kiwi-Minsker, Recent Advances in the Liquid-Phase
Synthesis of Metal Nanostructures with Controlled Shape and Size for Catalysis.
Catalysis Reviews: Science and Engineering, 2009. 51(2): p. 147 - 217.
54. Telkar, M.M., C.V. Rode, R.V. Chaudhari, S.S. Joshi, and A.M. Nalawade,
Shape-controlled preparation and catalytic activity of metal nanoparticles for
hydrogenation of 2-butyne-1,4-diol and styrene oxide. Applied Catalysis A:
General, 2004. 273(1-2): p. 11-19.
55. Nagaveni, K., A. Gayen, G.N. Subbanna, and M.S. Hegde, Pd-coated Ni
nanoparticles by the polyol method: an efficient hydrogenation catalyst. Journal
of Materials Chemistry, 2002. 12(10): p. 3147-3151.
56. Lu, P., T. Teranishi, K. Asakura, M. Miyake, and N. Toshima, Polymer-Protected
Ni/Pd Bimetallic Nano-Clusters: Preparation, Characterization and Catalysis for
Hydrogenation of Nitrobenzene. The Journal of Physical Chemistry B, 1999.
103(44): p. 9673-9682.
57. Montejano-Carrizales, J.M., J.L. Rodríguez-López, U. Pal, M. Miki-Yoshida, and
M. José-Yacamán, The Completion of the Platonic Atomic Polyhedra: The
Dodecahedron. Small, 2006. 2(3): p. 351-355.
58. Cuya Huaman, J.L., S. Fukao, K. Shinoda, and B. Jeyadevan, Novel standing Ni-
Pt alloy nanocubes. CrystEngComm, 2011. 13(10): p. 3364-3369.
59. Carenco, S., C.d. Boissi re, L. Nicole, C.m. anchez, P. Le Floch, and N.
M zailles, Controlled Design of Size-Tunable Monodisperse Nickel
Nanoparticles. Chemistry of Materials, 2010. 22(4): p. 1340-1349.
60. Chen, D., K.O. Christensen, E. Ochoa-Fernandez, Z. Yu, B. Tøtdal, N. Latorre, A.
Monzon, and A. Holmen, Synthesis of Carbon Nanofibers: Effects of Ni Crystal
Size during Methane Decomposition. Journal of Catalysis, 2005. 229 p. 82-96.
61. Christensen, K.O., D. Chen, R. Lødeng, and A. Holmen, Effect of supports and Ni
crystal size on carbon formation and sintering during steam methane reforming.
Applied Catalysis A: General, 2006. 314 p. 9-22.
62. Kamyabi-Gol, A., S.M. Zebarjad, and S.A. Sajjadi, A study on the effect of
synthesis parameters on the size of nickel particles in sol–gel derived Ni–SiO2–
Al2O3 nanocomposites. Journal of Sol-Gel Science and Technology, 2009. 51(1):
p. 92-101.
63. Li, D. and S. Komarneni, Microwave-Assisted Polyol Process for Synthesis of Ni
Nanoparticles. Journal of the American Ceramic Society, 2006. 89(5): p. 1510-
1517.
Page 90
77
64. Metin, O., V. Mazumder, S. Ozkar, and S.S. Sun, Monodisperse Nickel
Nanoparticles; and Their Catalysis in Hydrolytic Dehydrogenation of Ammonia
Borane. Journal of the American Chemical Society, 2010. 132(5): p. 1468-+.
65. Winnischofer, H., T.C.R. Rocha, W.C. Nunes, L.M. Socolovsky, M. Knobel, and
D. Zanchet, Chemical Synthesis and Structural Characterization of Highly
Disordered Ni Colloidal Nanoparticles. ACS Nano, 2008. 2(6): p. 1313-1319.
66. Hou, Y., H. Kondoh, T. Ohta, and S. Gao, Size-controlled synthesis of nickel
nanoparticles. Applied Surface Science, 2005. 241(1-2): p. 218-222.
67. Chen, M., J. Falkner, W.-H. Guo, J.-Y. Zhang, C. Sayes, and V.L. Colvin,
Synthesis and self-organization of soluble monodisperse palladium nanoclusters.
Journal of Colloid and Interface Science, 2005. 287(1): p. 146-151.
68. Li, Y., E. Boone, and M.A. El-Sayed, Size Effects of PVP−Pd Nanoparticles on
the Catalytic Suzuki Reactions in Aqueous Solution. Langmuir, 2002. 18(12): p.
4921-4925.
69. Deckers, S., F.H.P.M. Habraken, W.F. van der Weg, A.W.D. van der Gon, J.F.
van der Veen, and J.W. Geus, Oxidation-induced segregation at the
Pt0.5Ni0.5(111) surface studied by medium-energy ion scattering. Applied
Surface Science, 1990. 45(2): p. 121-129.
70. Sun, S.-G. and Y.-Y. Yang, Studies of kinetics of HCOOH oxidation on Pt(100),
Pt(110), Pt(111), Pt(510) and Pt(911) single crystal electrodes. Journal of
Electroanalytical Chemistry, 1999. 467(1-2): p. 121-131.
71. Erikson, H., A. Sarapuu, K. Tammeveski, J. Solla-Gullón, and J.M. Feliu,
Enhanced electrocatalytic activity of cubic Pd nanoparticles towards the oxygen
reduction reaction in acid media. Electrochemistry Communications, 2011. 13(7):
p. 734-737.
72. Kondo, S., M. Nakamura, N. Maki, and N. Hoshi, Active Sites for the Oxygen
Reduction Reaction on the Low and High Index Planes of Palladium. The Journal
of Physical Chemistry C, 2009. 113(29): p. 12625-12628.
73. Zhou, Y.-H., P.-H. Lv, and G.-C. Wang, DFT studies of methanol decomposition
on Ni(100) surface: Compared with Ni(111) surface. Journal of Molecular
Catalysis A: Chemical, 2006. 258(1-2): p. 203-215.
74. Derry, G.N., R. Wan, F. Strauch, and C. English, Segregation and interlayer
relaxation at the NiPd(111) surface. Journal of Vacuum Science & Technology
A, 2011. 29(1).
Page 91
78
75. Derry, G.N., C.B. McVey, and P.J. Rous, The surface structure and segregation
profile of Ni50Pd50(100): a dynamical LEED study. Surface Science, 1995.
326(1-2): p. 59-66.
76. Derry, G.N. and R. Wan, Comparison of surface structure and segregation in
AgAu and NiPd alloys. Surface Science, 2004. 566: p. 862-868.
77. Menning, C.A. and J.G. Chen, Thermodynamics and kinetics of oxygen-induced
segregation of 3d metals in Pt–3d–Pt(111) and Pt–3d–Pt(100) bimetallic
structures. Journal of Chemical Physics, 2008. 128(16): p. 4703-4712.
78. Bertolini, J.C., P. Miegge, P. Hermann, J.L. Rousset, and B. Tardy, On the
reactivity of 2D Pd surface alloys obtained by surface segregation or deposition
technique. Surface Science, 1995. 331-333, Part A(0): p. 651-658.
79. Michel, A.C., L. Lianos, J.L. Rousset, P. Delichère, N.S. Prakash, J. Massardier,
Y. Jugnet, and J.C. Bertolini, Surface characterization and reactivity of Pd8Ni92
(111) and (110) alloys. Surface Science, 1998. 416(1-2): p. 288-294.
80. Miegge, P., J.L. Rousset, B. Tardy, J. Massardier, and J.C. Bertolini, PD1NI99
AND PD5NI95 - PD SURFACE SEGREGATION AND REACTIVITY FOR THE
HYDROGENATION OF 1,3-BUTADIENE. Journal of Catalysis, 1994. 149(2): p.
404-413.
81. Helfensteyn, S., J. Luyten, L. Feyaerts, and C. Creemers, Modelling surface
phenomena in Pd-Ni alloys. Applied Surface Science, 2003. 212-213(0): p. 844-
849.
82. Løvvik, O.M., Surface segregation in palladium based alloys from density-
functional calculations. Surface Science, 2005. 583(1): p. 100-106.
83. Menon, M. and B.C. Khanra, Spatial distribution of atoms in gas-covered Pd-X
nanoparticles (X = Ag, Cu, Ni, Pt). International Journal of Modern Physics B,
2000. 14(16): p. 1683-1692.
84. Ma, Y. and P.B. Balbuena, Surface segregation in bimetallic Pt3M (M=Fe, Co,
Ni) alloys with adsorbed oxygen. Surface Science, 2009. 603(2): p. 349-353.
85. Menning, C.A. and J.G.G. Chen, General trend for adsorbate-induced
segregation of subsurface metal atoms in bimetallic surfaces. Journal of Chemical
Physics, 2009. 130(17).
86. McLellan, J.M., A. Siekkinen, J. Chen, and Y. Xia, Comparison of the surface-
enhanced Raman scattering on sharp and truncated silver nanocubes. Chemical
Physics Letters, 2006. 427(1-3): p. 122-126.
Page 92
79
87. Grace, A.N. and K. Pandian, One pot synthesis of polymer protected Pt, Pd, Ag
and Ru nanoparticles and nanoprisms under reflux and microwave mode of
heating in glycerol - A comparative study. Materials Chemistry and Physics,
2007. 104 p. 191-198.
88. El-Ansary, A. and L.M. Faddah, Nanoparticles as biochemical sensors.
Nanotechnol., Sci. Appl., 2010. 3(Copyright (C) 2011 American Chemical
Society (ACS). All Rights Reserved.): p. 65-76.
89. Shtykov, S.N. and T.Y. Rusanova, Nanomaterials and nanotechnologies in
chemical and biochemical sensors: Capabilities and applications. Russ. J. Gen.
Chem., 2008. 78(Copyright (C) 2011 American Chemical Society (ACS). All
Rights Reserved.): p. 2521-2531.
90. Hu, J., M. Jiang, and Z. Lin, Novel technology for depositing a Pd-Ag alloy film
on a tapered optical fibre for hydrogen sensing. J. Opt. A: Pure Appl. Opt., 2005.
7(Copyright (C) 2011 American Chemical Society (ACS). All Rights Reserved.):
p. 593-598.
91. Ohara, S., Y. Hatakeyama, M. Umetsu, K. Sato, T. Naka, and T. Adschiri,
Palladium–polyelectrolyte hybrid nanoparticles for hydrogen sensor in fuel cells.
Journal of Power Sources, 2009. 193 p. 367-370.
92. Wang, M. and Y. Feng, Palladium-silver thin film for hydrogen sensing. Sens.
Actuators, B, 2007. B123(Copyright (C) 2011 American Chemical Society
(ACS). All Rights Reserved.): p. 101-106.
93. Cuenya, B.R., Synthesis and catalytic properties of metal nanoparticles: Size,
shape, support, composition, and oxidation state effects. Thin Solid Films, 2010.
518(12): p. 3127-3150.
94. Chen, E., H. Su, W. Zhang, and T. Tan, A novel shape-controlled synthesis of
dispersed silver nanoparticles by combined bioaffinity adsorption and TiO2
photocatalysis. Powder Technology, 2011. 212(1): p. 166-172.
95. Lee, C.-L., C.-M. Tseng, R.-B. Wu, C.-C. Wu, and S.-C. Syu, Catalytic
characterization of hollow silver/palladium nanoparticles synthesized by a
displacement reaction. Electrochimica Acta, 2009. 54(23): p. 5544-5547.
96. Mitsuishi, M., H. Tanaka, M. Obata, and T. Miyashita, Plasmon-Enhanced
Luminescence from Ultrathin Hybrid Polymer Nanoassemblies for Microscopic
Oxygen Sensor Application. Langmuir, 2010. 26(Copyright (C) 2011 American
Chemical Society (ACS). All Rights Reserved.): p. 15117-15120.
Page 93
80
97. Humbert, M.P., L.E. Murillo, and J.G. Chen, Rational Design of Platinum-Based
Bimetallic Catalysts with Enhanced Hydrogenation Activity. ChemPhysChem,
2008. 9(9): p. 1262-1264.
98. Khan, N., L. Murillo, Y. Shu, and J. Chen, Correlating Low-temperature
Hydrogenation Activity of Co/Pt(111) Bimetallic Surfaces to Supported Co/Pt/γ-
Al2O3 Catalysts. Catalysis Letters, 2005. 105(3): p. 233-238.
99. Kitchin, J.R., N.A. Khan, M.A. Barteau, J.G. Chen, B. Yakshinskiy, and T.E.
Madey, Elucidation of the active surface and origin of the weak metal–hydrogen
bond on Ni/Pt(1 1 1) bimetallic surfaces: a surface science and
density functional theory study. Surface Science, 2003. 544(2-3): p. 295-308.
100. Murillo, L.E. and J.G. Chen, Adsorption and reaction of propanal, 2-propenol
and 1-propanol on Ni/Pt(111) bimetallic surfaces. Surface Science, 2008. 602 p.
2412-2420.
101. Corcoran, C.J., H. Tavassol, M.A. Rigsby, P.S. Bagus, and A. Wieckowski,
Application of XPS to study electrocatalysts for fuel cells. Journal of Power
Sources, 2010. 195(24): p. 7856-7879.
102. Borchert, H., B. Jürgens, T. Nowitzki, P.Behrend, Y. Borchert, V. Zielasek, S.
Giorgio, C.R. Henry, and M. Bäumer, Decomposition of methanol by Pd, Co, and
bimetallic Co–Pd catalysts: A combined study of well-defined systems under
ambient and UHV conditions. Journal of Catalysis, 2008. 256: p. 24–36.
103. Singh, S.K., Y. Iizuka, and Q. Xu, Nickel-palladium nanoparticle catalyzed
hydrogen generation from hydrous hydrazine for chemical hydrogen storage.
International Journal of Hydrogen Energy, 2011. 36(18): p. 11794-11801.
104. Coq, B. and F. Figueras, Bimetallic palladium catalysts: influence of the co-metal
on the catalyst performance. Journal of Molecular Catalysis A: Chemical, 2001.
173(1-2): p. 117-134.
105. Kittel, C., Introduction to Solid State Physics. 4th ed. 1971: John Wiley and Sons.
106. XAFS, EXAFS, and XANES. July 7, 2012 November 12, 2012]; Available from:
http://www.xafs.org/.
107. Hokenek, S. and J.N. Kuhn, Methanol Decomposition over Palladium Particles
Supported on Silica: Role of Particle Size and Co-Feeding Carbon Dioxide on the
Catalytic Properties. ACS Catalysis, 2012. 2(6): p. 1013-1019.
108. Ravel, B. and M. Newville, ATHENA, ARTEMIS, HEPHAESTUS: Data Analysis
for X-ray Absorption Spectroscopy Using IFEFFIT. Journal of Synchrotron
Radiation, 2005. 12: p. 537-541.
Page 94
81
109. Newville, M., IFEFFIT: Interactive XAFS Analysis and FEFF Fitting. Journal of
Synchrotron Radiation, 2001. 8: p. 322– 324.
110. Chen, J.G., NEXAFS investigations of transition metal oxides, nitrides, carbides,
sulfides and other interstitial compounds. Surface Science Reports, 1997. 30(1–
3): p. 1-152.
111. Aslan, K., J. Lakowicz, and C. Geddes, Metal-enhanced fluorescence using
anisotropic silver nanostructures: critical progress to date. Analytical and
Bioanalytical Chemistry, 2005. 382(4): p. 926-933.
112. Lakowicz, J.R., Radiative Decay Engineering: Biophysical and Biomedical
Applications. Analytical Biochemistry, 2001. 298(1): p. 1-24.
113. Lakowicz, J.R., J. Malicka, I. Gryczynski, Z. Gryczynski, and C.D. Geddes,
Radiative Decay Engineering: The Role of Photonic Mode Density in
Biotechnology. Journal of Physics D: Applied Physics, 2003. 36: p. R240-R249.
114. Lakowicz, J.R., Y. Shen, S. D'Auria, J. Malicka, J. Fang, Z. Gryczynski, and I.
Gryczynski, Radiative Decay Engineering: 2. Effects of Silver Island Films on
Fluorescence Intensity, Lifetimes, and Resonance Energy Transfer. Analytical
Biochemistry, 2002. 301(2): p. 261-277.
115. Malicka, J., I. Gryczynski, Z. Gryczynski, and J.R. Lakowicz, Effects of
fluorophore-to-silver distance on the emission of cyanine–dye-labeled
oligonucleotides. Analytical Biochemistry, 2003. 315(1): p. 57-66.
116. Zhang, J., E. Matveeva, I. Gryczynski, Z. Leonenko, and J.R. Lakowicz, Metal-
Enhanced Fluoroimmunoassay on a Silver Film by Vapor Deposition. The
Journal of Physical Chemistry B, 2005. 109(16): p. 7969-7975.
117. Aslan, K., S.N. Malyn, and C.D. Geddes, Metal-Enhanced Fluorescence from
Large Gold Colloids on Planar Surfaces: Angular Dependent Emission. Journal
of Fluorescence, 2007. 17(1): p. 7-13.
118. Dulkeith, E., M. Ringler, T.A. Klar, J. Feldmann, A. Muñoz Javier, and W.J.
Parak, Gold Nanoparticles Quench Fluorescence by Phase Induced Radiative
Rate Suppression. Nano Letters, 2005. 5(4): p. 585-589.
119. Pompa, P.P., MartiradonnaL, A.D. Torre, F.D. Sala, MannaL, M. De Vittorio,
CalabiF, CingolaniR, and RinaldiR, Metal-enhanced fluorescence of colloidal
nanocrystals with nanoscale control. Nat Nano, 2006. 1(2): p. 126-130.
120. Zhang, Y., K. Aslan, M.J.R. Previte, and C.D. Geddes, Metal-Enhanced
Fluorescence from Copper Substrates. Applied Physics Letters, 2007. 90: p.
173116.
Page 95
82
121. Cazayous, M., C. Langlois, T. Oikawa, C. Ricolleau, and A. Sacuto, Cu-Ag core-
shell nanoparticles: A direct correlation between micro-Raman and electron
microscopy. Physical Review B, 2006. 73(11): p. 113402.
122. Nakamura, T., Y. Tsukahara, T. Yamauchi, T. Sakata, H. Mori, and Y. Wada,
Preparation of Ag Core-Cu Shell Nanoparticles by Microwave-assisted Alcohol
Reduction Process. Chemistry Letters, 2007. 36(1): p. 154-155.
123. Tsuji, M., S. Hikino, R. Tanabe, and D. Yamaguchi, Synthesis of Ag@Cu Core-
Shell Nanoparticles in High Yield Using a Polyol Method. Chemistry Letters,
2010. 39(4): p. 334-336.
124. Carlsson, A.F., M. Naschitzki, M. Bäumer, and H.J. Freund, Adsorption and
reaction on pristine and oxidized Co-Pd bimetallic particles supported on Al2O3
thin films. Surface Science, 2003. 545(1-2): p. 143-153.
125. Conant, T., A. M.Karima, V. Lebarbier, Y. Wang, F. Girgsdies, R. Schlögl, and
A. Datye, Stability of bimetallic Pd–Zn catalysts for the steam reforming of
methanol. Journal of Catalysis 2008. 257: p. 64–70.
126. Elhamdaoui, A., G. Bergeret, J. Massardier, M. Primet, and A. Renouprez, CO
and NO Interaction with Pd-Ag and Pd-Cr Bimetallic Catalysts .: 1. X-Ray-
Diffraction, Infrared-Spectroscopy, and Thermoreaction. Journal of Catalysis,
1994. 148(1): p. 47-55.
127. Fıçıcılar, B., A. Bayrakçeken, and İ. Eroğlu, Effect of Pd loading in Pd-Pt
bimetallic catalysts doped into hollow core mesoporous shell carbon on
performance of proton exchange membrane fuel cells. Journal of Power Sources,
2009. 193(1): p. 17-23.
128. Hungría, A.B., J.J. Calvino, J.A. Anderson, and A. Martínez-Arias, Model
bimetallic Pd-Ni automotive exhaust catalysts: Influence of thermal aging and
hydrocarbon self-poisoning. Applied Catalysis B: Environmental, 2006. 62 p.
359–368.
129. Jiang, Q., L. Jiang, H. Hou, J. Qi, S. Wang, and G. Sun, Promoting Effect of Ni in
PtNi Bimetallic Electrocatalysts for the Methanol Oxidation Reaction in Alkaline
Media: Experimental and Density Functional Theory Studies. The Journal of
Physical Chemistry C, 2010. 114(46): p. 19714-19722.
130. Khan, N.A., A. Uhl, S. Shaikhutdinov, and H.J. Freund, Alumina supported model
Pd-Ag catalysts: A combined STM, XPS, TPD and IRAS study. Surface Science,
2006. 600(9): p. 1849-1853.
Page 96
83
131. Lee, A.F., C.V. Ellis, K. Wilson, and N.S. Hondow, In situ studies of titania-
supported Au shell-Pd core nanoparticles for the selective aerobic oxidation of
crotyl alcohol. Catalysis Today, 2010. In Press, Corrected Proof.
132. Lonergan, W.W., D.G. Vlachos, and J.G. Chen, Correlating extent of Pt–Ni bond
formation with low-temperature hydrogenation of benzene and 1,3-butadiene over
supported Pt/Ni bimetallic catalysts. Journal of Catalysis, 2010. 271 p. 239-250.
133. Mukainakano, Y., K. Yoshida, S. Kado, K. Okumura, K. Kunimori, and K.
Tomishige, Catalytic performance and characterization of Pt–Ni bimetallic
catalysts for oxidative steam reforming of methane. Chemical Engineering
Science, 2008. 63 p. 4891 - 4901.
134. P. Hermann, J.M. Guigner, B. Tardy, Y. Jugnet, D. Simon, and J.-C. Bertolini,
The Pd/Ni(110) Bimetallic System: Surface Characterisation by LEED, AES, XPS,
and LEIS Techniques; New Insight on Catalytic Properties. Journal of Catalysis,
1996. 163: p. 169-175.
135. Persson, K., A. Ersson, K. Jansson, N. Iverlund, and S. Järås, Influence of co-
metals on bimetallic palladium catalysts for methane combustion. Journal of
Catalysis, 2005. 231(1): p. 139-150.
136. Qiu, C., R. Shang, Y. Xie, Y. Bu, C. Li, and H. Ma, Electrocatalytic activity of
bimetallic Pd–Ni thin films towards the oxidation of methanol and ethanol.
Materials Chemistry and Physics, 2010. 120 p. 323-330.
137. Steinhauer, B., M.R. Kasireddy, J. Radnik, and A. Martin, Development of Ni-Pd
bimetallic catalysts for the utilization of carbon dioxide and methane by dry
reforming. Applied Catalysis A: General, 2009. 366 p. 333–341.
138. Telkar, M.M., J.M. Nadgeri, C.V. Rode, and R.V. Chaudhari, Role of a co-metal
in bimetallic Ni–Pt catalyst for hydrogenation of m-dinitrobenzene to m-
phenylenediamine. Applied Catalysis A: General, 2005. 295 p. 23-30.
139. Tzitzios, V.K. and V. Georgakilas, Catalytic reduction of N2O over Ag-Pd/Al2O3
bimetallic catalysts. Chemosphere, 2005. 59(6): p. 887-891.
140. Xiong, D.a., Z. Li, Y. An, R. Ma, and L. Shi, Novel Au-Pd bimetallic core-shell
nanocomplex and its catalytic activity modulation. Journal of Colloid and
Interface Science, 2010. 350(1): p. 260-267.
141. Yoshimura, Y., M. Toba, T. Matsui, M. Harada, Y. Ichihashi, K.K. Bando, H.
Yasuda, H. Ishihara, Y. Morita, and T. Kameoka, Active phases and sulfur
tolerance of bimetallic Pd–Pt catalysts used for hydrotreatment. Applied
Catalysis A: General, 2007. 322 p. 152–171.
Page 97
84
142. Dubertret, B., M. Calame, and A.J. Libchaber, Single-mismatch detection using
gold-quenched fluorescent oligonucleotides. Nat Biotech, 2001. 19(4): p. 365-
370.
143. Single-mismatch detection using gold-quenched fluorescent oligonucleotides. Nat
Biotech, 2001. 19(7): p. 680-681.
144. Metal Nanoparticles of Complex Morphologies: A General Introduction, in
Complex-Shaped Metal Nanoparticles. 2012, Wiley-VCH Verlag GmbH & Co.
KGaA. p. 1-5.
Page 99
86
Appendix 1: EXAFS Experimental Details
EXAFS was done as per the supporting information for reference [107]. For data
acquisition silica-supported Pd catalyst powders (a mass ~ 50 mg) were ground with a
mortar and pestle and pressed into 13 mm diameter pellets using a Carver press operated
at 12,500 psi for 30 s. Pressed catalyst pellet thicknesses were adjusted to obtain a linear
absorption coefficient near 1.
XAS spectra were collected in transmission mode at the Pd K absorption edge
(24350 eV) under ambient conditions, with the scan set to take data from 150 eV before
to 30 eV before the edge in 10 eV steps and then to 975 eV after the edge in 2 eV steps
(pre-edge/edge region). Three scans were taken per sample to improve the signal-to-noise
ratio. Data processing (merging of individual scans and data reduction) was performed
with the Athena software package[108, 109].
More information can be found at
http://pubs.acs.org/doi/suppl/10.1021/cs200689k/suppl_file/cs200689k_si_001.pdf
Page 100
87
Appendix 2: Casino Monte Carlo Simulations
Given an Ag nanoparticle of average side length 56 nm, we simulated
acceleration voltages of 25, 10, and 5 kV to determine the approximate range of
acceleration voltages to use.
Figure A2-1: Simulated Ag nanocube under a 25 kV electron beam with 5 nm diameter.
As illustrated in Figure A2-1, at 25 kV acceleration voltage, the beam passes right
through the sample. This is undesirable since the Ag nanocubes are supported on a Cu
formvar TEM grid for analysis. As a result of the high acceleration voltage, the majority
of the excitation volume is below the Ag nanocube, and thus most of the signal seen by
the EDS detector would be a result of the STEM holder used to image the Cu formvar
Page 101
88
Appendix 2 (Continued)
grid. At an acceleration voltage of 10 kV, the same problem is observed as at 25 kV. The
results of the Monte Carlo simulation are shown in Figure A2-2.
Figure A2-2: Simulated Ag nanocube under a 10 kV electron beam with 5 nm diameter.
At an acceleration voltage of 5 kV, the majority of the excitation volume is
contained within the Ag nanocube. However, in order to achieve good counting statistics,
a consideration especially important in the case of a sample with a small volume, an
acceleration voltage of twice the peak energy is needed. As such, because the Ag Lα peak
has an energy of 2.985 eV, an acceleration voltage of 6 kV was used in imaging and EDS
measurements.
Page 102
89
Appendix 2 (Continued)
Figure A2-3: Simulated Ag nanocube under a 5 kV electron beam with 5 nm diameter.
Page 103
90
Appendix 3: Journal Reprint Permissions
Page 104
91
Appendix 3 (Continued)
Page 105
92
Appendix 3 (Continued)
Page 106
About the Author
Selma Hokenek is currently a graduate student in the Heterogeneous Catalysis
and Materials Chemistry Group at the University of South Florida. She entered USF in
2007 after receiving her B.S.E in Biomedical Engineering at Tulane University,
completing an M.S degree in Engineering Sciences in 2009 prior to joining her current
research group. Her research interests have focused primarily on morphological and size
control of nanoscale materials for applications in catalysis and sensing.


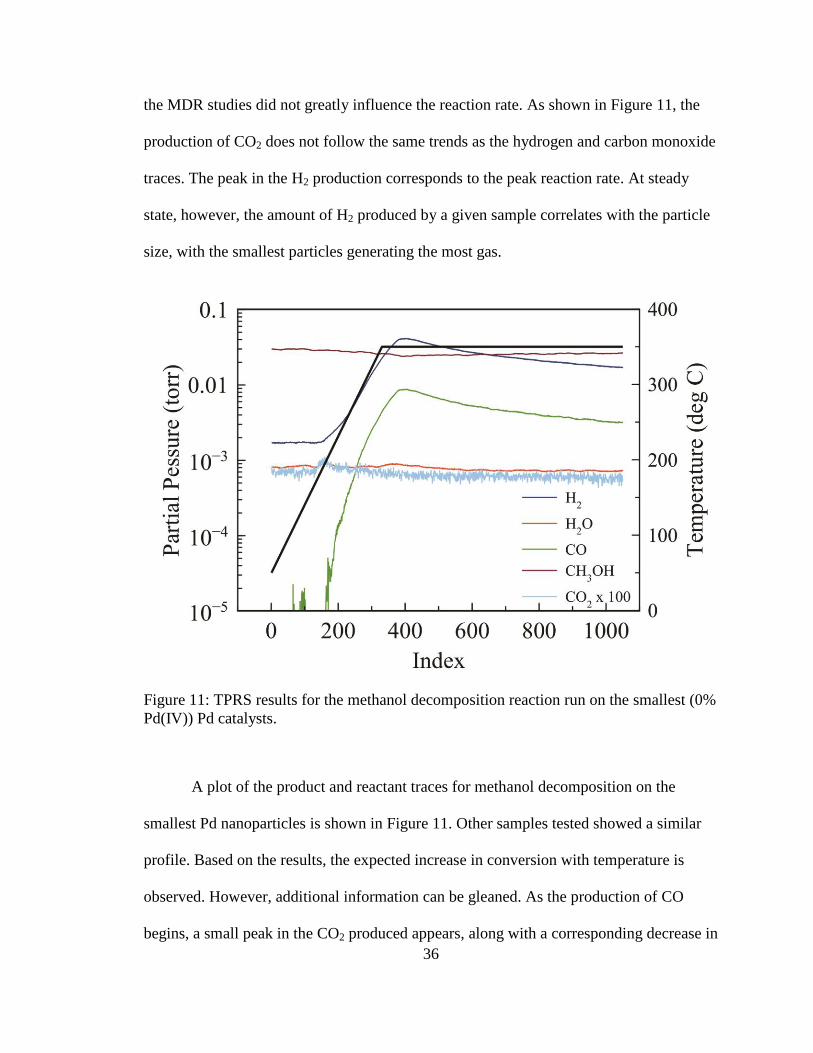

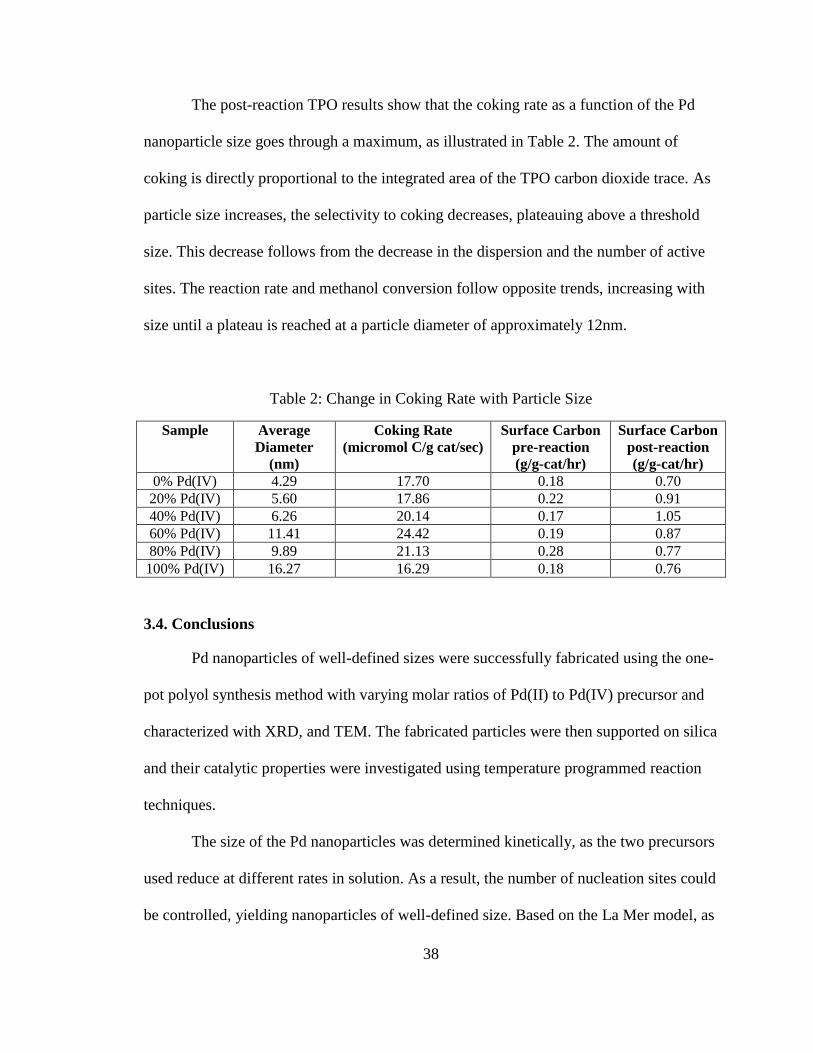


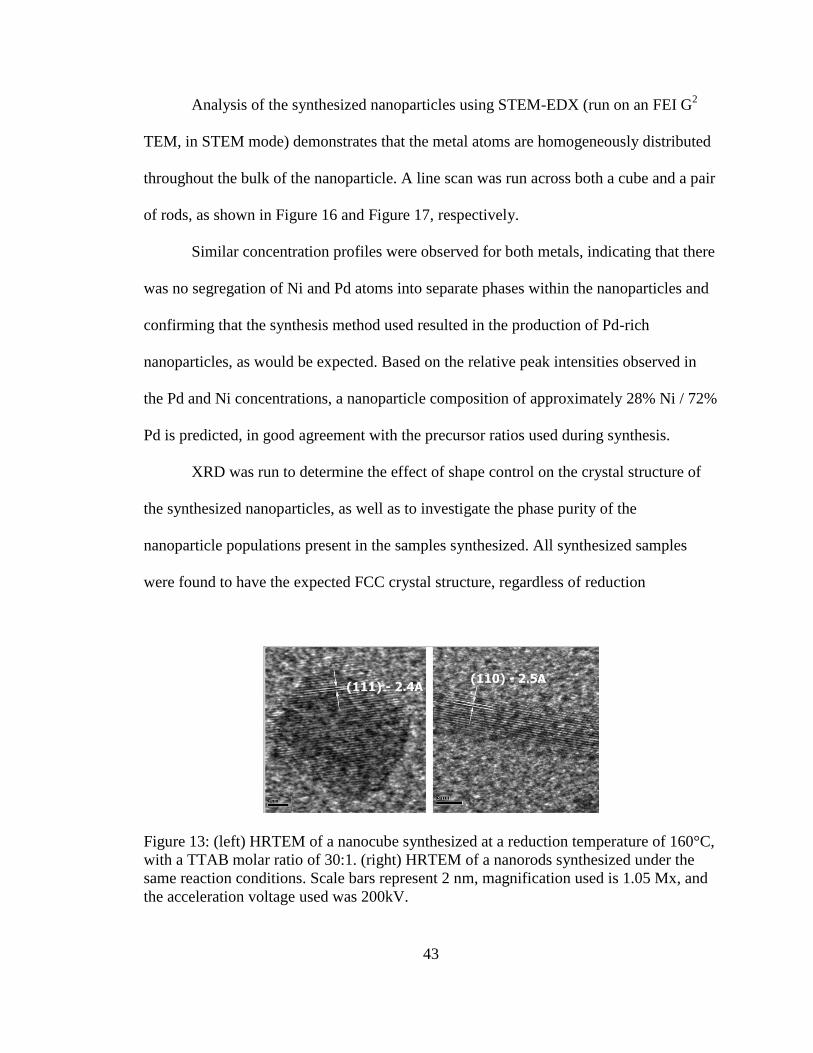
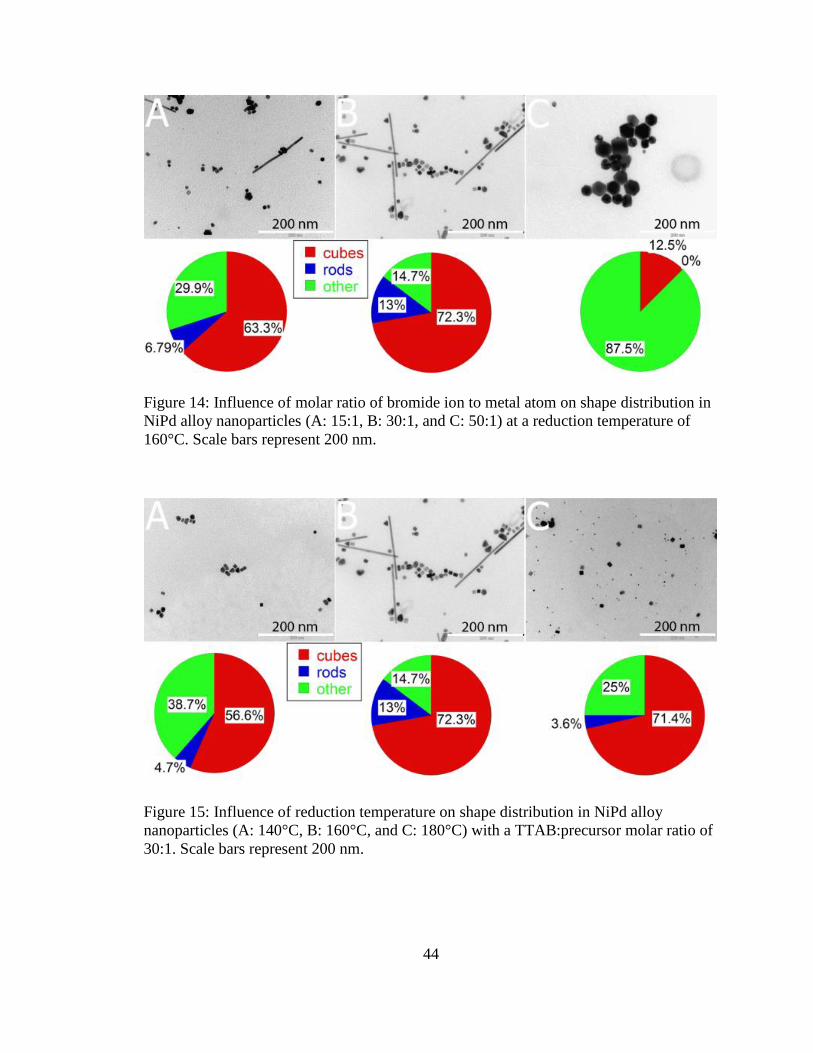


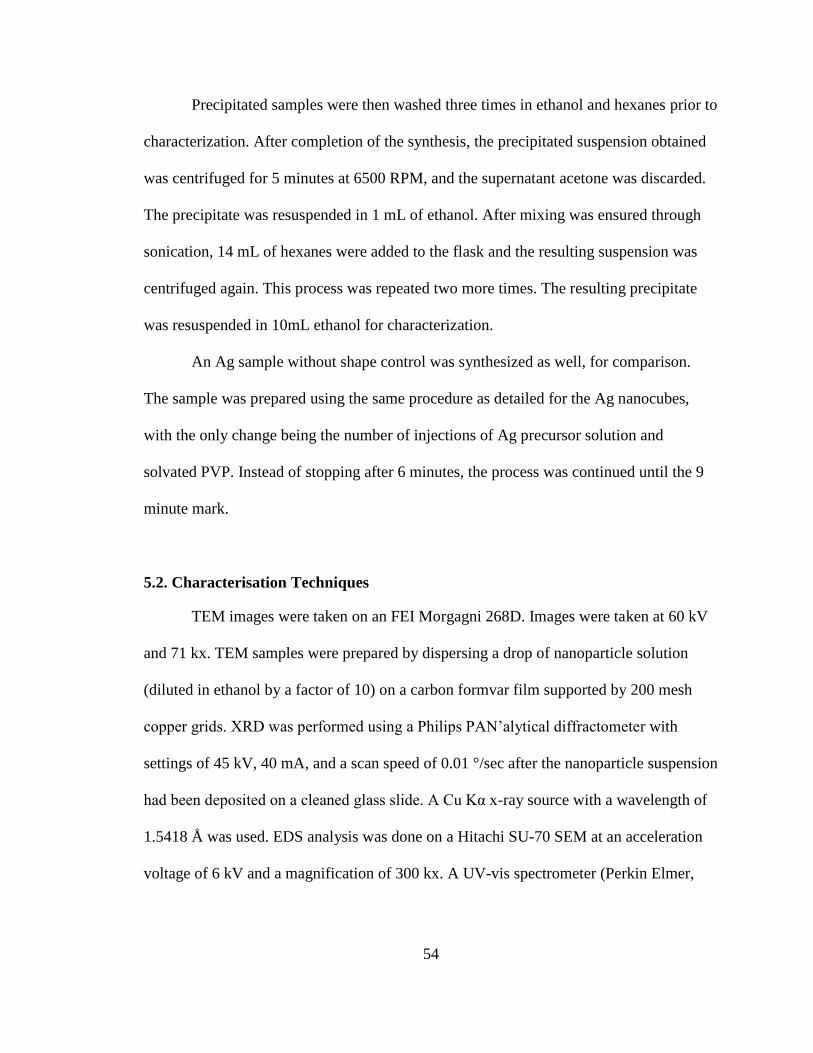


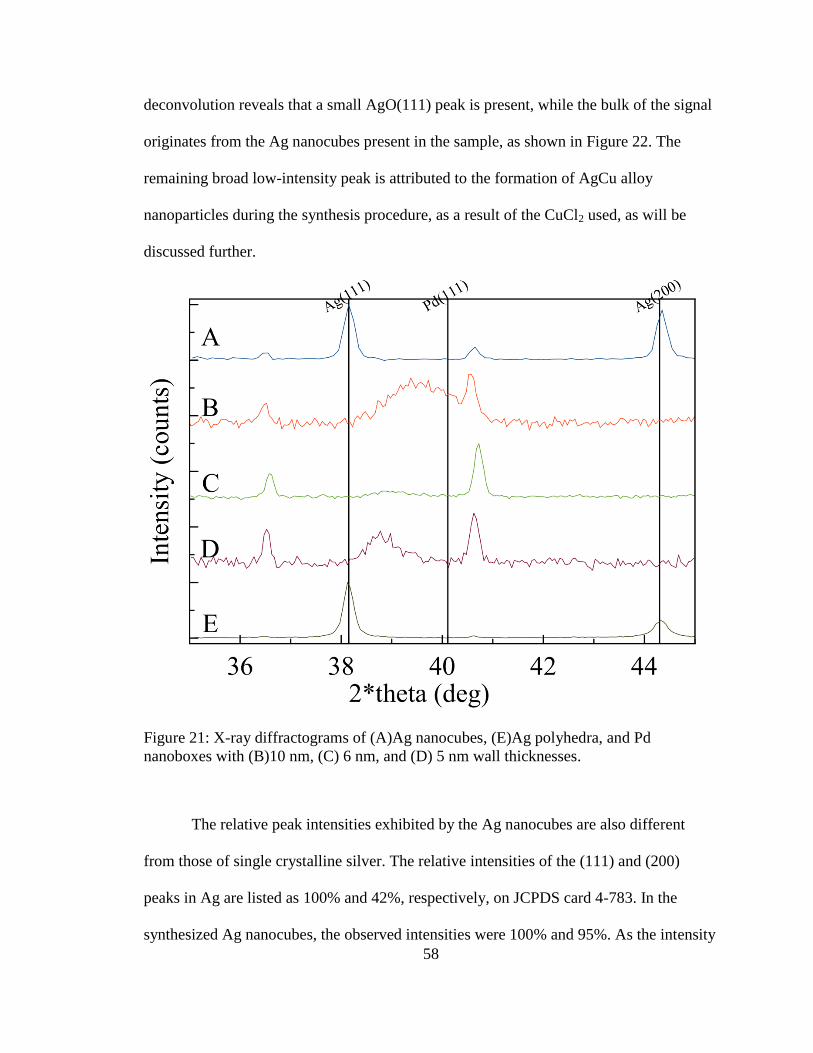


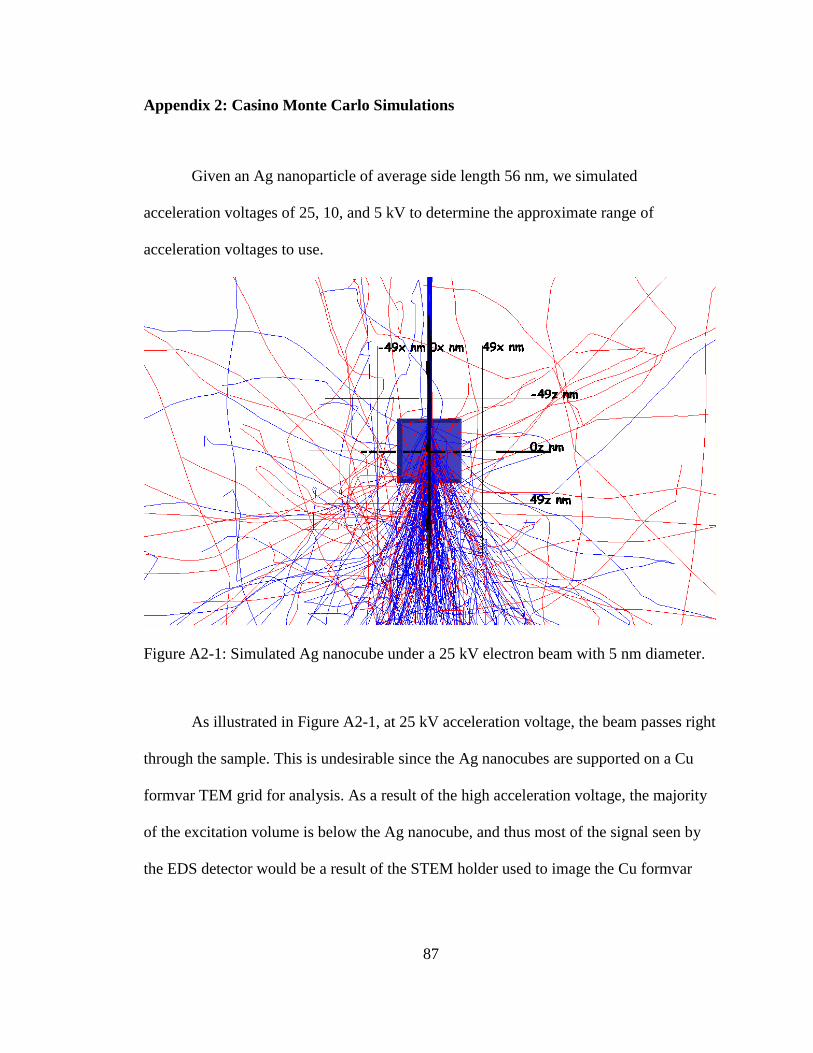


![Compressive Sensing and Structured Random Matricesrauhut/files/LinzRauhut.pdf · compressive sensing may be applied in imaging [44, 109], A/D conversion [133], radar [69, 49] and](https://static.documents.pub/doc/80x56/605dcbb27499a3775520d1e6/compressive-sensing-and-structured-random-matrices-rauhutfileslinzrauhutpdf.jpg)


