Perception & Psychophysics 1995,57 (4),519-532 Structuring temporal sequences: Comparison of models and factors of complexity PETER ESSENS TNO Human Factors Research Institute, Soesterberg, The Netherlands Twostages for structuring tone sequences have been distinguished by Povel and Essens (1985),In the first, a mental clock segments a sequence into equal time units (clock model); in the second, in- tervals are specified in terms of subdivisions of these units. The present findings support the clock model in that it predicts human performance better than three other algorithmic models. Two fur- ther experiments in which clock and subdivision characteristics were varied did not support the hy- pothesized effect of the nature of the subdivisions on complexity. A model focusing on the variations in the beat-anchored envelopes of the tone clusters was proposed. Errors in reproduction suggest a dual-code representation comprising temporal and figural characteristics. The temporal part of the representation is based on the clock model but specifies, in addition, the metric of the level below the clock. The beat-tone-cluster envelope concept was proposed to specify the figural part. The ability of humans to capture temporal relation- ships among events plays a crucial role in the processing of information. Characteristics of this process have been studied in the perception of temporal sequences, se- quences of tones in which tone onset intervals are varied. Twostructures have been proposed for the representation of temporal sequences: time categories (Fraisse, 1946, 1956) and higher order time intervals (Jones, 1976; Lee, 1985; Longuet-Higgins & Lee, 1982, 1984; Martin, 1972; Povel, 1981; Povel & Essens, 1985). Support for these structures is found in experimental evidence that certain temporal relationships can be reproduced more accurately than others. They provide a structural basis for schemes that guide attentional processes to critical information in the world (Jones & Vee, 1993). For instance, pitch recog- nition is better for tones that mark the higher order time intervals (Monahan, Kendall, & Carterette, 1987). Fraisse (1946, 1956) found that time intervals that had a 2:1 relationship were more accurately reproduced than others. Fraisse concluded that a representational struc- ture exists that has two categories, long and short, related as 2:1, onto which time intervals are mapped. Povel (1981) found empirical evidence for higher order time struc- tures. He found that sequences with interval relations of 3: I and 4: 1were represented adequately if these intervals were embedded in a higher order structure that fit the se- The author gratefully acknowledges Carol A. McCann for extensive comments and discussion; Jeroen G. W. Raaijmakers, John A. Mi- chon, Stephen Handel, Caroline Monahan, Lester Krueger, and Dirk- Jan Povel for reviewing a draft of this manuscript; Tom Vijlbrief and Evert Agterhuis for software and hardware support. Requests for reprints should be sent to P. Essens, TNO Human Factors Research In- stitute, P.O. Box 23, 3769 ZG Soesterberg, The Netherlands (e-mail: [email protected]). -Accepted by previous editor, Charles W Eriksen quence. This higher order structure can be represented as a time scale consisting of recurrent time units that en- compass the (shorter) intervals in the sequence. Povel called this hierarchical structure a beat-based structure, with the beats marking the onset points of the consecu- tive time units of the time scale. Essens and Povel (1985) compared the accuracy of reproduction of sequences that were embedded in a hierarchical structure with the same sequence presented alone. The former were repro- duced better than the latter, with the exception of cases in which there was a 2:1 relationship in the intervals in the sequence. In those cases, reproductions were equal in quality. This suggests that a 2: 1 representation is a basic scheme that is adopted if no higher order structure can be found. Indeed, the sequences that Fraisse used did not allow for hierarchical structuring. Povel and Essens (1985) proposed two models that ad- dress different aspects of the coding of a temporal se- quence. According to Povel and Essens, the coding of a sequence consists, first, of the selection of a higher order time scale as a metric to segment the sequence into equal time units, and subsequently, of the specification of the intervals in the sequence in terms of subdivisions of the higher order time units. The first stage is addressed by the clock model, which is a further, algorithmic, devel- opment of the beat-based concept. The clock model pre- dicts which of many possible time scales (clocks) is the best for structuring a particular sequence and specifies how good the scale is. Sequences differ in how good their best time scale is. The better a sequence can be metrically structured, the better it will be represented and reproduced. For the second stage in the coding of temporal sequences, Povel and Essens formulated the subdivision model.' The model distinguishes different kinds of subdivisions (equal and unequal) and asserts that unequal subdivisions are more complex to code than equal ones. Both the metrical structure and type of sub- 519 Copyright 1995 Psychonomic Society, Inc.
Transcript
Perception & Psychophysics1995,57 (4),519-532
Structuring temporal sequences: Comparison ofmodels and factors of complexity
PETER ESSENSTNO Human Factors Research Institute, Soesterberg, The Netherlands
Two stages for structuring tone sequences have been distinguished by Povel and Essens (1985),Inthe first, a mental clock segments a sequence into equal time units (clock model); in the second, intervals are specified in terms of subdivisions of these units. The present findings support the clockmodel in that it predicts human performance better than three other algorithmic models. Two further experiments in which clock and subdivision characteristics were varied did not support the hypothesized effect of the nature of the subdivisions on complexity. Amodel focusing on the variationsin the beat-anchored envelopes of the tone clusters was proposed. Errors in reproduction suggest adual-code representation comprising temporal and figural characteristics. The temporal part of therepresentation is based on the clock model but specifies, in addition, the metric of the level belowthe clock. The beat-tone-cluster envelope concept was proposed to specify the figural part.
The ability of humans to capture temporal relationships among events plays a crucial role in the processingof information. Characteristics of this process have beenstudied in the perception of temporal sequences, sequences of tones in which tone onset intervals are varied.Twostructures have been proposed for the representationof temporal sequences: time categories (Fraisse, 1946,1956) and higher order time intervals (Jones, 1976; Lee,1985; Longuet-Higgins & Lee, 1982, 1984; Martin, 1972;Povel, 1981; Povel & Essens, 1985). Support for thesestructures is found in experimental evidence that certaintemporal relationships can be reproduced more accuratelythan others. They provide a structural basis for schemesthat guide attentional processes to critical information inthe world (Jones & Vee, 1993). For instance, pitch recognition is better for tones that mark the higher order timeintervals (Monahan, Kendall, & Carterette, 1987).
Fraisse (1946, 1956) found that time intervals that hada 2:1 relationship were more accurately reproduced thanothers. Fraisse concluded that a representational structure exists that has two categories, long and short, relatedas 2:1,onto which time intervals are mapped. Povel(1981)found empirical evidence for higher order time structures. He found that sequences with interval relations of3: I and 4:1were represented adequately if these intervalswere embedded in a higher order structure that fit the se-
The author gratefully acknowledges Carol A. McCann for extensivecomments and discussion; Jeroen G. W. Raaijmakers, John A. Michon, Stephen Handel, Caroline Monahan, Lester Krueger, and DirkJan Povel for reviewing a draft of this manuscript; Tom Vijlbrief andEvert Agterhuis for software and hardware support. Requests forreprints should be sent to P. Essens, TNO Human Factors Research Institute, P.O. Box 23, 3769 ZG Soesterberg, The Netherlands (e-mail:[email protected]).
-Accepted by previous editor, Charles W Eriksen
quence. This higher order structure can be representedas a time scale consisting ofrecurrent time units that encompass the (shorter) intervals in the sequence. Povelcalled this hierarchical structure a beat-based structure,with the beats marking the onset points of the consecutive time units of the time scale. Essens and Povel (1985)compared the accuracy of reproduction of sequencesthat were embedded in a hierarchical structure with thesame sequence presented alone. The former were reproduced better than the latter, with the exception of casesin which there was a 2:1 relationship in the intervals inthe sequence. In those cases, reproductions were equal inquality. This suggests that a 2:1 representation is a basicscheme that is adopted if no higher order structure canbe found. Indeed, the sequences that Fraisse used did notallow for hierarchical structuring.
Povel and Essens (1985) proposed two models that address different aspects of the coding of a temporal sequence. According to Povel and Essens, the coding of asequence consists, first, ofthe selection ofa higher ordertime scale as a metric to segment the sequence into equaltime units, and subsequently, of the specification of theintervals in the sequence in terms of subdivisions of thehigher order time units. The first stage is addressed bythe clock model, which is a further, algorithmic, development of the beat-based concept. The clock model predicts which of many possible time scales (clocks) is thebest for structuring a particular sequence and specifieshow good the scale is. Sequences differ in how goodtheir best time scale is. The better a sequence can bemetrically structured, the better it will be representedand reproduced. For the second stage in the coding oftemporal sequences, Povel and Essens formulated thesubdivision model.' The model distinguishes differentkinds of subdivisions (equal and unequal) and assertsthat unequal subdivisions are more complex to code thanequal ones. Both the metrical structure and type of sub-
519 Copyright 1995 Psychonomic Society, Inc.
520 ESSENS
division are assumed to contribute to the complexity ofa sequence.
The two-stage approach that bases the organization ofa temporal sequence on a higher level time unit differsfrom proposals in which the smallest interval in the sequence is used to build a hierarchy (Longuet-Higgins &Lee, 1984; Martin, 1972). However, Essens and Povel(1985) found no support for the hypothesis that thesmallest interval is used as a basis for structuring the sequence. Longuet-Higgins and Lee (1982) and Lee(1985) developed process models that address how people build a hierarchical structure while processing a sequence. They proposed that the first long interval in thesequence is used as a tentative higher order interval onwhich a metrical structure can be based. The stress onusing information from the beginning of the sequenceresults in metrical predictions that differ from those ofthe clock model. The algorithmic nature of these models (Essens & Povel, 1985; Lee, 1985; Longuet-Higgins& Lee, 1982, 1984) allowed for a precise assessmentand comparison of the models, which is described in thefirst part of this paper (Experiment 1). The second partfocuses on the relationship between the clock selectionand subdivision and the extent to which these factors account for the complexity of the sequence. The degree towhich these two factors contribute to the complexity ofa sequence is assessed in Experiments 2 and 3.
PART 1Comparison ofModels
The Clock Model ofPovel and Essens (1985)The model assumes that listeners use a mental clock
as a time scale to structure a sequence that is presentedto them. For example, consider the following sequencewith tone onset intervals of 200, 400, 400, 200, 200,400, and 600 msec (in units of 1:1221123), which is represented on a time axis in Table 1. Vertical lines indicatetone onsets. The duration ofthe tone is not relevant here,and is set to 50 msec in the following experiments. Thedistance between two lines represents visually the size ofan interval between two tone onsets. The dots help oneto see the relative time (a dot marks how the smaller interval fits in the larger). At least in theory, many different matching time scales (clocks) can be conceived,varying in unit size and in their synchronization with thesequence. Each clock groups the intervals in the sequence differently, resulting in different representationsofthe sequence. However, the only viable clocks are thosethat are divisors of the sequence. The sample sequence,having a length of 12, thus has no clock ofunit 5. The listof clocks given in Table 1 might suggest that listenersdevelop an unlimited number of higher order representations for this sequence. However, if one plays out sequences like this one in a cyclical way, considerableagreement can be found across listeners on the preferredstructure (sometimes called the "natural" interpretation). The clock model addresses the factors that deter-
Table 1Potential Time Scales (Clocks a-i) for Sequence 1221123
With Calculated Counterevidence
Sequence
> > > > > Clock Counterevidence
Clock I I I I I I I • I Size Oev -ev C*
a i.i.i.i.i.i. 2 2 4 18b .i.i.i.i.i.i 2 I 4c i . . i . . i . . i . 3 2 2d . i . . i . . i . . i . 3 2 8e . i . . i . . l . . i 3 3 12f i . i. . i . 4 2 9g i. i. . i. 4 0h i . . i . . i . 4 2 9etc.
Note-I = tone onset that marks interval; smallest interval is200 msec; dots indicate relative time; > marks tone perceived as accented; I = first tone next cycle; i = beat. *C-score = Oev + (4 *-ev).
mine the selection of the clock and predicts which clockis preferred.
Two factors are critical in selecting the preferred("best") clock to structure the sequence: the perceptionof accented tones in the sequence, and the quality ofmatch between a potential clock and the sequence ofaccents perceived in the sequence. Accented tones arethose that are perceived by human listeners as moresalient than others. This is certainly the case for tonesthat deviate in loudness, length, or pitch. In addition, ithas been found that even in sequences ofidentical tones,differences in salience are perceived between the tones,depending on the relative size of the time intervals between them. This led to the following accent rule: Tonesthat are preceded or followed by relatively long toneonset time intervals are perceived as more salient thanothers, except for the first of a cluster of two tones. Intwo-tone clusters, the second tone is perceived as moreaccented than the first (Povel & Okkerman, 1981). In thesample sequence in Table 1, only the first two tones ofthe (cyclically presented) sequence form a two-tonecluster, because the two are separated from the othertones by a longer interval. The third tone is single; thefourth, fifth, and sixth tones form a three-tone cluster;the seventh is single. According to the accent rule, thesecond, third, fourth, sixth, and seventh tones will beperceived as accented (indicated by">").
The clock model proposes that the clock selected tostructure the sequence will be the one that matches thesequence of accents best. A perfectly matching clock isa clock with all clock ticks (beats) coinciding with accented tones. Mismatch ofbeats and accents is expressedas counterevidence against a clock. Two cases ofcounterevidence are distinguished: one where a beat coincideswith a tone that is not accented (termed Oevfor zero evidence); and one where a beat does not coincide with atone at all (termed - ev for negative evidence). The totalamount of counterevidence (C) against a given clock isexpressed as a C-score, and is calculated as the sum of
the number of instances of Oev and -ev, the latter multiplied by a weighting factor (W). The weighting factoradjusts for the relationship between Oev and -ev, sincethe latter is considered to give stronger counterevidencethan the former (W is set to 4 in this paper)." The algorithm computes the counterevidence for all clocks of thesequence and selects the clock with the lowest C-scoreas the "best clock." The clock with the lowest C-scorewill have the highest probability of being selected forstructuring the sequence.
In Table I, a number of theoretically possible clocksare shown for the sequence 1221123. Clock a with sizetwo has two clock beats (Beats 1, 4) that coincide withunaccented tones (Tones I, 5) and four that have nomatching tones, which results in two Oev's and four-ev's, respectively. The C-score [Oev + (4 * -ev)]equals 2 + (4 * 4) = 18.
An issue for the model is to decide on the upperboundary of the clock unit that should be considered.The largest clock unit size for a sequence is the oneequal to the length of the sequence itself. Such a clockmay have little counterevidence, but it does not seem tobe efficient in grouping the intervals of the sequence.The same can be said for clocks that have a unit lengthhalf that of the sequence (here, length 6). Although thereis as yet no firm theoretical basis for setting the limit,Povel and Essens (1985) assumed that only clocks thatwere less than halfthe length of the sequence were efficient in organizing the sequence. The C-scores can beused to organize sequences into categories on the basisof the amount of counterevidence associated with thebest clock for each sequence. For some sequences, thealgorithm might find clocks with equal C-scores. Theseclocks have an equal chance of being selected as theclock for structuring the sequence.
Sequences that cannot be subdivided into equal timeunits (e.g., a sequence oflength 13) have no valid clocksand have to be structured in other ways. These sequenceswere termed nonmetrical. Sequences for which validclocks can be defined are called metrical. The clock unitis referred to as the metrical unit. Notice that the clockmodel does not specify the metric of the intervalssmaller than the clock unit. The temporal structure ofthese is specified by the subdivision model.
If we assume that a listener will try to find a mentalclock to structure a sequence and will adopt the one withthe least counterevidence (the "best clock"), two predictions can be tested: (1) a sequence will be reproducedmore accurately if it can be perceived against a mentalclock; (2) a sequence having a best clock with a C-scorethat is lower than that of another sequence will be reproduced more accurately. The first prediction wastested by Essens and Povel (1985). They found that inaccuracy of reproduction was greater in nonmetrical sequences than when the same sequences were embeddedin larger metrical sequences. Povel and Essens testedthe second prediction. They compared the accuracy ofreproduction of sequences which differed in the C-score
STRUCTURING TEMPORAL SEQUENCES 521
of their best clock. The results supported the predictionthat the C-score is indicative of how well a sequence isstructured. These experiments demonstrate that the mental clock concept is a valid and powerful concept.
The Models ofLonguet-Higginsand Lee (1982,1984)
Longuet-Higgins and Lee (1982) described a modelthat predicts which higher order temporal structure willbe established by the listener. The model assumes that inthe process oflistening, the listener develops hypothesesabout the structure ofthe sequence. The model is a process model, in the sense that it operates from left to rightthrough a sequence. A major assumption is that tonesthat start relatively long intervals initiate major metricalunits.> Another assumption is that metrical units arecombined going up the metrical hierarchy. Lee (1985)refined the model of Longuet-Higgins and Lee (1982)concerning the building of the hierarchy ofmetrical levels. We will discuss the effect of initial long intervals inmore detail when addressing Lee (1985).
Longuet-Higgins and Lee (1984) presented anothermodel of the metrical interpretation of sequences thatassumes that listeners tend to avoid an interpretation thatresults in syncopations. Only "natural interpretations"that is, those in which the beats coincide with toneswill be selected. In contrast to the earlier process model,this model considers all intervals in a sequence in defining the metrical units. The algorithm looks first for theshortest interval; this defines the smallest metrical unit.The second step is to consider the distances (higherorder intervals) between the tones that are the onsets ofintervals longer than the established metrical unit. Ifthese higher order intervals are multiples of an alreadyestablished metrical unit, the value of the new, higherorder, metrical unit is set to the lowest common divisorof the higher order intervals, or, if there is only one kindofhigher order interval, to the size of the higher order interval itself. Consider the sequence with relative intervalsizes 4,1,1,4,1,1,2,1,2,1,3,3 (from their paper). Thespacing of the onsets of the longer intervals (longerthan 1) is 663333 (4,1,1; 4,1,1; 2,1; 2,1; 3; 3). The common divisor is 3, so the size of the metrical unit is 3.There are two intervals longer than 3 with their tone onsets spaced by 6. This is sufficient to establish a metrical unit of size 6. The metrical analysis of the sequenceresults in a two-level hierarchy of metrical intervals ofsizes 3 and 6, respectively.
The model is limited because it can only find metrical units (greater than one) for sequences that have a regular spacing of the long intervals. What is the predictivecapability of the Longuet-Higgins and Lee (1984)model? An implementation of the model as a computeralgorithm was used to assess its capabilities quantitatively. The approach used in our research involved thegeneration of large sets of sequences consisting of noncyclical permutations of intervals with unit lengths 4, 3,2, or 1 with total lengths of 12 and 16. These sets, spec-
522 ESSENS
Table 2Number of Valid Interpretations Relative to theTotal Number of Sequences (in Percent) With
Lengths 12 (Set12) and 16 (Setl6)
The Model of Lee (1985)Lee (1985) questioned the strict requirement of the
Longuet-Higgins and Lee (1984) model that the interpretation avoid syncopations. He argued that during theprocess of listening, the information in the beginning ofthe sequence could lead to an interpretation that forceda syncopation later in the sequence. Lee formulated an
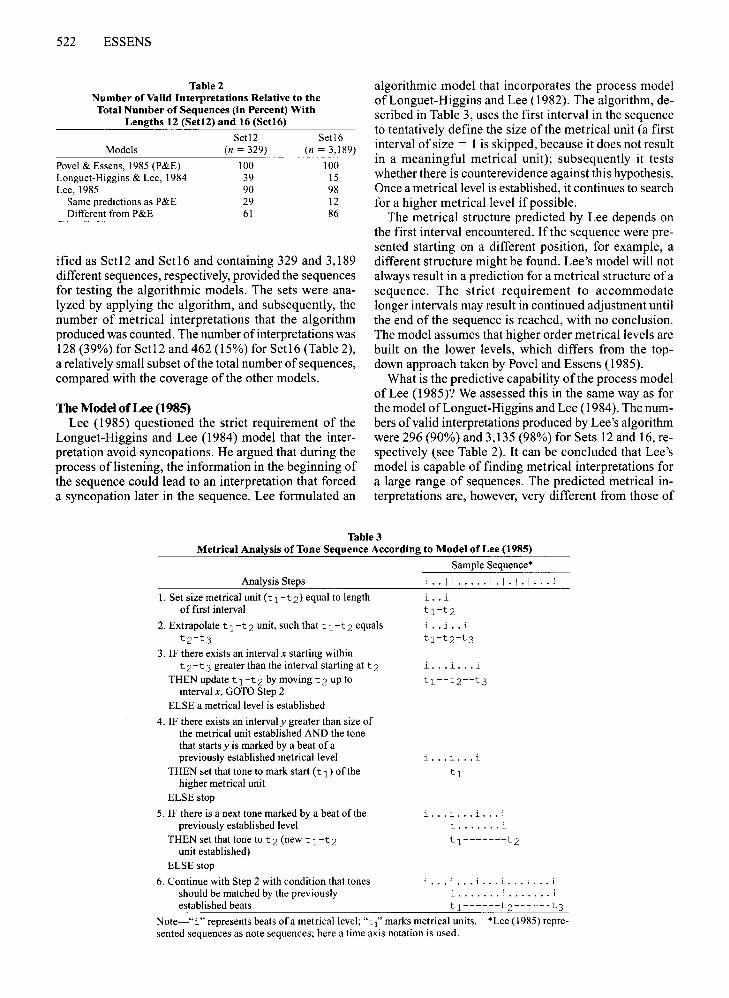
ified as Set12 and Set16 and containing 329 and 3,189different sequences, respectively, provided the sequencesfor testing the algorithmic models. The sets were analyzed by applying the algorithm, and subsequently, thenumber of metrical interpretations that the algorithmproduced was counted. The number of interpretations was128 (39%) for Set12 and 462 (15%) for Set16 (Table 2),a relatively small subset ofthe total number of sequences,compared with the coverage of the other models.
algorithmic model that incorporates the process modelof Longuet-Higgins and Lee (1982). The algorithm, described in Table 3, uses the first interval in the sequenceto tentatively define the size of the metrical unit (a firstinterval of size = 1 is skipped, because it does not resultin a meaningful metrical unit); subsequently it testswhether there is counterevidence against this hypothesis.Once a metrical level is established, it continues to searchfor a higher metrical level ifpossible.
The metrical structure predicted by Lee depends onthe first interval encountered. If the sequence were presented starting on a different position, for example, adifferent structure might be found. Lee's model will notalways result in a prediction for a metrical structure ofasequence. The strict requirement to accommodatelonger intervals may result in continued adjustment untilthe end of the sequence is reached, with no conclusion.The model assumes that higher order metrical levels arebuilt on the lower levels, which differs from the topdown approach taken by Povel and Essens (1985).
What is the predictive capability of the process modelof Lee (1985)? We assessed this in the same way as forthe model ofLonguet-Higgins and Lee (1984). The numbers of valid interpretations produced by Lee's algorithmwere 296 (90%) and 3,135 (98%) for Sets 12 and 16, respectively (see Table 2). It can be concluded that Lee'smodel is capable of finding metrical interpretations fora large range of sequences. The predicted metrical interpretations are, however, very different from those of
Table 3Metrical Analysis of Tone Sequence According to Model of Lee (1985)
Sample Sequence"
Analysis Steps I . . I I ..... I . I . I . I ... !
1. Set size metrical unit (t 1 - t 2) equal to length i .. ioffirst interval t 1-t 2
2. Extrapolate t 1-t 2 unit, such that t 1-t 2 equals i .. i .. it2-t3 tl-t2-t3
3. IF there exists an interval x starting withint 2-t 3 greater than the interval starting at t 2 i ... i ... i
THEN update t 1-t2 by moving t2 up to tl --tr-t3interval x, GOTO Step 2
ELSE a metrical level is established
4. IF there exists an interval y greater than size ofthe metrical unit established AND the tonethat starts y is marked by a beat of apreviously established metrical level i ... i ... i
THEN set that tone to mark start (t 1) of the t 1higher metrical unit
ELSE stop
5. IF there is a next tone marked by a beat of the i ... i i ipreviously established level i i
THEN set that tone to t2 (new tl-t2 tl-------t2unit established)
ELSE stop
6. Continue with Step 2 with condition that tones i ... i i i i ishould be matched by the previously i i iestablished beats tl------t2------t3
Note-"i" represents beats ofa metrical level; "tj" marks metrical units. *Lee (1985) represented sequences as note sequences; here a time axis notation is used.
STRUCTURING TEMPORAL SEQUENCES 523
Table 4Differences Between the Models of Povel and Essens (1985) and Lee (1985)
Pavel and Essens (1985)
Information in the whole sequenceis used to determine interpretation.Prominent tones are preferred onsets ofclock units; prominent tones (accents)are tones followed by a long interval orthose preceded by a long interval(except for two-tone groups).Counterevidence from the wholesequence gives indication of adequacyof a metrical hypothesis.A metrical hypothesis that best matchesthe accents is most likely to be selectedto interpret the sequence.
Only one strict condition: unit size is adivisor of the sequence length.
Povel and Essens (1985). In a comparison of the twomodels, the numbers of equal predictions were counted.A prediction was scored as being the same if the bestclock from Povel and Essens was equal to (one of) themetrical unites) predicted by Lee. Of Setl2, 95 of the296 solutions found by Lee's model were the same as forPovel and Essens's model. Comparisons in Set16 resulted in only 395 out of3,135 (13%) predictions beingthe same. The large discrepancy can be understood ifwe look at the units of the metrical structures predictedby Lee. Almost half of the 2,740 predictions in Set16that differed from Povel and Essens (1985) are inappropriate in terms of the Povel and Essens model becausethe predicted unit size is 3, 5, 6, or 7, none of which divides the sequence evenly. To summarize the comparison between Povel and Essens (1985) and Lee (1985),the distinctive features of the two models are presentedin Table 4.
EXPERIMENT 1
The goal of Experiment 1 was to determine which ofthe two models is better at predicting the metrical structure used by listeners for structuring a temporal sequence. The fact that there are tone sequences in whichthe models predict different metrical structures (otherthan the nondivisor ones) makes it possible to test the adequacy of the two models. There is, however, no directway to assess this. One method is to ask subjects to tapalong with the sequence, the assumption being that thetapping reflects the metrical unit selected. A problemwith this method is that subjects sometimes seem to losethe link between their tapping and the sequence, in particular for complex sequences. An alternative approach,also used by Povel and Essens (1985), is to add a lowpitch sequence of equal intervals (isochronic) to the testsequence, which induces a metrical structure. The induction effect can be so strong that the same test sequence combined with two different isochronic se-
Lee (1985)
Information early in the sequencedetermines interpretation.Tones followed by a long interval arepotential onsets of a metrical unit.
Positive evidence from the first longinterval determines the initialmetrical hypothesis.A metrical hypothesis is establishedonce there is no counterevidence inthe second of the consecutivemetrical units.There are several strict conditions;therefore, a metrical hypothesiscannot always be found.
quences is heard as two different test sequences. Thismethod was used here to compare the quality of the different metrical structures predicted by the two models.Sequences were selected from Set12, for which the twomodels predict a different metrical structure. Most ofthese were sequences for which Pavel and Essens'smodel predicts a 4-clock as best clock, whereas Lee'smodel predicts a 3-clock. According to the clock model,the 3-clock is less adequate for the sequence, because ithas a higher C-score than the 4-clock has. Only few sequences were found for which Lee's model predicted a4-clock and Pavel and Essens's a 3-clock.
MethodSubjects. Twelve subjects, members of the TNO Human Fac
tors Research Institute, participated in the experiment. Five weremusically trained, having played an instrument for at least 5 years.
Stimuli. From Setl2, 10 sequences were used for which theclock model predicted a different metrical structure than the Leemodel. The sequences were selected on the basis of having lowC-scores. The sequences were combined with an isochronic sequence to induce the predicted metric. This resulted in two sets ofstimuli: In the P&E condition, the metric predicted by the clockmodel of Povel and Essens (1985); in the Lee condition, the metric predicted by the model of Lee (1985). The test sequences arepresented in Table 5 together with the way the predicted clock coincides with the tone sequence. In Table 5, Test Sequence I hadtone onset intervals of 200, 200, 400, 200, 400, 200, 200, and600 msec (in units of I: 11212113). The C-score indicates the quality of the predicted clock according to the clock model. The stimuli were presented to the subjects as sequences consisting of tonesof 50-msec 830-Hz square waves, with 3-msec rise and fall timesin combination with a low-pitch (l25-Hz, square waves)isochronic tone sequence that corresponded to the clock predictedby the model being tested. The beats of the isochronic sequence always coincided with tones in the sequence. Thus, there was nevera low-pitch tone in an empty interval. The stimuli were presentedcyclically, starting with the first beat-tone combination.
Procedure. The experiment was performed in two parts: first,one model condition, and after a short pause, the other condition.Order of conditions was balanced. Order of presentation of thestimuli within each condition was randomized. The task of thesubject was to reproduce the presented test sequence as precisely
524 ESSENS
TableSThe Ten Sequences Used in Experiment 1 Combined
With the Predicted Mental Clock
Condition P&E Condition Lee
No. Test Sequence Stimulus ct Stimulus ct
11212113 I I I . I I . I I I .. ! I I I . I I . I I I .. !.i ... i ... i.. * .. i..i..i..i * 5
2
3
4
5
6
7
8
9
10
11212122
1121214
1212114
2121222
1121313
1213113
121314
111112122
11121222
I II . I I . I I . I . I
i ... i ... i .II I. I I. II !i ... i ... i .I I.II.III !i ... i ... i .I. II. 11.1. I.!· . i ... i ... i.I I I. II .. II .. !· i ... i ... i ..I I. II .. III .. I
i ... i ... i .II. II .. II !i. .. i. .. i. ..1I1111.11.1.!i ... i ... i ...II II . I I . I . I . !· . i ... i ... i.
2
II I. II. II. I.!· . i .. i .. i .. iI I I . I I . II ... !· . i .. i .. i .. i11.11.[ II ... !· i .. i .. i .. .i .1.11.11.1. I.!i .. i .. i .. i ..III.II .. II .. !· . i .. i .. i .. i11.11 .. 11 [ .. !· i .. i .. i .. i.II.II .. II ... !· i .. i .. i .. i.II 1111. I I. I.!.. i .. i .. i .. iII II . I I . I . I . !i..i..i..i..
4
4
5
4
5
4
5
5
4
Note-P&E, Povel and Essens (1985); Lee, Lee (1985). Smallest tone onset intervalis 200 msec. *For al110 sequences: the predicted mental clock in the P&E and Leeconditions. tC-score.
as possible. The subjects listened to each stimulus and practicedtapping in synchrony with it as long as they wished. The subjectstopped stimulus presentation by pushing a button, and then reproduced four cycles of the sequence on a response plate. Each tapproduced the same tone as that used in the sequence. If the subjectmade a serious tapping error, resulting in a standard deviation thatexceeded 15% of the mean ofthe tapped intervals, the subject wasasked to produce that sequence again, repeating the procedure oflistening and practicing the stimulus involved. Before the experiment started, the procedures were practiced with three trainingstimuli. Stimulus generation and response registration were controlled by an Apple Macintosh Plus computer. Tones were produced by sound generators. The low-pitch tones were controlledby a synchronized timer circuit that was triggered by a pulse fromthe computer.
differed from each other significantly [F(9,99) = 4.1,P < .01]. This effect was particularly marked in the P&Econdition. There was, however, no interaction betweenconditions and sequences [F(9,99) = 1.8,p> .05].
DiscussionThe analysis of the predictive capabilities of the three
models examined indicates that the model of LonguetHiggins and Lee (1984) fails to give a metrical interpretation for many temporal sequences. The model of Lee
Figure 1. Accuracy of reproduction as a function of metrical structure predicted by the two models, Lee (Lee, 1985) and P&E (Povel &Essens, 1985). Lines connect the mean deviations that are in the samecondition.
ResultsAccuracy ofreproduction was expressed by the mean
of the deviations between the intervals in the presentedsequence and the reproduced sequence. The deviationscore was calculated in the following way. First, for eachsequence, the lengths of each of the corresponding intervals in the four cycles of the reproductions were averaged. For each interval of the sequence, the absolutedifference between the actual length and the average reproduced length was calculated as a percentage of theactual length. Finally, these percentages were averagedover intervals. Examination of performance of the individuals did not yield differences related to musical training. The mean deviations (in percent) from Experiment 1 are presented in Figure 1, averaged over subjectsfor the 10 sequences in the two model conditions. Performance in the P&E condition is better overall than inthe Lee condition [F(l,ll) = 7.6,p < .05]. Sequences
(1985), which is a refinement of the model of LonguetHiggins and Lee (1982), fares better in this regard andcan generate predictions for almost all sequences of thesets used in the analysis. The experimental comparisonof predictions by Lee (1985) and Povel and Essens(1985) showed that temporal sequences structured according to the clock model of Povel and Essens are reproduced more accurately than those structured according to Lee's model. From this it can be concluded that theclock model is superior to the model of Lee in predicting the representation for temporal sequences.
Recently, Lee (1991) proposed extensions to his 1985model. In the 1985 model, the metrical interpretation isbuilt up by combining smaller units into larger units. Inthe 1991 model, higher order metrical units can be subdivided again into smaller units, thus arriving at a complete metrical description ofall intervals in the sequence.This is particularly efficient for the metrical representation of tone sequences that start with relatively largefirst tone onset intervals. A further extension is the calculation and accumulation ofcounterevidence in a scoresimilar to the counterevidence score used by Povel andEssens (1985). The revised model does not result in different predictions for the sequences used in ourexperiments.
The conclusion that the model of Povel and Essens(1985) more accurately predicts the representation fortemporal sequences does not discount the idea that earlyinformation could influence the process. The experiment was not designed to explore this possibility; itcompared the quality of different interpretations imposed on the sequence. Information gathered during theearly processing of the sequence can trigger certain hypothetical structures that are subsequently tested by thelistener for their adequacy. Moreover, information onstructures from former sequences can be carried over. Itwas observed in some instances that subjects start offwith some clock and try to apply it to the sequence presented. Sometimes the adopted clock is fixed so stronglythat it is difficult for the subject to switch to a differentclock. This is particularly true in respect of clock size.In a pilot experiment in which subjects tapped a beatalong with the sequence, a test of switching beat tappingfrom a 3- to a 4-c1ock and vice versa revealed that it tookon the average four cyclical presentations of the sequence before subjects changed and correctly synchronized the beat tapping again. From these observations,we conclude that humans do not easily change the timeunit used for structuring sequences. We do not expectthat one interval early in the sequence has a large effecton the likelihood of establishing a new clock.
PART 2Factors ofComplexity
In the two-stage approach to the coding of temporalsequences, it is implicitly assumed that clock and subdivision characteristics contribute independently to thecoding complexity ofthe sequence. The clock factor refers
STRUCTURING TEMPORAL SEQUENCES 525
to the quality of the match of the clock with the sequence, expressed in the C-score. Sequences that havelow C-scores are less complex to represent and will bereproduced better than sequences with higher C-scores.Complexity of subdivision derives from the way inwhich the higher order interval is subdivided. Subdivisions of a clock unit are of three kinds: subdivision intoequal parts; unequal subdivision; or empty, meaning thatthere are no intervals in that clock unit. The examplesgiven in Table 6 illustrate the different subdivision types.The question that we address here is whether unequalsubdivisions create extra complexity in the representation of temporal sequences.
Povel and Essens (1985) have argued that unequalsubdivisions are more complex because they have to bedescribed by their proportional interval relations, resulting in a less efficient code than that for equal subdivisions, which can be described as a repetition ofequal intervals. The fewer symbols that are needed in order todescribe the contents ofthe subdivisions in the sequence,the less complex that sequence is, and the better it can bementally represented. The examples in Table 6 differ insubdivision complexity: the first example has only oneunequal subdivision (subdivision 211), whereas the second has three unequal subdivisions. The conclusioncould be that the first sequence ought to be better represented and easier to reproduce than the second. However, there is another factor. As discussed in the first partof this paper, the quality of the match between the bestclock and the accents in a sequence (expressed in the Cscore) is also a complexity factor. To test the subdivisionhypothesis, both factors-subdivision and clock-haveto be separated and varied independently.
Using a two-alternative forced choice paradigm,Povel andEssens (1985) asked subjects to compare stimulus pairs on their complexity (a pair consisted of a testsequence combined with an isochronic sequence inducing either a 4-c1ock or a 3-c1ock). The results of this experiment with 12 stimuli supported the complexity predictions of the subdivision model. Recent reanalysis ofthe experiment, however, revealed a problem of confounding variables. Not only was the number of symbolsdifferent between stimuli (as intended), but the match ofthe clock also differed and, consequently, so did the degree of counterevidence, as defined by the clock model.The data from the complexity judgment experiment ofPovel and Essens are summarized in three categories inTable 7: subjects favoring a 3-c1ock stimulus ("3") as the
Table 6Types of Subdivision and C-Scores of Two Sample Sequences
as a Function of Segmentation by Their Best Clock
Example Subdivision Ct
I I I II. I II ... I
i. .. i. .. i. .. * (1111) (211) (Empty) 02 I .. I I I I. I I .. !
i ... i. .. i. .. * (31) (112) (13) 2
Note-s-Empty = no subdivision; (I III) = equally subdivided in four;211,31, etc. = unequally subdivided. *Predicted 4-clock. tC-score.
526 ESSENS
Table 7Observed and Predicted Preferred Metrical Structures
Based on a 4-Clock or a 3-Clock (Data AdaptedFrom Povel & Essens, 1985)
Subjects Subdivision Model Clock ModelNo. Sequence Favor Favors Favors
Note-3/4 = no clear preference for either the 3- or the 4-clock on thebasis of metrical structure. *Predictions that deviate from subjects'judgment.
simpler; favoring a 4-clock stimulus ("4"); and mixedresult ("3/4"). The predicted preferences based on thesubdivision model and the clock model (see Table 7) indicate that either model can predict the data equally well.From this analysis it can be concluded that the test's results were not conclusively in support of the subdivisionmodel.
We assessed the contribution of each factor-clockmatch and subdivision-to the perceived complexity intemporal sequences by using three paradigms: immediateand delayed reproduction (Experiment 2), and complexity judgment (Experiment 3). In immediate reproduction, the subject had to reproduce the sequence immediately after listening. Then, following a time intervalduring which an interference task was executed to inhibit mental rehearsal, a second reproduction was carried out by the subject. This was termed delayed reproduction. It was anticipated that sequences that weredesignated as being more complex to represent, either
because ofsubdivision or clock match complexity, wouldresult in higher deviations and errors. In the complexityjudgment experiment, the subject judged how simple orcomplex a stimulus was on a scale.
EXPERIMENT 2
MethodSubjects. Six subjects---4 university students and 2 members of
the TNO Human Factors Research Institute-participated in theexperiment. Two of the subjects had been trained in playing an instrument for at least 5 years.
Stimuli. From a set of tone sequences of length 16, Set 16, subsets were created with sequences differing in C-score (C = 1,3)and numbers of complex subdivisions (4, 3, or 2). This resulted insix sets corresponding to three levels of the complex subdivisioncondition crossed with two levels of the C-score condition, as presented in Table 8. For example, tone sequence 8 structured with a4-clock has a C-score of I; one clock beat falls on a nonaccentedtone (which is the 10th tone). It has three complex subdivisionsand one simple subdivision: (112) (1111) (31) (13). Tone Sequence 24 structured with a 4-clock has a C-score of3; three clockbeats fall on a nonaccented tone (the 1st, 4th, and 10th tones).Tone Sequence 24 has two complex and two simple subdivisions:(121) (1111) (22) (13).
The stimuli were presented to the subjects as sequences consisting oftones of 50-msec 830-Hz square waves, with 3-msec riseand fall times in combination with a low-pitch (l25-Hz, squarewaves) isochronic tone sequence that corresponded to the predicted clock. The sequences were presented cyclically (with nobreaks between cycles, as the "!" in Table 8 indicates), but onlyfour times. Stimulus generation and response registration was thesame as in Experiment I.
Procedure. Subjects had to perform three tasks in a row: immediate reproduction; an interference task, which consisted of"counting-backwards-by-three"; and delayed reproduction. Beforethe experiment started, procedures were practiced with three training stimuli. In the immediate reproduction task, subjects listenedto the stimulus and practiced tapping in synchrony. The subjectstopped stimulus presentation by pushing a button and then reproduced four cycles ofthe sequence on a response plate, as preciselyas possible. Each tap produced the same tone as that used in thestimulus. If the subject made a serious tapping error in immediatereproduction resulting in a standard deviation that exceeded 15%
Table 824 Tone Sequences of Experiments 2 and 3 in the Three Levels
of the Subdivision Condition Having Two Levels ofClock Condition (C-Score)
ComplexSubdivision
Four
Three
Two
C-score
No. C = I No. C = 3
1 I. II I. III. II .. ! 13 I .. IIII.II .. II .. !2 I. I . I I I. I I II .. ! 14 1.1111.111.111 .. '3 III.III .. III .. ! 15 I .. III.III.III .. !4 III .. II. I I II .. ! 16 1.. 111.1111.11 .. '5 I.III.II.II ... ! 17 II.III.IIII.I ... !6 I.I .. II.I.II .. ! 18 I .. IIIIIII.III .. !7 11111. III. III.! 19 I.I.II.III.III .. !8 I.IIIII .. III .. ! 20 II.IIII.II.II ... !9 II I I. II . I I I ... ! 21 I I . I I I. I I I II I ... '
10 I.I.I.III.II .. ! 22 II .. II.IIIIII ... !11 I II II. I II. I. I.! 23 I. I . I I. I I I I I II .. !12 1.11001.1.1 ... ! 24 II.IIIIII.I.II .. !
i ... i ... i ... i ... * i ... i ... i ... i ...
Note-Smallest tone onset interval is 200 msec. *For all the 24 sequences, the predicted mental clock (4-clock).
of the mean of the tapped intervals, the subject was required to repeat the procedure of listening and reproducing. After successfullycompleting reproduction, subjects received a card with a numberwhich they used as start number for counting backwards by threes.After 10 counts (lasting about 20 sec), the subjects were stoppedand were required to reproduce the sequence a second time forfour consecutive cycles, as precisely as possible. The subjects wereencouraged to begin and continue tapping even if they were certain that their responses were wrong or when errors occurred during reproduction.
ResultsImmediate reproduction. Mean deviations in the
reproductions were used as a measure of the accuracy ofreproduction, as in Experiment I. Examination of theperformance of the individuals yielded no differencesrelated to musical training. The results presented in Figure 2 (top panel) are averaged over subjects for the 24
STRUCTURING TEMPORAL SEQUENCES 527
stimuli. The stimuli have been grouped by the two clockconditions (C-score) and the three complex subdivisionconditions. Systematic performance differences werefound for C-score, with performance significantly lessaccurate in C = 3 than in C = I [F(I,5) = 11.5, p <.005]. The data show no significant differences in performance on the basis of the predicted subdivision complexity. Complex subdivision and C-score interactionwas not significant. Although there were some clear outliers, overall differences between stimuli were not significant.
Delayed reproduction. The subjects considered thispart of Experiment 2 to be very difficult, demanding highconcentration. They made many errors, often switchingduring tapping to a sequence different from the one theystarted with. Most errors consisted of inserting or deleting tones in the sequence (see Table 9), which resulted
I I I I I I I I I I I I I I I I III I I I I I
C=l C=3
8
6 le
D
DD
q:) h 'b 1:t t()D D
D D
C=l
o ~., ..'(>0.......... 00>.... 6 00·····0
(1 0 0
C=3
o
3 -
D2 -
DO~·..D·..·····'O···......n~D
D
e<>
O····().·()·~·· ..·..·..··"<O<>
D 00 0 0
<>
I I I I I I I I I I I I I I I I I I I I I 1'1
113456789101112131415161718191021222324
stimulus
4 3 2 4 3number of complex subdivisions
2
Figure 2. Top panel: accuracy of reproduction in Experiment 2 (immediate reproduction). Bottom panel: complexity judgments in Experiment 3. Data as a function ofqualityof clock match (C-score; I = best match) and subdivision complexity (2 = least complex).Dotted lines connect the averages of each complex subdivision level for the two C-score conditions (Stimuli 1-12 and 13-24, respectively).
528 ESSENS
Table 9Categories of Errors Observed in Delayed Reproduction
Categories N Examples
II .. 1111. II. II •. !
111.111.11 '
II. 1111. II. II !
I.IIII.II .. II ... !
II. I11I .11. II ..• !i ... i ... i ... i ...
i ... i. .. i ... i ...
6
II
10
I3
I. One or two tones omitted or added 21 I . I I I .. I I • I I I I .. ! *(the same 4-c1ockstill fits) i ... i ... i ... i t
I I I I I .. I I . I I I ! tI II. I .. II. I. II .. !i ... i. .. i ... i ...
2. Large change in tone element structure(the same 4-clock still fits)
3. Changed tone element structure(a 4-clock does not fit or is costly;C-score>4)
4. Correct tone element structure; timing ischanged, making long intervals longer orshorter
Remainderno stable reproduction; nointerpretation possible
*Examples refer to Stimuli 4, 6, 14, and 20, respectively, consisting of a tone sequence and an isochronic sequence representing the clock. tFor all examples, the4-clock. tFor all examples, typical reproduction of the stimulus.
in high deviation scores, because timing was measuredagainst the given sequence. An error reproduction wasdefined as one that had a deviation score ofgreater than15%. The score reflects the deviation of the reproducedfrom the given sequence. Large deviation scores are aresult of changes in the representation of a sequence.Smaller deviations reflect timing errors without a changein the structure of the sequence. A breakpoint of 15%was judged to be adequate for identifying all the structural changes. The total number oferrors was 61 (out of144 observations). For the C = 1 and C = 3 conditions,the percentages of errors were 13,20, and 8, and 13,25,and 21, for four, three, and two complex subdivisions,respectively. Most of the errors were found in the C = 3condition. In a log-linear analysis (Wilkinson, 1988) ofthe distribution of errors no significant effects or interactions were found in the data.
In the debriefing session, 4 subjects referred to specific strategies for capturing the sequence. They perceived the tones in the sequence as forming clusters andtreated these clusters and the "rhythm" as separate butlinked characteristics ofthe sequence. Their strategy wasto first pick up the time structure of the sequence andthen memorize the size of the tone clusters, usually asnumbers. The two characteristics were combined duringreproduction, resulting in a positioning of the clustersagainst the rhythm. This strategy might correspond tothe distinction made by Bamberger (1978) between figural and durational coding, with figural coding beingthe coding of the sequence in terms of tone clusters, andthe durational coding, the timing in the sequence.
The reproductions were further analyzed to seewhether the strategies used by the subjects led to errorsthat were related to the figural structure of the sequence.To find the figural structure of the reproduced sequences, we filtered the tapped intervals, rounding theintervals of the reproduced sequence to the nearest valid
interval value (200, 400, 600, 800, 1,000, longer). Forinstance, the application of the rounding rule to the sequence 228, 190, 440, 570, 205, 842 results in 200, 200,400, 600, 200, 800 (or 112314). In some reproductions,erroneous tapping occurred after a correct start; in others, reproduction started incorrectly, but was later corrected, suggesting that the subject remembered the sequence while tapping. Categorization of the errors wasdone only for those erroneous reproductions in which atleast two consecutive cycles had the same type of error.Otherwise that reproduction was categorized as "Remainder." The nature of the errors suggested four categories as defined in Table 9. The first three indicatechanges in figural structure having varying consequences for the time structure; the fourth category reflects pure timing errors where the correct figural structure is maintained. Assignment to these categories wasstraightforward and was based on the comparison between given and reproduced sequence.
Categories 1 and 2 differ in the amount of similaritybetween the presented and reproduced sequences. In Category 1, the reproductions differ by only one or two tonesfrom the original. Changes result from adding or deletinga tone, or a combination ofboth. Errors in Category 2 reflect large structural changes in the sequence as reproduced. Despite the structural changes in Categories 1and2, a 4-clock still fits the sequence. In terms of clock complexity, the reproduced sequences have equal or lesscomplexity than the original sequence. In Category 3, thelarge change in element structure results in a sequencehaving no clock that fits or only a costly one (C > 4).Most of the Category 4 errors (11 out of 13) occurred inthe C = 3 condition. Here the exact tone element structure was reproduced, but the duration of the long intervals between the tone clusters was changed. Seven ofthese error reproductions had an improved C-score incomparison with that for the given sequence.
EXPERIMENT 3
In Experiment 3, clock and subdivision factors werefurther assessed by using human listeners' complexityjudgments. Both complexity against the clock (C = 1and C = 3) and the subdivision (number of complexsubdivisions: four, three, and two, in decreasing complexity) were varied.
MethodSubjects. Twenty subjects, members of the TNO Human Fac
tors Research Institute, participated in the experiment. Five hadbeen trained in playing an instrument for at least 5 years. Twosubjects who participated in both Experiments 2 and 3 did Experiment 3 first.
Stimuli. The stimuli were the same as in Experiment 2.Procedure. The task of the subjects was to judge the complex
ity of the stimulus on a 5-point scale. The simple-complex dimension was represented on the top of the answer sheet as (translated from Dutch) very simple, moderately simple, neutral,moderately complex, very complex. For each stimulus, there was ahorizontal line with five points, matching the simple-complex dimension on the top of the sheet. Subjects marked their choice foreach stimulus by crossing a point on the scale. The subjects did notreceive any instruction about what was meant by simple or complex. They practiced the task in six trials with stimuli similar to theones in the experimental sets. The order of presentation of thestimuli was randomized. The subjects listened to each stimulusand marked their judgments on the answer sheet. The subjectswere given the option to indicate on a time line with beginningmiddle-end positioned to the right of each scale whether the perceived complexity was at a specific location in the sequence.
ResultsThe distribution of frequencies for the judgment
scores on the 1-5 simple-complex scale comprised 52,126, 145, 127, and 30, respectively. The results are presented in Figure 2 (bottom panel) for the three complexsubdivision conditions in the two C-core conditions. Nosignificant effects were found for the predicted complexity differences in the complex subdivision condition. No effect was found for C-score, either. However,stimuli did differ significantly from each other [F(18,342)= 6.9, p < .001]. The three stimuli considered as mostcomplex were Nos. 13,24, and 8 (in ascending order); atthe other end of the scale, as least complex, were Sequences 15, 5, and 1 (in descending order). No higherorder interactions were significant.
In order to assess other possible factors that mightcontribute to the simple-complex dimension, the effectof stimuli was further analyzed and related to the resultsof delayed reproduction. Stimuli were ranked on theirjudgment scores and matched to the error data of Experiment 2. Sequences ranked in the upper half of thejudgment scores contained about twice as many errors asthose in the lower half. The rank-order correlation forthe judgment scores and number of reproduction errorswas positive and significant [rJ24) = .51,p < .01].
The subjects did not, in general, use the opportunityto indicate at which point in the sequence a specificcomplexity was heard. In the debriefing session, 7 subjects mentioned ease of reproduction as a criterion for
STRUCTURING TEMPORAL SEQUENCES 529
judgment. (Subjects are usually aware of the beginningpoint ofa cyclically presented sequence.) Three subjectsmentioned that sequences for which they perceived noclear beginning in the cyclical presentations were considered as complex. Sequence 11 (see Table 8) was mentioned as an example.
DiscussionTwo potential factors contributing to complexity in
the coding of temporal sequences were assessed. Onewas the degree of match between the mental clock andthe perceived accents in a sequence. The complexitypredictions of the clock model were confirmed in the reproduction task: sequences with low C-scores resulted ina more accurate representation than did those with highC-scores. In the judgment task, however, the differencesin clock match did not correspond to the differences injudged complexity. The latter results suggest that another factor is at play when subjects are asked to judgecomplexity. This will be discussed below. The secondpotential factor ofcomplexity was the nature of the subdivisions of the higher order clock units. Povel and Essens (1985) had argued that the more unequal subdivisions a sequence has, the more complex it is. However,neither the results from the reproduction nor the judgment supported the subdivision complexity hypothesis.From these findings, it can be concluded that the natureof the subdivision is not a determinant of coding complexity. The judgment results differ from the results ofPovel and Essens (1985), and this difference remains tobe explained.
The errors that people make in retaining temporal sequences give insight into the way the sequences are represented. Most of the errors were changes in the tone element structure ofthe sequence, resulting from omittingor adding tones. However, the original clock was preserved. Certain tones in the sequence seem to have beenmore critical for the representation than others-in particular, those that were connected to the beat. They areless likely candidates for errors, because omission ofsuch tones would negatively affect the overall quality ofthe clock. The addition and deletion of tones maychange the position of the accents and thus change thequality of the match of the clock, in a positive or a negative sense. For instance, if the beat coincides with the second tone of a two-tone cluster, the addition of a third toneat the end of the cluster shifts the accent away from thebeat, resulting in a poorer match. Most error reproductions had a clock match that was equal to or better thanthe original sequence. For example, it was found that inreproduction the sequence with intervals of 400, 200,200, 600, 200, 400, 200, 200, 200, 600 msec waschanged: a tone was added in the first interval, thussplitting it into 200, 200 msec. The last two tone intervals, 200 and 600, were merged into 800 msec as a resultof the deletion of the tone that separated them. The4-clock with a size of 800 msec still fit the reproducedsequence, but the match was improved because deletingthe last tone brought an accent to the beat. The error data
530 ESSENS
suggest a representation of a sequence that consists of atemporal hierarchy that defines where tones can be positioned in time. The beat forms the core of the hierarchy and anchors the tone sequence against the temporalhierarchy.
The judgment data did not show an effect of clockmatch (C-score), whereas the reproduction data did. Onepossible explanation is that C-scores may be more applicable when precise timing is involved; another is thatthe difference between the C-scores was not large enoughto affect the complexity judgments. Apparently the judgments tapped other information from the sequence thanthe match of clock and perceived accents. It is knownthat judgments of complexity are multidimensional innature (Gabrielsson, 1973). The data were further analyzed to identify systematic factors that could accountfor the differences in complexity judgments. In particular, we looked at regularities in the sequence. The judgments were ranked and the sequences at the two ends ofthe ranked data were compared. The difference betweenthose sequences suggests that certain recurring relationships between beat and tone cluster may have been usedby the subjects as a basis for judging whether a sequencewas simple or complex. For instance, in the sequencethat was judged as the simplest (Sequence I; see Table 8),all tone clusters (tone groups consisting of two or moretones) had their first tone on the beat. In contrast, in sequences that were judged as complex (e.g., Sequence 24),there were various relationships between the tone clusters and beat.
The beat gives stress to the tone with which it coincides and thus marks upbeat and downbeat tones in thetone cluster. Ifwe characterize a tone-cluster-beat relationship as a signal envelope, with the beat as the signaland the tone cluster coinciding with the beat forming theenvelope of that beat, three patterns can be defined:(1) one or more tones preceding the beat-a "rise pattern"; (2) one or more tones following the beat-a "fallpattern"; and (3) one tone or a tone cluster marked by thebeat(s)-a "step pattern." A signal envelope can consistofa single one of these patterns or a combination. Largetone clusters form envelopes that can consist of two ormore beats. With more than two beats involved, the inside beat(s) is (are) considered to have no outstandingpattern and the beats at the beginning and end are treatedas separate envelopes that can differ in pattern.
Variations in tone-cluster-beat relationship within atone sequence have the effect of violating the envelopeexpectations built up by the subject during the processing of the sequence and may be perceived as increasingcomplexity. The first envelope ofa sequence sets the expectation. A variation is perceived if the current envelope is different from the preceding envelope. Theamount ofvariation is given by the number ofpatterns inthe current envelope that are new in comparison with thepattern(s) in the previous envelope. Summing the variations in a sequence gives an envelope variation score(EV) of that sequence. For example, consider Stimulus 24 from Table 8. It has three tone-cluster-beat en-
velopes; the second and third beat are grouped in one envelope by the tone cluster. The patterns in the envelopesare: "fall," "rise and step," and "fall," There are threevariations in the succession of envelopes. Both the riseand the step of the second envelope differ from the fallpattern in the previous envelope, and the fall pattern inthe last envelope differs from the rise-step patterns inthe previous envelope (EV = 3). Another example isSequence 15. There, the second envelope has two patterns (rise and fall) that deviate from the first envelope,which has a step pattern. The other envelopes are repetitions of the second, so that the EV score of the sequence is 2. The EV scores for the 24 stimuli of Experiment 3 are given in Table 10.
Evidence for the hypothesis that the successive variation in tone-cluster-beat relationship is a factor in theperceived complexity of a tone sequence was sought byanalyzing the data of Experiment 3. The EV algorithmwas applied to the 24 stimuli and the resulting EV scoreswere correlated to the judgment data (Table 10). A significant positive relationship was found [r s(24) = .71,P < .01], indicating that this factor gives a partialdescription of the simple-complex dimension in thejudgment data. It can be concluded that the changes inthe relationship between beats and tone clusters is a factor contributing to the complexity perceived in tonesequences.
GENERAL DISCUSSION
Four algorithmic models from the literature on theperception of temporal sequences have been compared.They differ in terms of which information from the tonesequence is considered critical and in how that information is integrated to form a metrical interpretation of thesequence. When the algorithms were applied to a largeset of sequences, only two of the models provided predictions for most of the sequences (the clock model ofPovel & Essens, 1985, and the model of Lee, 1985).Both models look for markers of higher order time intervals to structure a tone sequence. Both identify as
Table 10Envelope Variation Scores (EV) for the Stimulus Set
of Experiment 3 and CorrespondingAverage Judged Complexity
10 2.8 I 22 2.9 2II 3.1 I 23 2.7 212 2.5 I 24 3.8 3
Note-The complexity scale ranges from I (simple) to 5 (complex).
markers the tones that onset the relatively long intervals("accents"). In addition, the clock model uses the tonethat ends a relatively long interval as a marker. The models are comparable in terms of the information used. Themodels diverge in the ways in which the metrical interval is established and in how this higher level intervalfits the sequence. Lee's model determines the firstmarker-bounded interval and tests whether this is an adequate metrical interval. The clock model attempts to fitequal-interval time scales (clocks) to the accents in thewhole sequence and looks for a clock that minimizes thecost when a match is not perfect. As a result, the selection of the clock is not governed by a specific order oftone intervals. The clock model is therefore sensitive toinformation in the whole sequence. The experimentalcomparison between the two models shows that theclock model is a better predictor of the metrical structure of a tone sequence than is Lee's model.
The clock model seems to capture critical aspects ofthe complexity of temporal sequences; the quality of thefit is indicative of the quality of the reproduction. Thevalidity of the clock model is supported by many experiments. It is robust in the sense of generating the sameresults in reproduction tasks performed in different contexts with different subjects using different sequences.The quality of performance, in terms of a reproductiondeviation score, is comparable overexperiments: 6%-8%.
The other proposed account of the complexity oftemporal sequences, formulated as the subdivision model,did not fare well in our experiments. The data showedthat subdivision complexity had no effect on the accuracy of the representation and was not a factor in judgment of the complexity of the sequence. In other words,the way the clock unit is subdivided does not account forthe complexity of the sequence. This raises the questionof whether subdivision is a component of the codingprocess.
Neither the clock nor the nature of the subdivisionsaccounts for the results from the complexity judgmentexperiment. Instead, the results can be explained by therelationship of the tone clusters in the sequence to thebeats of the clock. The tone that coincides with the beatis the prominent tone of the cluster; the other tones arerepresented as the envelope around it. We formulated theenvelope variation model, which states that the variationin the envelopes is a factor in the perceived complexityof a tone sequence. This account of the judgment data isbased not on the temporal characteristics of the sequence but on the interplay between the tone clustersand the clock.
The errors that subjects made in delayed reproductionof the sequences also suggest an interplay between thetemporal and figural structures of a sequence. The errors were described as changes in the figural structureresulting from the addition or deletion of tones. Although these modifications change the interval structureof the sequence itself, the overall relationship betweenthe clock and the sequence did not seem to be affected.More specifically, when the original sequence had inter-
STRUCTURING TEMPORAL SEQUENCES 531
vals fitting into a 4-clock, the reproduced version did aswell and only those tones that were not connected to thebeats of the clock were candidates for change.
The results from the reproduction and judgment experiments and from the error observations suggest adual-code representation of tone sequences that comprises temporal and figural characteristics. The temporal part of the code contains information about the metric of the clock level and lower levels. If a tone is addedin error, the tone will be timed so that it fits into the current temporal metric. The figural part of the code contains information about the configuration of the toneclusters in relation to the beat.
The two-stage account of the perception of temporalsequences given by Povel and Essens (1985) should bemodified. Specification of the intervals in a sequence interms of subdivisions is not needed. The dual-codemodel that we propose here incorporates and extendsthe clock model of Povel and Essens. The clock modelas originally formulated specified which clock matchesbest with the accents perceived in the sequence. It didnot, however, specify the metric of the levels below thebeat. More specifically, it did not specify the possibletimings of the tones in the sequence. Essens (1986) concluded that there are basically two metrics for the levelsbelow the clock, a division of the clock unit into 3 or 4(or 2 and 2) equal time intervals. These correspond toschemes commonly used in Western music (LonguetHiggins, 1976). Jones and Yee's (1993) concept ofhierarchical time ratios abstracted by listeners from temporal sequences is analogous to this account. It is proposednow that establishing a clock implies the use of either a3-metric or a 4-metric. Thus, the temporal code specifies the metric of the sequence. The figural part of thecode captures the location ofthe tones at the lower level.It specifies how the tone clusters are anchored by thebeat. As suggested by the envelope variation model, toneclusters can consist of tones preceding the beat, on thebeat, or after the beat.The figural code is shaped by theclock. If no clock is available, there is only a sequenceof tone clusters with a timing between tones governed bya simple 2: I scheme (Fraisse, 1946). Although the dualcode proposal is less succinct than a purely temporal account, it seems to be more realistic, in that it integratesboth aspects of tone sequences-temporal and figural.
REFERENCES
BAMBERGER, J. (1978). Intuitive and formal musical knowing: Parablesof cognitive dissonance. In S. S. Madeja (Ed.), The arts, cognitionand basic skills (pp. 173-206). New Brunswick, NJ: TransactionsBooks.
ESSENS, P. J. (1986). Hierarchical organization of temporal patterns.Perception & Psychophysics, 40, 69-73.
ESSENS, P. J., & PaVEL, O.-J. (1985). Metrical and nonmetrical representations of temporal patterns. Perception & Psychophysics, 37,1-7.
FRAISSE, P. (1946). Contribution it letude du rythme en tant que formetemporelle. Journal de Psychologic Normale et Pathologique, 39,283-304.
FRAISSE. P. (1956). Les structures rythmiques. Louvain: PublicationsUniversitaires de Louvain.
532 ESSENS
GABRIElSSON, A. ( 1973). Similarity ratings and dimension analyses ofauditory rhythm patterns. Scandinavian Journal ofPsychology, 14,138-160.
JONES, M. R. (1976). Time, our lost dimension: Toward a new theoryof perception, attention, and memory. Psychological Review, 83,323-355.
JONES, M. R., & YEE, W. (1993). Attending to auditory events. InS. McAdams & E. Bigand (Eds.), Thinking in sound: The cognitivepsychology of human audition (pp. 69-112). Oxford: Oxford University Press.
LEE, C. S. (1985). The rhythmic interpretation of simple musical sequences: Towards a perceptual model. In P. Howell, I. Cross, &R. West (Eds.), Musical structure and cognition (pp. 53-69). London: Academic Press.
LEE, C. S. (1991). The perception of metrical structure: Experimentalevidence and a model. In P. Howell, R. West, & I. Cross (Eds.), Representing musical structure (pp. 59-127). London: Academic Press.
LONGUET-HIGGINS, H. C. (1976). Perception ofmelodies. Nature, 263,646-653.
LONGUET-HIGGINS, H. c, & LEE, C. S. (1982). The perception of musical rhythms. Perception, 11, 115-128.
LONGUET-HIGGINS, H. C; & LEE, C. S. (1984). The rhythmic interpretation of monophonic music. Music Perception, 1, 424-441.
MARTIN, J. G. (1972). Rhythmic (hierarchical) versus serial structurein speech and other behavior. Psychological Review, 79, 487-509.
MONAHAN, C. 8., KENDALL, R. A., & CARTERETTE, E. C. (1987). Theeffect of melodic and temporal contour on recognition memory forpitch change. Perception & Psychophysics, 41, 576-600.
PaVEL, D.-J. (1981). Internal representation of simple temporal patterns. Journal of Experimental Psychology: Human Perception &Performance, 7, 3-18.
PaVEL, D.-J., & ESSENS, P. 1. (1985). Perception of temporal patterns.Music Perception, 2, 411-440.
PaVEL,D.-J., & OKKERMAN, H. (1981). Accents in equitone sequences.Perception & Psychophysics, 30, 565-572.
WILKINSON, L. (1988). SYSTAT The system for statistics. Evanston,IL: SYSTAT, Inc.
NOTES
I. Povel and Essens (1985) used the term "coding model," whichmight be confusing in that it suggests that only the second stage dealswith coding of the sequence. In this paper, coding refers to the structural breakdown ofa sequence that results in a representation of the sequence.
2. The results of Povel and Essens (1985) indicate that sequenceswith one - ev result in the same reproduction performance as dosequences with two and three Oev's. The exact relationship not beingknown, W is best set to an (arbitrary) value larger than the maximumnumber of Oev's in the sequences used. For the set of sequences usedhere ofunit lengths 12 and 16, W is set to 4 (as used by Povel & Essens,1985).
3. Longuet-Higgins and Lee use the term "note" to mean the onsetof an interval; a long note is thus a tone followed by a long interval(Lee, 1985, p. 57; Longuet-Higgins & Lee, 1984, p. 431). Althoughthey refer to "musical sequence," the sequences discussed comprisenotes that do not differ with respect to pitch, harmony, loudness, orother note characteristics (Lee, 1985, p. 53; Longuet-Higgins & Lee,1984, p. 424), and therefore are pure temporal sequences, as used here.
(Manuscript received December 14, 1992;revision accepted for publication October II, 1994.)