79
Lesson 4- Statistical Concepts Student Manual Version 9.0 - 02/2013 4-1

Lesson 4- Statistical ConceptsStudent Manual
Version 9.0 - 02/2013 4-1

Lesson 4- Statistical ConceptsStudent Manual
Version 9.0 - 02/2013 4-2

Lesson 4- Statistical ConceptsStudent Manual
Listed above are the major Learning Outcomes you will have achieved when thislesson is completedlesson is completed.
Version 9.0 - 02/2013 4-3

Lesson 4- Statistical ConceptsStudent Manual
It is important to understand that there is Variability in constructing transportationj tprojects.
Our goal is to minimize Variability. The level of Quality of any material or productis associated with the level of Variability.
Version 9.0 - 02/2013 4-4
Lesson 4- Statistical ConceptsStudent Manual
Quality Control and Verification sampling and testing are used to measure thelit f th t t d d t Th ifi t i l ti hi hquality of the constructed product. The specific material properties which are
evaluated by QC and Verification sampling and testing are referred to as QualityCharacteristics.
Quality Characteristics which are specified are normally selected because they:-Relate to initial and long term PerformanceAre quantifiable or measurable-Are quantifiable or measurable
-Can be measured with good repeatability
Version 9.0 - 02/2013 4-5

Lesson 4- Statistical ConceptsStudent Manual
Quality Characteristics for QC are selected because they are good indicators tomonitor and control production against specification targets and limits.
Quality Characteristics selected for QC contribute either directly or indirectly tothe long term performance of the product.
Shown above are some QC Quality Characteristics for Asphalt and PortlandC t tCement concrete.
Version 9.0 - 02/2013 4-6

Lesson 4- Statistical ConceptsStudent Manual
Quality Characteristics for Verification are selected because they directly relateto the long-term performance of the product.
Shown above are some Verification Quality Characteristics for Asphalt andPortland Cement concrete.
Are some quality characteristics more important than others?
Typical Quality Characteristics Utilized for Acceptance
Hot-Mix Asphalt (HMA) Portland Cement Concrete (PCC)
Asphalt Content (25% Pay factor) Air Content
Air Voids (25% Pay factor) Compressive Strength
In-Place Density (35% Pay factor)
% Passing #8 Sieve (5% Pay factor)
Ride Quality
Version 9.0 - 02/2013
% Passing #8 Sieve (5% Pay factor)
% Passing #200 Sieve (10% Pay factor)
4-7

Lesson 4- Statistical ConceptsStudent Manual
Variability exists in all construction materials. It is one of the key factors that isi t l t Q lit A d t b d t dintegral to Quality Assurance and must be understood.
Variability can be controlled but not eliminated. Construction materials, evenunder the best controlled production, can be expected to have some amount ofvariability.
It is important to keep in mind that each material has some inherent variabilityIt is important to keep in mind, that each material has some inherent variability.
Version 9.0 - 02/2013 4-8

Lesson 4- Statistical ConceptsStudent Manual
Variability- there are four primary sources of Variability in construction materials,th b ithose being:- Material Variability- Sampling Variability- Testing variability- Production and Placement
Version 9.0 - 02/2013 4-9

Lesson 4- Statistical ConceptsStudent Manual
Materials variability is for the most part due to Mother Nature, in that thevariation exists in the materials naturally.
It is quite unrealistic to expect perfect homogeneity in any raw or processedsource of construction materials. However, this variability is generally small whenlike materials are compared.
Version 9.0 - 02/2013 4-10

Lesson 4- Statistical ConceptsStudent Manual
Sampling Variability is caused by variation that is in the sampling methods used.Even if the standard sampling procedures are followed, some amount ofsampling variability will occur, because we are human. No two people willperform sampling identically.
Version 9.0 - 02/2013 4-11

Lesson 4- Statistical ConceptsStudent Manual
Testing Variability is caused by variation that is in the testing methods andi t E if th t h i i f ll f ll th t d d d dequipment. Even if the technician carefully follows the standard procedures, and
the equipment is properly calibrated, there is some variability.
Naturally, for both sampling and testing, should liberties be taken with altering theprocedures or methods, regardless of how small, more variability has beenintroduced. Additionally, equipment that is not properly calibrated or properlyfunctioning just adds to the list of variablesfunctioning just adds to the list of variables.
Version 9.0 - 02/2013 4-12

Lesson 4- Statistical ConceptsStudent Manual
Construction Variability is a result of the variations that occur in construction andproduction processes.
Additional variables can be introduced through inconsistent production andconstruction methods.
Version 9.0 - 02/2013 4-13

Lesson 4- Statistical ConceptsStudent Manual
Typical Quality Measures used in Quality Assurance Specifications areTypical Quality Measures used in Quality Assurance Specifications areselected because they quantify the average quality, the variability, or both.
Quality Measures that we will review are:• The Mean• The Range• The Variance• The Deviation• The Standard Deviation• The Percent Within Limits (PWL)
For example, the Mean of all strength test results might be specified as the Quality Measure for a LOT of Portland Cement concrete. Or, the Percent y ,Within Limits (PWL) of all in-place density test results might be used as the Quality Measure for earthwork densities. PWL is the Quality Measure that is most often recommended for use in Quality Assurance Specifications.
Version 9.0 - 02/2013 4-14
Lesson 4- Statistical ConceptsStudent Manual
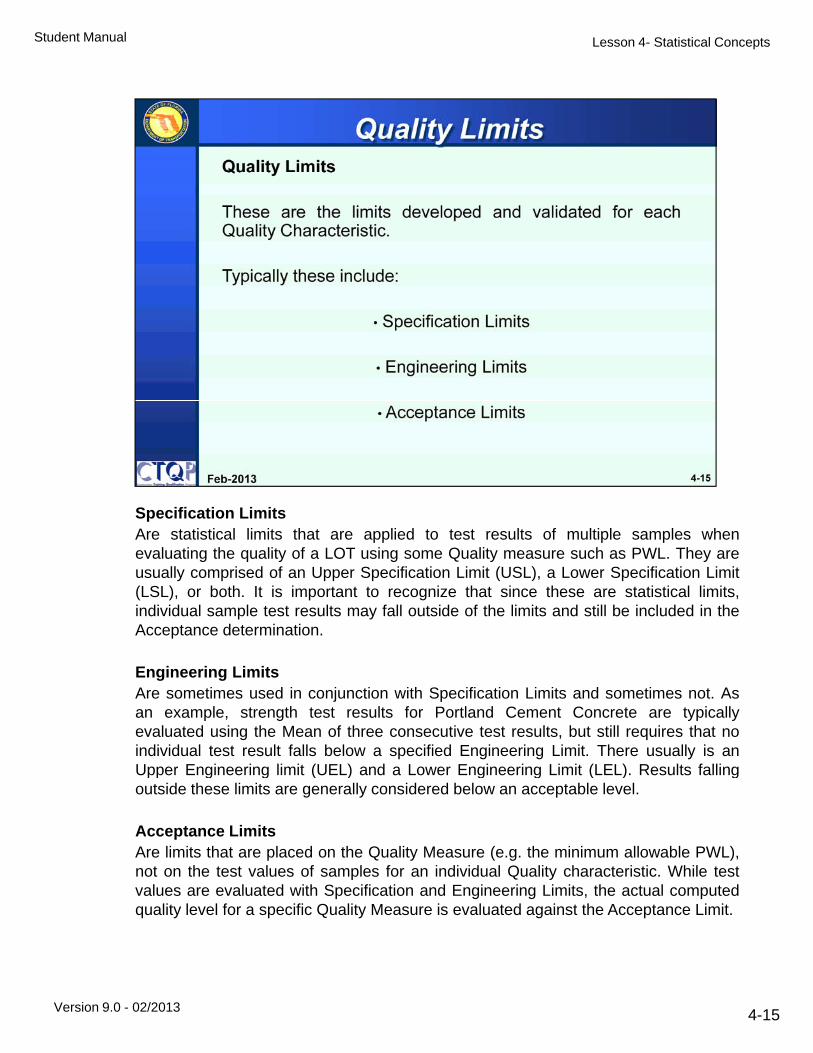
Specification LimitsAre statistical limits that are applied to test results of multiple samples whenevaluating the quality of a LOT using some Quality measure such as PWL. They areusually comprised of an Upper Specification Limit (USL), a Lower Specification Limit(LSL), or both. It is important to recognize that since these are statistical limits,individual sample test results may fall outside of the limits and still be included in theAcceptance determination.
Engineering LimitsAre sometimes used in conjunction with Specification Limits and sometimes not. Asan example, strength test results for Portland Cement Concrete are typicallyevaluated using the Mean of three consecutive test results, but still requires that noindividual test result falls below a specified Engineering Limit. There usually is anUpper Engineering limit (UEL) and a Lower Engineering Limit (LEL). Results fallingpp g g ( ) g g ( ) goutside these limits are generally considered below an acceptable level.
Acceptance LimitsAre limits that are placed on the Quality Measure (e.g. the minimum allowable PWL),not on the test values of samples for an individual Quality characteristic. While testvalues are evaluated with Specification and Engineering Limits, the actual computed
f f Q
Version 9.0 - 02/2013
quality level for a specific Quality Measure is evaluated against the Acceptance Limit.
4-15

Lesson 4- Statistical ConceptsStudent Manual
The “Mean” coincides with the center or midpoint of a Normal Distribution Curve.
Ideally, the Mean should be the Target Value for Quality Characteristics with anacceptance range. The “mean” target value needs to be above the minimum limitfor pass/fail specifications.
The Mean is denoted by an X with a bar over it (x), and is called “x-bar”. TheMean of a Statistical Sample is computed by adding all of the individual materialMean of a Statistical Sample is computed by adding all of the individual materialsample test values (xi) in the Statistical Sample and dividing the sum () of thosetest values by the number of samples (n).
Therefore:
x = =x
xiX1 + X2 + X3 + ….
n
x
Where:
= Mean
I di id l t t l
Version 9.0 - 02/2013
xi = Individual test value
= Sum of all
n = number of samples
4-16
Lesson 4- Statistical ConceptsStudent Manual
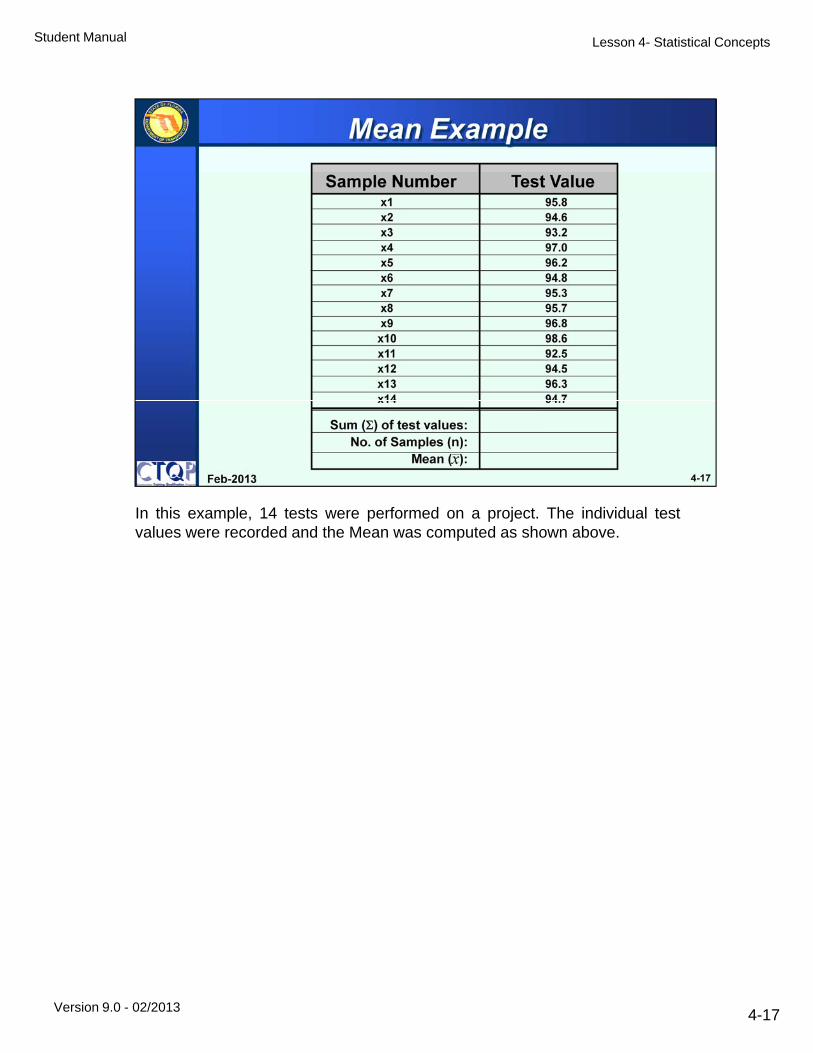
In this example, 14 tests were performed on a project. The individual testl d d d h M d h bvalues were recorded and the Mean was computed as shown above.
Version 9.0 - 02/2013 4-17

Lesson 4- Statistical ConceptsStudent Manual
The simplest measure of dispersion (i.e. Variability) which can be determinedf f l i h Rfor a set of measurements or test values is the Range.
The Range for a Statistical Sample (i.e. multiple samples) is computed asshown above; by subtracting the lowest sample value from the highest.
Although it is a single, easy to determine measurement, its primary drawbackis that it does not utilize all of the information (sample values) available in theis that it does not utilize all of the information (sample values) available in thestatistical sample. Since the Range only accounts for the two extremevalues, it provides no measure of the dispersion of the other values. It isoften used in Control Chart applications.
Version 9.0 - 02/2013 4-18
Lesson 4- Statistical ConceptsStudent Manual
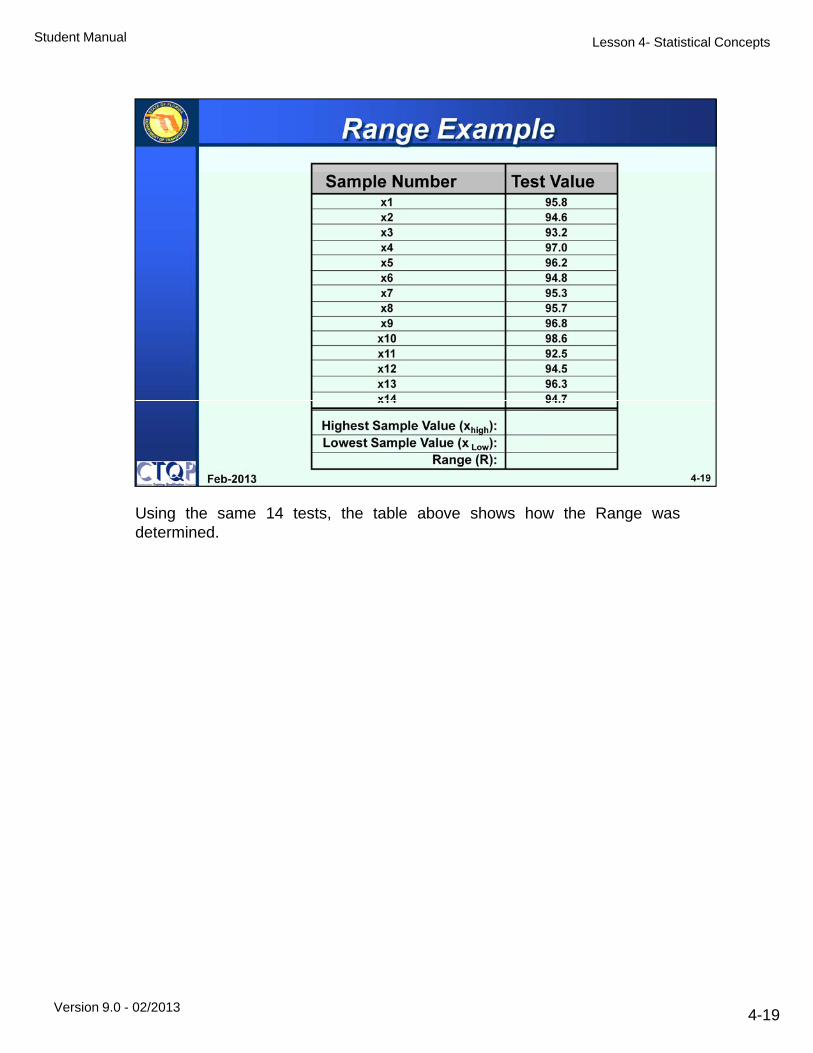
Using the same 14 tests, the table above shows how the Range wasd i ddetermined.
Version 9.0 - 02/2013 4-19

Lesson 4- Statistical ConceptsStudent Manual
O i l d t h h i di id l l lOne simple measure used to express how much an individual sample valuevaries from the Mean of a set of measurements or test values is referred to as aDeviation.
This is simply calculated by subtracting the “mean” from the single samplevalue:
Deviation = (xi – x)
Where:
Mx = Mean
xi = Individual test value
= Sum of all
n = number of samples
Version 9.0 - 02/2013 4-20
Lesson 4- Statistical ConceptsStudent Manual
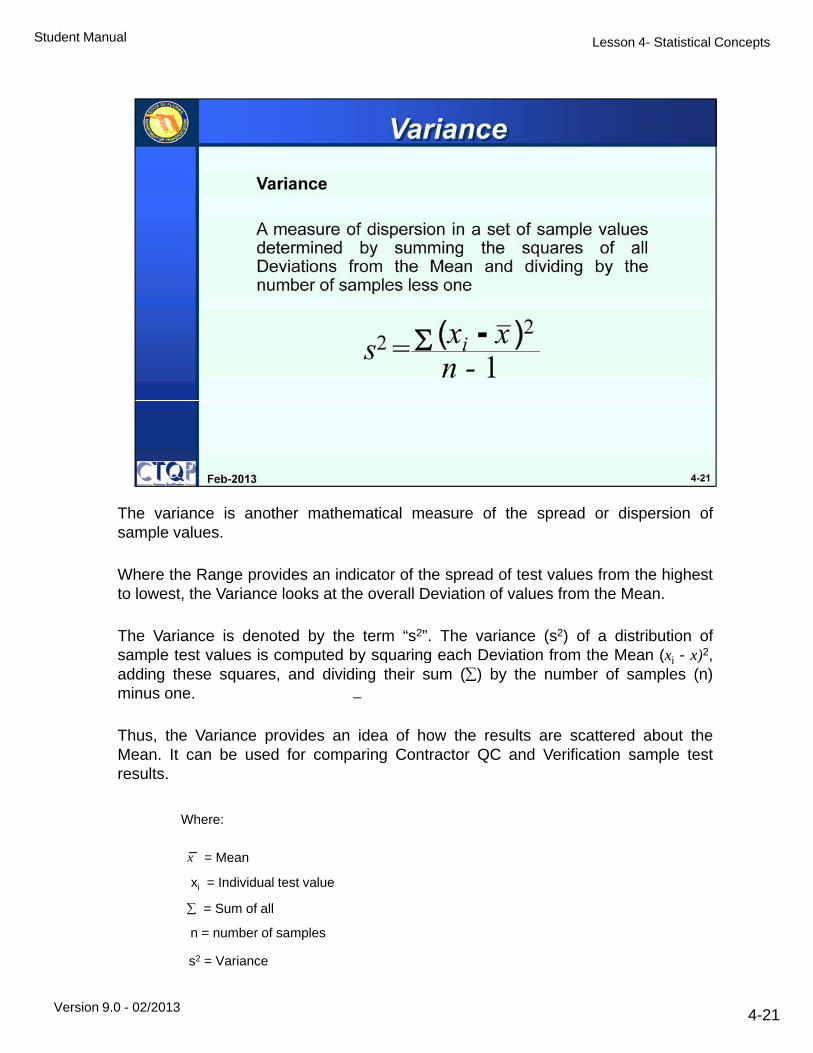
The variance is another mathematical measure of the spread or dispersion ofl lsample values.
Where the Range provides an indicator of the spread of test values from the highestto lowest, the Variance looks at the overall Deviation of values from the Mean.
The Variance is denoted by the term “s2”. The variance (s2) of a distribution ofsample test values is computed by squaring each Deviation from the Mean ( )2sample test values is computed by squaring each Deviation from the Mean (xi - x)2,adding these squares, and dividing their sum () by the number of samples (n)minus one.
Thus, the Variance provides an idea of how the results are scattered about theMean. It can be used for comparing Contractor QC and Verification sample testresults.results.
x
Where:
= Mean
xi = Individual test value
S f
Version 9.0 - 02/2013
= Sum of all
n = number of samples
s2 = Variance
4-21

Lesson 4- Statistical ConceptsStudent Manual
Using the same 14 tests, the table above shows how the Variance (s2) wasd i ddetermined.
Version 9.0 - 02/2013 4-22

Lesson 4- Statistical ConceptsStudent Manual
The Standard Deviation is another measure of spread or variation, and is derivedf h V i I id f h D i i f h i di id lfrom the Variance. It provides a measure of the average Deviation of the individualsample values from the Mean.
The Standard Deviation of a Population is denoted by the symbol “” and theStandard Deviation of a Statistical Sample is denoted with by “s”.
The Standard deviation(s) is computed by taking the square root of the Variance (s2)The Standard deviation(s) is computed by taking the square root of the Variance (s2)of a distribution of sample test values. If the number (n) of samples that comprisethe Statistical Sample is greater than 200, the Population Standard Deviation ()should be used.
Please note that that the “n” denominator is different in the two calculations.
x
Where:
= Mean
xi = Individual test value
= Sum of all
b f l
Version 9.0 - 02/2013
n = number of samples
s2 = Variance
s = Standard Deviation of Statistical Sample
= Standard Deviation for Populations
4-23

Lesson 4- Statistical ConceptsStudent Manual
Using the same 14 tests, the table above shows how the Standard Deviation( ) d i d(s) was determined.
Version 9.0 - 02/2013 4-24
Lesson 4- Statistical ConceptsStudent Manual
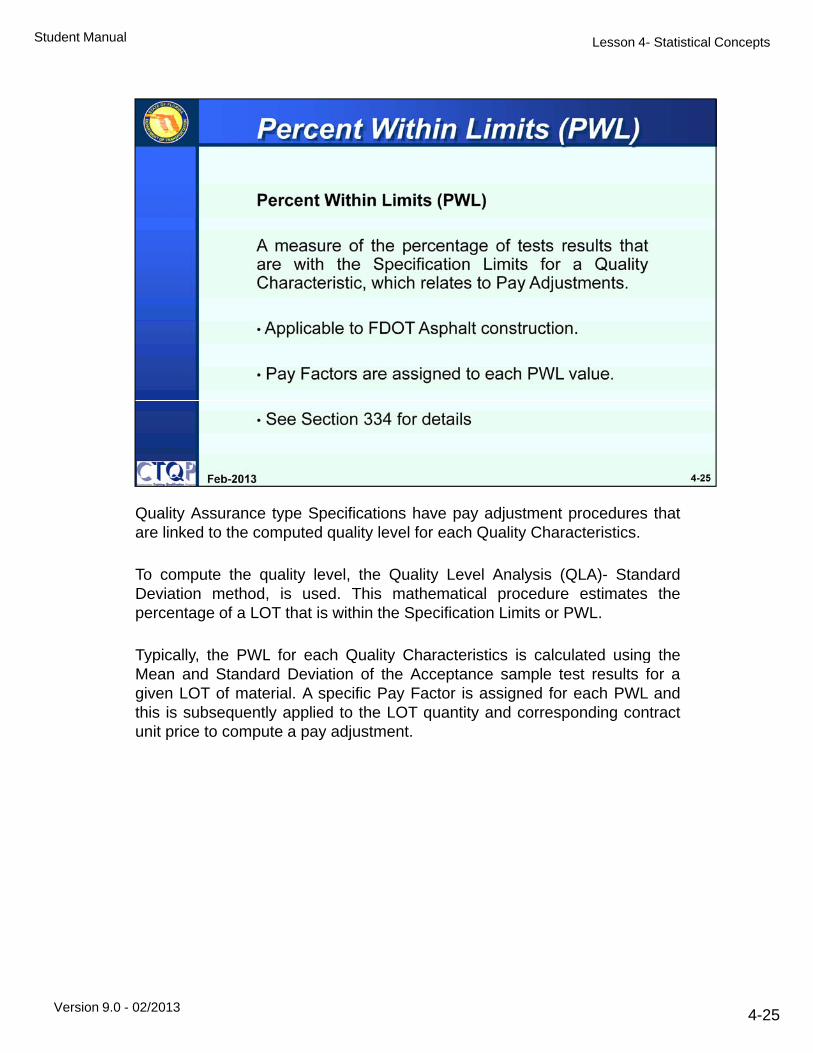
Quality Assurance type Specifications have pay adjustment procedures thatli k d h d li l l f h Q li Ch i iare linked to the computed quality level for each Quality Characteristics.
To compute the quality level, the Quality Level Analysis (QLA)- StandardDeviation method, is used. This mathematical procedure estimates thepercentage of a LOT that is within the Specification Limits or PWL.
Typically the PWL for each Quality Characteristics is calculated using theTypically, the PWL for each Quality Characteristics is calculated using theMean and Standard Deviation of the Acceptance sample test results for agiven LOT of material. A specific Pay Factor is assigned for each PWL andthis is subsequently applied to the LOT quantity and corresponding contractunit price to compute a pay adjustment.
Version 9.0 - 02/2013 4-25

Lesson 4- Statistical ConceptsStudent Manual
“A” is more variable. Even though “A’s” average would be on target, each datai i l f hpoint varies greatly from the target.
Why aren’t the average values a good enough measure?Why aren’t the average values a good enough measure?y g g gy g g g
Version 9.0 - 02/2013 4-26
Lesson 4- Statistical ConceptsStudent Manual
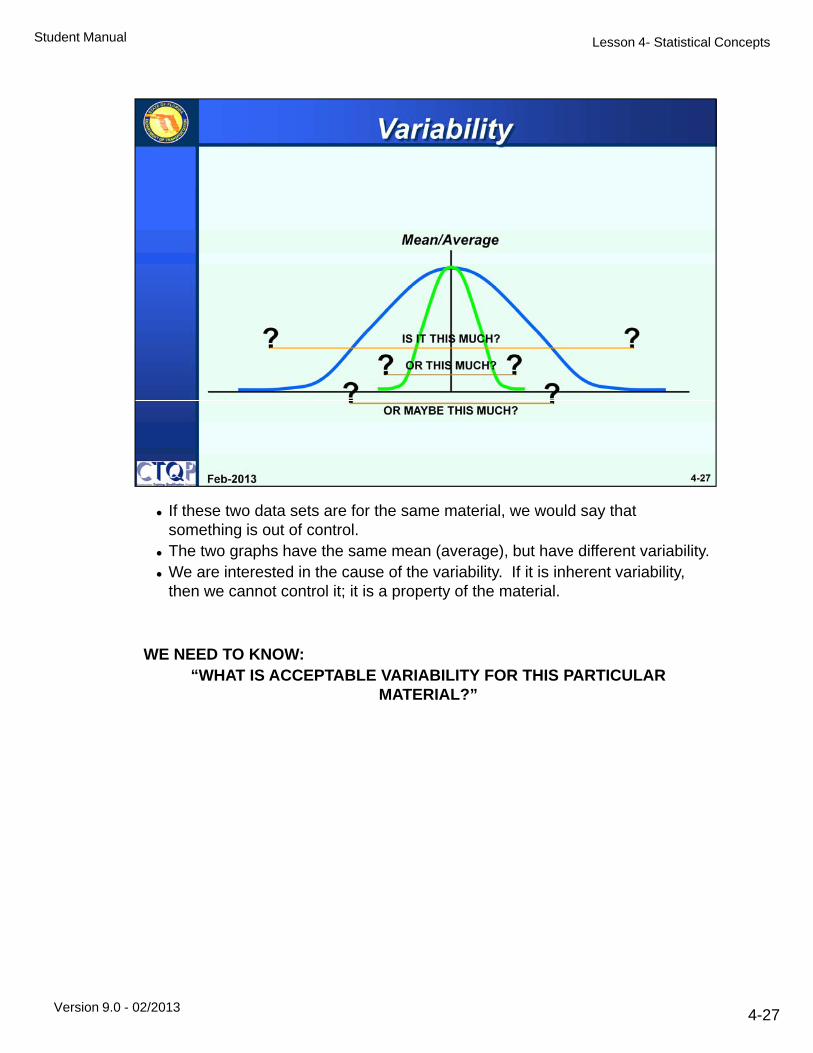
If these two data sets are for the same material, we would say that thi i t f t lsomething is out of control.
The two graphs have the same mean (average), but have different variability. We are interested in the cause of the variability. If it is inherent variability,
then we cannot control it; it is a property of the material.
WE NEED TO KNOW:WE NEED TO KNOW:“WHAT IS ACCEPTABLE VARIABILITY FOR THIS PARTICULAR
MATERIAL?”
Version 9.0 - 02/2013 4-27

Lesson 4- Statistical ConceptsStudent Manual
Target Values are based upon the Mean for a particular material. The upper andlower limits are established based upon a desired engineering value related tomaterial performance. The “mean” needs to be above the lower Limit.
Establishing Limits for QA Specs – expect to achieve the desired result ifmeasured data falls within the established limits of our target value 95% of thetime.
Establishing Limits for QA Specs – expect to achieve thedesired result if measured data falls within the establishedlimits of our target value 95% of the time.
95% of Data
Version 9.0 - 02/2013 4-28
Lesson 4- Statistical ConceptsStudent Manual
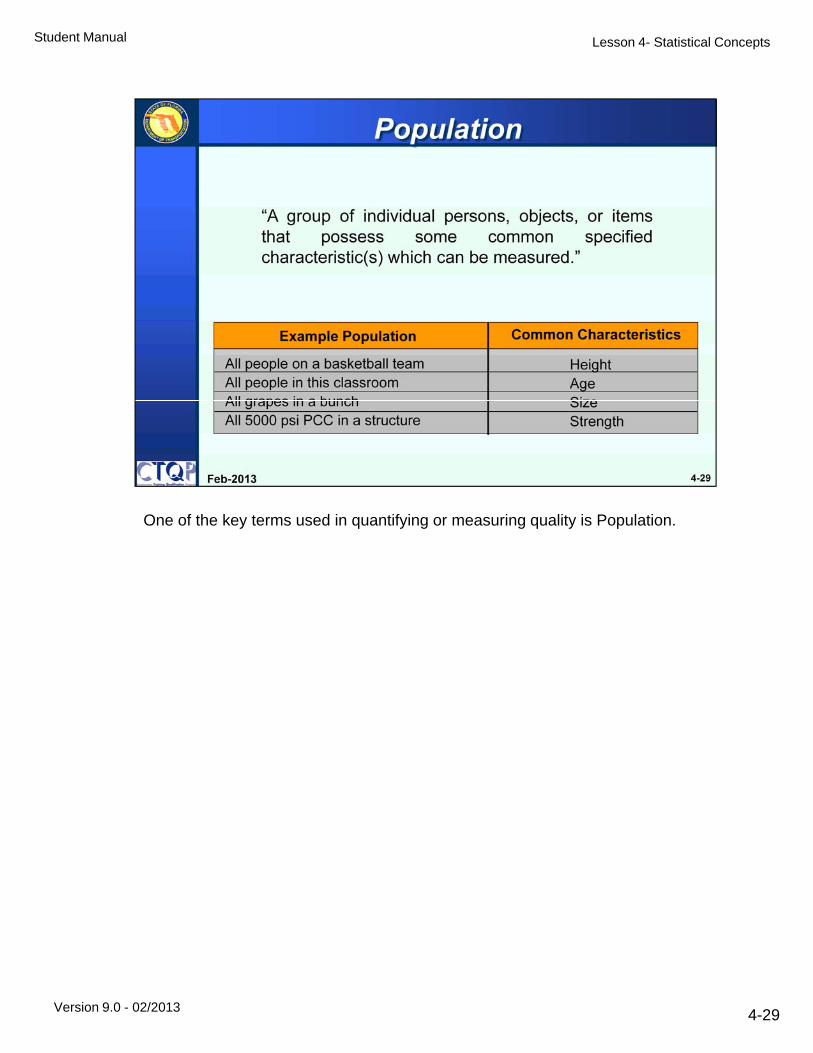
One of the key terms used in quantifying or measuring quality is Population.y q y g g q y p
Version 9.0 - 02/2013 4-29

Lesson 4- Statistical ConceptsStudent Manual
In Quality Assurance Specification, the term LOT is used to represent aP l ti f t i l ( HMA PCC S il t ) hi h i i t d i t thPopulation of material (e.g. HMA, PCC, Soils, etc.) which is incorporated into theproduct.
SSRBC sets forth the size of a LOT, by construction type and material. The LOTsize is intended to represent material which is indeed from the same source andwhich has been produced and placed essentially under the same controlledconditions.
F E lFor Example-
Section 120- Excavation & Embankment- a LOT is a single lift of finished materialnot to exceed 500 feet in length, or a single run of pipe connecting two structures,whichever is less.
On some very small projects, the Plans may define the LOT as the entire quantityof material produced and placed on that project. This is often referred to as Job-Mi F l (JMF) S d b k t th JMF hMix Formula (JMF). Some drawbacks to the JMF approach are:
-Material may be placed over an extended period (1-2 years)
-The entire material may truly have not been produced and placed under thesame conditions (changes in equipment, changes in weather, material source,etc.)
LOT
Version 9.0 - 02/2013
500 feet
LOT
4-30
Lesson 4- Statistical ConceptsStudent Manual
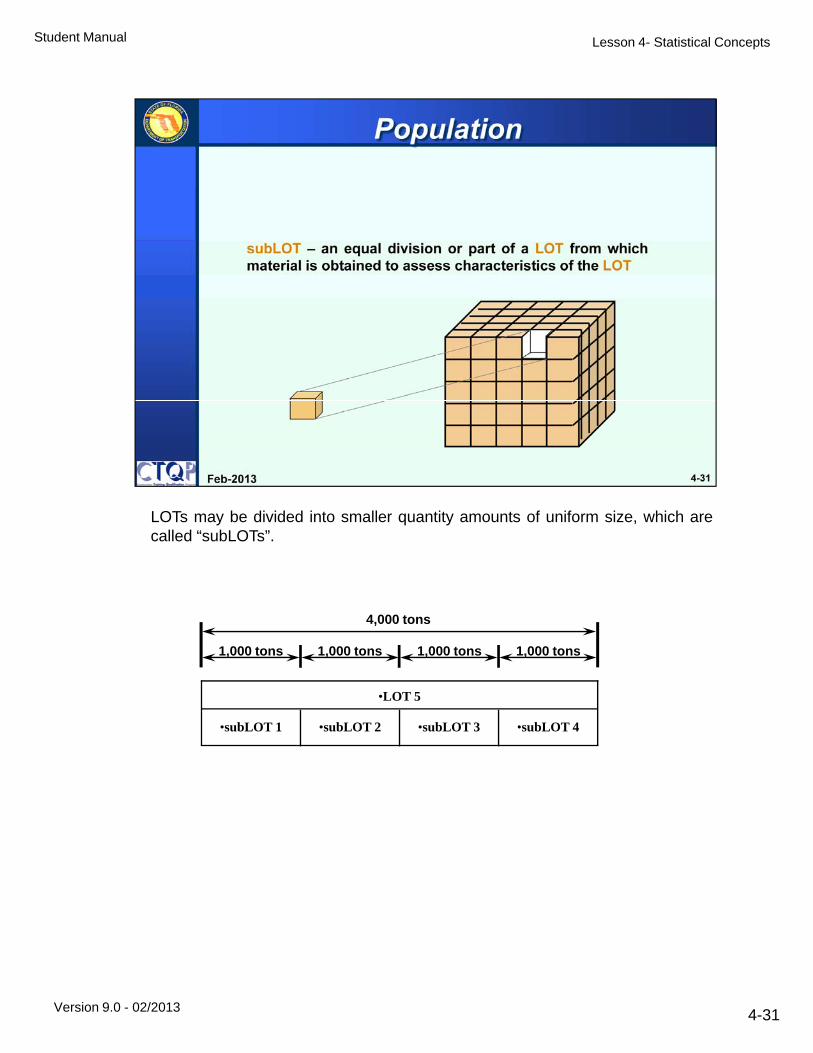
LOTs may be divided into smaller quantity amounts of uniform size, which arecalled “subLOTs”.
4,000 tons
1 000 tons 1 000 tons 1 000 tons 1 000 tons
•subLOT 4•subLOT 3•subLOT 2•subLOT 1
•LOT 5
1,000 tons 1,000 tons 1,000 tons 1,000 tons
Version 9.0 - 02/2013 4-31
Lesson 4- Statistical ConceptsStudent Manual
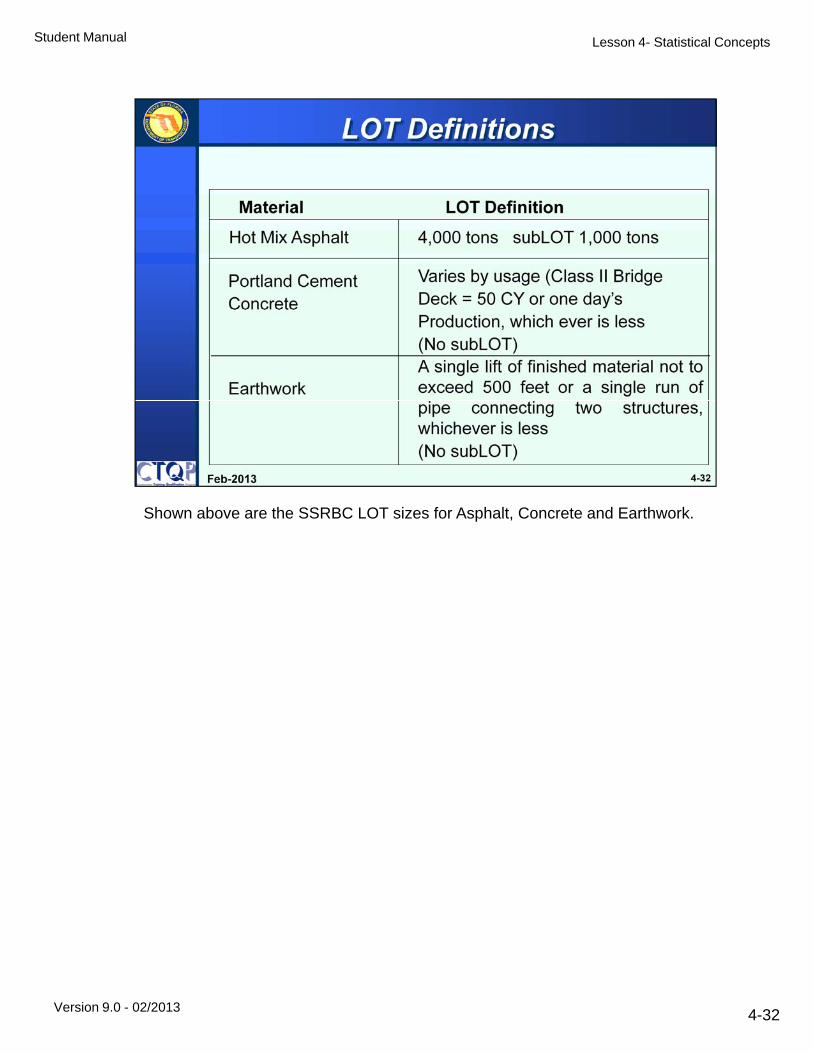
Shown above are the SSRBC LOT sizes for Asphalt, Concrete and Earthwork.
Version 9.0 - 02/2013 4-32

Lesson 4- Statistical ConceptsStudent Manual
To measure a particular Quality Characteristic of a LOT or subLOT, we couldobtain a sample from every part of the LOT.
For example- we want to test the compressive strength of 500 CY of PCC. Wecould test every yard, but then we wouldn’t have much concrete left. This iscalled “complete enumeration”. Obviously, this is not practical or cost-effective,therefore we obtain a Statistical Sample. Statistical Samples are thosesamples obtained from a LOT which can provide information that may be usedto quantity the quality of the entire LOT.
Version 9.0 - 02/2013 4-33
Lesson 4- Statistical ConceptsStudent Manual
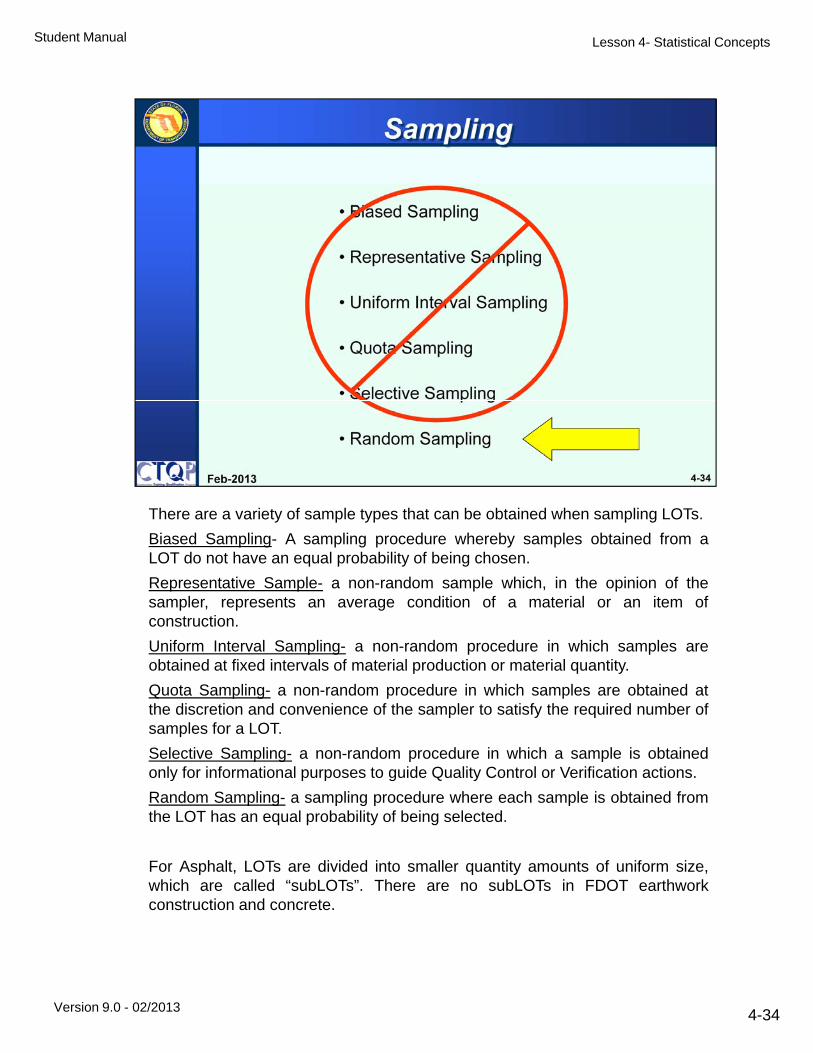
There are a variety of sample types that can be obtained when sampling LOTs.
Biased Sampling- A sampling procedure whereby samples obtained from aLOT do not have an equal probability of being chosen.
Representative Sample- a non-random sample which, in the opinion of thesampler, represents an average condition of a material or an item ofconstruction.
Uniform Interval Sampling- a non-random procedure in which samples arep g p pobtained at fixed intervals of material production or material quantity.
Quota Sampling- a non-random procedure in which samples are obtained atthe discretion and convenience of the sampler to satisfy the required number ofsamples for a LOT.
Selective Sampling- a non-random procedure in which a sample is obtainedonly for informational purposes to guide Quality Control or Verification actions.only for informational purposes to guide Quality Control or Verification actions.
Random Sampling- a sampling procedure where each sample is obtained fromthe LOT has an equal probability of being selected.
For Asphalt, LOTs are divided into smaller quantity amounts of uniform size,which are called “subLOTs”. There are no subLOTs in FDOT earthworkconstruction and concrete
Version 9.0 - 02/2013
construction and concrete.
4-34

Lesson 4- Statistical ConceptsStudent Manual
120-10.1.5 Department Verification: The Engineer will conduct a Verification…
The Engineer will select test locations, including Station, Offset, and Lift, using aRandom Number generator based on the Lots under consideration. EachVerification test evaluates all work represented by the Quality Control testingcompleted in those LOTs.
(All other specifications have similar language)
To eliminate biased samples (both QC and Verification), Random Sampling is tobe performed.
Random sampling protects against known defects, unknown defects, cycles andpatterns. It has a low inherent risk, low risk in unknown situations, and highreliability. Furthermore, it does not required a knowledgeable sampler (one whounderstands patterns, etc.)understands patterns, etc.)
Version 9.0 - 02/2013 4-35
Lesson 4- Statistical ConceptsStudent Manual
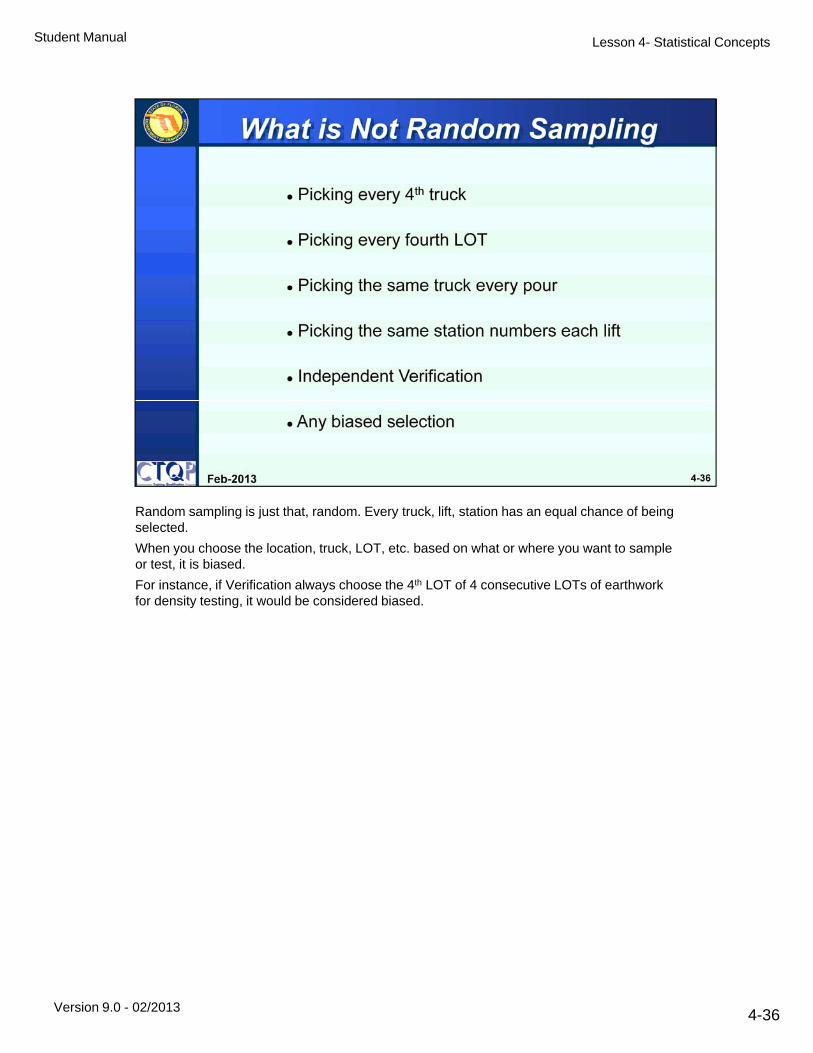
Random sampling is just that, random. Every truck, lift, station has an equal chance of being selectedselected.
When you choose the location, truck, LOT, etc. based on what or where you want to sample or test, it is biased.
For instance, if Verification always choose the 4th LOT of 4 consecutive LOTs of earthwork for density testing, it would be considered biased.
Version 9.0 - 02/2013 4-36
Lesson 4- Statistical ConceptsStudent Manual
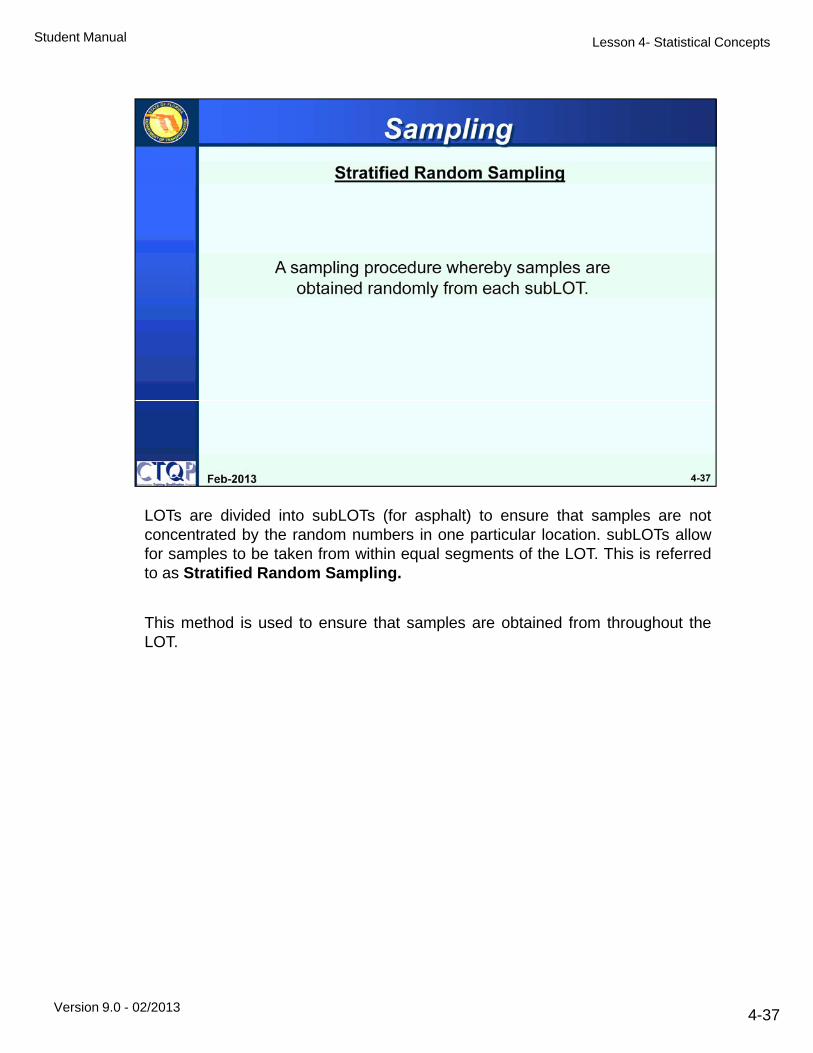
LOTs are divided into subLOTs (for asphalt) to ensure that samples are notconcentrated by the random numbers in one particular location. subLOTs allowfor samples to be taken from within equal segments of the LOT. This is referredto as Stratified Random Sampling.
This method is used to ensure that samples are obtained from throughout theLOT.
Version 9.0 - 02/2013 4-37

Lesson 4- Statistical ConceptsStudent Manual
There are a variety of methods for determining Random sampling locations.
It is important to determine which method the Engineer will be using, as thespecifications require the Engineer to provide the Random Number generator.
The QC Manager and their staff should be made aware of the system to beused in advance of construction and all parties agree.
Example Random Number Generators:
-ASTM D 3665- Standard Practice for Random Sampling of Construction-ASTM D 3665- Standard Practice for Random Sampling of ConstructionMaterials
-Computer/calculator capable of generating random numbers
-Throwing dice
-Random Number Table created through software, such as MS Excel orproprietary software available for purchase.
Version 9.0 - 02/2013 4-38

Lesson 4- Statistical ConceptsStudent Manual
This is the Random Number Chart FDOT.
The following Random Number Chart and instructions can be obtained fromthe SMO website.
The following pages have a full size of the chart and detailed instructions onits’ use.
Version 9.0 - 02/2013 4-39

Lesson 4- Statistical ConceptsStudent Manual
OT
er C
har
t F
Do
m N
um
be
Ran
do
Version 9.0 - 02/2013 4-40
Lesson 4- Statistical ConceptsStudent Manual
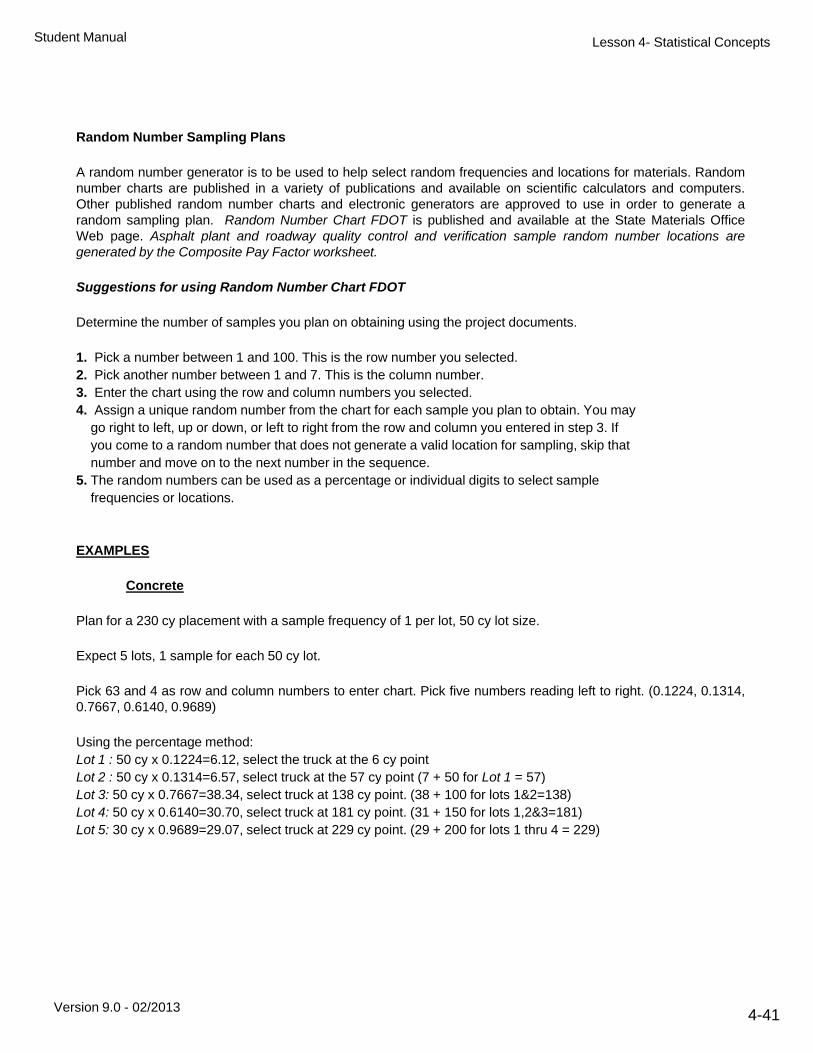
Random Number Sampling Plans
A random number generator is to be used to help select random frequencies and locations for materials. Randomnumber charts are published in a variety of publications and available on scientific calculators and computers.Other published random number charts and electronic generators are approved to use in order to generate arandom sampling plan. Random Number Chart FDOT is published and available at the State Materials OfficeWeb page. Asphalt plant and roadway quality control and verification sample random number locations aregenerated by the Composite Pay Factor worksheet.
Suggestions for using Random Number Chart FDOT
Determine the number of samples you plan on obtaining using the project documents.
1. Pick a number between 1 and 100. This is the row number you selected.2. Pick another number between 1 and 7. This is the column number.3. Enter the chart using the row and column numbers you selected.4. Assign a unique random number from the chart for each sample you plan to obtain. You may
go right to left, up or down, or left to right from the row and column you entered in step 3. Ifyou come to a random number that does not generate a valid location for sampling, skip thatnumber and move on to the next number in the sequence.
5. The random numbers can be used as a percentage or individual digits to select samplefrequencies or locations.
EXAMPLES
Concrete
Plan for a 230 cy placement with a sample frequency of 1 per lot, 50 cy lot size.
E t 5 l t 1 l f h 50 l tExpect 5 lots, 1 sample for each 50 cy lot.
Pick 63 and 4 as row and column numbers to enter chart. Pick five numbers reading left to right. (0.1224, 0.1314,0.7667, 0.6140, 0.9689)
Using the percentage method:Lot 1 : 50 cy x 0.1224=6.12, select the truck at the 6 cy pointLot 2 : 50 cy x 0 1314=6 57 select truck at the 57 cy point (7 + 50 for Lot 1 = 57)Lot 2 : 50 cy x 0.1314=6.57, select truck at the 57 cy point (7 + 50 for Lot 1 = 57)Lot 3: 50 cy x 0.7667=38.34, select truck at 138 cy point. (38 + 100 for lots 1&2=138)Lot 4: 50 cy x 0.6140=30.70, select truck at 181 cy point. (31 + 150 for lots 1,2&3=181)Lot 5: 30 cy x 0.9689=29.07, select truck at 229 cy point. (29 + 200 for lots 1 thru 4 = 229)
Version 9.0 - 02/2013 4-41

Lesson 4- Statistical ConceptsStudent Manual
Earthwork Stabilized Subgrade
Contractor completes stabilization and compaction operations for a subgrade section of 1400 lineal feet with awidth of 24 feet. Three Lots of stabilized subgrade. You plan for 3 density tests (1 location per Lot) and 9stabilizing mixing depth (3 locations per Lot).
Density locations:
Pick 18 and 2 as row and column numbers to enter random number chart.Reading left to right: 0.6408, 0.0142, 0.9695, 0.7430, 0.0820 and 0.5628. Note 6 random numbers areselected as you need random distance locations from the beginning of the lot station and random widthselected as you need random distance locations from the beginning of the lot station and random widthlocations from the edge of the stabilized area.
Lot 1: Length, 500 x 0.6408 = 320Width, 24 x 0.0142 = 0.34
Select location 320’ from beginning station of Lot 1 and 0.34’ from the right side of the stabilized area.
Lot 2: Length, 500 x 0.9695 - 485Lot 2: Length, 500 x 0.9695 485Width, 24 x 0.7430 = 17.8
Select location 485’ from beginning station of Lot 2 and 17.8’ from the right side of the stabilized area
Lot 3: Length, 400 x 0.0820 = 33Width, 24 x 0.5628 = 13.5
Select location 33’ from beginning station of Lot 3 and 13.5’ from the right side of the stabilized area
Mixing depth check locations can be selected in a similar manner using 3 locations per Lot.
Tips :
• Enter the chart at a unique location each time it is used. Avoid starting at the top, (row 1, and column1). And reading to the right like a book each for successive chart uses.
• Keep it simple! Close your eyes and point to a spot on the page to start if you can’t decide whichnumbers between 1 and 100 or 1 and 7 are good starting points.
• Avoid the temptation to pick new random numbers just because you don’t agree with the randomselection. You can always use Independent verification ( IV) testing if the random selection isobviously missing an area of particular concern.
• Record all the test data for every test conducted.
Version 9.0 - 02/2013 4-42
Lesson 4- Statistical ConceptsStudent Manual
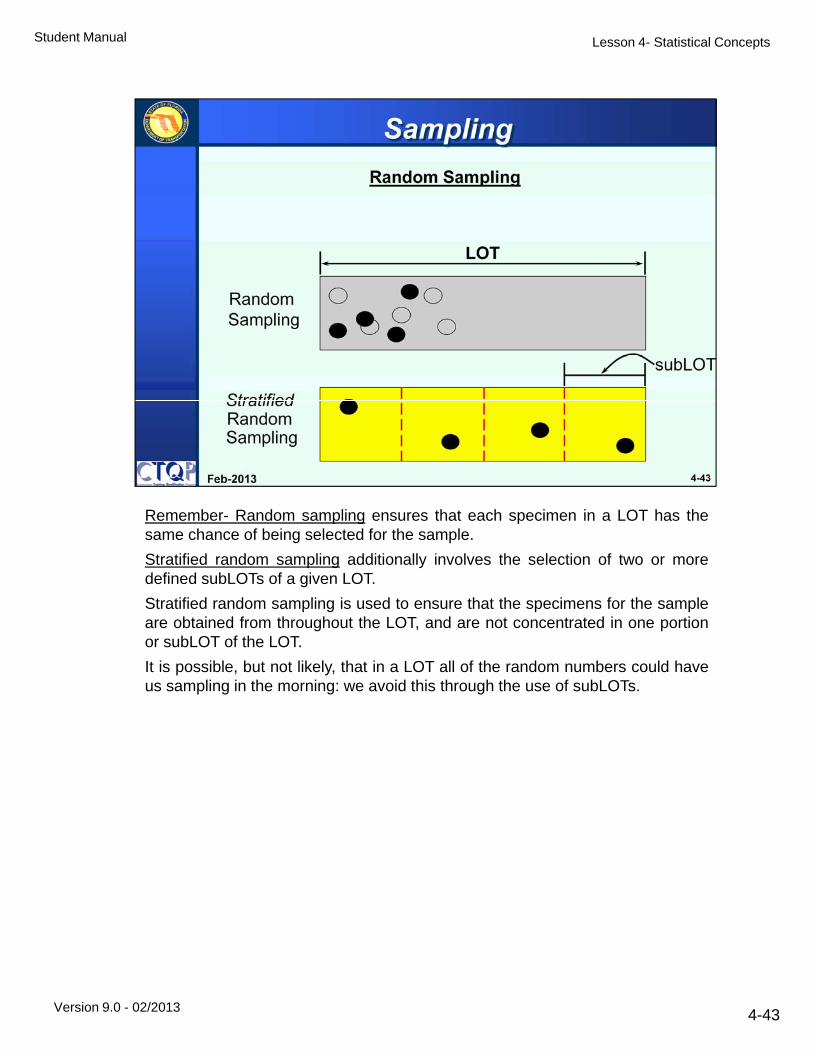
Remember- Random sampling ensures that each specimen in a LOT has thesame chance of being selected for the sample.
Stratified random sampling additionally involves the selection of two or moredefined subLOTs of a given LOT.
Stratified random sampling is used to ensure that the specimens for the sampleare obtained from throughout the LOT, and are not concentrated in one portionor subLOT of the LOT.
It is possible, but not likely, that in a LOT all of the random numbers could haveus sampling in the morning: we avoid this through the use of subLOTs.
Version 9.0 - 02/2013 4-43

Lesson 4- Statistical ConceptsStudent Manual
Chance Causes of variability are inherent to any method or process and mustb t d Th di d li i thi h t (i libe expected. These were discussed earlier in this chapter (i.e. samplingvariability, testing variability, etc.).
Assignable Causes are those that can be shown directly to cause a variation inthe process (during this operation it was pouring rain, it was extremely coldduring this phase, the equipment used in the placement process was changed,
)etc.).
Version 9.0 - 02/2013 4-44

Lesson 4- Statistical ConceptsStudent Manual
Control Charts are useful tools for monitoring and ensuring the quality of ag g q yproduct or process.
These can be used by the QC Manager as an aid in the Quality Controlprocess and some of their uses include:
-Early detection of trouble
E t bli h t f bilit-Establishment of process capability
-Identify variability of production or process
-Permanent record of quality
Some of the benefits from their use include:
D i ll d t i bilit-Decrease in overall product variability
-Assist in achievement of higher pay adjustments
- Instill a quality awareness
Version 9.0 - 02/2013 4-45

Lesson 4- Statistical ConceptsStudent Manual
8RUN CHART
8
7
6
5
4
1 2 3 4 5 6Test Number
Individual Air Content
8STATISTICAL CHART
7
6
5
4
Version 9.0 - 02/2013
Test Number
4
1 2 3 4 5 6
Mean Air Content
4-46
Lesson 4- Statistical ConceptsStudent Manual
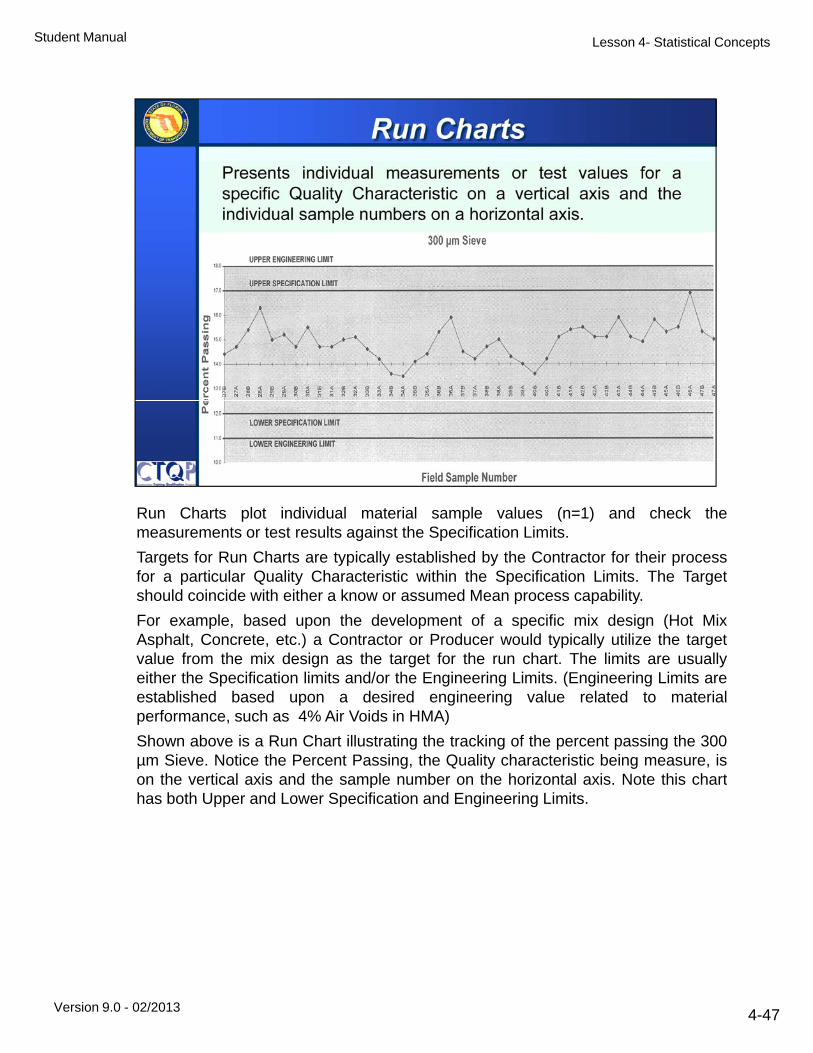
Run Charts plot individual material sample values (n=1) and check thel i h S ifi i Li imeasurements or test results against the Specification Limits.
Targets for Run Charts are typically established by the Contractor for their processfor a particular Quality Characteristic within the Specification Limits. The Targetshould coincide with either a know or assumed Mean process capability.
For example, based upon the development of a specific mix design (Hot MixAsphalt, Concrete, etc.) a Contractor or Producer would typically utilize the targetvalue from the mix design as the target for the run chart. The limits are usuallyeither the Specification limits and/or the Engineering Limits. (Engineering Limits areestablished based upon a desired engineering value related to materialperformance, such as 4% Air Voids in HMA)
Shown above is a Run Chart illustrating the tracking of the percent passing the 300µm Sieve. Notice the Percent Passing, the Quality characteristic being measure, ison the vertical axis and the sample number on the horizontal axis Note this charton the vertical axis and the sample number on the horizontal axis. Note this charthas both Upper and Lower Specification and Engineering Limits.
Version 9.0 - 02/2013 4-47

Lesson 4- Statistical ConceptsStudent Manual
The case study presented here is a Run Chart used by Luck Stone Corporationat their Leesburg Plant The chart is setup for individual tests for a No 88 stoneat their Leesburg Plant. The chart is setup for individual tests for a No. 88 stone.The chart uses a combination of Specification Limits (5 to 30% passing) andplant process limits.
For controlling the No. 88 stone, the No. 4 sieve is identified as the key sieve formeasuring the effect of the change in the “setup”. Setups are the documentationrequired to measure every every change in stone control process. The setupscontain data on the crusher settings required the locations of the various screencontain data on the crusher settings required, the locations of the various screensizes, the screen size and wire cloth screen size.
In this case study, evidence is presented to show the impact of setup change ongradation by the shift in trends from one setup (#1-9) to another (#10-20).Thesetup change was necessitated by the material being coarser than desired,brought on by crusher liner wear. This was noticed by a plant technician whonoticed a run of tests (#1-9) being on the Coarse side of the Target Mean. To( ) g gcompensate for this liner wear, the wire cloth screen size was changed from ¼”cloth to 3/16” cloth, making the product finer. The change was effective as shownby Test #10 being slightly above the Target Mean.
Version 9.0 - 02/2013 4-48

Lesson 4- Statistical ConceptsStudent Manual
Statistical Control Charts always use Subgroups of data rather than individuall lt Th i i S b i i 2 d t i ll i i thsample results. The minimum Subgroup size is n=2 and typically is in the range
of n=3 to 5. (A Subgroup is a predetermined number of samples whose Mean orRange are plotted on a Statistical Control Chart).
There are three primary types of Statistical Charts that are typically used fortransportation construction material Quality Control.
Chart (X Bar)- plots the Grand Mean of Subgroup Means based on thenumber of subgroups.
R Chart- plots the Mean Range for the Subgroup Ranges based upon thenumber of subgroups.
Moving Average Chart- plots a moving average for a predefined number ofsamples or subgroups.
X
p g p
The X Bar and R Charts are the most widely used for the process control ofconstruction materials and both must be used to estimate whether a process isin control. The X Bar chart is used to determine when the center (process Mean)changes and the R Chart is used to determine when the spread (processVariability) changes.
Version 9.0 - 02/2013
y) g
4-49

Lesson 4- Statistical ConceptsStudent Manual
The key element of these charts is the proper designation of the Control ChartLimits, which may not be the same as those used for Acceptance. They aredefined as: Action Limits; statistically derived boundaries applied to a ControlChart in controlling material production or placement.
As shown above, these are expressed as Upper Control Limit (UCL) and theLower Control Limit (LCL). When values of the material characteristics fall withinthese limits, the process is “under control”. When values fall outside the limits,there is an indication that some Assignable Cause is present causing the processthere is an indication that some Assignable Cause is present causing the processto be out of control, such as the vibrator for the compactor broke.
This chart relies on the fact that we may assume that the distribution ofmeasurements surrounding the Mean value occurs within a ±3 StandardDeviations of the Mean. Therefore, think of it as a “bell-shaped” curve turned onits side, as shown above.
Version 9.0 - 02/2013 4-50
Lesson 4- Statistical ConceptsStudent Manual
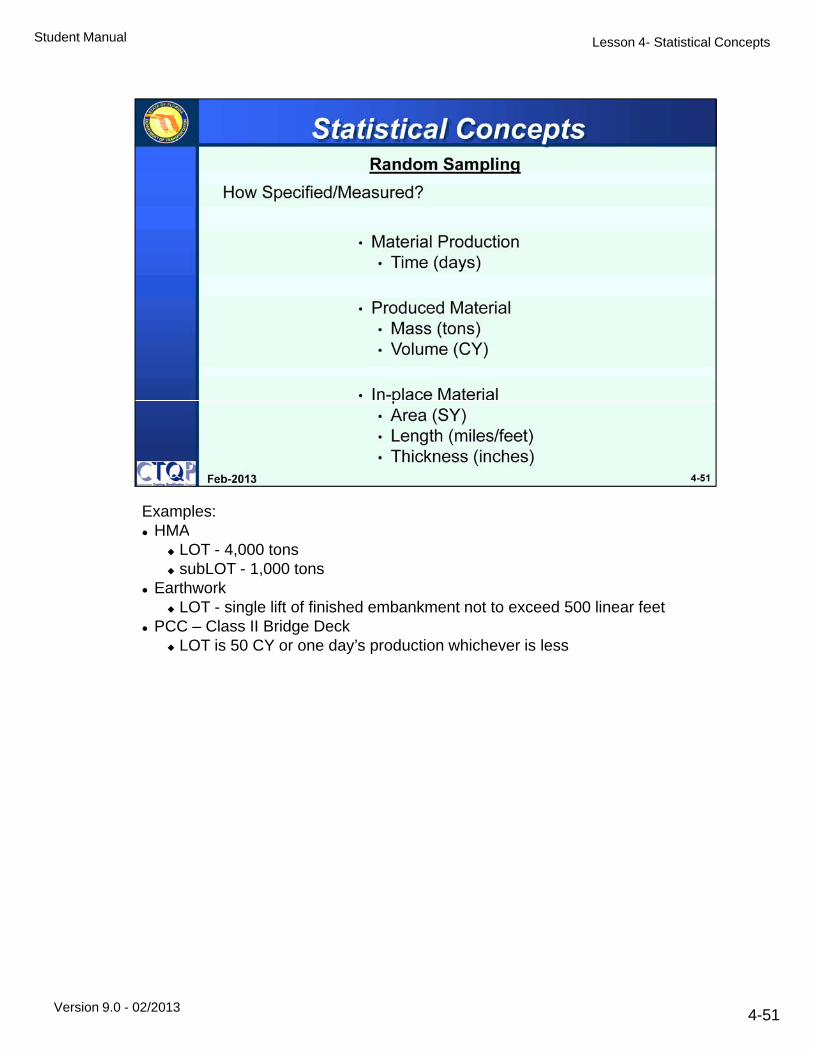
Examples:HMA HMA LOT - 4,000 tons subLOT - 1,000 tons
Earthwork LOT - single lift of finished embankment not to exceed 500 linear feet
PCC – Class II Bridge Deck LOT is 50 CY or one day’s production whichever is lessy p
Version 9.0 - 02/2013 4-51

Lesson 4- Statistical ConceptsStudent Manual
Version 9.0 - 02/2013 4-52

Lesson 4- Statistical ConceptsStudent Manual
Version 9.0 - 02/2013 4-53

Lesson 4- Statistical ConceptsStudent Manual
Now, lets look at some examples on how random sampling is used for each of the materials previously discussed.
Version 9.0 - 02/2013 4-54

Lesson 4- Statistical ConceptsStudent Manual
Suppose a contractor’s technician is to sample a bituminous mixture to obtainmaterial for determination of AC content The LOT size is 4 000 Tons and thematerial for determination of AC content. The LOT size is 4,000 Tons and thesample consists of 3 split samples per 1,000 Ton subLOT. If we assume thatthe LOT begins at the 12,000th Ton, then we can use a random number tableto select the Tons from which the samples will be taken and; therefore, we candetermine from which truck to take our sample.
Version 9.0 - 02/2013 4-55

Lesson 4- Statistical ConceptsStudent Manual
These random numbers are generated by an Excel spreadsheet. Thed h t th t k th b d f th t ti th tspreadsheet then takes these numbers and performs the computations that
determines which ton is sampled for each subLOT.
Version 9.0 - 02/2013 4-56
Lesson 4- Statistical ConceptsStudent Manual
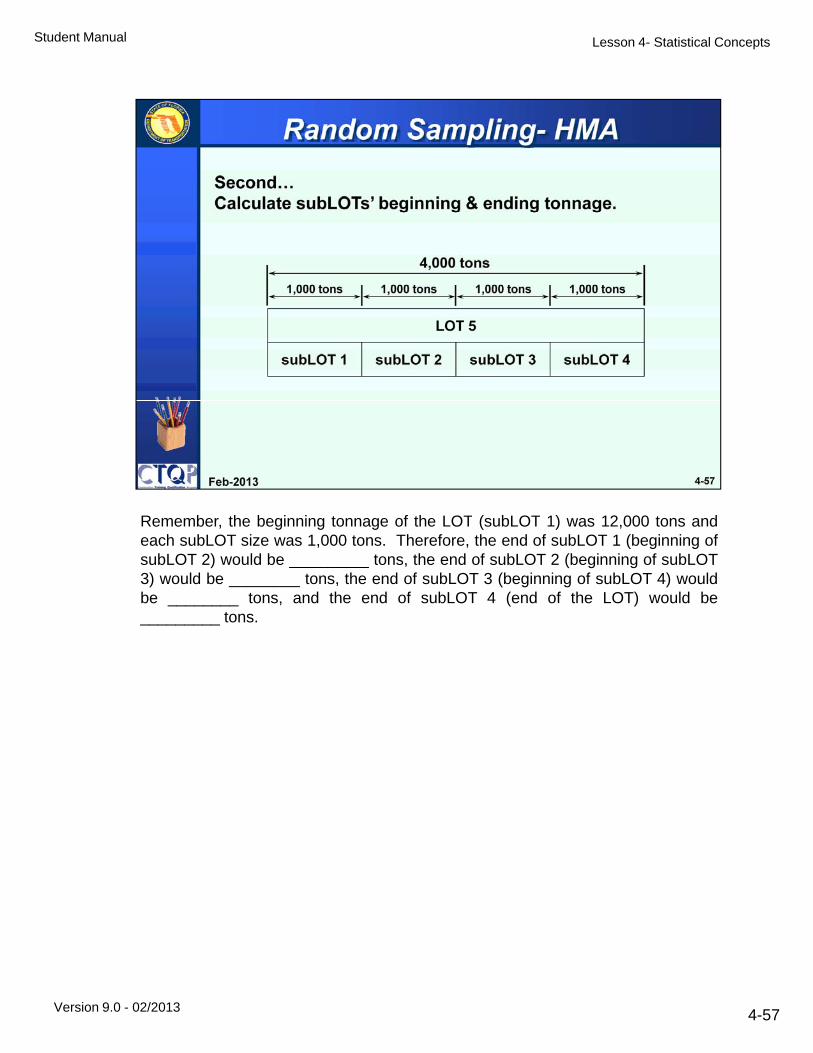
Remember, the beginning tonnage of the LOT (subLOT 1) was 12,000 tons andRemember, the beginning tonnage of the LOT (subLOT 1) was 12,000 tons andeach subLOT size was 1,000 tons. Therefore, the end of subLOT 1 (beginning ofsubLOT 2) would be _________ tons, the end of subLOT 2 (beginning of subLOT3) would be ________ tons, the end of subLOT 3 (beginning of subLOT 4) wouldbe ________ tons, and the end of subLOT 4 (end of the LOT) would be_________ tons.
Version 9.0 - 02/2013 4-57
Lesson 4- Statistical ConceptsStudent Manual
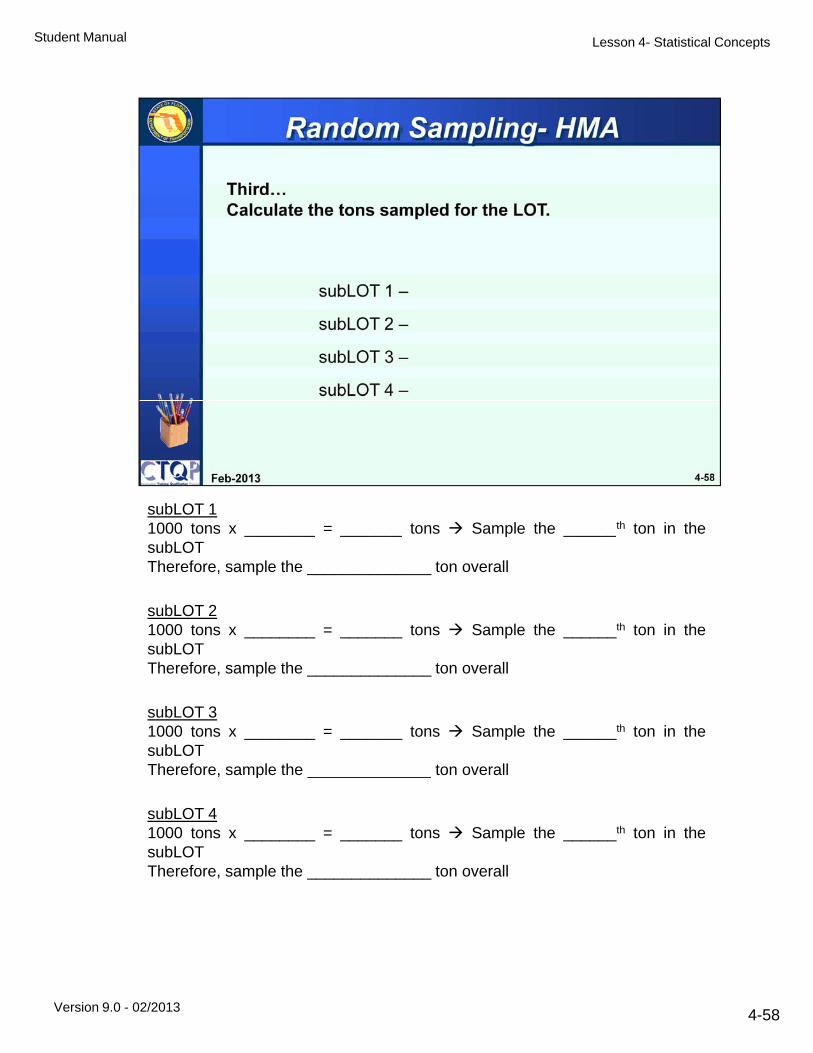
subLOT 11000 tons x = tons Sample the th ton in the1000 tons x ________ = _______ tons Sample the ______th ton in thesubLOTTherefore, sample the ______________ ton overall
subLOT 21000 tons x ________ = _______ tons Sample the ______th ton in thesubLOTsubLOTTherefore, sample the ______________ ton overall
subLOT 31000 tons x ________ = _______ tons Sample the ______th ton in thesubLOTTherefore, sample the ______________ ton overallp ______________
subLOT 41000 tons x ________ = _______ tons Sample the ______th ton in thesubLOTTherefore, sample the ______________ ton overall
Version 9.0 - 02/2013 4-58
Lesson 4- Statistical ConceptsStudent Manual
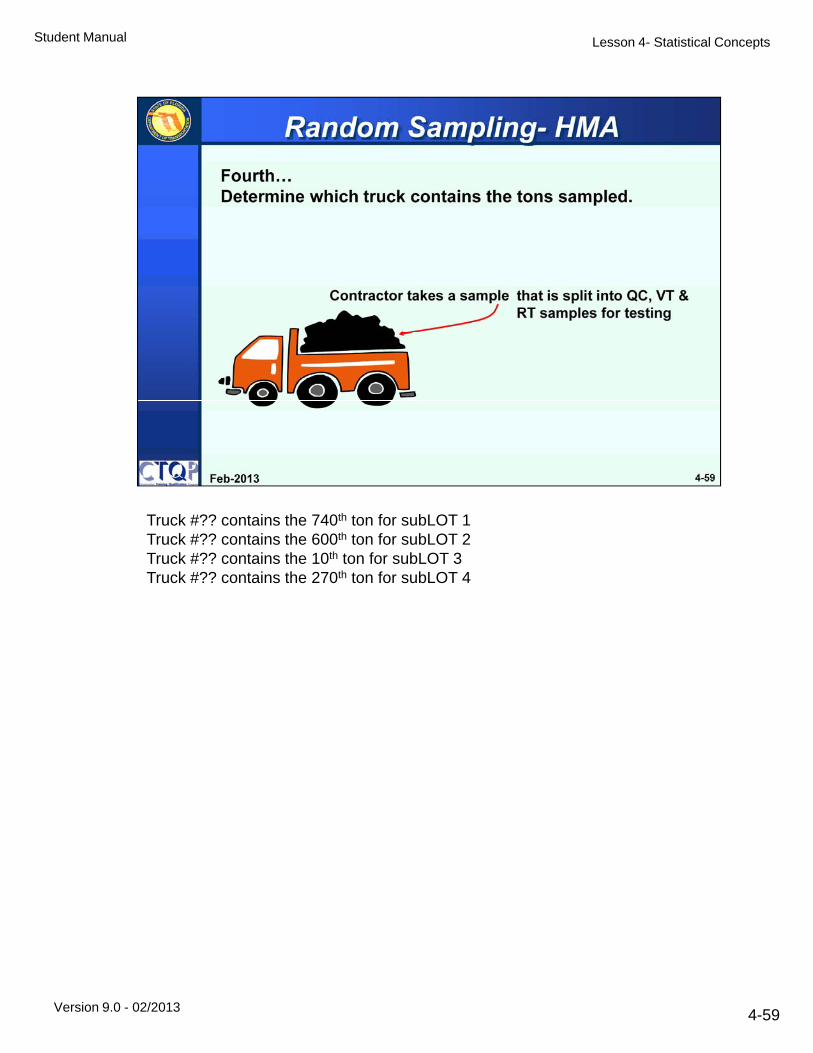
Truck #?? contains the 740th ton for subLOT 1Truck #?? contains the 600th ton for subLOT 2Truck #?? contains the 10th ton for subLOT 3Truck #?? contains the 270th ton for subLOT 4
Version 9.0 - 02/2013 4-59

Lesson 4- Statistical ConceptsStudent Manual
Contractor takes random samples from each subLOT – that is each split intoQC, VT, & RT samples. Then, the Department randomly selects one of thesubLOTs for Verification (VT) testing.
Version 9.0 - 02/2013 4-60

Lesson 4- Statistical ConceptsStudent Manual
Version 9.0 - 02/2013 4-61

Lesson 4- Statistical ConceptsStudent Manual
Version 9.0 - 02/2013 4-62

Lesson 4- Statistical ConceptsStudent Manual
Version 9.0 - 02/2013 4-63
Lesson 4- Statistical ConceptsStudent Manual
Version 9.0 - 02/2013 4-64
Lesson 4- Statistical ConceptsStudent Manual
Version 9.0 - 02/2013 4-65

Lesson 4- Statistical ConceptsStudent Manual
Version 9.0 - 02/2013 4-66

Lesson 4- Statistical ConceptsStudent Manual
These random numbers are generated by an Excel spreadsheet, randomg y p ,number table, or any other approved random number generator.
Version 9.0 - 02/2013 4-67
Lesson 4- Statistical ConceptsStudent Manual
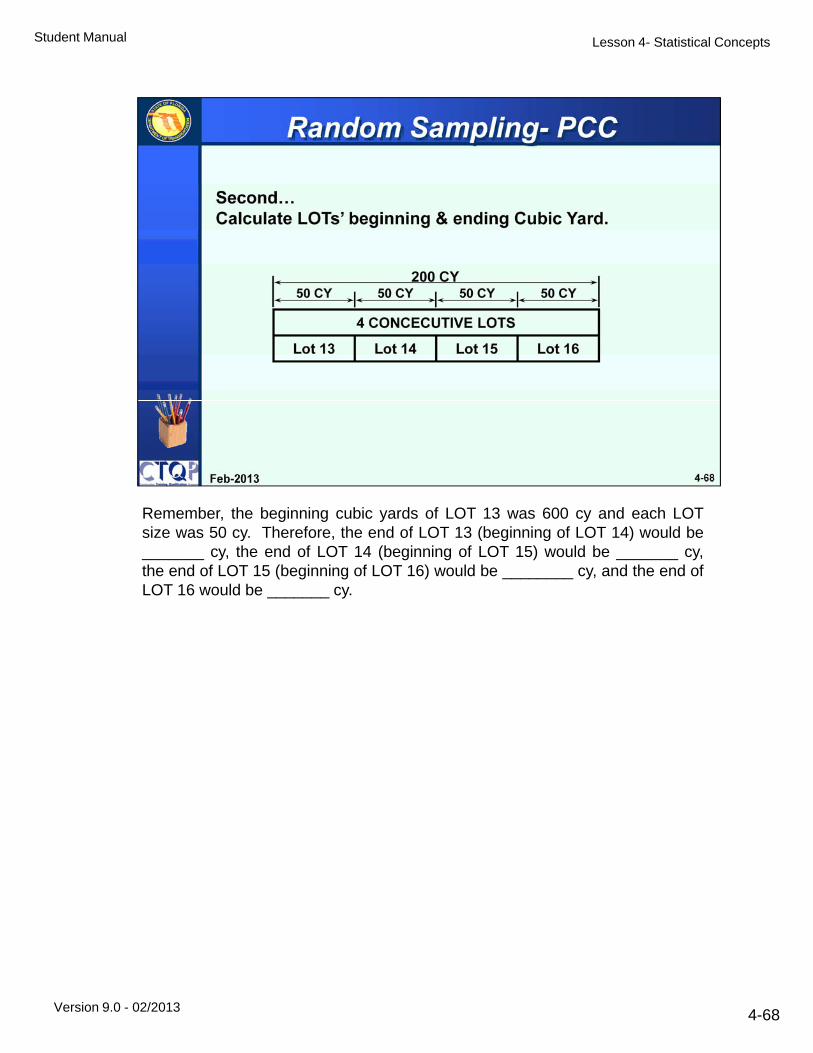
Remember, the beginning cubic yards of LOT 13 was 600 cy and each LOTf f O ( f O )size was 50 cy. Therefore, the end of LOT 13 (beginning of LOT 14) would be
_______ cy, the end of LOT 14 (beginning of LOT 15) would be _______ cy,the end of LOT 15 (beginning of LOT 16) would be ________ cy, and the end ofLOT 16 would be _______ cy.
Version 9.0 - 02/2013 4-68

Lesson 4- Statistical ConceptsStudent Manual
LOT 1350 cy x ______ = _____ cy Sample the _____ cy in the LOTTherefore, sample the _______ CY overall
LOT 1450 cy x _______ = ______ cy Sample the _____ cy in the LOTTherefore, sample the ________ CY overall
LOT 1550 cy x ______ = ______ cy Sample the ______ cy in the LOTTherefore, sample the ________CY overall
LOT 1650 cy x ______ = ______ cy Sample the ______ cy in the LOTTherefore, sample the _______ CY overall
Version 9.0 - 02/2013 4-69
Lesson 4- Statistical ConceptsStudent Manual
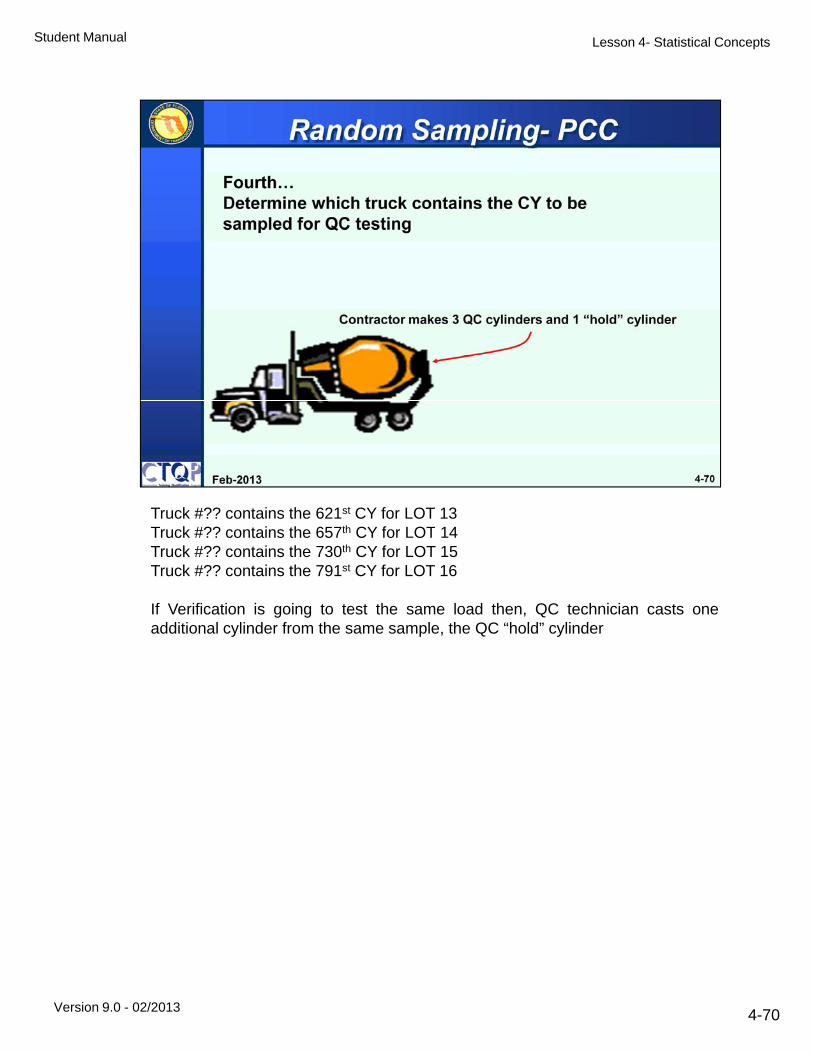
Truck #?? contains the 621st CY for LOT 13#?? th C f OTruck #?? contains the 657th CY for LOT 14
Truck #?? contains the 730th CY for LOT 15Truck #?? contains the 791st CY for LOT 16
If Verification is going to test the same load then, QC technician casts oneadditional cylinder from the same sample, the QC “hold” cylinder
Version 9.0 - 02/2013 4-70
Lesson 4- Statistical ConceptsStudent Manual
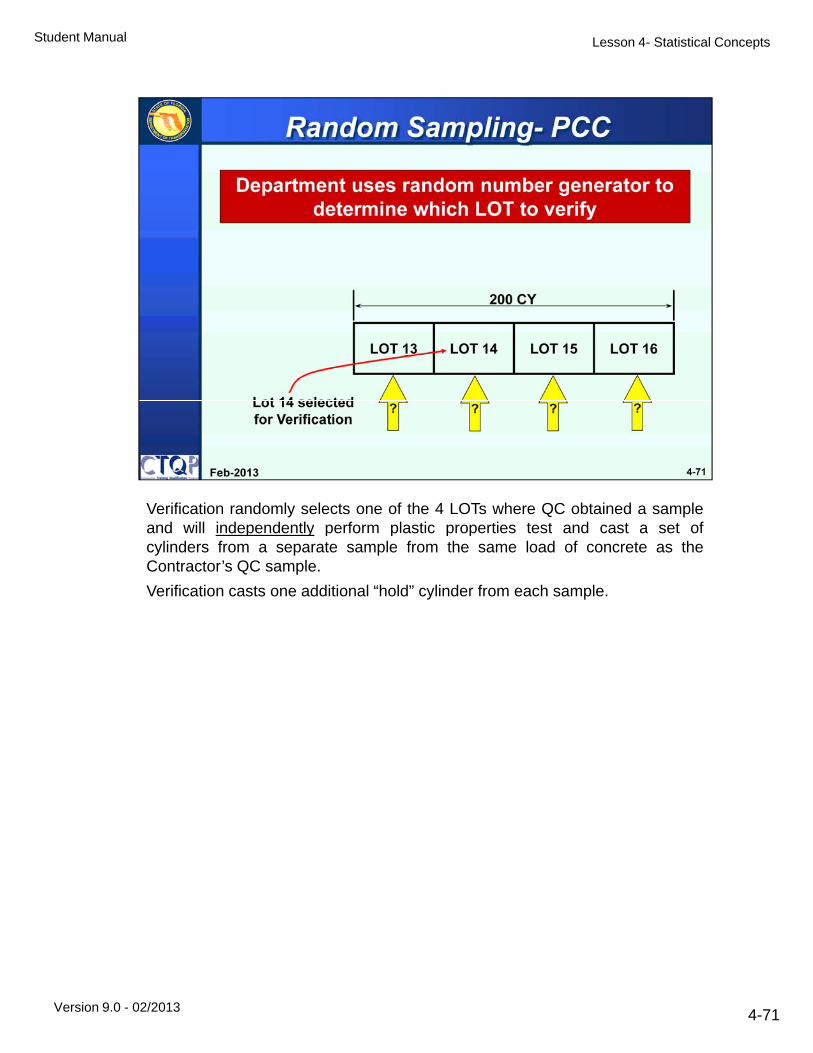
Verification randomly selects one of the 4 LOTs where QC obtained a sampleand will independently perform plastic properties test and cast a set ofand will independently perform plastic properties test and cast a set ofcylinders from a separate sample from the same load of concrete as theContractor’s QC sample.
Verification casts one additional “hold” cylinder from each sample.
Version 9.0 - 02/2013 4-71

Lesson 4- Statistical ConceptsStudent Manual
Suppose a contractor’s technician is to collect material to take to the lab fori d it d t i ti (P t ) Th i th LOT i bmaximum density determination (Proctor). The maximum the LOT size can be
is 500 ft, which is what we have here. The frequency of sampling is one pertwo consecutive LOTs (QC) and one per 8 consecutive LOTs (VT). If weassume that the LOTs in question begins at station 124+78 and 13’ RT of C/LConstruction. Then the QC technician can use a random number table to selectthe stations and offsets from which the samples will be taken.
Version 9.0 - 02/2013 4-72

Lesson 4- Statistical ConceptsStudent Manual
These random numbers are generated by an Excel spreadsheet, randomb bl h d d bnumber table, or any other approved random number generator.
For this exercise in class, write in the Station and first Offset Random Numbersonly.
Version 9.0 - 02/2013 4-73

Lesson 4- Statistical ConceptsStudent Manual
Remember, the beginning station of the LOT 1 was 124+78 and each LOTi 00 fsize was 500 feet.
Therefore: LOT Beginning Station Ending Station
1 124+78
2
3
4
5
6
7
8
Version 9.0 - 02/2013 4-74

Lesson 4- Statistical ConceptsStudent Manual
LOTs 1 & 2Y 1000 f f (124 8) (S i )Y 1000 feet x _____ = _____ feet (124+78) + _____ = ____________ (Station)X 20 feet x ______ = _____ feet _______ = ________ C/L Const.
LOTs 3 & 4Y 1000 feet x _____ = _____ feet (134+78) + _____ = ____________ (Station)X 20 feet x ______ = _____ feet _______ = ________ C/L Const.
LOTs 5& 6Y 1000 feet x _____ = _____ feet (144+78) + _____ = ____________ (Station)X 20 feet x ______ = _____ feet _______ = ________ C/L Const.
LOTs 7 & 8Y 1000 feet x _____ = _____ feet (154+78) + _____ = ____________ (Station)X 20 feet x ______ = _____ feet _______ = ________ C/L Const.
20 ft
Y
X
Version 9.0 - 02/2013
20 ft.
1,000 ft.(2 LOTs)
4-75

Lesson 4- Statistical ConceptsStudent Manual
QC obtains enough material to split into QC, VT, & RT samples (3-way split).g p , , p ( y p )Then, the Verification technician randomly selects one of the 4 split samplesfor Verification (VT) testing.
Version 9.0 - 02/2013 4-76
Lesson 4- Statistical ConceptsStudent Manual
Version 9.0 - 02/2013 4-77

Lesson 4- Statistical ConceptsStudent Manual
Version 9.0 - 02/2013 4-78

Lesson 4- Statistical Concepts
NOTES
Student Manual
Version 9.0 - 02/2013 4-79


