Student Manual Background Enzymes Enzymes are typically proteins (some nucleic acids have also been found to be enzymes) that act as catalysts, speeding up chemical reactions that would take far too long to occur on their own. Enzymes speed up the vast majority of the chemical reactions that occur in cells. Reactions that break down molecules (such as those involved in digestion and cellular respiration) and those that build up molecules (such as the ones involved in photosynthesis and DNA replication) all require enzymes. Each type of enzyme has a specific shape that compliments the structure of its substrate (Figure 5). The substrate is the molecule or molecules that the enzyme converts into product. The substrate fits into an indentation in the globular protein called the active site. The shape and chemical properties of this active site are critical to the enzyme’s function. Fig. 5. A schematic of cellobiose and cellobiase in solution. A. Cellobiose in solution is composed of two glucose molecules covalently connected by a b 1–4 linkage. B. Cellobiase has a pocket that fits the cellobiose molecule. C. Cellobiase helps stabilize the cellobiose in a shape so that the bond between the two glucose molecules can be broken. D. Once the b 1–4 bond in cellobiose has been broken, the two glucose molecules are released from the cellobiase, and the enzyme is free to bind to another molecule of cellobiose and begin the cycle again. Many chemical reactions that enzymes speed up can occur at a much slower rate without the enzymes. Enzymes speed up reactions by positioning the substrates, adjusting their bonds so that they become unstable and reactive. Let’s use the analogy of a friend setting up a blind date. The two people may have found each other on their own and made the connection, but the matchmaker sped up the process by putting the two people in the same room at the same time. The matchmaker may have also influenced the couple by pointing out the good points about each individual. Like enzymes, the matchmaker did not change and he/she was able to go on and make further matches. In chemical terms, the enzyme lowers the energy of activation of a reaction. This is the amount of energy required to get the reaction going. Enzymes also stabilize the transition state of the reaction. The transition state is the structure in the reaction with the highest energy. By lowering this energy, the reaction can take place much more easily. Enzymes are “picky” about the conditions at which they work best. The temperature and pH must be ideal for the enzyme to catalyze reactions efficiently. For any chemical reaction, raising the temperature will increase the movement of the molecules and cause more collisions to occur. It increases the average kinetic energy (energy of movement) of the molecules so that more of them will be able to react. However, in an enzymatic reaction, 37 STUDENT MANUAL BACKGROUND Student Manual A B C D
Transcript
Student Manual
Background
Enzymes
Enzymes are typically proteins (some nucleic acids have also been found to be enzymes)that act as catalysts, speeding up chemical reactions that would take far too long to occuron their own. Enzymes speed up the vast majority of the chemical reactions that occur incells. Reactions that break down molecules (such as those involved in digestion and cellularrespiration) and those that build up molecules (such as the ones involved in photosynthesisand DNA replication) all require enzymes. Each type of enzyme has a specific shape thatcompliments the structure of its substrate (Figure 5). The substrate is the molecule ormolecules that the enzyme converts into product. The substrate fits into an indentation inthe globular protein called the active site. The shape and chemical properties of this activesite are critical to the enzyme’s function.
Fig. 5. A schematic of cellobiose and cellobiase in solution. A. Cellobiose in solution is composed of two glucose molecules covalently connected by a b 1–4 linkage. B. Cellobiase has a pocket that fits the cellobiosemolecule. C. Cellobiase helps stabilize the cellobiose in a shape so that the bond between the two glucosemolecules can be broken. D. Once the b 1–4 bond in cellobiose has been broken, the two glucose molecules arereleased from the cellobiase, and the enzyme is free to bind to another molecule of cellobiose and begin the cycleagain.
Many chemical reactions that enzymes speed up can occur at a much slower rate withoutthe enzymes. Enzymes speed up reactions by positioning the substrates, adjusting theirbonds so that they become unstable and reactive. Let’s use the analogy of a friend settingup a blind date. The two people may have found each other on their own and made theconnection, but the matchmaker sped up the process by putting the two people in the sameroom at the same time. The matchmaker may have also influenced the couple by pointingout the good points about each individual. Like enzymes, the matchmaker did not changeand he/she was able to go on and make further matches. In chemical terms, the enzymelowers the energy of activation of a reaction. This is the amount of energy required to getthe reaction going. Enzymes also stabilize the transition state of the reaction. The transitionstate is the structure in the reaction with the highest energy. By lowering this energy, thereaction can take place much more easily.
Enzymes are “picky” about the conditions at which they work best. The temperature and pHmust be ideal for the enzyme to catalyze reactions efficiently. For any chemical reaction,raising the temperature will increase the movement of the molecules and cause more collisions to occur. It increases the average kinetic energy (energy of movement) of themolecules so that more of them will be able to react. However, in an enzymatic reaction,
37
ST
UD
EN
T M
AN
UA
LB
AC
KG
RO
UN
D
Student Manual
A
B
C
D
too much heat is a bad thing. You may recall from studying about proteins that the non-covalent interactions within the protein, such as hydrogen and ionic bonds, can breakat high temperatures. This will change the shape of the enzyme. If the enzyme changesshape, then the active site will not fit the substrate properly and the enzyme will not be ableto function.
Cellobiase Enzyme
In this laboratory experiment, you will be studying cellobiase. Cellobiase is involved in thelast step of the process of breaking down cellulose, a molecule made up of bundled longchains of glucose that are found in plant cell walls, to glucose. This is a natural process thatis used by many fungi as well as bacteria (some present in termite guts, others in the stomachs of ruminants and also in compost piles) to produce glucose as a food source.Breaking down the cellulose from plants into sugar is also an important step in the creationof ethanol for fuel.
Cellobiase Substrates
The natural substrate for the enzyme cellobiase is cellobiose (Figure 6). This is a dis-sacharide composed of two beta glucose molecules. However, when scientists studyenzyme function, it is best if there is an easy way to detect either the amount of substratethat is used up or the amount of product that is formed. Solutions of cellobiose (substrate)and glucose (product) are clear, and there are not many simple, inexpensive, fast methodsto detect these molecules quantitatively.
Fig. 6. Breakdown of cellobiose by cellobiase. The natural substrate of cellobiase is the dissacharide cellobiose.When cellobiose is bound by cellobiase, the cellobiase breaks apart the b 1–4 bond that connects the two glucosemolecules and then releases two glucose molecules.
So, to make this reaction easier to follow, an artificial substrate, p-nitrophenyl glucopyranoside,will be used. This artificial substrate can also bind to the enzyme and be broken down in amanner similar to the natural substrate cellobiose. When the artificial substrate, p-nitrophenylglucopyranoside, is broken down by cellobiase, it produces glucose and p-nitrophenol(Figure 7). When p-nitrophenol is mixed with a solution that is basic in pH (such as the stopsolution provided in the kit), it will turn yellow. The amount of yellow color is proportional tothe amount of p-nitrophenol present. And for every molecule of p-nitrophenol present, onemolecule of p-nitrophenyl glucopyranoside is broken apart. For the cellobiase reactionsbeing run, another advantage of using a basic solution to develop the color of the p-nitrophenolis that the basic pH will also denature the enzyme and stop the reaction.
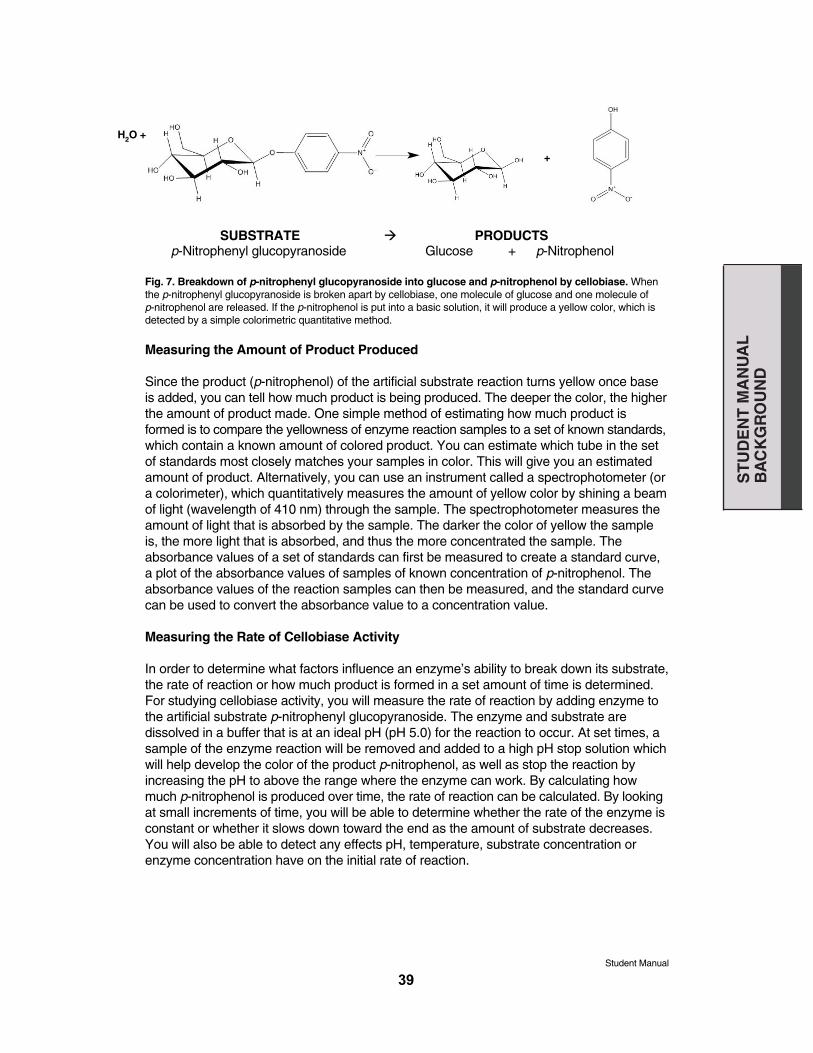
Fig. 7. Breakdown of p-nitrophenyl glucopyranoside into glucose and p-nitrophenol by cellobiase. Whenthe p-nitrophenyl glucopyranoside is broken apart by cellobiase, one molecule of glucose and one molecule of p-nitrophenol are released. If the p-nitrophenol is put into a basic solution, it will produce a yellow color, which isdetected by a simple colorimetric quantitative method.
Measuring the Amount of Product Produced
Since the product (p-nitrophenol) of the artificial substrate reaction turns yellow once baseis added, you can tell how much product is being produced. The deeper the color, the higherthe amount of product made. One simple method of estimating how much product isformed is to compare the yellowness of enzyme reaction samples to a set of known standards,which contain a known amount of colored product. You can estimate which tube in the setof standards most closely matches your samples in color. This will give you an estimatedamount of product. Alternatively, you can use an instrument called a spectrophotometer (ora colorimeter), which quantitatively measures the amount of yellow color by shining a beamof light (wavelength of 410 nm) through the sample. The spectrophotometer measures theamount of light that is absorbed by the sample. The darker the color of yellow the sampleis, the more light that is absorbed, and thus the more concentrated the sample. Theabsorbance values of a set of standards can first be measured to create a standard curve,a plot of the absorbance values of samples of known concentration of p-nitrophenol. Theabsorbance values of the reaction samples can then be measured, and the standard curvecan be used to convert the absorbance value to a concentration value.
Measuring the Rate of Cellobiase Activity
In order to determine what factors influence an enzyme’s ability to break down its substrate,the rate of reaction or how much product is formed in a set amount of time is determined.For studying cellobiase activity, you will measure the rate of reaction by adding enzyme tothe artificial substrate p-nitrophenyl glucopyranoside. The enzyme and substrate are dissolved in a buffer that is at an ideal pH (pH 5.0) for the reaction to occur. At set times, asample of the enzyme reaction will be removed and added to a high pH stop solution whichwill help develop the color of the product p-nitrophenol, as well as stop the reaction byincreasing the pH to above the range where the enzyme can work. By calculating howmuch p-nitrophenol is produced over time, the rate of reaction can be calculated. By lookingat small increments of time, you will be able to determine whether the rate of the enzyme isconstant or whether it slows down toward the end as the amount of substrate decreases.You will also be able to detect any effects pH, temperature, substrate concentration orenzyme concentration have on the initial rate of reaction.
39
Student Manual
ST
UD
EN
T M
AN
UA
LB
AC
KG
RO
UN
D
+
H2O +
Pre-lab Questions
1. What type of molecule is an enzyme?
2. Why is an enzyme’s shape important to its function?
3. How does an enzyme speed up chemical reactions?
4. What is the name of the enzyme involved in this laboratory experiment?
5. What is one practical, industrial application of this enzyme?
40
Student Manual
ST
UD
EN
T M
AN
UA
LB
AC
KG
RO
UN
D
6. What is the natural product of this enzyme?
7. What is the natural substrate of this enzyme?
8. How will you be able to determine the amount of product that is produced at each timeperiod?
9. How can you measure the rate of product formation?
41
ST
UD
EN
T M
AN
UA
LB
AC
KG
RO
UN
D
Student Manual
Activity 3: Determine the Effect of pH on Reaction Rate
One of the ways that enzymes interact with their substrates is by charge groups on onemolecule attracted to the oppositely charged groups on the other molecule. However, if thepH which the substrate and enzyme see is changed, it is possible that the positively andnegatively charged groups can change or lose their charge. Not only is it possible for thepH to affect the enzyme, it can also affect the substrate. The net result for this is that theenzyme and substrate will no longer interact in an optimal fashion. Similar to enzymes optimized to work at high or low temperatures in organisms that live in these conditions, different enzymes are optimized to work at different pH values. Enzymes that are present inthe stomach, for example, are optimized to work at low pH values around pH 3 (acidic conditions), while pancreatic enzymes that are secreted into the small intestine only work inneutral to basic conditions (pH 7.2–9.0).
Student Workstation Quantity (✔)
3.0 mM substrate 1 ❐
Enzyme 1 ❐
Stop solution 1 ❐
Colorimetric standards (S1–S5) in cuvettes from Activity 1 1 of each ❐
1.5 ml microcentrifuge tubes 1 of each ❐(labeled “pH 5.0”, “pH 6.3”, and “pH 8.6”)
DPTPs 4 ❐
Cuvettes 3 ❐
Marker 1 ❐
Beaker with deionized or distilled water to rinse DPTPs 1 ❐
Stopwatch or timer 1 ❐
Instructor’s Workstation (Optional) Quantity (✔)
Spectrophotometer 1 ❐
Note: The concentration of substrate used in this activity is different from the one used inprevious activities. The substrate you should be using for this activity is 3.0 mM to accountfor the dilution step that occurs when you add the pH adjustment buffers.
Protocol
1. Label your cuvettes “pH 5.0”, “pH 6.3”, and “pH 8.6”. Only label on the upper part of thecuvette face.
58
ST
UD
EN
T M
AN
UA
LA
CT
IVIT
Y 3
Student Manual
Label up here
2. Using a clean DPTP, pipet 500 µl of stop solution into each cuvette. Wash the DPTPout thoroughly with clean water.
Stop solution pH 5.0 pH 6.3 pH 8.6
3. Using a clean DPTP, pipet 250 µl of 3.0 mM substrate into each microcentrifuge tubelabeled “pH 5.0”, “pH 6.3” and “pH 8.6” by your instructor. Wash the DPTP out thoroughlywith water.
3.0 mM substrate pH 5.0 pH 6.3 pH 8.6
4. Have a stopwatch ready. Using a clean DPTP, add 250 µl of enzyme to each of thelabeled microcentrifuge tubes and start your stopwatch.
Enzyme pH 5.0 pH 6.3 pH 8.6
59
ST
UD
EN
T M
AN
UA
LA
CT
IVIT
Y 3
Student Manual
5. After 2 minutes, using a clean DPTP for each pH reaction, transfer 500 µl of your reaction to the appropriately labeled cuvette containing stop solution.
pH 5.0 pH 5.0 pH 6.3 pH 6.3 pH 8.6 pH 8.6
6. After all of your samples have been analyzed, rinse out the DPTPs and cuvettes usedin this activity with copious amounts of water and save them for future activities.
Note: Do not discard the unused stock solutions or cuvettes containing standards. Theywill be used for the next activity.
Qualitative Analysis of the Amount of Product Formed at Different pH Levels
1. You should have five cuvettes of standards labeled S1–S5 at your lab bench. Takeyour pH 5.0, pH 6.3, and pH 8.6 cuvette samples and make a note of the standardnumber that each cuvette color matches the closest. Write down the concentration ofthat standard (from Table 8) in Table 9 for each of your pH reaction samples.
Table 9. Determination of p-nitrophenol produced at three different pH valuesbased on p-nitrophenol standards.
2. If you do not have a spectrophotometer, please skip ahead to Analysis of Results.
pH Standard That Is Most Similar
Amount of p-Nitrophenol Produced (nmol)
pH 5.0 pH 6.3 pH 8.6
Standard Amount of p-Nitrophenol (nmol*) S1 0 S2 12.5 S3 25 S4 50 S5 100
60
ST
UD
EN
T M
AN
UA
LA
CT
IVIT
Y 3
Student Manual
Quantitative Analysis of the Amount of Product Formed at Different pH Levels
1. Blank your spectrophotometer with the S1 standard at 410 nm, and then measure theabsorbance values for your three cuvettes. Record the absorbance values in Table 10.
2. Following the same protocol used in Activity 1, convert the amount of product you havefrom units of absorbance measured on the spectrophotometer to units of concentration(nmol). Fill these values in the third column on Table 10.
Table 10. Determination of p-nitrophenol produced at three different pH valuesbased on a standard curve (similar to the one shown in Figure 8).
Analysis of Results
1. Calculate the initial rate of reaction at each of the three different pH levels. Since youonly measured the amount of p-nitrophenol at one time point (2 minutes), assume thatthe amount of p-nitrophenol at 0 minutes is 0.
Example: After 2 minutes, the pH 6.3 sample gave an absorbance reading at 410 nm of0.14, which looked most similar to standard S2. Qualitatively (using the standards), thismeans that you have ~12.5 nmol of p-nitrophenol. Quantitatively, you would use the standard curve you generated in Activity 1 to determine the amount of p-nitrophenol with anabsorbance of 0.14 corresponds to ~9 nmol.
The initial rate for the qualitative data = (12.5 nmol – 0 nmol)/(2 min – 0 min) = ~6 nmol/min.
The initial rate for the quantitative data = (9 nmol – 0 nmol)/(2 min – 0 min) = 4.5 nmol/min.
Perform these calculations for your data
Initial rate of product formation at pH 5.0 =________________________nmol/min
Initial rate of product formation at pH 6.3 =________________________nmol/min
Initial rate of product formation at pH 8.6 =________________________nmol/min
pH Absorbance at 410 nm
Amount of p-Nitrophenol Produced (nmol)
pH 5.0 pH 6.3 pH 8.6
61
ST
UD
EN
T M
AN
UA
LA
CT
IVIT
Y 3
Student Manual
2. Plot the effect of pH on the rate of the enzymatic reaction.
Activity 3 Analysis Questions
1. How can you determine the initial rate of the reaction for each pH?
2. At what pH do you think this enzyme works best? How did you come up with youranswer?
3. Why do most enzymatic reactions slow down at extremely high or low pH values?
4. In what type of environment might an organism that produces this enzyme live? Explainyour reasoning.