Students Exposed to Trauma: An Efficacy Study of CBITS 25 th Annual Children's Mental Health Research & Policy Conference Michelle Woodbridge, Ph.D. W. Carl Sumi, Ph.D. Kristen Rouspil, M.P.H. March 2012 SRI International
Transcript
Students Exposed to Trauma: An Efficacy Study of CBITS
25th Annual Children's Mental Health
Research & Policy Conference
Michelle Woodbridge, Ph.D.
W. Carl Sumi, Ph.D.
Kristen Rouspil, M.P.H. March 2012
SRI International
Outline of presentation
2
Brief overview of:
– The effects of trauma on children
– The Cognitive Behavioral Intervention for Trauma in Schools (CBITS) program
Description of study design
Summary of preliminary results:
– Trauma screening
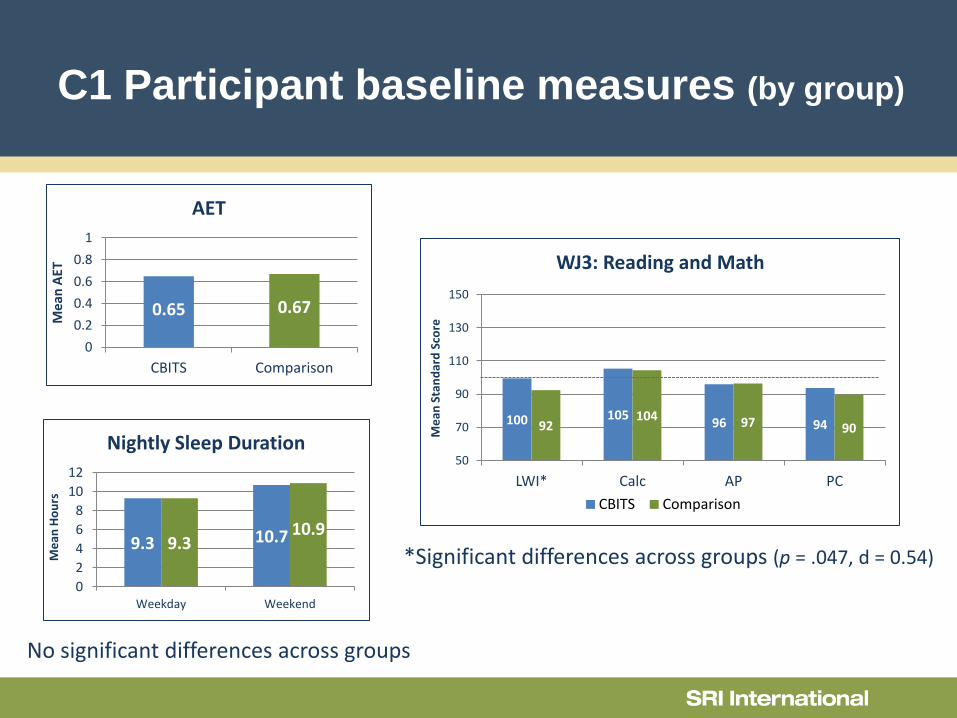
– Baseline measures
Trauma and CBITS
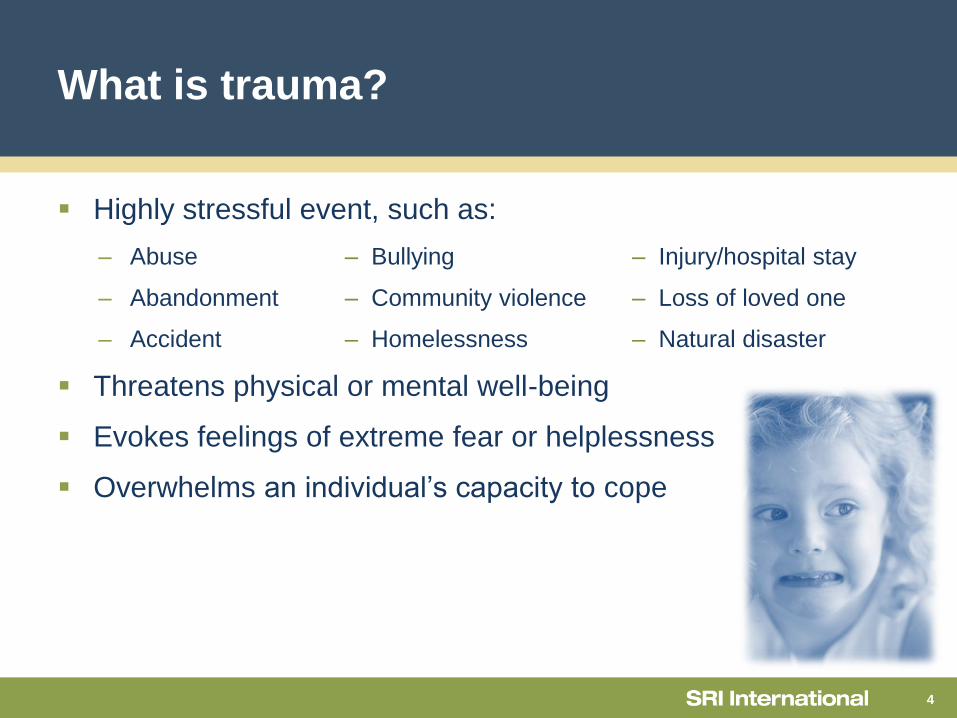
What is trauma?
4
Highly stressful event, such as:
– Abuse – Bullying – Injury/hospital stay
– Abandonment – Community violence – Loss of loved one
– Accident – Homelessness – Natural disaster
Threatens physical or mental well-being
Evokes feelings of extreme fear or helplessness
Overwhelms an individual’s capacity to cope
Effects of trauma on children
5
20%–50% of children in the U.S. are victims or witnesses of violence
Symptoms of trauma may include:
– Isolation – Hyperactivity – Aggression
– Sadness – Distraction – Fearfulness
Children exposed to violence are more likely to have: – Behavior problems
– Poor school performance
– Problems with authority/directions
– More school absences
– Somatic complaints
– Symptoms of depression
– Fewer friends
CBITS program overview
6
School-based intervention developed by UCLA, RAND, & LAUSD
– Delivered to students experiencing significant distress due to trauma
• Implementers = MSWs, licensed psychologists, or interns
– Tailored for the school setting and diverse populations
– 10 weekly student group sessions, 1 individual (1-on-1) session
• Two parent education meetings
Cognitive behavioral techniques • Education about common reactions to trauma
• Relaxation training: imaginal exposure
• Cognitive therapy: fear thermometer
• Real life exposure: fear hierarchy and coping strategies
• Stress or trauma memory: drawing/writing exercises
• Social problem-solving: HOT seat
Goals of CBITS
7
Reduce symptoms of: – Post traumatic stress
– General anxiety
– Depression
– Low self-esteem
– Aggression and impulsivity
– Other behavior problems
Build resilience – Coping and decision making skills
– Communication and social skills
– Self care and self regulation
Increase peer and parent support
CBITS evidence
8
Cited as recommended practice by:
– U.S. Dept of Justice (OJJDP) (Exemplary Program)
– Promising Practices Network (Proven Program)
– White House’s Helping America’s Youth (Highest Quality Evidence)
– CDC Prevention Research Center (Effective Program)
– SAMHSA’s National Registry (3.8/4.0 Dissemination Rating)
– National Child Traumatic Stress Network
Previous research findings include:
– Increased coping skills
– Reduced trauma (PTSD) symptoms
– Reduced depression symptoms
– Reduced psychosocial dysfunction
CBITS Website
9
www.cbitsprogram.org
Registration is free for:
– On-line training
– Sample materials and forms
– Implementation assistance
– Video clips
– On-line community of
experts and colleagues
• Advice, networking, sharing
materials
CBITS Study Design
Funders and partners
11
Funders
– Department of Education, IES, NCSER (Goal 3 RCT)
Partners:
– Local School District: Learning Support Professionals (LSP)
– UCLA: training, technical assistance, and fidelity rating