STUDENTS’ PERCEPTIONS OF INSTITUTIONAL SUPPORT FOR THE LEEP LEARNING OUTCOMES: A Clark University Collegewide Assessment Report Vol. 1, No. 2, July 2015 An Analysis Using NSSE 2014 SURVEY Data 1 2 3 4 5 1. Knowledge of the natural world and human cultures and societies 2. Intellectual and practical skills 3. Personal and social responsibility 4. Ability to integrate knowledge and skills CLARK’S DEFINING CONTRIBUTION 5. Capacities of effective practice including creativity and imagination, self-directedness, resilience and persistence, and the ability to collaborate across differences and manage complexity
Transcript
S T U D E N T S ’ P E R C E P T I O N S O F I N S T I T U T I O N A L S U P P O R T F O R T H E L E E P L E A R N I N G O U T C O M E S :
A Clark University Collegewide
Assessment Report
Vol. 1, No. 2, July 2015
An Analysis Using NSSE 2014 SURVEY Data
1
2
3
45
1. Knowledge of the natural world and human cultures and societies
2. Intellectual and practical skills
3. Personal and social responsibility
4. Ability to integrate knowledge and skills
C L A R K ’ S D E F I N I N G C O N T R I B U T I O N 5. Capacities of effective practice including creativity and imagination, self-directedness, resilience and persistence, and the ability to collaborate across differences and manage complexity
STUDENTS’ PERCEPTIONS OF INSTITUTIONAL SUPPORT FOR THE LEEP LEARNING OUTCOMES | 2
t
Nt
S
W
t
Michelle BataLEEP Center
Katerine BielaczycHiatt Center
Nancy BudwigAcademic Affairs
Greg DoerschlerInstitutional Research
Li HanMath & Computer Science
Jeff HimmelbergerInstitutional Research
Matt MalskyVisual & Performing Arts(effective summer 2015: Dean of the College)
Robert RiddlesCorporate & Foundation Relations
Marianne SarkisInternational Development, Community, and Environment (IDCE); Center for Excellence in Teaching and Learning (CETL)
Cheryl Turner ElwellITS/Academic Technology
The LEEP Compass Advisory Committee provides feedback to and assists the academic administration with developing Clark’s research and evaluation of the LEEP Learning Outcomes.
Published by: Clark University 950 Main StreetWorcester, MA 01610
This report has been provided by Clark’s Compass Advisory Committee. For additional reports and information about LEEP assessment, please visit clarku.edu/leepcompass.
L E E P C O M PA S S A D V I S O R Y C O M M I T T E E
S E C T I O N 1 : A B O U T T H E R E P O R T1 Liberal Education at Clark University2 About This Report3 About the Data in This Report3 The Organization of This Report
S E C T I O N 2 : A S N A P S H OT
4 Clark First-Years (FY) and Seniors (SR) compared with NSSE Peers
S E C T I O N 3 : S U M M A R Y A N D T R E N D S
6 LEEP Outcome #2: Intellectual and Practical Skills
8 LEEP Outcome #3: Personal and Social Responsibility
10 LEEP Outcome #4: Integrative and Applied Learning
12 LEEP Outcome #5: Capacities of Effective Practice
S E C T I O N 4 : A P P E N D I C E S
14 Appendix A: The National Survey of Student Engagement (NSSE)
16 Appendix B: Specific NSSE Questions Selected by AAC&U as Aligning with the Essential Learning Outcomes
18 Appendix D: Overview Analysis of All Four Outcomes: Clark FY Compared with NSSE FY 2014
19 Appendix E: Overview Analysis of All Four Outcomes: Clark SR Compared with NSSE SR 2014
20 Appendix F: The Student Experience in Brief—Clark University
TABLE OF CONTENTS
Clark LEEP Compass ReportVOL. 1 , NO. 2 | JULY 2015
Nancy Budwig
Co-Editor
Marianne Sarkis
Analyst and Co-Editor
Jeff Himmelberger
NSSE Data Management
Greg Doerschler
NSSE Data Management
Keith Carville
Creative Director, Design
Lori Fearebay
Creative Services Manager
Melissa Lynch
Marketing Communications Associate
t
N
t
S
E
W
t
t
STUDENTS’ PERCEPTIONS OF INSTITUTIONAL SUPPORT FOR THE LEEP LEARNING OUTCOMES | 1
T H E A S S O C I AT I O N O F A M E R I C A N C O L L E G E S A N D U N I V E R S I T I E S ( A A C & U ) LEAP Initiative has developed a set of “essential learning outcomes” that provided the model Clark used as a starting point for a revised and extended statement of liberal learning at the University. In 2009, Clark faculty unanimously voted to accept the statement below as a description of liberal education at Clark University and adopted the following five learning outcomes.
Clark is a small research university that values liberal education. We aspire to engender in our students a love of learning, a respect for inquiry and imagination, and a spirit of engagement with the world in all its diversity and complexity. At Clark, a student’s pursuit of liberal education is understood as a developmental and socially situated process that engages students actively in constructing knowledge. Clark graduates will be liberally educated people who possess and can demonstrate the following five characteristics:
1. Liberal Education and America’s Promise: see College Learning for the New Global Century (AAC&U, 2007). The LEAP Outcomes are summarized at http://www.aacu.org/leap/vision.cfm.
2
1
3
4
5
Knowledge of Human Cultures and the Natural World — including the ability to employ different ways of knowing
Practiced extensively across the curriculum, in the context of progressively more challenging problems, projects, and standards for performance
LEARNING OUTCOME 1:
Intellectual and Practical Skills — including inquiry and analysis, the generation and evaluation of evidence and argument, critical and creative thinking, written and oral communication, quantitative literacy, information literacy, teamwork and problem-solving
Focused by rigorous engagement with big questions, both contemporary and enduring
LEARNING OUTCOME 2:
Personal and Social Responsibility — including ethical reasoning and action, the intercultural understanding and competence to participate in a global society, civic knowledge and engagement locally as well as globally, and the lifelong habits of critical self-reflection and learning
Anchored through active involvement with diverse communities and real-world challenges, taking particular advantage of Clark’s urban location and global connections
LEARNING OUTCOME 3:
Ability to Integrate Knowledge and Skills — including synthesis and advanced accomplishment across general and specialized studies, bridging disciplinary and interdisciplinary thinking, and connecting the classroom and the world
Experienced through progressively more advanced knowledge creation, contextual reasoning, and the construction of shared meaning and opportunities for reflection
LEARNING OUTCOME 4:
Capacities of Effective Practice — including creativity and imagination, self-directedness, resilience and persistence, and the abilities to collaborate with others across differences and to manage complexity and uncertainty
Demonstrated by application of knowledge and skills to issues of consequence and by emerging membership in larger communities of scholarship or practice
LEARNING OUTCOME 5:
LIBERAL EDUCATION AT CLARK UNIVERSITY
STUDENTS’ PERCEPTIONS OF INSTITUTIONAL SUPPORT FOR THE LEEP LEARNING OUTCOMES | 2
ABOUT THIS REPORT
Clark students are provided the opportunity to participate in NSSE surveys approximately every three years, so that the University can sample the same students in their first and fourth years. This report includes NSSE first-year and senior data collected in 2004, 2006, 2009, 2011, and 2014. The next round of NSSE data collection on Clark’s campus will be in Spring 2017, allowing a similar report to be generated in three years. The response rates have varied over the years (see Table 1), and steps are being taken to enhance the likelihood of increased student participation in the NSSE surveys.
In 2014, NSSE made some significant changes to the survey that had been in use since 20001. While the majority of the questions used in previous NSSE surveys remained with minor changes, three questions that particularly corresponded to Outcomes 1, 2, and 3 were dropped from the NSSE 2014 instrument, and thus can no longer be used for comparison in this report2.
N S S E Q U I C K FA C T S 3
Participating Institutions: 716 colleges and universities participated in NSSE 2014; 1,574 have participated since 2000.
Student Participation: 578,892 students completed NSSE in 2014. Approximately 4.5 million students have completed the survey since 2000.
Sample Questions: A copy of the complete NSSE instrument can be found in Appendix A. The 14 NSSE questions used by AAC&U in the Making Progress Report can be found in Appendix B.
The Clark University’s Task Force on Undergraduate Education’s final report, “Liberal Education and Effective Practice: A Plan for the 21st Century,” identified the use of survey data—in particular, data stemming from students’ participation in the National Survey of Student Engagement (NSSE)—as an important piece of Clark’s assessment approach. Since that time, the Association of American Colleges and Universities (AAC&U) has published “Making Progress: What We Know About the Achievement of Liberal Education Outcomes” (Finley, 2012), which identified a set of NSSE questions that have been aligned with AAC&U’s four essential learning outcomes. This overlap is helpful since it allows Clark not only a way to use NSSE data to better understand Clark students’ perceptions of their progress on their learning, but also a nationally accepted method for comparing Clark student data with that of other colleges and universities.
1. To better understand the rationale of changes made to the NSSE survey, refer to “Introducing the Updated NSSE” (http://nsse.indiana.edu/nsse-update/). This
link provides a discussion on the reasons for updating the survey and also provides access to some helpful resources on transitioning to the new format.
2. NSSE’s “Item by Item Comparisons of NSSE 2012 and NSSE 2013” can be found at http://nsse.indiana.edu/pdf/NSSE%202012-2013%20Item%20
Comparisons.pdf.
3. The National Survey of Student Engagement, accessed 6/1/2015: URL: http://nsse.indiana.edu/html/about.cfm .
STUDENTS’ PERCEPTIONS OF INSTITUTIONAL SUPPORT FOR THE LEEP LEARNING OUTCOMES | 3
This Clark University Campuswide Assessment Report uses National Survey of Student Engagement (NSSE) data (2004-2014) to assess students’ perceptions of their progress on four learning outcomes that are based on AAC&U’s Essential Learning Outcomes. This report also presents longitudinal trends that compare Clark first-year students with seniors, and Clark first-years and seniors with their NSSE counterparts.
TA B L E 1 describes the number of students who took the NSSE survey at Clark for each year compared with the number of students in the national sample. For a detailed look at the response rate respondent characteristics, please refer to Appendix C.
T H E R E P O R T I S O R G A N I Z E D I N T H R E E PA R T S .
SECTION ONE (pages 1-3) provides a summary of the Clark learning outcomes and the data used in this report.
SECTION TWO (pages 4-5) provides a snapshot of how Clark first-year students and seniors compare on a series of questions from the 2014 survey selected by the AAC&U Making Progress Report.
S E C T I O N T H R E E (pages 6-13) presents an in-depth analysis of a selection of NSSE questions that are aligned with Clark’s LEEP learning outcomes, including Clark’s distinctive Outcome 5: Capacities of Effective Practice. A snapshot of Clark University seniors’ data, compared with their national peers, is followed by three more specific analyses:
• A longitudinal analysis of noteworthy trends for first-year and senior students, between 2004 and 2014, for the specific questions;
• A comparative analysis of Clark first-year students and their peers across the nation during the same period; and
• The same comparative analysis of the seniors’ data.
When an exact comparison of measures was not possible due to NSSE’s 2013 survey changes, we selected similar questions that approximated prior questions as much as possible. This is most evident in Learning Outcome 4, where the two questions’ wording differed from previous years. In that case, we included the new wording in the SR vs. NSSE figure, but changed the wording slightly in the longitudinal analysis.
Please note: NSSE widely publishes average annual institutional response rates, which are approximately 7% higher than the average student response rates shown.
Table 1: Clark and NSSE Response Rates since 2004
Clark Respondent Count
Clark Response Rate (%)
NSSE Respondent Count
NSSE Response Rate (%)
FY SR FY SR FY SR FY SR
2004 241 148 45 43 44,455 45,236 37 40
2006 223 196 39 41 131,026 128,537 33 36
2009 213 201 35 39 158,978 175,735 29 34
2011 153 151 27 33 186,688 230,271 25 28
2014 186 127 31 26 242,332 336,560 22 26
ABOUT THE DATA IN THIS REPORT
STUDENTS’ PERCEPTIONS OF INSTITUTIONAL SUPPORT FOR THE LEEP LEARNING OUTCOMES | 4
CLARK FIRST-YEARS(FY) AND SENIORS(SR) COMPARED WITH NSSE PEERS
Examining the 2014 NSSE data, we find little evidence that Clark students differ from NSSE peers in terms of their perceptions of institutional support for the LEEP learning outcomes (see Table 2 on next page). There are some interesting differences though in the perceptions of first year students and seniors.First-year students present a mix of findings. Four of the 11 questions show no differences (positive or negative) between Clark FY and their NSSE peers in their perceptions of institutional support for the LEEP learning outcomes. For two of the questions pertaining to learning outcome 2, the first-year students at Clark report significantly less institutional support than do first-year students attending other schools in the NSSE sample. In addition, for two of the questions, Clark first-year students reported less support than their NSSE peers for one additional measure for learning outcome 2 (writing) and one for learning outcome five (working effectively with others). This contrasts with the questions pertaining to
learning outcome three (understanding people of other backgrounds) and both of the integrative learning questions associated with learning outcome 4. These differences were not noted to be statistically significant.
Table 2 shows a different picture for seniors. For the majority of questions, Clark seniors’ responses were similar to their NSSE peers. For one of the questions pertaining to learning outcome 2, Clark students rated institutional support for analyzing numerical and statistical information less highly when compared with their NSSE peers. There was suggestive evidence that Clark seniors tended to rate institutional support for one question pertaining to learning outcome 2 (thinking critically and analytically) and two of the three questions related to learning outcome 3 (being an informed and active citizen and understanding people of other backgrounds) more positively than their NSSE peers.
A SNAPSHOT
STUDENTS’ PERCEPTIONS OF INSTITUTIONAL SUPPORT FOR THE LEEP LEARNING OUTCOMES | 5
CLARK FIRST-YEARS(FY) AND SENIORS(SR) COMPARED WITH NSSE PEERS
THE SNAPSHOT PRESENTED IN TABLE 2 REPORTS FIRST-YEAR AND SENIOR RESPONSES on questions related to four LEEP outcomes in comparison with NSSE peers. The symbols used denote level of significance (see key).
2 Liberal Education and America’s Promise; see, College Learning for the New Global Century (AAC&U, 2007). The LEAP outcomes are summarized at http://www.aacu.org/leap/vision.cfm.
TA B L E 2 : Clark FY and SR perception of institutional support compared with NSSE peers
FY TRENDS
Clark vs. NSSE
SR TRENDS
Clark vs. NSSE
L E E P O U T C O M E 2 : Intellectual and Practical Skills
• Writing clearly and effectively
• Speaking clearly and effectively
• Thinking critically and analytically
• Analyzing numerical and statistical information*
L E E P O U T C O M E 3 : Personal and Social Responsibility
• Being an informed citizen*
• Understanding people of other backgrounds
• Developing or clarifying a personal code of values and ethics
L E E P O U T C O M E 4 : Integrative and Applied Learning
• Combining ideas from different courses when completing assignments
• Forming a new idea or understanding from various pieces of information *
L E E P O U T C O M E 5 : Integrative and Applied Learning
• Working effectively with others
• Solving complex real-world problems
* denotes new or changed question on the NSSE 2014 survey
Clark scores were significantly higher than NSSE scores at p ≤ 0.01 with an effect size ≥ 0.30
Clark scores were significantly higher than NSSE scores at p ≤ 0.05 with an effect size ≥ 0.10
No differences in scores between Clark FY compared with NSSE cohorts
Clark scores were significantly lower than NSSE scores at p ≤ 0.05 with an effect size ≥ -0.10
Clark scores were significantly lower than NSSE scores at p ≤ 0.01 with an effect size of ≥ -0.30
A SNAPSHOT
For additional information about significance and effect size, refer to Appendix D.
A comparative analysis of Clark students and their NSSE peers shows little distinction between the two groups in terms of Clark students’ perception of enhanced support for the LEEP Learning outcomes when compared with their NSSE peers.
• Clark first-year students report a slightly enhanced sense of institutional support for qualities associated with learning outcomes 3 and 4.
• Clark seniors are more likely to trend like their national peers or report greater support than comparisons of first-year students at Clark in comparison with their national peers.
STUDENTS’ PERCEPTIONS OF INSTITUTIONAL SUPPORT FOR THE LEEP LEARNING OUTCOMES | 6
There were four NSSE questions aligned with learning outcome 2: Intellectual and Practical Skills. Clark seniors in 2014 either reported similar levels of institutional support for this outcome, or reported slightly less support than their NSSE peers. While Clark seniors thought institutional support for writing clearly and effectively, and thinking critically and analytically, were similar to their peers, Clark seniors perceived less support when it came to the institution’s contribution to their speaking clearly and effectively and analyzing quantitative problems.
Intellectual and practical skills Clark SR vs. NSSE ALL U.S. SR
To what extent has your experience at this institution contributed to your knowledge, skills, and personal development in the following areas?
Percent of students who answered 3 = Quite a bit, 4 = Very much (out of 4 pt. scale)
CLARK SR NSSE: ALL U.S. SR
78%
67%
92%
48%
73%69%
85%
62%
0%
20%
40%
60%
80%
100%
Writing clearly and effectively Speaking clearly and effectively Thinking critically andanalytically
Analyzing quantitative problems
Clark SR NSSE: ALL US SR
A longitudinal analysis of Clark first-year students and seniors reveals a significant decrease in the reported perceptions of institutional support for three of the four questions pertaining to intellectual skills when compared with prior cohorts at Clark. While there was an overall dip in responses for these questions across the national sample, Clark’s scores showed a larger slide. Looking at Clark first-year students in comparison with seniors in the 2014 sample, it is interesting to note that while Clark first-year students reported significantly less support for three of the four areas tied to learning outcome 2 when compared with NSSE peers, by senior year Clark students looked similar to their NSSE peers in institutional support for these capacities, which are typically associated with liberal learning.
STUDENTS’ PERCEPTIONS OF INSTITUTIONAL SUPPORT FOR THE LEEP LEARNING OUTCOMES | 7
To what extent has your experience at this institution contributed to your knowledge, skills, and personal development in the following areas?
Percent of students who answered 3 = Quite a bit, 4 = Very much (out of 4 pt. scale)
Analyzing quantitative problems
20%
40%
60%
80%
100%
2004 2006 2009 2011 2014
Clark SR NSSE: ALL U.S. SR
20%
40%
60%
80%
100%
2004 2006 2009 2011 2014
Clark FY NSSE: ALL U.S. FY
20%
40%
60%
80%
100%
2004 2006 2009 2011 2014
Clark FY Clark SR
Thinking critically and analytically
20%
40%
60%
80%
100%
2004 2006 2009 2011 2014
Clark SR NSSE: ALL U.S. SR
20%
40%
60%
80%
100%
2004 2006 2009 2011 2014
Clark FY Clark SR
20%
40%
60%
80%
100%
2004 2006 2009 2011 2014
Clark FY NSSE: ALL U.S. FY
Writing clearly and effectively
20%
40%
60%
80%
100%
2004 2006 2009 2011 2014
Clark FY Clark SR
20%
40%
60%
80%
100%
2004 2006 2009 2011 2014
Clark FY NSSE: ALL U.S. FY
20%
40%
60%
80%
100%
2004 2006 2009 2011 2014
Clark SR NSSE: ALL U.S. SR
Speaking clearly and effectively
20%
40%
60%
80%
100%
2004 2006 2009 2011 2014
Clark SR NSSE: ALL U.S. SR
20%
40%
60%
80%
100%
2004 2006 2009 2011 2014
Clark FY Clark SR
20%
40%
60%
80%
100%
2004 2006 2009 2011 2014
Clark FY NSSE: ALL U.S. FY
T R E N D S
STUDENTS’ PERCEPTIONS OF INSTITUTIONAL SUPPORT FOR THE LEEP LEARNING OUTCOMES | 8
SUMMARY AND TRENDS
“Personal and Social Responsibility” 1 2 3 4 5LEEP OUTCOME #3
S U M M A R Y
Clark seniors provide suggestive evidence that they perceive more support for learning outcome 3 than other students in the NSSE sample for two of the three questions examined in 2014. Significant differences were found for two of the questions: being an informed citizen and understanding people of other racial and ethnic backgrounds.
Longitudinally, since 2004 Clark students have typically reported more institutional support than peers at other institutions for learning outcome 3 questions, with little difference in whether one is looking at first-year students or seniors. Despite the fact that the 2014 sample of FY and SR Clark students reported less institutional support for nearly all questions, two of the questions were rated more highly even compared with answers provided by Clark students in the past compared with their NSSE peers.
To what extent has your experience at this institution contributed to your knowledge, skills, and personal development in the following areas?
Percent of students who answered 3 = Quite a bit, 4 = Very much (out of 4 pt. scale)
Personal and Social Responsibility Clark SR vs. NSSE ALL U.S. SR
CLARK SR NSSE: ALL U.S. SR
71%79%
58%58% 62% 63%
0%
20%
40%
60%
80%
100%
Being an informed and active citizen Understanding people ofother racial and ethnic
backgrounds
Developing a personal codeof values and ethics
Clark SR NSSE: ALL US SR
STUDENTS’ PERCEPTIONS OF INSTITUTIONAL SUPPORT FOR THE LEEP LEARNING OUTCOMES | 9
SUMMARY AND TRENDS
20%
40%
60%
80%
100%
2004 2006 2009 2011 2014
Clark FY Clark SR
20%
40%
60%
80%
100%
2004 2006 2009 2011 2014
Clark FY NSSE: ALL U.S. FY
20%
40%
60%
80%
100%
2004 2006 2009 2011 2014
Clark SR NSSE: ALL U.S. SR
Being an informed and active citizen
“Personal and Social Responsibility” 1 2 3 4 5LEEP OUTCOME #3
To what extent has your experience at this institution contributed to your knowledge, skills, and personal development in the following areas?
Percent of students who answered 3 = Quite a bit, 4 = Very much (out of 4 pt. scale)
20%
40%
60%
80%
100%
2004 2006 2009 2011 2014
Clark FY Clark SR
20%
40%
60%
80%
100%
2004 2006 2009 2011 2014
Clark FY NSSE: ALL U.S. FY
20%
40%
60%
80%
100%
2004 2006 2009 2011 2014
Clark SR NSSE: ALL U.S. SR
Developing a personal code of ethics
20%
40%
60%
80%
100%
2004 2006 2009 2011 2014
Clark FY Clark SR
20%
40%
60%
80%
100%
2004 2006 2009 2011 2014
Clark FY NSSE: ALL U.S. FY
20%
40%
60%
80%
100%
2004 2006 2009 2011 2014
Clark SR NSSE: ALL U.S. SR
Understanding people of other racial and ethnic backgrounds
T R E N D S
STUDENTS’ PERCEPTIONS OF INSTITUTIONAL SUPPORT FOR THE LEEP LEARNING OUTCOMES | 10
SUMMARY AND TRENDS
“Integrative and Applied Learning” 1 2 3 4 5
S U M M A R Y
In the newly NSSE-added question in this outcome on “forming a new idea or understanding from various pieces of information,” Clark students’ perceptions of institutional support was similar to their NSSE peers. In addition, Clark seniors report the institution contributed to their experience of integrating ideas and information from various sources slightly more than their NSSE peers in 2014. There was no significant difference between Clark students and their NSSE peers with regard to the institutional contributions to helping students integrate ideas from different courses (both groups note this happens quite a bit). Although Clark students’ scores were higher than their NSSE peers on all questions, the significance between the two groups is negligible.
Longitudinally, both Clark first-year students and Clark seniors surpassed NSSE first-year and seniors respectively. During this period, only the scores for first-year students at Clark increased to the question of integrating information on papers or projects. Current attention to link the LEEP Outcomes to the First-Year Intensive program is one likely reason for this shift in first-year student responses. We expect that the new LEEP curricular framework will distinguish Clark students from their NSSE peers in this way by senior year in future reports.
LEEP OUTCOME #4
To what extent has your experience at this institution contributed to your knowledge, skills, and personal development in the following areas?
Percent of students who answered 3 = Quite a bit, 4 = Very much (out of 4 pt. scale)
Integrative and applied learning Clark SR vs. NSSE ALL U.S. SR
73% 76%
88%
72% 72%
84%
0%
20%
40%
60%
80%
100%
Forming a new idea or understandingfrom various pieces of information
Put together ideas or concepts fromdifferent courses when completingassignments or class discussions
Worked on a paper or project thatrequired integrating ideas or information
from various sources
Clark SR NSSE: ALL US SR
CLARK SR NSSE: ALL U.S. SR
(New for NSSE 2014)
STUDENTS’ PERCEPTIONS OF INSTITUTIONAL SUPPORT FOR THE LEEP LEARNING OUTCOMES | 1 1
To what extent has your experience at this institution contributed to your knowledge, skills, and personal development in the following areas?
Percent of students who answered 3 = Quite a bit, 4 = Very much (out of 4 pt. scale)
20%
40%
60%
80%
100%
2004 2006 2009 2011 2014
Clark FY Clark SR
20%
40%
60%
80%
100%
2004 2006 2009 2011 2014
Clark FY NSSE: ALL U.S. FY
20%
40%
60%
80%
100%
2004 2006 2009 2011 2014
Clark SR NSSE: ALL U.S. SR
Worked on a paper or project that required integrating ideas or information from various sources
20%
40%
60%
80%
100%
2004 2006 2009 2011 2014
Clark FY Clark SR
20%
40%
60%
80%
100%
2004 2006 2009 2011 2014
Clark FY NSSE: ALL U.S. FY
20%
40%
60%
80%
100%
2004 2006 2009 2011 2014
Clark SR NSSE: ALL U.S. SR
Put together ideas or concepts from different courses when completing assignments or during class discussions
STUDENTS’ PERCEPTIONS OF INSTITUTIONAL SUPPORT FOR THE LEEP LEARNING OUTCOMES | 12
SUMMARY AND TRENDS
“Capacities of Effective Practice” 1 2 3 4 5
S U M M A R Y
The analysis of seniors’ perceptions of institutional support for capacities of effective practice as measured by two NSSE 2014 survey questions shows slight differences between Clark seniors and their NSSE peers. Longitudinally first-year students at institutions across the country are reporting less institutional support for this outcome. This is particularly noticeable for Clark, since Clark first-year students and seniors had been noting significant improvement in institutional support over the last decade. It is unclear why Clark students and their peers show this trend. In fact, after long outpacing first-year NSSE peers, Clark students now show a trend of perceiving slightly less institutional support with regard to working effectively with others when compared with perceived support of their NSSE peers.
LEEP OUTCOME #5
To what extent has your experience at this institution contributed to your knowledge, skills, and personal development in the following areas?
Percent of students who answered 3 = Quite a bit, 4 = Very much (out of 4 pt. scale)
Capacities of Effective Practice
59%66%63%
73%
0%
20%
40%
60%
80%
100%
Solving complex real-world problems Working effectively with others
Clark SR NSSE: ALL US SR
CLARK SR NSSE: ALL U.S. SR
STUDENTS’ PERCEPTIONS OF INSTITUTIONAL SUPPORT FOR THE LEEP LEARNING OUTCOMES | 13
SUMMARY AND TRENDS
T R E N D S
“Capacities of Effective Practice”
LEEP OUTCOME #5
To what extent has your experience at this institution contributed to your knowledge, skills, and personal development in the following areas?
Percent of students who answered 3 = Quite a bit, 4 = Very much (out of 4 pt. scale)
1 2 3 4 5
20%
40%
60%
80%
100%
2004 2006 2009 2011 2014
Clark FY Clark SR
20%
40%
60%
80%
100%
2004 2006 2009 2011 2014
Clark FY NSSE: ALL U.S. FY
20%
40%
60%
80%
100%
2004 2006 2009 2011 2014
Clark SR NSSE: ALL U.S. SR
Working effectively with others
20%
40%
60%
80%
100%
2004 2006 2009 2011 2014
Clark FY Clark SR
20%
40%
60%
80%
100%
2004 2006 2009 2011 2014
Clark FY NSSE: ALL U.S. FY
20%
40%
60%
80%
100%
2004 2006 2009 2011 2014
Clark SR NSSE: ALL U.S. SR
Solving complex real-world problems
STUDENTS’ PERCEPTIONS OF INSTITUTIONAL SUPPORT FOR THE LEEP LEARNING OUTCOMES | 14
THE NATIONAL SURVEY OF STUDENT ENGAGEMENT (NSSE)
APPENDIX A
National Survey of Student Engagement The College Student Report
This is a facsimile of the NSSE survey (available at nsse.iub.edu/links/surveys). The survey itself is administered online.
1. During the current school year, about how often have you done the following? Response options: Very often, Often, Sometimes, Never a. Asked questions or contributed to course discussions in other ways b. Prepared two or more drafts of a paper or assignment before turning it in c. Come to class without completing readings or assignments d. Attended an art exhibit, play or other arts performance (dance, music, etc.) e. Asked another student to help you understand course material f. Explained course material to one or more students g. Prepared for exams by discussing or working through course material with other students h. Worked with other students on course projects or assignments i. Gave a course presentation
2. During the current school year, about how often have you done the following? Response options: Very often, Often, Sometimes, Never a. Combined ideas from different courses when completing assignments b. Connected your learning to societal problems or issues c. Included diverse perspectives (political, religious, racial/ethnic, gender, etc.) in course discussions or assignments d. Examined the strengths and weaknesses of your own views on a topic or issue e. Tried to better understand someone else's views by imagining how an issue looks from his or her perspective f. Learned something that changed the way you understand an issue or concept g. Connected ideas from your courses to your prior experiences and knowledge
3. During the current school year, about how often have you done the following? Response options: Very often, Often, Sometimes, Never a. Talked about career plans with a faculty member b. Worked with a faculty member on activities other than coursework (committees, student groups, etc.) c. Discussed course topics, ideas, or concepts with a faculty member outside of class d. Discussed your academic performance with a faculty member
4. During the current school year, how much has your coursework emphasized the following? Response options: Very much, Quite a bit, Some, Very little a. Memorizing course material b. Applying facts, theories, or methods to practical problems or new situations c. Analyzing an idea, experience, or line of reasoning in depth by examining its parts d. Evaluating a point of view, decision, or information source e. Forming a new idea or understanding from various pieces of information
5. During the current school year, to what extent have your instructors done the following? Response options: Very much, Quite a bit, Some, Very little a. Clearly explained course goals and requirements b. Taught course sessions in an organized way c. Used examples or illustrations to explain difficult points d. Provided feedback on a draft or work in progress e. Provided prompt and detailed feedback on tests or completed assignments
6. During the current school year, about how often have you done the following? Response options: Very often, Often, Sometimes, Never a. Reached conclusions based on your own analysis of numerical information (numbers, graphs, statistics, etc.) b. Used numerical information to examine a real‐world problem or issue (unemployment, climate change, public health, etc.) c. Evaluated what others have concluded from numerical information
STUDENTS’ PERCEPTIONS OF INSTITUTIONAL SUPPORT FOR THE LEEP LEARNING OUTCOMES | 15
7. During the current school year, about how many papers, reports, or other writing tasks of the following length have you been
assigned? (Include those not yet completed.) Response options: None, 1‐2, 3‐5, 6‐10, 11‐15, 16‐20, More than 20 papers a. Up to 5 pages b. Between 6 and 10 pages c. 11 pages or more
8. During the current school year, about how often have you had discussions with people from the following groups? Response options: Very often, Often, Sometimes, Never a. People of a race or ethnicity other than your own b. People from an economic background other than your own c. People with religious beliefs other than your own d. People with political views other than your own
9. During the current school year, about how often have you done the following? Response options: Very often, Often, Sometimes, Never a. Identified key information from reading assignments b. Reviewed your notes after class c. Summarized what you learned in class or from course materials
10. During the current school year, to what extent have your courses challenged you to do your best work? Response options: 1=Not at all to 7=Very much
11. Which of the following have you done or do you plan to do before you graduate?
Response options: Done or in progress, Plan to do, Do not plan to do, Have not decided a. Participate in an internship, co‐op, field experience, student teaching, or clinical placement b. Hold a formal leadership role in a student organization or group c. Participate in a learning community or some other formal program where groups of students take two or more classes
together d. Participate in a study abroad program e. Work with a faculty member on a research project f. Complete a culminating senior experience (capstone course, senior project or thesis, comprehensive exam, portfolio, etc.)
12. About how many of your courses at this institution have included a community‐based project (service‐learning)? Response options: All, Most, Some, None
13. Indicate the quality of your interactions with the following people at your institution.
Response options: 1=Poor to 7=Excellent, Not Applicable a. Students b. Academic advisors c. Faculty d. Student services staff (career services, student activities, housing, etc.) e. Other administrative staff and offices (registrar, financial aid, etc.)
14. How much does your institution emphasize the following? Response options: Very much, Quite a bit, Some, Very little a. Spending significant amounts of time studying and on academic work b. Providing support to help students succeed academically c. Using learning support services (tutoring services, writing center, etc.) d. Encouraging contact among students from different backgrounds (social, racial/ethnic, religious, etc.) e. Providing opportunities to be involved socially f. Providing support for your overall well‐being (recreation, health care, counseling, etc.) g. Helping you manage your non‐academic responsibilities (work, family, etc.) h. Attending campus activities and events (performing arts, athletic events, etc.) i. Attending events that address important social, economic, or political issues
STUDENTS’ PERCEPTIONS OF INSTITUTIONAL SUPPORT FOR THE LEEP LEARNING OUTCOMES | 16
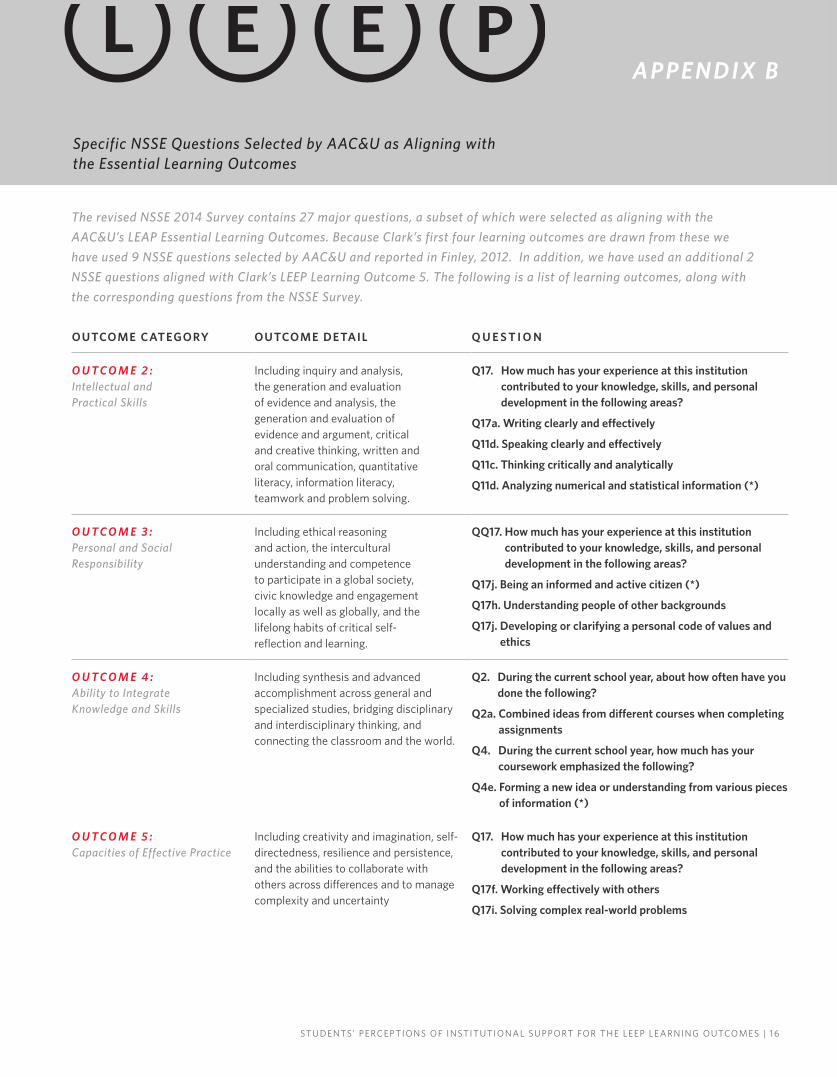
APPENDIX B
The revised NSSE 2014 Survey contains 27 major questions, a subset of which were selected as aligning with the AAC&U’s LEAP Essential Learning Outcomes. Because Clark’s first four learning outcomes are drawn from these we have used 9 NSSE questions selected by AAC&U and reported in Finley, 2012. In addition, we have used an additional 2 NSSE questions aligned with Clark’s LEEP Learning Outcome 5. The following is a list of learning outcomes, along with the corresponding questions from the NSSE Survey.
Specific NSSE Questions Selected by AAC&U as Aligning with the Essential Learning Outcomes
OUTCOME CATEGORY OUTCOME DETAIL Q U E S T I O N
O U T C O M E 2 : Intellectual and Practical Skills
Including inquiry and analysis, the generation and evaluation of evidence and analysis, the generation and evaluation of evidence and argument, critical and creative thinking, written and oral communication, quantitative literacy, information literacy, teamwork and problem solving.
Q17. How much has your experience at this institution contributed to your knowledge, skills, and personal development in the following areas?
Q17a. Writing clearly and effectively
Q11d. Speaking clearly and effectively
Q11c. Thinking critically and analytically
Q11d. Analyzing numerical and statistical information (*)
O U T C O M E 3 : Personal and Social Responsibility
Including ethical reasoning and action, the intercultural understanding and competence to participate in a global society, civic knowledge and engagement locally as well as globally, and the lifelong habits of critical self- reflection and learning.
QQ17. How much has your experience at this institution contributed to your knowledge, skills, and personal development in the following areas?
Q17j. Being an informed and active citizen (*)
Q17h. Understanding people of other backgrounds
Q17j. Developing or clarifying a personal code of values and ethics
O U T C O M E 4 : Ability to Integrate Knowledge and Skills
Including synthesis and advanced accomplishment across general and specialized studies, bridging disciplinary and interdisciplinary thinking, and connecting the classroom and the world.
Q2. During the current school year, about how often have you done the following?
Q2a. Combined ideas from different courses when completing assignments
Q4. During the current school year, how much has your coursework emphasized the following?
Q4e. Forming a new idea or understanding from various pieces of information (*)
O U T C O M E 5 : Capacities of Effective Practice
Including creativity and imagination, self-directedness, resilience and persistence, and the abilities to collaborate with others across differences and to manage complexity and uncertainty
Q17. How much has your experience at this institution contributed to your knowledge, skills, and personal development in the following areas?
Q17f. Working effectively with others
Q17i. Solving complex real-world problems
STUDENTS’ PERCEPTIONS OF INSTITUTIONAL SUPPORT FOR THE LEEP LEARNING OUTCOMES | 17
APPENDIX C
2014 NSSE Respondent Characteristics
NSSE 2014 Respondent ProfileClark University
First-Year Students Seniors
ClarkNSSE 2013 &
2014 Clark NSSE 2013 & 2014
Response options Count % Count % Count % Count %
Age 19 or younger 132 94 163,243 84 0 0 1,300 0
20-23 8 6 12,842 8 93 96 171,014 58
24-29 0 0 4,086 3 5 4 43,026 17
30-39 0 0 4,052 3 0 0 29,718 12
40-55 0 0 3,517 2 0 0 27,391 11
Over 55 0 0 454 0 0 0 3,997 2
Total 140 100 188,194 100 98 100 276,446 100
Sex Female 121 62 158,010 54 84 56 213,852 56
Male 65 38 85,693 46 43 44 124,444 44
Total 186 100 243,703 100 127 100 338,296 100
Race or Ethnicity American Indian or Alaska Native 0 0 830 0 0 0 1,381 1
Asian 18 13 13,639 7 5 5 15,372 6
Black or African American 3 2 15,104 9 5 5 21,585 8
Enrollment Status Not full-time 3 2 10,280 6 0 0 56,811 20
Full-time 183 98 233,423 94 127 100 281,485 80
Total 186 100 243,703 100 127 100 338,296 100
First-generation status (Neither parent holds a bachelor’s degree)
Not first-generation 106 76 110,295 57 78 80 148,577 52
First-generation 34 24 78,246 43 19 20 129,538 48
Total 140 100 188,541 100 97 100 278,115 100
STUDENTS’ PERCEPTIONS OF INSTITUTIONAL SUPPORT FOR THE LEEP LEARNING OUTCOMES | 18
APPENDIX D
Overview Analyses of All Outcomes: Clark First-Years Compared with NSSE Peers
T H E S N A P S H O T P R E S E N T E D I N TA B L E 3 shows First-Year reported scores on all four LEEP outcomes compared with NSSE peers. The symbols used denote a significance at the p≤0.05 level with an effect size ≥.30. A plus symbol (+) indicates a significantly higher score for Clark than NSSE peers; a negative symbol (–) indicates a significantly lower score for Clark than NSSE peers.
2 Effect size indicates the “practical significance” of the mean difference. It is calculated by dividing the mean difference by the pooled standard deviation. In practice, an effect size of .2 is often considered small, .5 moderate, and .8 large. A positive sign indicates that the institution’s mean was greater, thus showing an affirmative result for the institution. A negative sign indicates the institution lags behind the comparison group, suggesting that the student behavior or institutional practice represented by the item may warrant attention. An exception to this interpretation is the “coming to class unprepared” item (item 1f.) where a negative sign is preferred (i.e., meaning fewer students reporting coming to class unprepared).
To what extent has your experience at this institution contributed to your knowledge, skills, and personal development in the following areas? 1 = Very little, 2 = Some, 3 = Quite a bit, 4 = Very much
O V E R V I E W A N A LY S I S O F A L L F O U R O U T C O M E S : C L A R K S T U D E N T S C O M PA R E DT O N S S E P E E R S 2 0 1 4
ClarkFY
ClarkSR
Positive TrendSignificantly higher than NSSE scores at p≤ 0.01 or p≤ 0.05
3 3
Negative TrendSignificant at the <0.05 level and >.30 effect size
4 1
No significant differencesOn par with NSSE peers 4 7
Clark FY
NSSE FY
Clark FY Sign.
Effect Size* TREND
L E E P O U T C O M E 2 : Intellectual and Practical Skills
* denotes new or changed question on the NSSE 2014 survey
Clark scores were significantly higher than NSSE scores at p ≤ 0.01 with an effect size ≥ 0.30
Clark scores were significantly higher than NSSE scores at p ≤ 0.05 with an effect size ≥ 0.10
No differences in scores between Clark FY compared with NSSE cohorts
Clark scores were significantly lower than NSSE scores at p ≤ 0.05 with an effect size ≥ -0.10
Clark scores were significantly lower than NSSE scores at p ≤ 0.01 with an effect size of ≥ -0.30
TA B L E 3
STUDENTS’ PERCEPTIONS OF INSTITUTIONAL SUPPORT FOR THE LEEP LEARNING OUTCOMES | 19
APPENDIX E
Overview Analyses of All Outcomes: Clark Seniors Compared with NSSE Peers
T H E S N A P S H O T P R E S E N T E D I N TA B L E 4 shows Senior reported scores on all four LEEP outcomes compared with NSSE peers. The symbols used denote a significance at the p≤0.05 level with an effect size ≥.30. A plus symbol (+) indicates a significantly higher score for Clark than NSSE peers; a negative symbol (–) indicates a significantly lower score for Clark than NSSE peers.
2 Effect size indicates the “practical significance” of the mean difference. It is calculated by dividing the mean difference by the pooled standard deviation. In practice, an effect size of .2 is often considered small, .5 moderate, and .8 large. A positive sign indicates that the institution’s mean was greater, thus showing an affirmative result for the institution. A negative sign indicates the institution lags behind the comparison group, suggesting that the student behavior or institutional practice represented by the item may warrant attention. An exception to this interpretation is the “coming to class unprepared” item (item 1f.) where a negative sign is preferred (i.e., meaning fewer students reporting coming to class unprepared).
To what extent has your experience at this institution contributed to your knowledge, skills, and personal development in the following areas? 1 = Very little, 2 = Some, 3 = Quite a bit, 4 = Very much
O V E R V I E W A N A LY S I S O F A L L F O U R O U T C O M E S : C L A R K S T U D E N T S C O M PA R E DT O N S S E P E E R S 2 0 1 4
ClarkFY
ClarkSR
Positive TrendSignificantly higher than NSSE scores at p≤ 0.01 or p≤ 0.05
3 3
Negative TrendSignificant at the <0.05 level and >.30 effect size
4 1
No significant differencesOn par with NSSE peers 4 7
Clark SR
NSSE SR
Clark SR Sign.
Effect Size* TREND
L E E P O U T C O M E 2 : Intellectual and Practical Skills
* denotes new or changed question on the NSSE 2014 survey
Clark scores were significantly higher than NSSE scores at p ≤ 0.01 with an effect size ≥ 0.30
Clark scores were significantly higher than NSSE scores at p ≤ 0.05 with an effect size ≥ 0.10
No differences in scores between Clark FY compared with NSSE cohorts
Clark scores were significantly lower than NSSE scores at p ≤ 0.05 with an effect size ≥ -0.10
Clark scores were significantly lower than NSSE scores at p ≤ 0.01 with an effect size of ≥ -0.30
TA B L E 4
STUDENTS’ PERCEPTIONS OF INSTITUTIONAL SUPPORT FOR THE LEEP LEARNING OUTCOMES | 20
CLARK UNIVERSITY THE STUDENT EXPERIENCE IN BRIEF
APPENDIX F
Are faculty members accessible and supportive?c
How often do students make course presentations?b
5% of FY students and 64% of seniors worked on a research project with a faculty member.
Do faculty members clearly explain course goals and requirements?
How often do students talk with faculty members or advisors about their career plans?b
23% of FY and 47% of seniors "frequently" discussed career plans with faculty.
85% of FY students said instructors clearly explained course goals and requirements "quite a bit" or "very much."
Do students receive prompt and detailed feedback?d
59% of FY students and 68% of seniors said instructors "substantially" gave prompt and detailed feedback on tests or completed assignments.
How often do students talk with faculty members outside class about what they are learning?b
How many students work on research projects with faculty?
25% of FY students "frequently" discussed course topics, ideas, or concepts with a faculty member outside of class.
How much writing is expected?
Do courses challenge students to do their best?a
How much time do students spend studying each week?
How much reading is expected?
38% of FY students "frequently" used numerical information to examine a real-world problem or issue; 47% of seniors "frequently" reached conclusions based on their own analysis of numerical information.
Are students expected to use numbers or statistics throughout their coursework?b
57% of FY students "frequently" included diverse perspectives in course discussions or assignments.
Do class discussions and assignments include the perspectives of diverse groups of people?b
FY students estimated they spent an average of 9 hours per week on assigned reading, and seniors read 8 hours per week.
In an academic year, FY students estimated they were assigned an average of 79 pages of writing and seniors estimated an average of 106 pages.
30% of FY students and 55% of seniors "frequently" gave course presentations.
41% of FY students reported that their courses "highly" challenged them to do their best work.
A Pocket Guide to Choosing a College:NSSE 2014 Answers from Students
58% of FY students rated the quality of their interactions with faculty as "high."
Academics Experiences with Faculty
Each year the National Survey of Student Engagement (NSSE) asks students at hundreds of colleges and universities to reflect on the time they devote to various learning activities. The topics explored are linked to previous research on student success in college.
Results from NSSE can provide prospective students with insights into how they might learn and develop at a given college. To help in the college exploration process, NSSE developed A Pocket Guide to Choosing a College to give students and their families key questions to ask during campus visits.
The following responses were provided by 313 Clark students on the 2014 survey.
A Pocket Guide to Choosing a College
is available at nsse.iub.edu/html/ pocket_guide.cfm
Clark University
First-year (FY) students spent an average of 15 hours per week preparing for class while seniors spent an average of 16 hours per week.
15 16
0
5
10
15
20
25
First-year Senior
Hour
s per
wee
k
59% 68%
0%
50%
100%
First-year Senior
STUDENTS’ PERCEPTIONS OF INSTITUTIONAL SUPPORT FOR THE LEEP LEARNING OUTCOMES | 21
CLARK UNIVERSITY THE STUDENT EXPERIENCE IN BRIEF
APPENDIX F
How many students study in other countries?
Notes
How satisfied are students with academic advising?c
How well do students get along with each other?c
IPEDS: 165334
48% of FY students and 60% of seniors said "at least some" of their courses included a community-based service-learning project.
51% of FY students and 63% of seniors gave the quality of their interactions with academic advisors a "high" rating.
63% of FY students gave the quality of their interactions with their peers a "high" rating.
How satisfied are students with their educational experience?
87% of FY and 94% of seniors rated their entire educational experience at this institution as "excellent" or "good."
Are students encouraged to use learning support services (tutors, writing center)?d
a.
b.c.
d.e.
Center for Postsecondary ResearchIndiana University School of Education1900 East Tenth Street, Suite 419Bloomington, IN 47406-7512Phone: 812-856-5824Fax: 812-856-5150Email: [email protected]: nsse.iub.edu
Learning with Peers
56% of seniors "frequently" explained course material to one or more students.
Rich Educational Experiences
What types of honors courses, learning communities, and other distinctive programs are offered?
During their first year, 6% of students participated in a learning community. By spring of their senior year, 75% of students had done (or were doing) a culminatingsenior experience.
By their senior year, 28% of students had studied abroad.
By spring of their senior year, 75% of students had participated in some form of internship, co-op, field experience, student teaching, or clinical placement.
Do students help each other learn?b How many students get practical, real-world experience through internships or field experiences?
How often do students work together on class projects and assignments?b
How many courses include community-based service-learning projects?e
How often do students work together to prepare for exams?b
62% of FY students "frequently" prepared for exams by discussing or working through course material with other students.
76% of FY students said the institution "substantially" emphasized the use of learning support services.
53% of FY students and 58% of seniors "frequently" worked with their peers on course projects and assignments.
"Highly" is a 6 or 7 on a seven-point scale where 1 is "Not at all" and 7 is "Very much.""Frequently" is "Often" or "Very often."A "High" rating is a 6 or 7 on a seven-point scale where 1 is "Poor" and 7 is "Excellent.""Substantially" is "Quite a bit" or "Very much.""At least some" is defined by combining responses of "Some," "Most," and "All."
Campus Environment
How often do students interact with others who have different viewpoints or who come from different backgrounds?b
Among FY students, 52% "frequently" had discussions with people with different political views, 86% "frequently" had discussions with people from a different economic background, and 84% "frequently" had discussions with people from a different race or ethnicity.
53%58%
0%
50%
100%
First-year Senior
48%60%
0%
50%
100%
First-year Senior
t
N
t
S
E
W
t
t
Clark L E E P Compass Reportclarku.edu/leepcompass