Phonon anharmonicity of rutile SnO2 studied by Raman spectrometry and first principlescalculations of the kinematics of phonon-phonon interactions
Tian Lan,* Chen W. Li, and Brent FultzDepartment of Applied Physics and Materials Science, California Institute of Technology, Pasadena, California 91125, USA
(Received 13 June 2012; published 11 October 2012)
Raman spectra of rutile tin dioxide (SnO2) were measured at temperatures from 83 to 873 K. The pureanharmonicity from phonon-phonon interactions was found to be large and comparable to the quasiharmonicity.First-principles calculations of phonon dispersions were used to assess the kinematics of three-phonon andfour-phonon processes. These kinematics were used to generate Raman peak widths and shifts, which were fit tomeasured data to obtain the cubic and quartic components of the anharmonicity for each Raman mode. The B2g
mode had a large quartic component, consistent with the symmetry of its atom displacements. The broadeningof the B2g mode with temperature showed an unusual concave-downwards curvature. This curvature is causedby a change with temperature in the number of down-conversion decay channels, originating with the wide bandgap in the phonon dispersions.
Rutile tin dioxide (SnO2) is the most common and stableoxide of tin found in nature. Owing to the wide variety of itsapplications for optoelectronics, heterogeneous catalysis, andgas sensors, rutile SnO2 has been the subject of much recentresearch.1 Lattice dynamics, phase transitions, and nanostruc-tures of SnO2 have been studied by measurements of opticalphonons with Raman, Brillouin, or infrared spectroscopy2–6
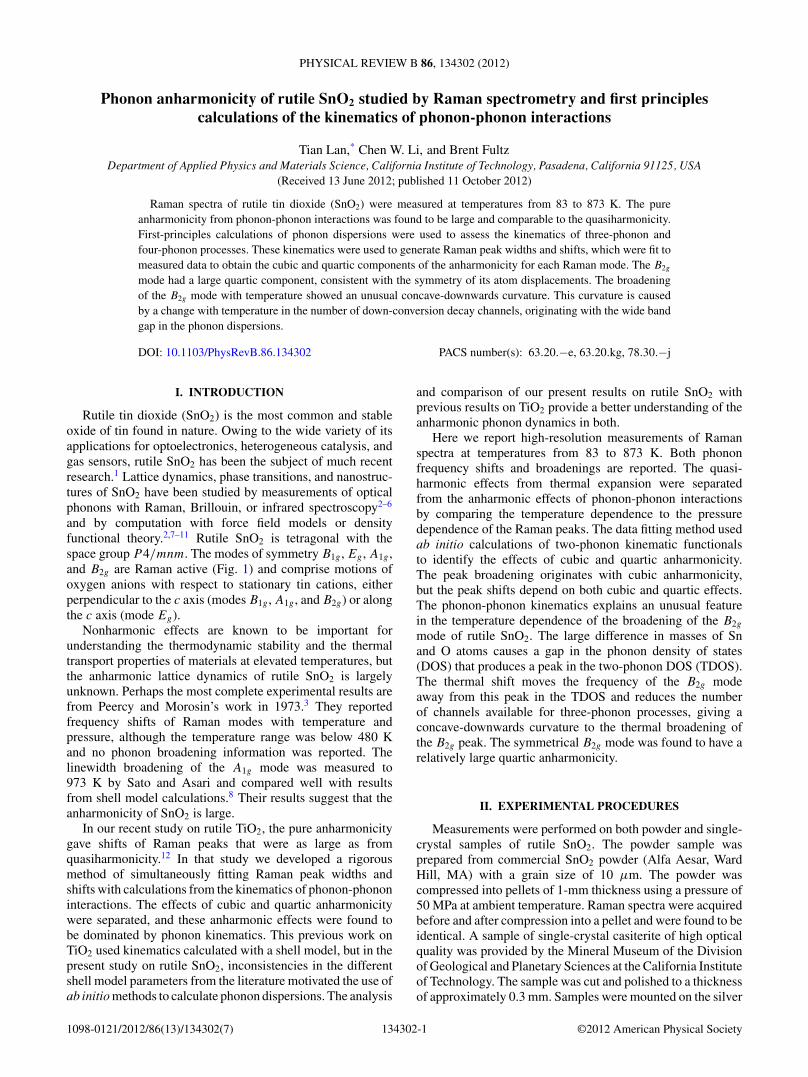
and by computation with force field models or densityfunctional theory.2,7–11 Rutile SnO2 is tetragonal with thespace group P 4/mnm. The modes of symmetry B1g , Eg , A1g ,and B2g are Raman active (Fig. 1) and comprise motions ofoxygen anions with respect to stationary tin cations, eitherperpendicular to the c axis (modes B1g , A1g , and B2g) or alongthe c axis (mode Eg).
Nonharmonic effects are known to be important forunderstanding the thermodynamic stability and the thermaltransport properties of materials at elevated temperatures, butthe anharmonic lattice dynamics of rutile SnO2 is largelyunknown. Perhaps the most complete experimental results arefrom Peercy and Morosin’s work in 1973.3 They reportedfrequency shifts of Raman modes with temperature andpressure, although the temperature range was below 480 Kand no phonon broadening information was reported. Thelinewidth broadening of the A1g mode was measured to973 K by Sato and Asari and compared well with resultsfrom shell model calculations.8 Their results suggest that theanharmonicity of SnO2 is large.
In our recent study on rutile TiO2, the pure anharmonicitygave shifts of Raman peaks that were as large as fromquasiharmonicity.12 In that study we developed a rigorousmethod of simultaneously fitting Raman peak widths andshifts with calculations from the kinematics of phonon-phononinteractions. The effects of cubic and quartic anharmonicitywere separated, and these anharmonic effects were found tobe dominated by phonon kinematics. This previous work onTiO2 used kinematics calculated with a shell model, but in thepresent study on rutile SnO2, inconsistencies in the differentshell model parameters from the literature motivated the use ofab initio methods to calculate phonon dispersions. The analysis
and comparison of our present results on rutile SnO2 withprevious results on TiO2 provide a better understanding of theanharmonic phonon dynamics in both.
Here we report high-resolution measurements of Ramanspectra at temperatures from 83 to 873 K. Both phononfrequency shifts and broadenings are reported. The quasi-harmonic effects from thermal expansion were separatedfrom the anharmonic effects of phonon-phonon interactionsby comparing the temperature dependence to the pressuredependence of the Raman peaks. The data fitting method usedab initio calculations of two-phonon kinematic functionalsto identify the effects of cubic and quartic anharmonicity.The peak broadening originates with cubic anharmonicity,but the peak shifts depend on both cubic and quartic effects.The phonon-phonon kinematics explains an unusual featurein the temperature dependence of the broadening of the B2g
mode of rutile SnO2. The large difference in masses of Snand O atoms causes a gap in the phonon density of states(DOS) that produces a peak in the two-phonon DOS (TDOS).The thermal shift moves the frequency of the B2g modeaway from this peak in the TDOS and reduces the numberof channels available for three-phonon processes, giving aconcave-downwards curvature to the thermal broadening ofthe B2g peak. The symmetrical B2g mode was found to have arelatively large quartic anharmonicity.
II. EXPERIMENTAL PROCEDURES
Measurements were performed on both powder and single-crystal samples of rutile SnO2. The powder sample wasprepared from commercial SnO2 powder (Alfa Aesar, WardHill, MA) with a grain size of 10 μm. The powder wascompressed into pellets of 1-mm thickness using a pressure of50 MPa at ambient temperature. Raman spectra were acquiredbefore and after compression into a pellet and were found to beidentical. A sample of single-crystal casiterite of high opticalquality was provided by the Mineral Museum of the Divisionof Geological and Planetary Sciences at the California Instituteof Technology. The sample was cut and polished to a thicknessof approximately 0.3 mm. Samples were mounted on the silver
TIAN LAN, CHEN W. LI, AND BRENT FULTZ PHYSICAL REVIEW B 86, 134302 (2012)
FIG. 1. (Color online) Rutile structure and oxygen atom displace-ments for Raman-active modes.
block of a Linkam thermal stage that provided excellent heattransfer and temperature stability for both heating and cooling.The sample chamber was sealed and purged with nitrogengas flow. A temperature controller drove a 200-W powersupply for heating. For low-temperature measurements, thestage was equipped with a coolant pump that injected liquidnitrogen directly into the silver block. Samples of powderpellets were measured at temperatures from 83 to 833 K, andthe single-crystal sample was measured from 83 to 873 K. Eachtemperature was held stable for 10 min before the spectrumwas taken. The temperature precision was within 1 K.
Raman spectra were measured with a Renishaw micro-Raman system with an Olympus LMPlanFI microscope lens.The spectrometer was configured in backscattering geometry,minimizing issues with the thickness of the sample. A depo-larized solid-state laser operated at a wavelength of 514.5 nmexcited the sample with the low incident power of 10 mWto avoid additional thermal heating. The laser spot size was12 μm in diameter. To test for heating effects this spot size wasvaried, but no changes were found. Each Raman spectrum wasaccumulated in 10 measurements with 10-s exposure times.
III. RESULTS
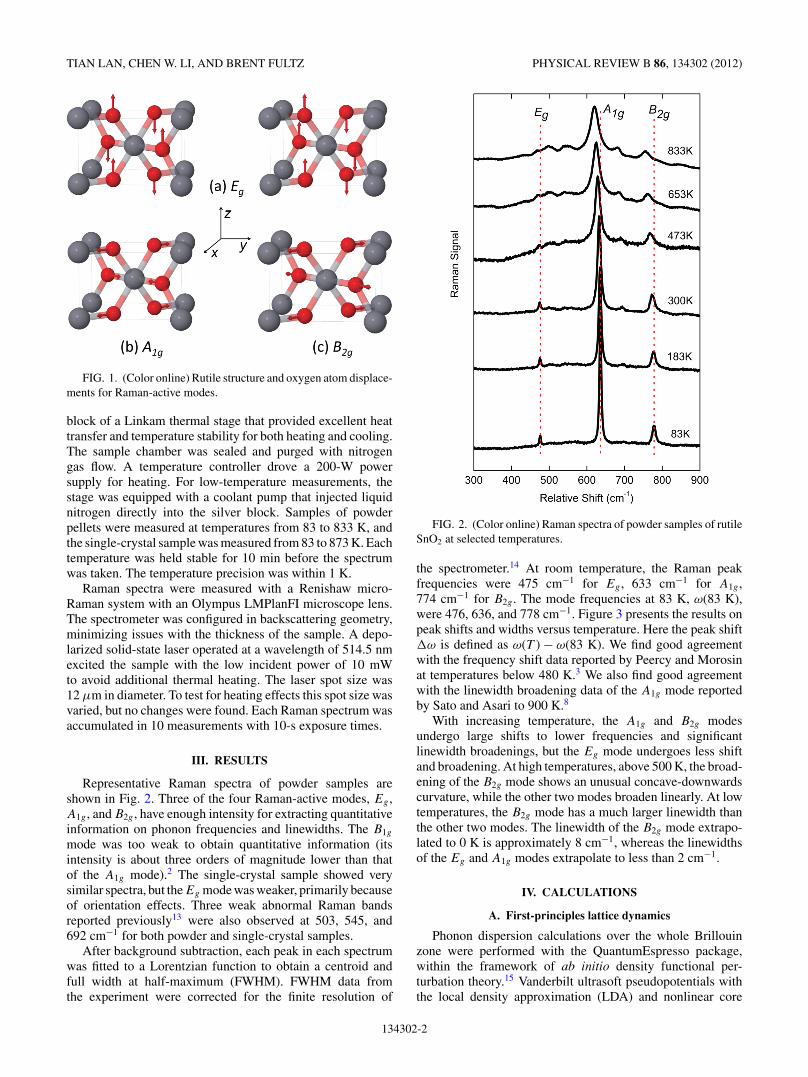
Representative Raman spectra of powder samples areshown in Fig. 2. Three of the four Raman-active modes, Eg ,A1g , and B2g , have enough intensity for extracting quantitativeinformation on phonon frequencies and linewidths. The B1g
mode was too weak to obtain quantitative information (itsintensity is about three orders of magnitude lower than thatof the A1g mode).2 The single-crystal sample showed verysimilar spectra, but the Eg mode was weaker, primarily becauseof orientation effects. Three weak abnormal Raman bandsreported previously13 were also observed at 503, 545, and692 cm−1 for both powder and single-crystal samples.
After background subtraction, each peak in each spectrumwas fitted to a Lorentzian function to obtain a centroid andfull width at half-maximum (FWHM). FWHM data fromthe experiment were corrected for the finite resolution of
FIG. 2. (Color online) Raman spectra of powder samples of rutileSnO2 at selected temperatures.
the spectrometer.14 At room temperature, the Raman peakfrequencies were 475 cm−1 for Eg , 633 cm−1 for A1g ,774 cm−1 for B2g . The mode frequencies at 83 K, ω(83 K),were 476, 636, and 778 cm−1. Figure 3 presents the results onpeak shifts and widths versus temperature. Here the peak shift�ω is defined as ω(T ) − ω(83 K). We find good agreementwith the frequency shift data reported by Peercy and Morosinat temperatures below 480 K.3 We also find good agreementwith the linewidth broadening data of the A1g mode reportedby Sato and Asari to 900 K.8
With increasing temperature, the A1g and B2g modesundergo large shifts to lower frequencies and significantlinewidth broadenings, but the Eg mode undergoes less shiftand broadening. At high temperatures, above 500 K, the broad-ening of the B2g mode shows an unusual concave-downwardscurvature, while the other two modes broaden linearly. At lowtemperatures, the B2g mode has a much larger linewidth thanthe other two modes. The linewidth of the B2g mode extrapo-lated to 0 K is approximately 8 cm−1, whereas the linewidthsof the Eg and A1g modes extrapolate to less than 2 cm−1.
IV. CALCULATIONS
A. First-principles lattice dynamics
Phonon dispersion calculations over the whole Brillouinzone were performed with the QuantumEspresso package,within the framework of ab initio density functional per-turbation theory.15 Vanderbilt ultrasoft pseudopotentials withthe local density approximation (LDA) and nonlinear core
134302-2
PHONON ANHARMONICITY OF RUTILE SnO2 . . . PHYSICAL REVIEW B 86, 134302 (2012)
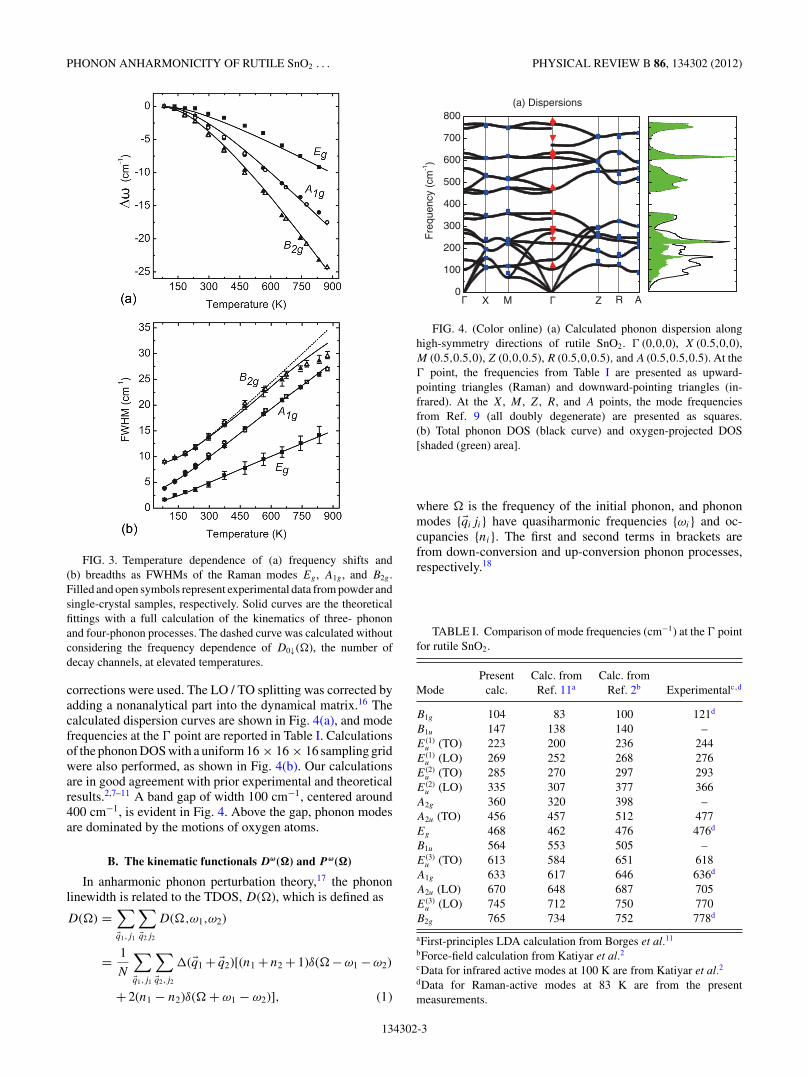
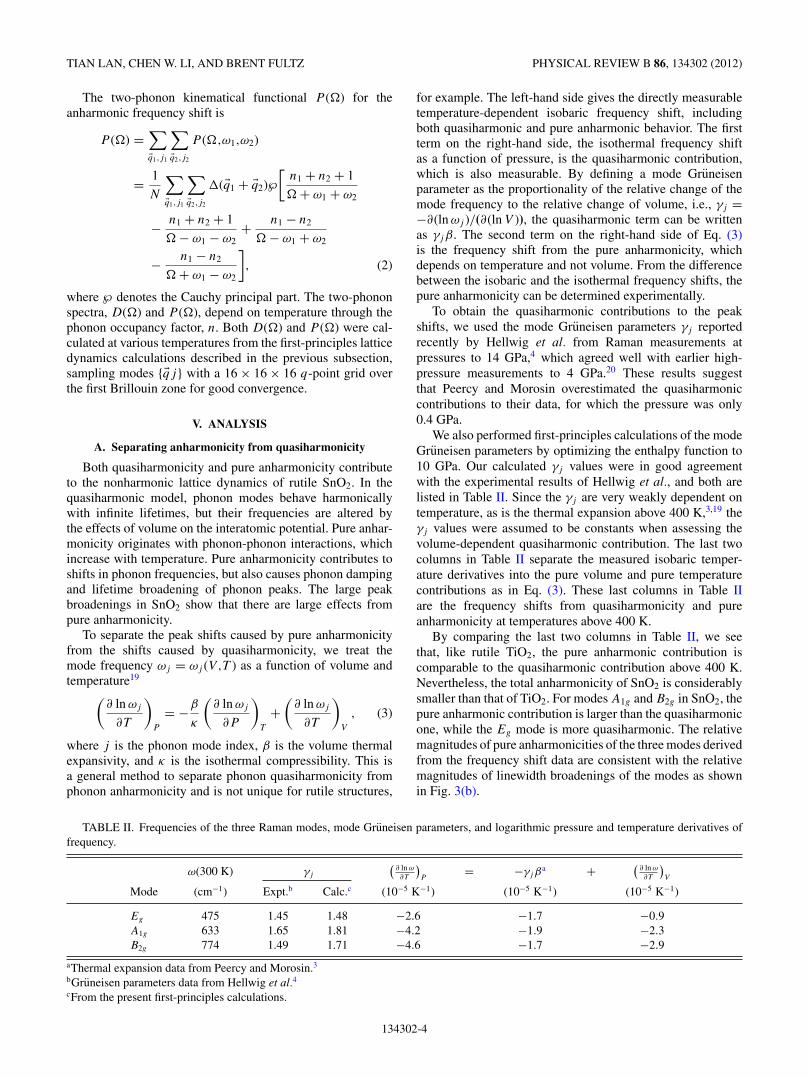
FIG. 3. Temperature dependence of (a) frequency shifts and(b) breadths as FWHMs of the Raman modes Eg , A1g , and B2g .Filled and open symbols represent experimental data from powder andsingle-crystal samples, respectively. Solid curves are the theoreticalfittings with a full calculation of the kinematics of three- phononand four-phonon processes. The dashed curve was calculated withoutconsidering the frequency dependence of D0↓(�), the number ofdecay channels, at elevated temperatures.
corrections were used. The LO / TO splitting was corrected byadding a nonanalytical part into the dynamical matrix.16 Thecalculated dispersion curves are shown in Fig. 4(a), and modefrequencies at the � point are reported in Table I. Calculationsof the phonon DOS with a uniform 16 × 16 × 16 sampling gridwere also performed, as shown in Fig. 4(b). Our calculationsare in good agreement with prior experimental and theoreticalresults.2,7–11 A band gap of width 100 cm−1, centered around400 cm−1, is evident in Fig. 4. Above the gap, phonon modesare dominated by the motions of oxygen atoms.
B. The kinematic functionals Dω(�) and Pω(�)
In anharmonic phonon perturbation theory,17 the phononlinewidth is related to the TDOS, D(�), which is defined as
D(�) =∑�q1,j1
∑�q2j2
D(�,ω1,ω2)
= 1
N
∑�q1,j1
∑�q2,j2
�(�q1 + �q2)[(n1 + n2 + 1)δ(�− ω1 − ω2)
+ 2(n1 − n2)δ(� + ω1 − ω2)], (1)
ARZX M
(a) Dispersions
0
100
200
300
400
500
600
700
800
Fre
quen
cy (
cm-1)
FIG. 4. (Color online) (a) Calculated phonon dispersion alonghigh-symmetry directions of rutile SnO2. � (0,0,0), X (0.5,0,0),M (0.5,0.5,0), Z (0,0,0.5), R (0.5,0,0.5), and A (0.5,0.5,0.5). At the� point, the frequencies from Table I are presented as upward-pointing triangles (Raman) and downward-pointing triangles (in-frared). At the X, M , Z, R, and A points, the mode frequenciesfrom Ref. 9 (all doubly degenerate) are presented as squares.(b) Total phonon DOS (black curve) and oxygen-projected DOS[shaded (green) area].
where � is the frequency of the initial phonon, and phononmodes {�qiji} have quasiharmonic frequencies {ωi} and oc-cupancies {ni}. The first and second terms in brackets arefrom down-conversion and up-conversion phonon processes,respectively.18
TABLE I. Comparison of mode frequencies (cm−1) at the � pointfor rutile SnO2.
aFirst-principles LDA calculation from Borges et al.11
bForce-field calculation from Katiyar et al.2cData for infrared active modes at 100 K are from Katiyar et al.2dData for Raman-active modes at 83 K are from the presentmeasurements.
134302-3
TIAN LAN, CHEN W. LI, AND BRENT FULTZ PHYSICAL REVIEW B 86, 134302 (2012)
The two-phonon kinematical functional P (�) for theanharmonic frequency shift is
P (�) =∑�q1,j1
∑�q2,j2
P (�,ω1,ω2)
= 1
N
∑�q1,j1
∑�q2,j2
�(�q1 + �q2)℘
[n1 + n2 + 1
� + ω1 + ω2
− n1 + n2 + 1
� − ω1 − ω2+ n1 − n2
� − ω1 + ω2
− n1 − n2
� + ω1 − ω2
], (2)
where ℘ denotes the Cauchy principal part. The two-phononspectra, D(�) and P (�), depend on temperature through thephonon occupancy factor, n. Both D(�) and P (�) were cal-culated at various temperatures from the first-principles latticedynamics calculations described in the previous subsection,sampling modes {�qj} with a 16 × 16 × 16 q-point grid overthe first Brillouin zone for good convergence.
V. ANALYSIS
A. Separating anharmonicity from quasiharmonicity
Both quasiharmonicity and pure anharmonicity contributeto the nonharmonic lattice dynamics of rutile SnO2. In thequasiharmonic model, phonon modes behave harmonicallywith infinite lifetimes, but their frequencies are altered bythe effects of volume on the interatomic potential. Pure anhar-monicity originates with phonon-phonon interactions, whichincrease with temperature. Pure anharmonicity contributes toshifts in phonon frequencies, but also causes phonon dampingand lifetime broadening of phonon peaks. The large peakbroadenings in SnO2 show that there are large effects frompure anharmonicity.
To separate the peak shifts caused by pure anharmonicityfrom the shifts caused by quasiharmonicity, we treat themode frequency ωj = ωj (V,T ) as a function of volume andtemperature19
(∂ ln ωj
∂T
)P
= −β
κ
(∂ ln ωj
∂P
)T
+(
∂ ln ωj
∂T
)V
, (3)
where j is the phonon mode index, β is the volume thermalexpansivity, and κ is the isothermal compressibility. This isa general method to separate phonon quasiharmonicity fromphonon anharmonicity and is not unique for rutile structures,
for example. The left-hand side gives the directly measurabletemperature-dependent isobaric frequency shift, includingboth quasiharmonic and pure anharmonic behavior. The firstterm on the right-hand side, the isothermal frequency shiftas a function of pressure, is the quasiharmonic contribution,which is also measurable. By defining a mode Gruneisenparameter as the proportionality of the relative change of themode frequency to the relative change of volume, i.e., γj =−∂(ln ωj )/(∂(ln V )), the quasiharmonic term can be writtenas γjβ. The second term on the right-hand side of Eq. (3)is the frequency shift from the pure anharmonicity, whichdepends on temperature and not volume. From the differencebetween the isobaric and the isothermal frequency shifts, thepure anharmonicity can be determined experimentally.
To obtain the quasiharmonic contributions to the peakshifts, we used the mode Gruneisen parameters γj reportedrecently by Hellwig et al. from Raman measurements atpressures to 14 GPa,4 which agreed well with earlier high-pressure measurements to 4 GPa.20 These results suggestthat Peercy and Morosin overestimated the quasiharmoniccontributions to their data, for which the pressure was only0.4 GPa.
We also performed first-principles calculations of the modeGruneisen parameters by optimizing the enthalpy function to10 GPa. Our calculated γj values were in good agreementwith the experimental results of Hellwig et al., and both arelisted in Table II. Since the γj are very weakly dependent ontemperature, as is the thermal expansion above 400 K,3,19 theγj values were assumed to be constants when assessing thevolume-dependent quasiharmonic contribution. The last twocolumns in Table II separate the measured isobaric temper-ature derivatives into the pure volume and pure temperaturecontributions as in Eq. (3). These last columns in Table IIare the frequency shifts from quasiharmonicity and pureanharmonicity at temperatures above 400 K.
By comparing the last two columns in Table II, we seethat, like rutile TiO2, the pure anharmonic contribution iscomparable to the quasiharmonic contribution above 400 K.Nevertheless, the total anharmonicity of SnO2 is considerablysmaller than that of TiO2. For modes A1g and B2g in SnO2, thepure anharmonic contribution is larger than the quasiharmonicone, while the Eg mode is more quasiharmonic. The relativemagnitudes of pure anharmonicities of the three modes derivedfrom the frequency shift data are consistent with the relativemagnitudes of linewidth broadenings of the modes as shownin Fig. 3(b).
TABLE II. Frequencies of the three Raman modes, mode Gruneisen parameters, and logarithmic pressure and temperature derivatives offrequency.
aThermal expansion data from Peercy and Morosin.3bGruneisen parameters data from Hellwig et al.4cFrom the present first-principles calculations.
134302-4
PHONON ANHARMONICITY OF RUTILE SnO2 . . . PHYSICAL REVIEW B 86, 134302 (2012)
B. Cubic and quartic anharmonicity
Anharmonicity tensors describe the coupling strengths forphonon-phonon interactions, but a prerequisite is that thephonons in these processes satisfy the kinematical conditionsof conservation of energy and momentum. An anharmonicitytensor element for an s-phonon process is21
where �(�q1 + · · · + �qs−1) enforces momentum conservationand the C(.)’s, elements of the s-phonon anharmonic tensor,are expected to be slowly varying functions of their arguments.The cubic anharmonicity tensor has been calculated by first-principles methods,18,22,23 but to our knowledge, the the quarticanharmonicity tensor has never been fully calculated from firstprinciples.
Nevertheless, if the anharmonicity tensor or its average doesnot vary significantly for different phonon processes, the cou-pling factor and the kinematic factor are approximately separa-ble in Eq. (4). The separation of the anharmonic coupling andthe kinematics has been used with success in many studies in-cluding our recent report on rutile TiO2.12 We consider the termC(j ; �q1j1; . . . ; �qs−1js−1) to be a constant of the Raman mode j
and use it as a fitting parameter. Although C(j ; �q1j1; �q2j2) andC(j ; j ; �q1j1; −�q1j1) change with j1 and j2, an average overmodes, 〈C(.)〉 = ∑
1,2 C(j ; �q1j1; �q2j2)/∑
1,2 1, is needed forthe fitting, where 1, 2 under the summation symbol represent�qiji . We define the cubic and quartic fitting parameters as
C(3)j = 〈C(j ; �q1j1; �q2j2)〉, (5a)
C(4)j = 〈C(j ; j ; �q1j1; −�q1j1)〉. (5b)
To the leading order of cubic and quartic anharmonicity, thebroadening of the Raman peaks is 2�(3)(j ; �). The frequencyshift of the Raman peaks is �Q + �(3) + �(3′) + �(4), wherethe quasiharmonic part �Q is the integral form of the firstterm in Eq. (3). These quantities can be written as functionsof D(�,ω1,ω2) and P (�,ω1,ω2), weighted by the averageanharmonic coupling strengths,12
�(3)(j ; �) = πh
64ωj0
∣∣C(3)j
∣∣2 ∑�q1,j1
∑�q2,j2
ω1ω2D(�,ω1,ω2)
= ωj0
∣∣C(3)j
∣∣2Dω(�), (6a)
�(3)(j ; �) = − h
64ωj0
∣∣C(3)j
∣∣2 ∑�q1,j1
∑�q2,j2
ω1ω2P (�,ω1,ω2)
= ωj0
∣∣C(3)j
∣∣2P ω(�), (6b)
�(3′)(j ) = − h
16Nωj0
∣∣C(3)j
∣∣2 ∑�q2j2
ωj2 (�q2)
(n�q2j2 + 1
2
), (6c)
�(4)(j ) = h
8Nωj0C
(4)j
∑�q1j1
ωj1 (�q1)
(n�q1j1 + 1
2
), (6d)
where Dω(�) and P ω(�) are functionals of D(�,ω1,ω2)and P (�,ω1,ω2) weighted by the kinematics of anharmonic
FIG. 5. (Color online) (a) Two-phonon density of states Dω(�)for 0 and 800 K. Arrows mark the positions of the three Ramanmodes, Eg , A1g , and B2g , respectively. The up-conversion and down-conversion contributions at 800 K are shown by green and blackdashed curves, respectively. There is no up-conversion process at0 K. (b) P ω(�) at 800 K.
phonon coupling. Figure 5 shows representative results forDω(�) and P ω(�) at 0 and 800 K. The down-conversion andup-conversion subspectra are also shown.
The �(3′) is an additional low-order cubic term thatcorresponds to instantaneous three-phonon processes.17 It isnonzero for crystals having atoms without inversion symmetry,as in the case of oxygen atom motions in the A1g mode. Itis much smaller than other contributions, however, owing tosymmetry restrictions.
With Eq. (6) and rigorous calculations of Dω(�) andP ω(�) at various temperatures, for each Raman mode both itsfrequency shift and its broadening were fitted simultaneouslywith the two parameters, |C(3)
j |2 and C(4)j . The best fits for
the shifts and broadenings are shown in Fig. 3, and thefitting parameters are listed in Table III. Figure 6 also showscontributions to the shift from the quasiharmonic and pureanharmonicity (dashed curves).
With a single parameter |C(3)|2 for each mode, good fittingsto the broadenings are obtained as shown in Fig. 3(b), indi-cating significant cubic anharmonicity for these Raman-activemodes. Moreover, our fittings also successfully reproducedthe unusual concave curvature of the B2g mode at hightemperatures. The |C(3)
j |2 values do not vary much amongdifferent modes, suggesting that the assumption of slowlyvarying properties of C(.) values is reasonable.
Starting with the same cubic fitting parameters used for thebroadenings, the frequency shifts of these modes are fit wellby adding the quasiharmonic and quartic anharmonic effects.
TABLE III. Fitting parameters for the temperature-dependentRaman modes (units: 1010 erg−1)
Eg A1g B2g
|C(3)|2 0.87 1.6 1.0−C(4) 1.0 2.6 7.3
134302-5
TIAN LAN, CHEN W. LI, AND BRENT FULTZ PHYSICAL REVIEW B 86, 134302 (2012)
FIG. 6. Fittings of the temperature dependence of the frequency shift of (a) the Eg mode, (b) the A1g mode, and (c) the B2g mode. Solidcurves are the final fittings to �Q + �(3) + �(3′) + �(4). Different contributions are indicated individually.
As shown in Fig. 6, the quartic contribution �(4) is generally ofthe same order as the cubic contribution �(3), consistent withthe fact that �(4) and �(3) are both leading-order terms for theanharmonic frequency shifts. For the Eg and A1g modes, thepure anharmonicity is mainly from the cubic terms, but forthe B2g mode, the quartic anharmonicity is dominant and is aslarge as the quasiharmonic part.
VI. DISCUSSION
We can understand why the B2g mode has a relatively largerquartic anharmonicity than the A1g mode from the differencesin how the O atoms move towards the Sn atoms. Using a unitcell with four O atoms and two Sn atoms, as shown in Fig. 1,the A1g mode has all four O atoms moving directly into oneSn atom in one-half of the cycle but moving between two Snatoms during the other half of the cycle. The B2g mode hastwo O atoms moving into a Sn atom and two O atoms movingbetween two Sn atoms in both halves of the vibrational cycle,making for a potential that is an even function of the phononcoordinate. Table III reports a larger quartic contribution forthe B2g than for the A1g mode. (The Eg mode does not havesimilar atom motions for comparison.)
The TDOS function Dω(�) in Fig. 5 shows large variationswith �, which explains a trend in the thermal broadening inFig. 3(b). Owing to the high frequency of the B2g mode, atthe temperatures used in this study its phonon-phonon anhar-monicity comes mostly from down-conversion processes, asshown in Fig. 5. Ignoring the small up-conversion contribution,at high temperatures24
Dω(�,T ) ∝ T∑�q1,j1
∑�q2,j2
δ(� − ω1 − ω2) ≡ T D0↓(�), (7)
where D0↓(�) is the number of two-phonon down-conversionchannels. Usually the line broadening is linear in T becauseD0↓(�) does not vary much with temperature. However, theB2g mode at 774 cm−1 lies on a steep gradient of Dω(�,T )in Fig. 5. Because the B2g mode undergoes a significant shiftof frequency with temperature, it moves down the gradientof Dω(�,T ), and its broadening is less than linear in T . Thetemperature dependence of the broadening of the B2g mode
has an unusual concave-downwards shape. For comparison,the dashed line in Fig. 3 was calculated without consideringthe frequency dependence of D0↓(�) at elevated temperatures,and it deviates substantially from the experimental trend.
The unusual temperature dependence of the linewidth of theB2g mode comes from the sharp peak in Dω(�,T ) centered at800 cm−1. This feature in the TDOS originates with the phononDOS of SnO2 shown in Fig. 4, which has a band gap between360 and 450 cm−1 associated with the mass difference betweenSn and O atoms. The shape of the TDOS can be understoodas the convolution of the phonon DOS with itself. With twoapproximately equal regions above and below the gap, theresult is a peak at 800 cm−1, with steep slopes on both sides.For comparison, although the TDOS of rutile TiO2 is shapedas a broad peak,12 it does not have the sharp features shown inFig. 5(a) because the mass difference between Ti and O atomsdoes not cause a band gap in the phonon DOS of TiO2.
Especially with more up-conversion processes at highertemperatures, there is another peak in the SnO2 TDOS, at400 cm−1. The up-conversion channels are primarily from thepairs of sharp peaks in the phonon DOS at 100 and 500, 200and 600, and 350 and 750 cm−1. Although the Eg mode at475 cm−1 is on the slope of this peak in the TDOS, the Eg
mode does not show anomalous broadening with temperaturebecause it undergoes only a small thermal shift in frequency.
In the low-temperature limit, up-conversion processes areprohibited because n → 0. The peak linewidth extrapolatedto 0 K is determined entirely by down-conversion processes,quantified by the down-conversion TDOS.24 The B2g modehas a significant broadening because its frequency is near apeak in the down-conversion TDOS, as shown in Fig. 5. Onthe other hand, the Eg and A1g modes are not broadened atlow temperatures because their frequencies are at low valuesof the TDOS. The phonon-phonon kinematics accounts for thesignificant difference in linewidths between the B2g and theother two Raman modes at low temperatures.
VII. CONCLUSIONS
Raman spectra were measured on rutile SnO2 at temper-atures from 83 to 873 K, and large anharmonic shifts andbroadenings were found for the three measurable Raman
134302-6
PHONON ANHARMONICITY OF RUTILE SnO2 . . . PHYSICAL REVIEW B 86, 134302 (2012)
peaks. Individual assessments of the cubic and quartic con-tributions to the anharmonicity were performed by calculatingthe kinematics of three-phonon and four-phonon processeswith ab initio methods and varying the anharmonic couplingparameters to fit the peak shifts and broadenings simultane-ously. The quartic anharmonicity of the B2g mode was foundto be large, unlike the Eg and A1g modes, for which cubicanharmonicity is dominant. The quartic behavior of the B2g
mode can be understood from the symmetry of the oxygenatom displacements.
The phonon DOS of SnO2 has a band gap around 400 cm−1
owing to the mass difference of Sn and O atoms, with a similarstructure above and below the gap. This causes a sharp peakin the TDOS at 800 cm−1. The frequency of the B2g modeis on the slope of this peak in the TDOS, and its frequencyshift with temperature reduces the number of down-conversion
channels for its broadening. The thermal broadening of the B2g
mode consequently shows an anomalous concave-downwardscurvature. At 0 K, the large TDOS around 800 cm−1 explainsthe large linewidth of the B2g mode. The anharmonic peakshifts and broadenings were well accounted for by thekinematics of phonon-phonon interactions, suggesting that,on average, the anharmonicity tensors for rutile SnO2 are notrich in structure.
ACKNOWLEDGMENTS
We thank George R. Rossman for help with the micro-Raman work and sample preparation. This work was supportedby the DOE BES under Contract No. DE-FG02-03ER46055.The work benefited from software developed in the DANSEproject under NSF award DMR-0520547.
*Corresponding author: [email protected]. Batzill and U. Diebold, Prog. Surf. Sci. 79, 47 (2005).2R. S. Katiyar, P. Dawson, M. M. Hargreave, and G. R. Wilkinson,J. Phys. C 4, 2421 (1971).
3P. S. Peercy and B. Morosin, Phys. Rev. B 7, 2779 (1973).4H. Hellwig, A. F. Goncharov, E. Gregoryanz, H.-K. Mao, and R. J.Hemley, Phys. Rev. B 67, 174110 (2003).
5T. Livneh, Y. Lilach, I. Popov, A. Kolmakov, and M. Moskovits,J. Phys. Chem. C 115, 17270 (2011).
6A. Dieguez, A. Romano-Rodrıguez, A. Vila, and J. R. Morante,J. Appl. Phys. 90, 1550 (2001).
7F. Gervais and W. Kress, Phys. Rev. B 31, 4809 (1985).8T. Sato and T. Asari, J. Phys. Soc. Jpn. 64, 1193 (1995).9K. Parlinski and Y. Kawazoe, Eur. Phys. J. B 13, 679 (2000).
10H. W. Leite Alves, C. C. Silva, A. T. Lino, P. D. Borges, L. M. R.Scolfaro, and E. F. da Silva Jr., Appl. Surf. Sci. 255, 752 (2008).
11P. D. Borges, L. M. R. Scolfaro, H. W. Leite Alves, and E. F. daSilva Jr., Theor. Chem. Acc. 126, 39 (2010).
12T. Lan, X. Tang, and B. Fultz, Phys. Rev. B 85, 094305 (2012).13F. Wang, X. Zhou, J. Zhou, T.-K. Sham, and Z. Ding, J. Phys. Chem.
C 111, 18839 (2007).14J. Menendez and M. Cardona, Phys. Rev. B 29, 2051 (1984).
15P. Giannozzi, S. Baroni, N. Bonini, M. Calandra, R. Car,C. Cavazzoni, D. Ceresoli, G. L. Chiarotti, M. Cococcioni,I. Dabo, A. Dal Corso, S. de Gironcoli, S. Fabris, G. Fratesi,R. Gebauer, U. Gerstmann, C. Gougoussis, A. Kokalj, M. Lazzeri,L. Martin-Samos, N. Marzari, F. Mauri, R. Mazzarello, S. Paolini,A. Pasquarello, L. Paulatto, C. Sbraccia, S. Scandolo, G. Sclauzero,A. P. Seitsonen, A. Smogunov, P. Umari, and R. M. Wentzcovitch,J. Phys.: Condens. Matter. 21, 395502 (2009).
16S. Baroni, S. de Gironcoli, A. Dal Corso, and P. Giannozzi, Rev.Mod. Phys. 73, 515 (2001).
17A. A. Maradudin and A. E. Fein, Phys. Rev. 128, 2589 (1962).18X. Tang, C. W. Li, and B. Fultz, Phys. Rev. B 82, 184301
(2010).19G. A. Samara and P. S. Peercy, Phys. Rev. B 7, 1131 (1973).20J. F. Mammone, M. Nicol, and S. K. Sharma, J. Phys. Chem. Solids
42, 379 (1981).21I. P. Ipatova, A. A. Maradudin, and R. F. Wallis, Phys. Rev. 155,
882 (1967).22A. Debernardi, Phys. Rev. B 57, 12847 (1998).23G. Deinzer, G. Birner, and D. Strauch, Phys. Rev. B 67, 144304
(2003).24X. Tang and B. Fultz, Phys. Rev. B 84, 054303 (2011).