A publication of The Fraser Institute
STUDIES IN
&ENTREPRENEURSHIPMARKETS
Number 7 / June 2008
Measuring EntrepreneurshipConceptual Frameworks and Empirical Indicators
Keith Godin, Jason Clemens, and Niels Veldhuis
Contents
Executive summary . . . . . . . . . . . . . . . . . . . . . . . . . . . . . . . . . . . . . . . . . . . . . . . . . . . . . . . . . . . . . . . . . . . . . . . . . . . . . . . . . . . . . 3
Introduction . . . . . . . . . . . . . . . . . . . . . . . . . . . . . . . . . . . . . . . . . . . . . . . . . . . . . . . . . . . . . . . . . . . . . . . . . . . . . . . . . . . . . . . . . . . 6
1 Conceptual frameworks . . . . . . . . . . . . . . . . . . . . . . . . . . . . . . . . . . . . . . . . . . . . . . . . . . . . . . . . . . . . . . . . . . . . . . . . . . . . . . . . 7
2 Current measures of entrepreneurship . . . . . . . . . . . . . . . . . . . . . . . . . . . . . . . . . . . . . . . . . . . . . . . . . . . . . . . . . . . . . . . . . 15
3 Measuring entrepreneurship: empirical indicators . . . . . . . . . . . . . . . . . . . . . . . . . . . . . . . . . . . . . . . . . . . . . . . . . . . . . . 19
4 Conclusions and recommendations . . . . . . . . . . . . . . . . . . . . . . . . . . . . . . . . . . . . . . . . . . . . . . . . . . . . . . . . . . . . . . . . . . . . 44
Appendix A: Data sources and comparability . . . . . . . . . . . . . . . . . . . . . . . . . . . . . . . . . . . . . . . . . . . . . . . . . . . . . . . . . . 46
Appendix B: Supplement to key conceptual frameworks—William Baumol . . . . . . . . . . . . . . . . . . . . . . . . . . . . . 53
References . . . . . . . . . . . . . . . . . . . . . . . . . . . . . . . . . . . . . . . . . . . . . . . . . . . . . . . . . . . . . . . . . . . . . . . . . . . . . . . . . . . . . . . . . . . . 56
About the authors . . . . . . . . . . . . . . . . . . . . . . . . . . . . . . . . . . . . . . . . . . . . . . . . . . . . . . . . . . . . . . . . . . . . . . . . . . . . . . . . . . . . . 64
Acknowledgments . . . . . . . . . . . . . . . . . . . . . . . . . . . . . . . . . . . . . . . . . . . . . . . . . . . . . . . . . . . . . . . . . . . . . . . . . . . . . . . . . . . . 65
Studies in Entrepreneurship and Markets are published periodically throughout the year by the Fraser Institute, Vancouver, British Columbia, Canada.
The Fraser InstituteOur vision is a free and prosperous world where individuals benefit from greater choice, competitive markets, and personal responsibility. Our mission is to measure, study, and communicate the impact of competitive markets and government interventions on the welfare of individuals.
Founded in 1974, we are an independent research and educational organization with locations throughout North America and international partners in over 70 countries. Our work is financed by tax-deductible contributions from thou-sands of individuals, organizations, and foundations. In order to protect its independence, the Institute does not accept grants from government or contracts for research.
To order additional copies of Studies in Entrepreneurship and Markets, any of our other publications, or a catalogue of the Institute’s publications, please contact the publications coordinator via e-mail: [email protected]; via telephone: 604.688.0221, ext. 580 or, toll-free, 1.800.665.3558, ext. 580; via fax: 604.688.8539.
For media enquiries, please contact our Communications department via 604.714.4582 or [email protected].
To learn more about the Institute, please visit our web site at www.fraserinstitute.org.
Copyright© 2008 Fraser Institute. All rights reserved. No part of this publication may be reproduced in any manner what-soever without written permission except in the case of brief quotations in critical articles and reviews.
The authors of this study have worked independently and opinions expressed by them are, therefore, their own, and do not necessarily reflect the opinions of the supporters, employees, or trustees of the Fraser Institute. This publication in no way implies that the Fraser Institute, its trustees, or staff are in favour of, or oppose the passage of, any bill, or that they support or oppose any particular political party or candidate.
Editing and typesetting: Kristin Fryer Design: Lindsey Thomas Martin
Printed and bound in Canada ISSN 1718-0724 Studies in Entrepreneurship and Markets (print) ISSN 1718-0732 Studies in Entrepreneurship and Markets (online)
Date of issue: June 2008
For information about how to support the Fraser Institute, please write to:
• DevelopmentDepartment, Fraser Institute
Fourth Floor, 1770 Burrard Street
Vancouver, British Columbia, V6J 3G7 Canada
or contact the Development Department: • viatelephone,toll-free:1.800.665.3558ext.586
• viae-mail:[email protected]
Calgary • viatelephone:403.216.7175ext.227 • viafax:403.234.9010
Montreal • viatelephone:514.281.9550ext.305 • viafax:514.281.9464
Toronto • viatelephone:416.363.6575ext.232 • viafax:416.934.1639.
Vancouver • viatelephone:604.688.0221ext.586 • viafax:604.688.8539
Fraser Institute / Studies in Entrepreneurship and Markets 7
Measuring Entrepreneurship: Conceptual Frameworks and Empirical Indicators / 3
Executive summary
This study is the first installment in a long-term research project aimed at measuring entrepre-
neurship . Entrepreneurship has become a focal point of public policy as governments at all
levels have made promoting entrepreneurship a priority . However, existing research is far from
conclusive in terms of providing a comprehensive definition or measure of entrepreneurship . If
entrepreneurship is not comprehensively defined or measured, then it is virtually impossible to
understand where and why it flourishes, and there is no way to assess the effectiveness of public
policies aimed at entrepreneurship . Therefore, the most pressing issue for this area of study is the
development of a reasonable consensus as to the meaning of entrepreneurship and a measure
of entrepreneurship that is reliable and easy to understand .
To help resolve this issue, this study first presents the most important definitions of entre-
preneurship and explores their similarities and differences . Then it examines the most widely
cited and used measures of entrepreneurship and discusses their strengths and weaknesses .
Finally, this study explores a number of empirical indicators that could be used to create a com-
prehensive measure of entrepreneurship .
Defining entrepreneurship
While research has grown considerably in the last two decades, there is still no consensus regard-
ing the meaning of entrepreneurship . To help fill the void in this area, this study presents the most
important conceptual frameworks of entrepreneurship and examines their common themes
and differences . One of our most important findings is that, despite their unique characteristics,
the German, Chicago, and Austrian schools of thought on entrepreneurship have six common
elements:
• Enterprise: entrepreneurshipistheprocessofbringingnewideasintothemarketfor
the pursuit of profit;
• Innovation: entrepreneurs“innovate”bybeingalerttoprofitableopportunitiesand
having the ability to combine existing resources in new and different ways to bring a
new idea into the market;
• Process: entrepreneurshipisatemporaryprocessofcommercializinganideathatcon-
sists of different functions (i .e ., the innovating function, the financing function, etc .);
• Risk-taking: theentrepreneurshipprocessconsistsofbringinganewideaintothemar-
ket in the face of an uncertain outcome;
• Spectrumofentrepreneurialaction: entrepreneurshipcanrangefromgrandandradi-
cal new innovations to more incremental, smaller innovations such that it can exist in a
numberofdifferenttypesandsizesoforganizations;and,
• Economicchange: entrepreneurshipisacauseofeconomicchangeinthatitbrings
new innovation into the market, creating jobs, wealth, and business opportunities .
Fraser Institute / Studies in Entrepreneurship and Markets 7
4 / Measuring Entrepreneurship: Conceptual Frameworks and Empirical Indicators
These common aspects are important for two reasons: 1) they provide a first step towards a com-
prehensive definition of entrepreneurship, and 2) they provide criteria for measurement .
Current measures of entrepreneurship
Having multiple definitions of entrepreneurship results in a large number of different measures
of entrepreneurship . Many current entrepreneurship measures are limited in scope because
they (often purposely) focus on just one aspect of entrepreneurship, such as self-employment
or business start-up rates . Moreover, many of these measures suffer from methodological and
statistical problems . Overall, the current stock of measures fails to provide a comprehensive pic-
ture of entrepreneurship .
For example, one of the mostly widely used measures of entrepreneurship is the Global
Entrepreneurship Monitor’s (GEM) Total Entrepreneurial Activity (TEA) Index, a calculation of the
adultpopulationengagedinentrepreneurialactivity.GEM’sTEAIndexhadbeenwidelycriticized
by numerous researchers for its failure to measure entrepreneurship that occurs within firms, its
failure to use better data, and its lack of comparability across regions due to different interpreta-
tions of survey responses (Audretsch, 2002; OECD, 2006; Baumol et al ., 2007) .
Empirical indicators of entrepreneurship
Since the current research fails to provide a comprehensive measure of entrepreneurship, this
study presents and discusses 11 empirical indicators that could be used to create such a mea-
sure . Our aim is to present a catalogue of indicators that have been cited as important measures
of entrepreneurship and/or are well connected to the six common aspects of entrepreneurship
listed above . This study also discusses the advantages and disadvantages of each indicator of
entrepreneurship . The indicators for which data are readily available and comparable for Cana-
da’s provinces and the US states include:
• Businesscreation: theprocessofstartinganewenterprise,theprimarywayinwhich
people bring ideas to the market;
• Self-employment: thenumberofindividualswhomakeanoccupationalchoiceand
take the risk of working on their own, rather than for an employer;
• Smallbusinesses: definedinthisstudyashaving1-49employees,thesebusinessesrep-
resent another vehicle though which entrepreneurs bring innovations to the market;
• Venturecapital: theresources raised for thepurposeof investing inpotentialhigh-
growth businesses . This unique indicator captures numerous functions within the entre-
preneurship process;
• Researchanddevelopment(R&D): thepursuitofanewproductorprocessintheface
of an unknown outcome, and a measure of entrepreneurship that occurs within existing
and larger firms; and,
• Patents: aproxyfortheinnovativeaspectofentrepreneurship.
Fraser Institute / Studies in Entrepreneurship and Markets 7
Measuring Entrepreneurship: Conceptual Frameworks and Empirical Indicators / 5
The examination of the above-noted indicators is followed by a discussion of indicators that
may also be important, but currently suffer from data availability and comparability problems .
These include business expansion, business ownership, innovation, initial public offerings, and
business losses .
Conclusions and recommendations
This study, the overarching goal of which is to develop a comprehensive measure of entrepre-
neurship, offers two key recommendations:
1) Thecommonaspectsofentrepreneurshipshouldbeopenlyandcarefullyreviewedand
discussed in terms of relevance and priority, so as to determine how a unified concep-
tual framework for measurement could be constructed .
2) Theempiricalindicatorspresentedshouldbefurtherscrutinizedanddiscussedtodeter-
mine whether they should be included in a comprehensive measure of entrepreneur-
ship, and how they might best be measured .
Having a sound concept of entrepreneurship and knowing where it flourishes will have a pro-
found effect on the discussion of government policy . Once we are able to measure entrepre-
neurship, we will be able to investigate the reasons why some regions have more than others,
and will begin to understand and promote policies that will create an environment conducive
to entrepreneurship .
Fraser Institute / Studies in Entrepreneurship and Markets 7
6 / Measuring Entrepreneurship: Conceptual Frameworks and Empirical Indicators
Introduction
Entrepreneurship has become a focal point of public policy . Governments at all levels and in
many countries have made promoting entrepreneurship a priority (OECD, 2006) .[1] In addition,
there is a growing recognition that entrepreneurship is critical to economic prosperity (Baumol
et al ., 2007) . However, despite the growing interest and focus on entrepreneurship, there is still
no adequate comprehensive measure of entrepreneurial activity . In order to assess the effective-
ness of public policies aimed at entrepreneurship, we must first define and measure it .
A major problem one encounters when trying to measure entrepreneurship is the lack
of consensus regarding its meaning . While the view that entrepreneurship positively impacts
economic growth is widely held, the definitions of entrepreneurship are scattered and numerous .
This lack of consensus with respect to the meaning of entrepreneurship has created a second
problem: a wide array of measures . Some of the most widely cited measures of entrepreneur-
ship use different definitions of entrepreneurship that are narrow in scope . Overall, the current
stock of measures fails to provide a tool for comparing entrepreneurship across regions that is
reliable and easy to understand .
The Centre for Entrepreneurship and Markets at the Fraser Institute has embarked upon
an initiative to help fill the void in this research . This study is part of a long-term research project,
the goal of which is to develop a comprehensive measure of entrepreneurship .
Organization of this study
Thisstudyisdividedintofourmainsections.Thefirstsectionsummarizesthemostimportant
definitions of entrepreneurship . It highlights common aspects of these definitions and potential
measurement challenges . The second section briefly reviews the current research on entrepre-
neurship measurement, while the third discusses empirical indicators that could be used in a
comprehensive measure . The fourth and final section presents the conclusions and recommen-
dations of this study .
1 For example, both Canada and the United States have numerous policies and programs that focus on entrepreneurship, including preferential tax rates, start-up subsidies, and favourable regulations .
Fraser Institute / Studies in Entrepreneurship and Markets 7
Measuring Entrepreneurship: Conceptual Frameworks and Empirical Indicators / 7
1 Conceptual frameworks
A major barrier to measuring entrepreneurship is the lack of a consensus as to its meaning . As
renownedeconomistWilliamBaumolhaswritten,theentrepreneuris“atonceoneofthemost
intriguing and one of the most elusive characters that constitutes the subject of economic analy-
sis”(1993:2).However,ifwecannotdefineentrepreneurship,thenitwillbevirtuallyimpossibleto
measure it . This section presents the research on the main definitions of entrepreneurship .[2]
There are several reasons why researchers have had a difficult time defining entrepreneur-
ship . First, there is no agreement on whether entrepreneurship is a characteristic of people—the
so-called“captainsofindustry”—orwhetheritisaprocess.Second,sinceentrepreneurialactivity
often overlaps with other business activities, such as management, it is difficult to isolate when
andwhereitactuallyhappens.Third,entrepreneurshipcanoccurinnumerousorganizational
forms, includingnewsmallbusinesses,divisionswithinfirms,andevennon-profitorganiza-
tions .[3] Fourth, there is disagreement on whether entrepreneurship should be defined by the
characteristics of entrepreneurs, how they make their decisions, or how they create opportuni-
ties(Alvarez,2005).[4]
The combination of these factors has left researchers without a clear understanding of
entrepreneurship and, thus, little ability to develop a comprehensive measure . As Scott Shane
andS.Venkataramanexplain,“Forafieldofsocialsciencetohaveusefulness,itmusthavea
conceptual framework that explains and predicts a set of empirical phenomena not explained
or predicted by conceptual frameworks already in existence in other fields . To date, the phenom-
enonofentrepreneurshiphaslackedsuchaconceptualframework”(2000:217).
There are essentially three main schools of thought on entrepreneurship: 1) the German
tradition, based almost exclusively on the work of Joseph Schumpeter; 2) the Chicago tradition,
based on the work of Frank Knight; and 3) the Austrian tradition, based on the work of Israel
Kirzner.[5]Eachoftheseschoolsoffersarelativelydistinctconceptualframework.[6]
The German traditionThe German school of thought is based almost entirely on the work of Joseph Schumpeter .
Schumpeter viewed entrepreneurship as the process of combining resources in new and differ-
ent ways to bring ideas to the market . In this sense, Schumpeter’s entrepreneur is an innovator—
an individual who disturbs the status quo by replacing existing firms or ideas with new firms,
2 The research on personal characteristics or determinants of the success of entrepreneurial businesses is not discussed in this section . However, there is a large and growing body of research that examines the characteristicsofentrepreneurs—namely,psychologicaltraitsanddemographics.Forexample,seeLazear(2003), Blanchflower and Oswald (1998), Byers et al . (1997), and Quince and Wittaker (2003) .
3 Foradiscussionofentrepreneurshipasanon-profitactivity,seeBenz(2006).
4 Adding to the difficulty of defining entrepreneurship is the fact it crosses multiple academic disciplines, including economics, sociology, psychology, business history, and management science .
5 A similar conclusion regarding these schools of thought was drawn by Hébert and Link (1989) .
6 Forahistoricalreviewofentrepreneurshiptheory,seeRicketts(2006)andvanPraag(1999).
Fraser Institute / Studies in Entrepreneurship and Markets 7
8 / Measuring Entrepreneurship: Conceptual Frameworks and Empirical Indicators
products, or processes . This process is a dynamic one, as the entrepreneurs who bring innova-
tions to the market replace businesses (or their products, services, or processes) that are no lon-
ger competitive, while simultaneously placing pressure on existing firms to become competitive .
This kind of entrepreneurial action causes economic change .
To understand Schumpeter’s concept of entrepreneurship, it is important to review his
concept of economic change . He argues that economic growth is based on the evolutionary pro-
cessofcapitalism:“thefundamentalimpulsethatsetsandkeepsthecapitalistengineinmotion
comes from the new consumers’ goods, the new methods of production or transportation, the
newmarkets,thenewformsofindustrialorganizationthatcapitalistenterprisecreates”(1942:83).
Hedescribescapitalismasaprocessof“creativedestruction”wherebytheeconomicstructureof
society is changed from within as new products, processes, and markets replace old ones .
Theprocessofeconomicchangerequireswhathecalls“adaptiveresponses”and“cre-
ativeresponses.”Anadaptiveresponseisamechanicalkindofcalculationthatresultsinan
increaseinthesizeoftheeconomy.Forexample,ifthepopulationweretoincrease,employers
wouldrespondbyhiringmoreworkers.Whiletheoverallsizeoftheeconomywouldincrease,the
sizeoftheeconomyrelativetothepopulationwouldremainunchanged.Acreativeresponse,on
the other hand, is a process of doing things out of the ordinary whereby people create a unique
combination of resources, such as a new product or process . The creativity people use to bring
newinnovationstothemarketiscriticalbecauseitincreasesthesizeoftheeconomyrelative
to its population . Schumpeter describes the creativity involved in creating economic change as
entrepreneurial,notingthat“themechanismsofeconomicchangeincapitalistsocietypivoton
entrepreneurialactivity”(1947/2005:222).
An important characteristic of Schumpeter’s definition of entrepreneurship is that it is a
process that consists of different functions . This process is the bringing of a new idea to the mar-
ket; the functions are the individual actions taken to achieve this process . While in reality these
functions often overlap, each action is conceptually different . Central to the entrepreneurship
processisthe“entrepreneurialfunction,”whichisto“identifynewcombinationsandreactto
thesebyexercisingtheleadershiptoprofitfromthem”(Iversenetal.,2005:4).Schumpeteridenti-
fies five types of innovation, or creative responses, that make up the entrepreneurial function:
1) Theintroductionofanewgood,oranewqualityofgood,thatiscurrentlynotknownto
consumers;
2) The introduction of a new method of production or process;
3) The opening of a new market in an area where that market had not existed previously,
whether or not that market had existed previously in some other area;
4) Theconquestofanewsourceofrawmaterialsorotherinputs,irrespectiveofwhether
that source already exists; and,
5) Theeffectingofaneworganizationofany industry—forexample,thecreationofa
monopoly position or the breaking up of a monopoly position (1934/2005: 66) .
The entrepreneurial function, therefore, is the creative and temporary act of combining
resourcesinnewways.InSchumpeter’swords,“everyoneisanentrepreneuronlywhenheactu-
ally ‘carries out a new combination,’ and loses that character as soon as he has built up his business,
whenhesettlesdowntorunningitasotherpeopleruntheirbusinesses”(1934/2005:78).Though
Fraser Institute / Studies in Entrepreneurship and Markets 7
Measuring Entrepreneurship: Conceptual Frameworks and Empirical Indicators / 9
the entrepreneurial function is creative, it is distinct from that of the inventor, and from the function
of developing ideas (Schumpeter, 1947/2005: 224) . As Schumpeter argues, the inventor produces
ideas,buttheentrepreneur“getsthingsdone”bybringingthoseinventionstothemarket.Thus,
theentrepreneurialfunction,accordingtoSchumpeter,isthecommercializationofaninvention.
Another function within the entrepreneurial process is financing, which Schumpeter
describes as the capitalist function . In order to bring innovations to the market, the entrepreneur
needs capital to start and operate his or her business (1934/2005: 74) . Thus, this function intro-
duces the element of risk into the entrepreneurial process . By lending money to the entrepreneur
in exchange for interest, the capitalist bears the risk of the entrepreneurial process .
It is important to note Schumpeter does not limit his theory of entrepreneurship to those
whoaretypicallythoughtofasentrepreneurs—theso-called“captainsofindustry.”Infact,as
Mark Frank (1998) explains in is his review of Schumpeter, his theory had far reaching applications
toentrepreneurshipwithincorporationsandotherorganizations.
In sum, entrepreneurship, according to Schumpeter, is a process whereby people bring
innovations (goods, services, processes, and so on) to consumers . This process is dynamic in
the sense that the entrepreneurs who bring innovations to the market replace businesses (or
products or processes) that are no longer competitive, while simultaneously placing pressure
on existing firms . The entrepreneurial act of bringing new innovations to the market causes
economic change .
The Chicago traditionIn contrast to Schumpeter, Frank Knight’s concept of entrepreneurship relies on his view that
there are some people who have unique characteristics that make them entrepreneurs . Entre-
preneurship, therefore, is defined by the actions taken by these individuals . Knight’s concept of
entrepreneurship can be divided into two parts: the first establishes the nature of entrepreneur-
ship, and the second specifies the entrepreneur’s functions .
The nature of entrepreneurshipKnight notes that all people vary in their preferences, knowledge, and abilities, which together
determine what people do . According to Knight, foresight, managerial ability, confidence in one’s
judgment,andthedispositionto“backitup”withactionarecharacteristicsthatareuniqueto
entrepreneurs (1921/1964: 270) . Those who have superior abilities in these areas will make up a
“specialsocialclass”ofbusinessmenwhodirecteconomicactivity:“theyareinthestrictsensethe
producers, while the great mass of the population merely furnish them with productive services,
placingtheirpersonsandtheirpropertyatthedisposalofthisclass”(1921:271).Thisviewcontrasts
with that of Schumpeter, who argues that the potential for entrepreneurship exists in everyone .
According to Knight, a key aspect of entrepreneurship is acting in the face of uncer-
tainty . Entrepreneurs must use their unique skills to deliver a new product or process, though
the outcome of their actions is unknown . This burden is unique to entrepreneurs . Employees
and managers of firms face no such uncertainty because their incomes are typically known in
advance . The reward of the owner of the firm or the entrepreneur for being successful in the face
of uncertainty is the (temporary) profit generated by the firm he or she has created .[7]
7 The owner can be an individual, a group, or a legal identity such as a corporation .
Fraser Institute / Studies in Entrepreneurship and Markets 7
10 / Measuring Entrepreneurship: Conceptual Frameworks and Empirical Indicators
Functions of an entrepreneurKnightspecifiesthreefunctionsofanentrepreneur.Thefirstandprimaryfunctionis“thatof
leadershiporeconomicpioneering;itistoinitiateusefulchangesorinnovations”(1942:128).
The incentive for this function is profit . Similar to Schumpeter, Knight argues that this innovative
function is distinct from that of the inventor or the research scientist in that the entrepreneur
brings those inventions to the market . He defines innovation as a novel change in the character
of products and/or some improvement in the method of production .
Thesecondfunctionofanentrepreneuristhatof“adaptationtochangingconditions.”
Theentrepreneurmustbeableto“forecast”oranticipatechangesinthemarketinorderfor
his or her business to remain successful . Though Knight does not develop an explicit differ-
encebetweenthe“manager”and“entrepreneur,”thisfunctionseparatesonefromtheother.As
Knightnotes,“entrepreneurshipisthemore‘dynamic’activity,connectedwiththemajorormore
important changes, in contrast with management, which is closer to routine activities which can
beclassedas‘labour’”(1942:129).
The third function of an entrepreneur is bearing uncertainty . Knight argues that the entre-
preneur,astheownerofanyenterprise,“placeshimselfinthepositiontotaketheconsequences
of such [unforeseen] changes, (wholly or up to a point) relieving those from whom he hires pro-
ductiveagentsofthisuncertaintyandinsecurity”(1942:129).Thisisthemostimportantdiffer-
ence between Knight and Schumpeter, who argues that the entrepreneurial function involves
no risk .[8]
In sum, Frank Knight’s view is that entrepreneurship consists of actions taken by people
with certain personal attributes to bring new products and services to the market in the face of
uncertain outcomes . Their reward for having these skills and bearing the risk of failure is profit .
The Austrian traditionAsanAustrianschooleconomist,IsraelKirznerhasaviewofentrepreneurshipthatisfundamen-
tally different from that of Schumpeter and Knight .[9] His unique conceptual framework can be
divided into three parts: the nature of entrepreneurship, entrepreneurial discovery, and func-
tions of the entrepreneur .
The nature of entrepreneurshipKirznerarguesthatthereismoretoeconomicactivitythanjustpeoplemakingmechanicalcal-
culations with their resources . He argues that people are alert to the world around them and
thus use new information and resources to make better decisions . In this sense, the nature of
entrepreneurship is to be alert to better information and to use new information creatively to
improvewell-being.Inthisway,Kirznertakesamuchbroaderviewofentrepreneurshipthan
Schumpeter and Knight .
8 Within Schumpeter’s theory of the entrepreneurial process, risk bearing is attached to the capitalist function .
9 Kirzner’sseminalworkonentrepreneurshipishis1973book,Competition and Entrepreneurship. A similar andshorterdescriptionofKirzner’sentrepreneurcanbefoundinalatertext,Perception, Opportunity, and Profit: Studies in the Theory of Entrepreneurship (Kirzner,1979),aswellasinanarticleintheJournal of Eco-nomic Literature (Kirzner,1997).SeealsoDouhanetal.(2007)forasummaryofthiswork.
Fraser Institute / Studies in Entrepreneurship and Markets 7
Measuring Entrepreneurship: Conceptual Frameworks and Empirical Indicators / 11
Entrepreneurship can also be understood within the context of decision making . The
entrepreneurialelementinhumanactioncomesintoeffectwhenpeoplerecognizeanewwayof
doingthings.Kirznercalledthisrecognition“alertnesstohithertounnoticedopportunities”(1973:
39).ForKirzner,this“elementofalertnesstopossiblynewlyworthwhilegoalsandtopossibly
newlyavailableresources—whichwehaveseenisabsentfromthenotionofeconomizingbut
very much present in that of human action—[is] the entrepreneurial element in human decision
making . It is this entrepreneurial element that is responsible for our understanding of human
actionasactive,creative,andhumanratherthatpassive,automatic,andmechanical”(1973:35).
Essentially, the nature of entrepreneurship can be understood as the process of seeing (and car-
rying out) new ways of doing things that were previously unnoticed by others .
Kirzneremphasizesthedifferencebetweenalertnessandthecommandofknowledge.
Heexplainsthatthereisa“temptationtoconceiveoftheentrepreneurasonewhosimplyknows
more accurately than others do where resources can be purchased most cheaply, where products
can be sold at the highest prices, what technological or other innovations will prove most fruitful,
whichassetscanbeexpectedtoincreasemostinvalue,andsoon”(1973:66).However,themost
criticalaspectofentrepreneurshipisalertnesstoinformationratherthanpossessionofit.Put
differently,“thekindof‘knowledge’requiredforentrepreneurshipis‘knowingwheretolookfor
knowledge’ratherthanknowledgeofsubstantivemarketinformation”(1973:68).
Entrepreneurial discoveryKirznerarguesthattheopportunitytomakebetterdecisionsexistsbecausenoonehasperfect
information . In other words, because we all make decisions with the (imperfect) knowledge we
have, we always have the opportunity to better our decisions through additional information .
This constant lack of knowledge provides endless opportunities for people to improve their posi-
tion by gaining more or better information . Essentially, this means that a knowledgable entre-
preneur is an arbitrageur—an individual who finds and sells some combination of resources
for more than their combined purchase price before someone else notices the opportunity . An
important aspect of this arbitrage process is that, similar to Knight’s view, entrepreneurs make
these decisions and take action in the face of uncertain outcomes .
Kirzner(1982)alsoexplainsthatthereisaspectrumofentrepreneurialopportunities,
from the smallest incremental decisions to the more radical innovations . The implication of this
viewisthatentrepreneurshipcanoccurinnumerousorganizationalforms,includingsmallbusi-
nesses,largefirms,andevennon-profitorganizations.
Functions of the entrepreneurSimilartoSchumpeter,Kirznermakesthedistinctionbetweenanentrepreneurandacapitalist.
He argues that the pure entrepreneur does not need to be a capitalist and, therefore, does not
need to invest anything of his own . That is, it is possible for an entrepreneur to make a profit by
offering an interest payment attractive enough to persuade someone to advance the necessary
funds.InKirzner’sview,thisismerelyacomponentofbuyingresourcesatlowpricesandselling
productsathigherprices:“theimportantpointisthatanalyticallythepurelyentrepreneurialrole
does not overlap [with] that of the capitalist, even though, in a world in which almost all produc-
tion processes are more or less time-consuming, entrepreneurial profit opportunities typically
requirecapital”(1973:49).
Fraser Institute / Studies in Entrepreneurship and Markets 7
12 / Measuring Entrepreneurship: Conceptual Frameworks and Empirical Indicators
AswithSchumpeter,Kirznerarguesthattheentrepreneurialfunctionisonlytemporary.
An entrepreneur is no longer only an entrepreneur after the purchase of resources . As a result of
earlier entrepreneurial decisions, he has become an owner of resources .[10]
Insum,forIsraelKirzner,entrepreneurshipisaprocesswherebypeoplebecomealertto
opportunities previously unnoticed by others and use these opportunities to bring ideas to the
market, in the face of uncertain outcomes . In his view, all people have an entrepreneurial ele-
mentintheirdecisionmaking,whichhedescribesas“knowingwheretolookforknowledge.”
Because no one has perfect information, there are always opportunities to act entrepreneurially
by acquiring information and making better decisions .
Towards a comprehensive conceptual framework
This section presents common themes and discusses areas of disagreement among the defi-
nitions of entrepreneurship discussed above .[11] Despite their unique characteristics, the Ger-
man, Chicago, and Austrian schools of thought have six common aspects: enterprise, innovation,
process, risk-taking, spectrum of entrepreneurial action, and economic change . These common
aspects are critical as they not only provide a first step towards a comprehensive definition of
entrepreneurship, but they also provide a foundation for measurement . Areas of disagreement
are equally valuable, as they indicate which important conceptual issues remain to be resolved .
EnterpriseSchumpeter,Knight,andKirznerallagreethatthepursuitofprofit—thedesiretocapturea
reward for one’s effort—is one of the central drivers of entrepreneurial activity . As Schumpeter
emphasizes,acriticalaspectoftheentrepreneurialprocessistransformingideasintoprofits,
rather than innovating for the sake of innovation . While this may be obvious, the fact that entre-
preneurshipisenterprisingmeansthatentrepreneurshipcannotexistoroccurinorganizations
such as government .[12]
10 Alongthisline,Kirznerpointsoutthatacorporatestockholderisnotanentrepreneur.Thestockholderisa capitalist who buys a share of ownership in the firm; ownership and entrepreneurship are separate func-tions.However,“iftheinstitutionalenvironmentofthecorporatefirmissuchthatmanagers,incontrollingthe firm’s operations, are able to reap private benefit for themselves, we may indeed ascribe entrepreneur-ship to them—not in the sense of ‘control’ but in the sense of putting resources to use in superior (and ‘profitable’)opportunitiesasyetunnoticedbyothers”(1973:62).
11 The key conceptual frameworks discussed in this section are certainly not the only view of entrepreneur-ship . In the last two decades theoretical research into entrepreneurship has blossomed; however, much of this research is based on the key work discussed (Iversen et al ., 2005) . For example, see Cunningham and Lischeron (1991), Hébert and Link (1989), Shane and Venkataraman (2000), Casson (2003), Montanye (2006), and Ahmad and Seymour (2008) .
12 However, that is not to say that entrepreneurship cannot exist in the non-profit sector . Recent research has arguedthatthe“profit”ofentrepreneursinthatsectorarethegains(rents)capturedbyexpandingtheorganization(seeBenz,2006,andParker,2005).
Fraser Institute / Studies in Entrepreneurship and Markets 7
Measuring Entrepreneurship: Conceptual Frameworks and Empirical Indicators / 13
InnovationThesecondaspectofentrepreneurshipisinnovation:entrepreneurs“innovate”byenvisioninga
profitable opportunity and combining resources to bring a new idea to the market . Schumpeter,
Knight,andKirznerallagreethatentrepreneurshipischaracterizedbydecisionmakingthatis
beyond the ordinary, mechanical kind of calculations, and is creative and requires foresight . How-
ever, there are important differences between their views . Knight argues that these unique char-
acteristics can only be held by certain individuals who are part of a special class of businessmen .
Kirzner,incontrast,arguesthattheseuniquecharacteristicscanbeheldbyanyone,andthatthese
characteristics are present in creative decision making . He also states that a unique characteristic of
entrepreneurship is being alert to opportunities . Schumpeter does not make an explicit argument
in this regard, but he likely fits in between the two extremes . He argues that the entrepreneurial
function requires certain abilities, but that everyone has the potential to act entrepreneurially . In
addition,Schumpeteristheleaderintermsofemphasizinginnovationasthekeyaspectofthe
entrepreneurial process .
ProcessEntrepreneurship is a temporary process of bringing new ideas to the market . The concept of a
process is explicitly proposed by Schumpeter who views the entrepreneurship process as a com-
bination of functions . The entrepreneurial function combines resources in new ways to deliver
a new idea to the market . The capitalist function financially supports the entrepreneur . Schum-
peter argues that once an idea is brought to the market, the entrepreneur becomes a manager
and/orownerofthefirm.Kirznerdoesnotmakesuchanexplicitseparationoffunctions,but
agrees with Schumpeter that the capitalist and managerial functions are separate from that of
the entrepreneur . Knight does not argue that entrepreneurship is a process, but he does empha-
sizethatcertainpeoplehavetheabilitytobringnewideastothemarket.AswithSchumpeter,
Knight argues that there is an important difference between the entrepreneur and the business
manager and/or owner of resources . In addition, Knight argues that the entrepreneur’s reward
for being innovative and bearing uncertainty is temporary profit . As such, it is not unreasonable
to conclude that Knight’s conceptual framework is consistent with the idea that entrepreneur-
ship is a temporary process .
Risk-takingAnother aspect of entrepreneurship is risk-taking . While all three conceptual frameworks incor-
porate an element of risk into their framework, the way in which this aspect is treated varies
considerably.Forinstance,bothKnightandKirznerarguethatakeyaspectofentrepreneurship
is acting in the face of uncertainty . Knight puts the most emphasis on aspect, arguing that risk-
taking—or, more accurately, acting in the face of uncertainty—is a central function of the entre-
preneur.Kirznerplaceslessimportanceonrisk-taking,butarguesthatentrepreneurialdecisions
are made based on uncertain outcomes . Schumpeter on the other hand firmly rejects the idea
that the entrepreneur bears risk or uncertainty . Instead, he argues that the capitalist who lends
funds to the entrepreneur bears all the risk .
Some of the disagreement among these views can be resolved when they are understood
in the context of Schumpeter’s separation of the entrepreneurial function and process . Knight
bases his concept of entrepreneurship on people who are entrepreneurs by nature, and thus views
Fraser Institute / Studies in Entrepreneurship and Markets 7
14 / Measuring Entrepreneurship: Conceptual Frameworks and Empirical Indicators
entrepreneurs as leaders in both a pioneering and a management sense; he does not explicitly
separate these functions . Schumpeter argues that entrepreneurship is a process that can occur
in any person, and thus explicitly separates the entrepreneurial function from that of manager or
capitalist . However, Schumpeter notes that the capitalist function and the entrepreneurial function
often overlap in reality, and thus entrepreneurs often become bearers of risk in their role as capital-
ist.Inotherwords,whileSchumpeterarguesthatthe“pure”entrepreneurdoesnotbearrisk,the
entrepreneurial process involves risk-taking because of the risk-bearing function of the capitalist .
The spectrum of entrepreneurial actionThe fifth aspect of entrepreneurship is the spectrum of entrepreneurial activity . Though this
aspect is addressed differently within the three conceptual frameworks, all agree that a spectrum
of entrepreneurial innovations exists and ranges from the grand or radical, entirely new product
or process, to the incremental, tinkering kind of innovation of a previous radical innovation, all of
which can be considered entrepreneurial .[13] The implication for measuring entrepreneurship is
that it can occur in small start-up businesses as well as large existing firms .
Economic changeFinally, each school of thought posits that entrepreneurship is a key driver of economic change .
Schumpeteremphasizesthispointmoststrongly,arguingthattheentrepreneuristhe“agentof
economicchange.”ForSchumpeter,theentrepreneurshipprocessismorethanjustacatalystof
economic change; it is the cause of economic change . The process of entrepreneurship brings new
innovations to the market, creating jobs and other business opportunities, as well as increasing
productivity . As a result, entrepreneurs help expand the frontier of economic growth . While he
doesnotemphasizethispointtothesameextentthatSchumpeterdoes,Knightarguesthat
entrepreneurs bring successful innovations to the market and, as a result, increase competition
and economic prosperity. Kirzner takes a different view, arguing that entrepreneurship is
a process of correcting knowledge errors in the marketplace, thereby reallocating capital to
projects that yield higher returns .
Conclusion
By now, it should be clear that despite numerous attempts to develop a unified theory of entre-
preneurship, there is still no agreement as to a conceptual framework, let alone a concise defini-
tion . However, a review of the key schools of thought on entrepreneurship reveals that there are
some common aspects: enterprise, innovation, process, risk-taking, spectrum of entrepreneurial
action, and economic change . While a precise definition of entrepreneurship is not proposed
here, the combination of these aspects may be the first step towards developing a reasonable
consensus and, ultimately, a unified conceptual framework of entrepreneurship . Equally impor-
tant, these common aspects of entrepreneurship create the criteria for measurement .
13 William Baumol has furthered our understanding of entrepreneurship with respect to the hierarchy of entrepreneurial action (Baumol, 2002) and economic change (Baumol et al ., 2007) . Refer to Appendix B for a review of this work . For an empirical discussion, see Acs and Audretsch (1988).
Fraser Institute / Studies in Entrepreneurship and Markets 7
Measuring Entrepreneurship: Conceptual Frameworks and Empirical Indicators / 15
2 Current measures of entrepreneurship
This section explores the most widely cited measures of entrepreneurship . The attempts to empiri-
cally measure entrepreneurship are highly scattered and focus (often purposefully) on only one
aspect, largely because there are numerous definitions of entrepreneurship . As a result, most
empirical measures are not well connected to the aspects of entrepreneurship discussed in the
first section of this study . In addition, some focus on international comparison while others focus
on comparisons of sub-national jurisdictions . In addition, many others have methodological
problems .[14] Overall, the current stock of measures fails to provide a comprehensive measure of
entrepreneurship that is applicable across regions . Most importantly, a lack of comprehensive mea-
surement means that there is no way to determine where and why entrepreneurship flourishes .
Global Entrepreneurship Monitor
One of the most widely cited measures of entrepreneurship is the Global Entrepreneurship
Monitor(GEM).TheGEMisaninternationalconsortiumofresearcherswhoanalyzerespons-
es of surveys and expert interviews to measure entrepreneurial activity in about 40 countries .
For example, in their national report for Canada, they conducted a nation-wide survey of 1,664
Canadians, asking them up to 40 questions, to measure entrepreneurial activities and attitudes
(Riverin et al ., 2003) . The authors also collected data from in-depth interviews with 18 national
experts on entrepreneurship, and a survey of 36 experts in each country that participated in the
GEM project . The main outcome of these national reports is a measure called the Total Entre-
preneurial Activity (TEA) Index, a calculation of the adult population engaged in entrepreneurial
activity (defined as starting or running a business that is less than 3 .5 years old) .
GEM’s TEA Index has its advantages as a measure of entrepreneurship . As evidenced by
being widely cited, it offers an easy to understand measure of new firm formation, an important
element of entrepreneurship . In addition, the GEM index covers a number of countries . However,
it also has a number of disadvantages . First, it is a narrow measure . As David Audretsch explains,
an“obviouslimitationofthisapproachisthatitrestrictsentrepreneurialactivitytotheprocessof
thefirmstartup”(2002:4–5).TheimplicationofthisisthattheGEMfailstocaptureentrepreneur-
ship that occurs within existing firms . The Organisation for Economic Co-operation and Devel-
opment(OECD)hasasimilarview:“thereisnotuniversalagreementthatnewfirmformationis
thebestmeasureofentrepreneurshipbutitiscertainlywidelyusedandoft-quoted”(2006:21).
Moreover, even for this narrow measure, there is more accurate data available (OECD, 2006) .[15]
Another disadvantage of GEM’s index is that its imprecise definition of entrepreneurship
allows for too much interpretation among survey respondents . One specific issue is that the GEM
14 SeeParker(2008)foramorein-depthreviewofsomemethodologicalproblems,particularlyforinterna-tional measurement of entrepreneurship .
15 TheOECDexplainsthatthe“GEMestimatesofnascententrepreneurship…serveasaproxyfornewfirmcreationastheymeasurenewentrepreneursratherthannewfirms…virtuallyallOECDcountries,how-ever, maintain complete registers of all businesses that can be used to produce a wide variety of accurate measuresonfirmentry,exit,andgrowth,byindustryandregion”(2006:21).
Fraser Institute / Studies in Entrepreneurship and Markets 7
16 / Measuring Entrepreneurship: Conceptual Frameworks and Empirical Indicators
measure of entrepreneurship includes both actions taken by individuals to create a business and
their intentions to act entrepreneurially . William Baumol and his colleagues argue that the incon-
sistent results from year-to-year and methodological problems with the GEM make the results
difficulttointerpret:“itisnotclearthatGEM’sdefinitionofentrepreneurialactivityissufficiently
nuanced for scientific inquiry, and it is possible that interpretations of this definition may vary
significantlyacrosscountries”(2007:283).
Kauffman Index of Entrepreneurial Activity
Another important measure of entrepreneurship is the Kauffman Index of Entrepreneurial Activ-
ity (Fairlie, 2006) . This index, which focuses on the US states, uses one measure: the rate of busi-
ness creation at the individual owner level . Specifically, it measures the proportion of adult
non-business owners per 100,000 population who create a new business each month, including
employer and non-employer businesses, incorporated and unincorporated businesses, across
all industries .
The Kauffman index marks an improvement over the GEM index in that it focuses
exclusively on actions taken by individuals and excludes people who are only intending to act
entrepreneurially . The exclusion of intent to act entrepreneurially removes any difference in inter-
pretation across respondents that could bias results . Another positive aspect of this measure is
that it relies on quantitative data of new business start-ups rather than survey responses, which
makes comparisons among regions more accurate . Indeed, the Kauffman index is one of the few
current measures that enables comparisons among subnational jurisdictions .
The major disadvantage of the Kauffman index, however, is that it consists of only
one measure . Consequently, similar to the GEM, it misses all the other important elements of
entrepreneurship .
Denmark’s Entrepreneurship Index series
In 2005, Denmark’s National Agency for Enterprise and Construction published a study titled
Entrepreneurship Index 2005: Entrepreneurship Conditions in Denmark. Their index of entrepreneur-
ship for Denmark is comprised of two indicators, each with two measures . The first indicator is
start-up activity, which measures the registration of new businesses as a percentage of total
businesses, and includes the GEM’s TEA Index . The second indicator is new firm growth, which
measures the percentage of new businesses with revenue growth of more than 60 .0% and the
percentage of businesses with employee growth of more than 60 .0% .
One of the advantages of the Denmark index is that, to our knowledge, it is currently the
only index of entrepreneurship that consists of multiple indicators . As such, it is a positive step
towards capturing a broader view of entrepreneurship . Another advantage of this index is that
it relies mainly on quantitative data, which may make their model useful for comparison across
regions .
One disadvantage of the 2005 Denmark index was the inclusion of GEM’s TEA Index . How-
ever, the GEM TEA Index was not included as a component of the 2006 index, which instead relied
Fraser Institute / Studies in Entrepreneurship and Markets 7
Measuring Entrepreneurship: Conceptual Frameworks and Empirical Indicators / 17
exclusively on business start-up and growth measures .[16] Another problem with the Denmark
index, however, is the inclusion of a firm growth subindex . It is unclear, particularly in the context
of the key conceptual frameworks discussed above, to what extent firm growth is an important
measure of entrepreneurship . In fact, firm growth does not seem to be clearly linked to any of
the conceptual frameworks discussed in the previous section .
World Bank Entrepreneurship Survey
The World Bank Group’s Entrepreneurship Database (2008) measures entrepreneurship using
business start-up rates in 84 countries . The survey also measures business density and the dis-
tribution of businesses by industrial sector .
The primary advantage of the World Bank survey is its breadth of measurement . It mea-
sures business start-up rates across a large number of countries in many different global regions
with a number of different policy regimes . Another practical advantage of the survey is that it is
easily available, and the data of the survey can be downloaded from the internet .
The major disadvantage of the World Bank survey is that the definitions and measures of
business start-up rates used are not consistent across the countries surveyed .[17] Consequently,
little can be concluded about the start-up rates in different countries . Another disadvantage of
the World Bank survey is that it only includes one aspect of entrepreneurship .
Other measures
Academic research has also contributed to the measurement of entrepreneurship . Most of the
academic research on entrepreneurship focuses on one of two proxies: self-employment rates
or business start-ups .[18] For example, in an article in the American Economic Review, David
Evans and Linda Leighton (1989) looked at how a number of factors influence workers to stay as
employees or become self-employed or, as the authors refer to them, entrepreneurs . This type
of methodology—using self-employment rates as a proxy for entrepreneurship and investigat-
ingtheimpactofanumberoffactorson“entrepreneurship”acrossjurisdictions—isacommon
approach found in academic research .[19]
16 The 2007 version of the index also did not include the GEM TEA Index . At the time of the publication of this study, the 2007 Denmark index was being translated into English .
17 Thank you to an anonymous reviewer for this analysis of the World Bank survey .
18 See Gartner and Shane (1995) for a review of the literature .
19 A review of the most up-to-date research demonstrates that the use of self-employment as a proxy for entrepreneurship is still widely used . For example, in two recent articles in Small Business Economics, Grilo and Irigoyen (2006) and Bosma et al . (2005) examined self-employment rates in Europe (see also Fairlie and Woodruff, 2005, and Georgellis and Wall, 2000) . Another subset of this research uses survey data to determine people’s preferences towards being self-employed (for example, see Blanchflower and Oswald, 2001) .
Fraser Institute / Studies in Entrepreneurship and Markets 7
18 / Measuring Entrepreneurship: Conceptual Frameworks and Empirical Indicators
The rate of business start-ups is another proxy for entrepreneurship that is used in aca-
demic research . Similar to the approach of the self-employment studies, these studies tend to
look at how a number of economic factors impact business start-up rates .[20]
Other less often used proxies for entrepreneurship found in the literature include the
number of business owners compared to the total number of workers (Audretsch et al ., 2002;
Carreeetal.,2002),R&Dspending,patents,andinnovationsbroughttothemarket(Audretsch,
1995),aswellasthenumberofhigh-growthfirms,or“gazelles”(Birch,1999).However,thereisno
comprehensive measure of entrepreneurship that incorporates a number of different measures
across jurisdictions .
Conclusion
Overall, the most widely used measures of entrepreneurship fail to capture the common aspects
of entrepreneurship specified in the first section: enterprise, innovation, process, spectrum of
entrepreneurial action, and economic change . In fact, what is consistent among the various
attempts to measure entrepreneurship is the focus on just one or two indicators . The OECD sum-
marizedthesituationbystatingthat“whilethereisconsiderableinterestinentrepreneurship…
there is, as yet, neither an overall entrepreneurship statistical framework, including concepts and
definitions, nor an agreed-to list of the key indicators that are required to improve the collective
understandingofentrepreneurshipanditsimpacts”(2006:4).[21]Essentially,thereisaneedfora
comprehensive measure of entrepreneurship, one that attempts to capture the various aspects
of entrepreneurial activity and is well connected to entrepreneurship theory .
20 ExamplesincludeastudybyPaulReynoldsandhiscolleagues(1994)whoexaminedtherateoffirmbirthsin five European countries, and, more recently, a study by Christine Tamasy (2006) who examined business start-ups rates in various regions in Germany . Another subset of studies within this approach focuses on the stock of businesses, rather than the change over time . For example, in two studies Scott Shane (1996; with William Gartner, 1995) measured the effects of 17 economic factors on his proxy for entrepreneurship: the number of businesses per capita in the United States .
21 Research on improving the measurement of entrepreneurship, particularly on developing sound method-ology for international comparison, has blossomed in recent years . For examples, see Congregado et al . (2008),Parker(2008),andDavis(2008).
Fraser Institute / Studies in Entrepreneurship and Markets 7
Measuring Entrepreneurship: Conceptual Frameworks and Empirical Indicators / 19
3 Measuring entrepreneurship: empirical indicators
This section explores empirical indicators that could be used to create a comprehensive measure
of entrepreneurship . The section aims to identify empirical indicators that are well connected to
the aspects of entrepreneurship discussed in section one: enterprise, innovation, process, risk-
taking, spectrum of entrepreneurial action, and economic change .[22]
This section is made up of three parts . The first part presents six potential measures of
entrepreneurship for which data is readily available: business creation, self-employment, small
businesses,venturecapital,R&Dspending,andpatents.Thispartdefineseachindicator,explains
why it is an indicator of entrepreneurship, and discusses the advantages and disadvantages of
each indicator, as well as values and rankings for the 10 Canadian provinces and 50 US states .
The second part discusses five other measures that may be useful, though current data is not
comparable or available: business expansion, business ownership, innovation, initial public offer-
ings, and business losses . Each indicator is defined, and then a short discussion of measurement
problems follows . A summary of the potential measures and some of the current outstanding
issues with the measurement of entrepreneurship concludes this section .
Business creation
Business creation is the process of starting a new enterprise . A new enterprise is defined as a
businessthathasapayrollabovezeroinanygivenyearanddidnotexistinthepreviousyear.
Business creation is a critical measure of entrepreneurship as starting a new business represents
one of the primary ways in which entrepreneurs bring new ideas to the market . In other words,
businesscreationcanrepresentthecommercializationofideas(Acs,2006).Thus,businesscre-
ation rates measure the extent to which people perceive an entrepreneurial opportunity and
act to bring that opportunity to fruition .
Another reason business creation is an important measure is because it captures, in part,
the dynamic element of entrepreneurship that is critical to economic change . The process of
new business formation serves to increase competition, destroying businesses that are no lon-
ger competitive and putting competitive pressure on existing firms . Joseph Schumpeter (1942)
famouslydescribedthisprocessofnewbusinesscreationas“creativedestruction,”wherebynew
businesses replace (or destroy) existing firms that are no longer competitive .[23] He argues that
22 This selection of indicators has been filtered from a larger list which has survived through numerous rounds ofconsultationwiththeCentreforEntrepreneurshipandMarkets’PanelofAdvisors.ThePanelincludesamix of university professors, successful entrepreneurs, and policy professionals .
23 EnricoSantarelliandMarcoVivarelli(2006)notethatnewfirmformationisnota“pure”measureofcreativedestruction in the context Schumpeter described . In addition to the innovative entrepreneurs to which Schumpeter was referring, the authors report that other new firms that do not match Schumpeter’s de-scriptionarealsocreated.Forexample,newentrants,whichtheauthorsrefertoas“passivefollowers,”andentrantswhomerelycopytheoriginalinnovatordonotmatchSchumpeter’sdescription.Putdifferently,itshouldberecognizedthatasmallpercentageofnewfirmsarecreatedasaresponsetosomefactorotherthan entrepreneurial impulse .
Fraser Institute / Studies in Entrepreneurship and Markets 7
20 / Measuring Entrepreneurship: Conceptual Frameworks and Empirical Indicators
new firms are able to replace existing firms because they bring new ideas, innovations, products,
or processes to consumers . By increasing competition, innovation, and productivity, the process
of business creation helps to increase economic growth .[24]
Advantages and disadvantagesThe major advantage of business creation as an indicator of entrepreneurship is that it repre-
sentstheprimarywayinwhichpeoplebringideastothemarket.Putdifferently,thecreation
of a new business represents a mechanism by which entrepreneurs can gather resources (ideas,
employees,andfinancing)andcombinethemtocommercializetheiridea.Combiningbusiness
creationwiththenumberoffirmsthatgooutofbusinesstodetermine“net”businesscreation
providesameasureofthedynamicelementoftheentrepreneurshipprocessemphasizedby
Joseph Schumpeter .
The primary disadvantage of using business creation as a measure of entrepreneurship
isthatthemostappropriatefirmsizetomeasureisunknown.Dataavailabilityinthisstudyhas
limited the measure of business creation to firms with 1-9 employees . While most business cre-
ation occurs within this group, debate over the optimal measure is still open . In addition, William
Baumol and his colleagues (2007) suggest that including the smallest firms (i .e ., receipts of $1,000
or less) may overstate entrepreneurial activity as it may include side or casual businesses . Thus,
including very small operations—where the so-called entrepreneur still generates most of his
or her income from paid employment—in a measure of business creation may not lead to an
accurate reflection of the level of entrepreneurship occurring in a jurisdiction .
ObservationsTo compare business creation in Canada’s provinces and the US states, the number of firms will
be limited to those having 1-9 employees . There are three reasons for using this definition . First,
and most importantly, most of the entrepreneurial activity in this context—business creation—
occurs in firms with less than 10 employees (Godin and Clemens, 2007) . Including larger firms
generallywillnotchangetherankings.Second,theUSdatadefinesabusinessasan“establish-
ment,”whereasCanadiandatadefinesabusinessasa“firm.”Anestablishmentisasinglephysi-
cal location of a business whereas a firm consists of one or more establishments under common
ownership . As there are very few multiple-establishment firms with less than 10 employees—less
than 1 .0% (Godin and Clemens, 2007)—firms and establishments can be used interchangeably
forsmaller-sizedfirms,thuslimitinganydifficultieswithdefinitiondifferences.Third,including
firms that have more than 10 employees can generate wide swings in business start-up rates, giv-
en that the base measure—total businesses—varies considerably between Canadian provinces
and US states . For example, the difference between the number of firms with 1-9 employees and
1-19 employees was 7 .4% in Canada and 17 .4% in the United States on average from 2002 to 2003,
the latest year for which data for the United States is available . This means that using the total
number of firms with 1-19 employees as a way to compare business births across regions would
make it seem as though the United States had lower birth rates, when the difference could actu-
ally be driven by the fact that the United States has more firms that are surviving into the larger
24 NobelLaureateEdmundPhelpsandGylfiZoega(2007)arguethatthisdynamicelementofnewbusinesscreation is a key explanation of differences in economic prosperity between nations .
Fraser Institute / Studies in Entrepreneurship and Markets 7
Measuring Entrepreneurship: Conceptual Frameworks and Empirical Indicators / 21
groupsize.TokeepthecomparisonbetweenUSstatesandCanadianprovincesasaccurateas
possible, this potential bias towards Canadian provinces was removed by focusing only on busi-
nesses with 1-9 employees .[25]
Business start-upsFigure 1 shows average business start-ups as a percentage of all small businesses (1-9 employees)
in the 10 Canadian provinces and 50 US states for 2002-2003 .[26]
Nevada has the highest rate of business start-ups out of all 60 jurisdictions (22 .85%) . Utah
(20 .38%) and Florida (20 .07%) ranked second and third overall . Nine of the top 10 jurisdictions
were US states . North Dakota ranked last with a business start-up rate of 11 .42% .
The highest ranked Canadian province, Newfoundland (ninth), had an average business
creation rate of 16 .56% . The remaining nine Canadian provinces were distributed throughout
the rankings . In addition to Newfoundland, there were five provinces (Alberta, British Columbia,
PrinceEdwardIsland,Ontario,andManitoba)inthetophalfoftherankingsandfourinthebot-
tom half (New Brunswick, Saskatchewan, Nova Scotia, and Quebec) . Quebec (54th) was the lowest
ranked province with a rate of 11 .93% .
On average, US states had a slightly higher rate of business births than Canadian provinc-
es .[27] The US national average of business births from 2002 to 2003 was 14 .9%, while in Canada
it was 13 .3% .
Net business creationFigure 2 shows the average net business creation of these firms for 2002 to 2003 . This measure
indicates the extent to which more businesses are being created than destroyed .
With a rate of 5 .21%, Nevada had the highest rate of average net business creation out
of all 60 jurisdictions . Florida (4 .67%) and Utah (4 .46%) ranked second and third overall . All of
25 Thank you to the anonymous reviewer who pointed out this potential problem with measuring start-ups (and net business creation) in relation to the total number of businesses—namely, that the start-up rate could be sensitive to swings in the number of businesses from year to year . We have addressed this, at least in part, by using an average over 2002 and 2003 (when newer data becomes available, this measure can be further improved) . In addition, start-ups as a percentage of total businesses is a commonly used measure in the literature and, for this study, has been through numerous rounds of consultation and review by measurement experts . Nonetheless, another way to measure business start-ups across jurisdictions is to compare start-ups to population . The results using this measure do change, however . As this measure has not been developed in the literature, it is unclear to what extent industrial structure or other demographic factors are driving these results . Future research is required .
26 There is a difference between how Canadian and US business birth and death data is collected . For Canada, thenumberoffirmsandthenumberofbusinessbirthsanddeathsareorganizedbycalendaryear.FortheUnited States, the number of establishments and the number of business births and deaths are measured from the end of the first quarter of the base year to the end of the first quarter of the following year .
27 Data from 2002 and 2003 was the latest available from US sources; there is Canadian data for 2004 . Examin-ing the Canadian data for 2004 reveals that most provinces had a significant positive increase in business births from 2003 to 2004, meaning that their average rate of business births (using a three-year 2002-2004 average, for example) would increase . For example, the three provinces with the highest average birth rates in 2002 and 2003—Newfoundland, Alberta, and British Columbia—experienced birth rates of 18 .2%, 16 .9%, and 17 .1%, respectively, in 2004 .
Fraser Institute / Studies in Entrepreneurship and Markets 7
22 / Measuring Entrepreneurship: Conceptual Frameworks and Empirical Indicators
Sources: Statistics Canada (2007g); United States Census Bureau (2007b); calculations by authors .
Figure 1: Average business start-ups as a percentage of total firms with 1-9 employees, 2002-2003
0 5 10 15 20 25
North DakotaIowa
ConnecticutOhio
PennsylvaniaNebraska
QuebecWisconsin
West VirginiaVermont
KentuckyIndiana
South DakotaMichigan
KansasLouisiana
MassachusettsIllinoisMaine
Nova ScotiaRhode Island
OklahomaHawaii
SaskatchewanMississippi
AlabamaNew Brunswick
New HampshireTennessee
New JerseyNew YorkManitobaArkansas
OntarioWyoming
North CarolinaMinnesota
MarylandPrince Edward Island
South CarolinaNew Mexico
British ColumbiaVirginia
TexasAlbertaOregon
DelawareMontanaMissouri
WashingtonCalifornia
NewfoundlandAlaska
ColoradoGeorgiaArizona
IdahoFlorida
UtahNevada
Percent
22 .85%20 .38%20 .07%17 .95%17 .72%17 .14%17 .10%16 .66%16 .56%16 .30%16 .24%16 .17%15 .76%15 .59%15 .51%15 .49%15 .41%15 .35%15 .11%15 .03%14 .75%14 .70%14 .68%14 .66%14 .57%14 .47%14 .36%14 .32%14 .26%14 .10%14 .09%13 .99%13 .88%13 .82%13 .63%13 .61%13 .58%13 .56%13 .55%13 .52%13 .48%13 .41%13 .39%13 .36%13 .16%13 .10%13 .00%12 .94%12 .90%12 .74%12 .22%12 .17%12 .12%11 .93%11 .89%11 .81%11 .74%11 .65%11 .63%11 .42%
Fraser Institute / Studies in Entrepreneurship and Markets 7
Measuring Entrepreneurship: Conceptual Frameworks and Empirical Indicators / 23
-1 0 1 2 3 4 5 6
PEINew Brunswick
Nova ScotiaSaskatchewan
NewfoundlandOhio
West VirginiaConnecticut
MichiganQuebec
MassachusettsManitobaWisconsin
IowaKentucky
PennsylvaniaIndiana
AlabamaMississippi
NebraskaKansas
New JerseyTennesseeOklahoma
IllinoisLouisiana
New HampshireVermont
North DakotaMaine
ArkansasSouth Dakota
TexasNorth Carolina
New MexicoNew York
British ColumbiaSouth Carolina
CaliforniaOntario
ColoradoWyoming
MinnesotaWashington
Rhode IslandHawaii
OregonMaryland
AlaskaAlberta
DelawareArizona
MissouriGeorgiaVirginia
MontanaIdahoUtah
FloridaNevada
Figure 2: Average net business creation as a percentage of total firms with 1-9 employees, 2002-2003
Sources: Statistics Canada (2007g); United States Census Bureau (2007b); calculations by authors .
Percent
5 .21%4 .67%4 .46%3 .91%3 .28%2 .88%2 .82%2 .72%2 .63%2 .50%2 .45%2 .37%2 .36%2 .21%2 .16%2 .15%2 .11%2 .10%2 .08%2 .05%1 .90%1 .78%1 .75%1 .72%1 .66%1 .64%1 .54%1 .52%1 .51%1 .38%1 .38%1 .37%1 .34%1 .29%1 .24%1 .19%1 .13%1 .10%1 .04%1 .03%1 .02%0 .98%0 .94%0 .82%0 .74%0 .67%0 .66%0 .63%0 .60%0 .59%0 .40%0 .37%0 .23%0 .21%0 .08%-0 .03%-0 .32%-0 .41%-0 .78%-0 .94%
Fraser Institute / Studies in Entrepreneurship and Markets 7
24 / Measuring Entrepreneurship: Conceptual Frameworks and Empirical Indicators
the top 10 jurisdictions were US states, six of which (Nevada, Florida, Utah, Idaho, Georgia, and
Arizona)werealsointhetop10forbusinessbirths.
The highest ranked Canadian province, Alberta (11th), had an average net business cre-
ation rate of 2 .45% . Among the remaining Canadian provinces, only Ontario (21st) and British
Columbia (24th) ranked in the top half of all jurisdictions . Manitoba ranked 49th, while the remain-
ing six provinces ranked 51st or lower . In fact, Canada’s Atlantic provinces (Newfoundland, Nova
Scotia,NewBrunswick,andPrinceEdwardIsland)andSaskatchewanoccupiedthebottomfive
rankings, all having a negative average rates of net business creation . This means that more firms
went out of business than were created in these provinces . As Schumpeter would note, this situ-
ation is critical because a jurisdiction that fails to generate more new business formation relative
to business failure does not create the dynamic element of the entrepreneurship process—the
element that drives innovation, competition, and economic change . Overall, the US states far
outperformed Canadian provinces in terms of net business creation .
Self-employment
Self-employment as a measure of entrepreneurship looks at those individuals who make an
occupational choice to work on their own rather than for an employer . This occupational choice
is“enterprising”inthatitinvolvesagreaterdegreeofriskintermsoffutureearningsthanthat
involved in paid employment . It also offers the potential for higher rewards . The combination
of greater risk and potentially higher rewards drives certain people to act entrepreneurially, by
developing their own businesses and working for themselves . As a result, many researchers rely
on self-employment rates as a proxy for entrepreneurs . In fact, along with business start-ups,
self-employment rates are one of the most widely used indicators of entrepreneurship .
Self-employment is measured as the number of non-agricultural self-employed persons
as a percentage of total non-agricultural employment .[28] As with most of the literature, the
agricultural self-employed are excluded because the decision to become self-employed in the
agricultural sector depends on factors that are different from those that affect the decision to
become self-employed in all other industries (Georgellis and Wall, 2006) . For example, many
agricultural businesses are family operations . Including the agricultural sector, therefore, would
make it seem as though jurisdictions with large agricultural sectors are more entrepreneurial
when in fact many residents have not brought a new idea or innovation to the market .[29]
28 The US Bureau of Labor Statistics collects self-employment data for unincorporated persons only . Incor-porated self-employed individuals are treated as employees of the corporation and thus are not included in the overall number of self-employed . For this reason, incorporated self-employed individuals in Canada (who are recorded as a separate category) were removed, enabling a comparison of the same groups of people across the Canadian provinces and US states . As this is a minor adjustment, it did not significantly change the rankings or the interpretation of the results . Also, there is a small difference between Canada’s definitionof“employable”andthatoftheUnitedStates:Canadatabulatesemploymentdataforthoseoverthe age of 15, while the United States uses a threshold of 16 years of age . See Appendix A for more details .
29 Another, more practical reason for excluding agricultural self-employed is that the figures for the US states are rounded to 1,000 workers, which could result in dramatic swings in self-employment rates . For example, if a small jurisdiction had fewer than 1,000 workers employed in the agricultural sector or self-employed in
Fraser Institute / Studies in Entrepreneurship and Markets 7
Measuring Entrepreneurship: Conceptual Frameworks and Empirical Indicators / 25
Advantages and disadvantagesThe primary advantage of using self-employment as an indicator of entrepreneurship is that it
captures, at least in part, the number of people who have made an occupational choice to work
on their own rather than for an employer . While there is a lag with the availability of US data,
another practical advantage of using self-employment is that the data is comparable and read-
ily available .
However, there are several disadvantages associated with using self-employment rates
as indicators of entrepreneurship . First, self-employment rates can be driven by other factors
that influence people to move from paid employment to self-employment . As Robin Douhan
andMagnusHenreksonexplain,“self-employmentduetothelackofotheropportunities(often
called necessity entrepreneurship) does not qualify as entrepreneurship . Nor does self-employ-
mentinducedbyartificiallyhighreturnsstemmingfromsubsidiesandtaxbreaks”(2007:3).More-
over, there is no way to know which self-employed individuals are bringing truly innovative ideas
to the market (with the intention of growth) or are merely wishing to maintain their market share
(Baumol et al ., 2007) .
Second, there are statistical problems with self-employment rates . Specifically, self-
employment rates are highly influenced by the industrial structure and demographic com-
position of each jurisdiction . In fact, Edward Glaeser (2007) found that half of the variation in
self-employment rates can be explained by demographics and industrial structure . For example,
a jurisdiction with a larger portion of the economy made up by an industry with higher self-
employment rates will rank higher than another jurisdiction that has a smaller portion of its
economy made up by that same industry .[30]
ObservationsIn 2002, British Columbia had the highest percentage of self-employed in the non-agricultural
sectors(11.91%)(figure3).[31]PrinceEdwardIslandandMontanafollowedclosebehindwith
11 .00% and 10 .95%, respectively . Delaware ranked last with a non-agricultural self-employment
rate of 3 .77% .
The Canadian provinces generally had high rates of self-employment and, as a result, all
wereinthetophalfofthe60jurisdictions.BritishColumbia,PrinceEdwardIsland,NovaScotia,
Ontario, and Saskatchewan were in the top 10, while the remaining provinces ranked no lower
than 24th . Overall, Canadian provinces ranked high on this indicator relative to the US states .
that sector, then it would appear that that jurisdiction had a 100% self-employment rate (which is the case for Alaska) .
30 Unfortunately, self-employment rates based on industrial classification codes are not available for the United States . This is an area where future research may be pursued .
31 At the time of publication, 2002 was the latest year for which data was available for the United States .
Fraser Institute / Studies in Entrepreneurship and Markets 7
26 / Measuring Entrepreneurship: Conceptual Frameworks and Empirical Indicators
0 2 4 6 8 10 12
DelawareVirginia
New JerseyIllinois
NevadaRhode Island
OhioWest Virginia
MichiganAlabama
South CarolinaMaryland
FloridaIndianaGeorgia
UtahMissouri
PennsylvaniaWisconsinNew York
North CarolinaLouisiana
KansasKentucky
MassachusettsArizona
ArkansasNebraska
IowaMinnesota
TexasNorth Dakota
WashingtonConnecticut
ColoradoSouth Dakota
QuebecMississippiOklahoma
AlbertaTennessee
HawaiiNew BrunswickNewfoundland
WyomingNew Hampshire
ManitobaNew Mexico
CaliforniaOregon
IdahoSaskatchewan
OntarioAlaskaMaine
Nova ScotiaVermontMontana
Prince Edward IslandBritish Columbia
Figure 3: Unincorporated non-agricultural self-employment as a percentage of total non-agricultural employment, 2002*
*Note: The latest year for which self-employment data by state is available from US sources is 2002 . Sources: Statistics Canada (2006b); United States Department of Labor, Bureau of Labor Statistics (2007); calculations by authors .
Percent
11 .91%11 .00%10 .95%10 .19%9 .42%9 .35%9 .12%9 .12%9 .11%8 .57%8 .56%8 .47%8 .18%8 .13%7 .87%7 .79%7 .76%7 .73%7 .62%7 .61%7 .46%7 .36%7 .34%7 .28%7 .24%7 .18%7 .04%6 .95%6 .93%6 .89%6 .89%6 .81%6 .74%6 .71%6 .39%6 .32%6 .26%6 .22%6 .14%6 .11%5 .96%5 .92%5 .92%5 .87%5 .71%5 .67%5 .64%5 .62%5 .51%5 .45%5 .44%5 .39%5 .24%5 .15%5 .15%5 .09%5 .02%4 .75%4 .58%3 .77%
Fraser Institute / Studies in Entrepreneurship and Markets 7
Measuring Entrepreneurship: Conceptual Frameworks and Empirical Indicators / 27
Small businesses
Small businesses are often considered to be the same as entrepreneurial businesses .[32] Research
shows that many but not all small businesses tend to be innovators in the context Schumpeter
uses when describing the entrepreneurial process as essentially innovative . In a large review of
theempiricalresearchonentrepreneurship,SimonParker(2005)foundthatsmallfirmshave
aboveaverageratesofinnovation—thatis,inrelationtoallothersizesoffirms,thesmallestfirms
tendtogeneratemoreinnovations.Parker’sreviewoftheresearchalsorevealedthatsmallfirms
tend to grow faster (in terms of employees and revenue) and have higher productivity compared
toothersizesoffirms.
However,asSchumpeterandKirzneremphasize,innovationinthiscontextdoesnot
necessarily mean the creation of knowledge . For example, small firms do not need to create
inventions and secure patents or trademarks to be considered innovative . Small firms are con-
sidered entrepreneurial if they bring those inventions, patents, or some other combination of
resourcestothemarketforapotentialprofit.AsKirznerexplains,entrepreneursmayonlyneed
to exploit a business opportunity that no one else has noticed to be considered entrepreneurial .
The implication of this is that the measure of small businesses in the context of entrepreneurship
should be as broad as possible, and should not focus on what have traditionally been considered
innovative small businesses (i .e ., its focus should not be limited to small businesses in certain
industrial sectors) .
Advantages and disadvantagesThe primary advantage of using small businesses as an indicator of entrepreneurship is that they
are the primary vehicle through which radical innovations are brought to the market . Larger firms
tend to be associated with replicative or incremental kinds of innovations .
However, there are some important disadvantages of this indicator . First, an examination
of both small business measures used in this study —firms with 1-9 employees and firms with
10-49 employees—reveals that little can be concluded about the level of entrepreneurship when
this indicator is considered on its own . Not only is there little variation among jurisdictions, but
there are also few, if any, discernible patterns in terms of groups of jurisdictions . Moreover, it
could be the case that the number of small businesses is not necessarily driven by entrepreneurial
activity, but, similar to self-employment, may be driven by industrial structure and demograph-
ics . In addition, this measure does not reveal which small businesses are innovative and which
ones are entrepreneurial .
Second, a practical disadvantage of this measure is the lack of consistent definitions of
smallbusinessesacrossjurisdictions.Thedefinitionsoftermssuchas“firm”and“establishment”
vary, as does the definition of a small business based on the number of workers employed by
a business or the amount of revenue generated by a business . Furthermore, some measures
include businesses that are operated by one individual, while others only focus on firms that
employ at least one individual (in addition to the owner or operator) .
32 While the two types of businesses may overlap, a small business is conceptually different from an entrepre-neurial business (Carland et al ., 1984) . A small business does not need to be entrepreneurial and vice versa .
Fraser Institute / Studies in Entrepreneurship and Markets 7
28 / Measuring Entrepreneurship: Conceptual Frameworks and Empirical Indicators
ObservationsThere are several practical issues associated with the measurement of small businesses . First,
therearedifferentwaysinwhich“small”canbeendefined.Someresearchersuseamountof
revenue to creation a definition, but the most widely used determinant—and the measure used
inthisstudy—isfirmsize,measuredintermsofthenumberofworkersemployedbyafirm.The
secondissueisdeterminingwhatfirmsizewilldefineasmallbusiness.Inthisstudy,asmallbusi-
ness will be defined as a business with less than 50 employees . This definition of a small business
will be divided into two subcategories: those with 1-9 employees and those with 10-49 employ-
ees . The reason for this division is that there is little difference between the Canadian provinces
and US states when firms with 1-49 employees are considered .[33] However, when this group is
organizedintothetwogroupsnotedabove,thereisadifference.Tocomparesmallbusinesses
across all jurisdictions, the number of small businesses is measured as a percentage of the total
number of businesses within a particular jurisdiction (see Appendix A for a more detailed descrip-
tionofthedata).Tominimizetheeffectsofdramaticswingsfromyeartoyear,anaverageoftwo
years is used .[34]
Firms with 1-9 employeesFigure 4 shows the average number of businesses with 1-9 employees as a percentage of the total
number of businesses in each of the 10 Canadian provinces and 50 US states in 2003 and 2004 .
Montana had the highest number of businesses with 1-9 employees as a percentage of
total businesses (79 .2%) . Two Canadian provinces, Quebec and Newfoundland, ranked second
and third with 78 .9% and 78 .6% of their businesses having 1-9 employees, respectively . The low-
est ranked jurisdiction was Ohio, where 69 .9% of businesses had 1-9 employees .
The remaining Canadian provinces were distributed throughout the rankings, ranging
from 13th to 59th . The lowest ranked Canadian province was Manitoba, where 70 .1% of businesses
had 1-9 employees .
Overall, there was little variation in terms of the concentration of businesses with 1-9
employees in the Canadian provinces and in all 60 jurisdictions . Among the Canadian provinces,
the concentration of businesses with 1-9 employees ranged from 70 .1% in Manitoba to 78 .9% in
Quebec . Among all 60 jurisdictions, the concentration of these businesses ranged from 69 .9%
in Ohio to 79 .2% in Montana .
Firms with 10-49 employeesFigure 5 shows the average number of businesses with 10-49 employees as a percentage of the
total number of businesses in Canada’s provinces and the US states in 2003 and 2004 .
Manitoba had the highest average number of businesses with 10-49 employees as a per-
centage of the total number of businesses (23 .9%) . The lowest ranked jurisdiction was Quebec,
33 Another way to measure small businesses is to compare the number of small businesses to population . For boththe1-9and10-49sizesoffirms,Canadianprovincesgenerallyrankhigheronthismeasure.However,the range between the highest and lowest ranked jurisdictions is similar in magnitude as the small busi-ness“intensity”measurepresentedinthestudy.Forexample,in2004thenumberofbusinesseswith1-9employees per 100 people was 3 .5 in the highest ranked jurisdiction and 1 .5 in the lowest .
34 At the time of publication, small business data for 2003 and 2004 was the latest available for the United States . Adding 2002 data for the United States did not substantially change the rankings .
Fraser Institute / Studies in Entrepreneurship and Markets 7
Measuring Entrepreneurship: Conceptual Frameworks and Empirical Indicators / 29
0 10 20 30 40 50 60 70 80 90
OhioManitoba
TennesseeWisconsin
IndianaOntario
KentuckyLouisianaAlabamaMichigan
VirginiaArizona
MarylandTexas
PennsylvaniaNevada
North CarolinaMinnesota
IllinoisHawaii
CaliforniaConnecticut
South CarolinaGeorgia
MassachusettsMississippi
Nova ScotiaWest Virginia
MissouriIowa
KansasNew Mexico
ArkansasNew Hampshire
NebraskaPrince Edward Island
Rhode IslandUtah
AlbertaOklahoma
North DakotaOregon
DelawareBritish Columbia
WashingtonNew Jersey
New BrunswickSaskatchewanSouth Dakota
ColoradoAlaskaIdahoMaine
New YorkVermont
FloridaWyoming
NewfoundlandQuebec
Montana
Figure 4: Average number of small businesses with 1-9 employees as a percentage of total businesses, 2003-2004
Sources: Statistics Canada (2007h); United States Census Bureau (2007b); calculations by authors .
Percent
79 .2%78 .9%78 .6%78 .4%77 .6%77 .3%77 .1%77 .1%77 .0%77 .0%76 .5%75 .9%75 .8%75 .7%75 .7%75 .5%75 .5%75 .3%75 .0%74 .8%74 .7%74 .6%74 .4%74 .3%74 .1%74 .0%73 .8%73 .8%73 .6%73 .5%73 .3%73 .2%73 .2%73 .1%73 .1%73 .0%73 .0%72 .9%72 .8%72 .7%72 .6%72 .5%72 .5%72 .5%72 .4%72 .1%72 .0%72 .0%71 .9%71 .9%71 .7%71 .5%71 .3%71 .3%70 .9%70 .7%70 .3%70 .2%70 .1%69 .9%
Fraser Institute / Studies in Entrepreneurship and Markets 7
30 / Measuring Entrepreneurship: Conceptual Frameworks and Empirical Indicators
0 5 10 15 20 25
QuebecNewfoundland
FloridaMontanaNew YorkWyoming
MaineColoradoVermont
New JerseyIdaho
AlaskaDelaware
New BrunswickBritish Columbia
South DakotaSaskatchewan
WashingtonAlberta
Rhode IslandNorth Dakota
OklahomaUtah
OregonNebraska
MassachusettsNew Hampshire
ArkansasMissouriGeorgiaKansas
Nova ScotiaIowa
ConnecticutIllinois
CaliforniaPrince Edward Island
New MexicoMinnesota
South CarolinaNevada
North CarolinaMississippi
HawaiiPennsylvaniaWest Virginia
MarylandTexas
ArizonaVirginiaOntario
MichiganAlabamaKentuckyLouisiana
IndianaTennesseeWisconsin
OhioManitoba
Figure 5: Average number of small businesses with 10-49 employees as a percentage of total businesses, 2003-2004
Sources: Statistics Canada (2007h); United States Census Bureau (2007b); calculations by authors .
Percent
23 .9%23 .8%23 .8%23 .6%23 .3%23 .2%23 .1%23 .0%22 .8%22 .7%22 .6%22 .5%22 .3%22 .2%22 .2%22 .1%22 .1%22 .1%22 .1%21 .9%21 .9%21 .9%21 .9%21 .9%21 .8%21 .7%21 .6%21 .6%21 .6%21 .5%21 .5%21 .4%21 .4%21 .4%21 .2%21 .0%20 .8%20 .7%20 .7%20 .7%20 .7%20 .4%20 .2%20 .1%20 .0%19 .9%19 .7%19 .6%19 .5%19 .5%19 .3%19 .3%19 .0%19 .0%18 .8%18 .4%18 .1%17 .9%17 .2%16 .7%
Fraser Institute / Studies in Entrepreneurship and Markets 7
Measuring Entrepreneurship: Conceptual Frameworks and Empirical Indicators / 31
where 16 .7% of businesses had 10-49 employees—a difference of 7 .2 percentage points . Again,
the Canadian provinces were distributed throughout the rankings . Not including Manitoba (first)
and Quebec (60th), the Canadian provinces had ranks ranging from 10th to 59th .
Overall, similar to the concentration of businesses with 1-9 employees, there was little
variation among all 60 jurisdictions in terms of the concentration of businesses with 10-49 employ-
ees . In fact, the difference between the highest and lowest ranked jurisdiction was smaller for
businesses with 10-49 employees (7 .2%) than for businesses with 1-9 employees (9 .3%) .
Venture capital
Oftenreferredtoas“high-risk,high-return”capital,venturecapitaldenotestheresourcesraised
with the purpose of investing in potentially high-growth businesses . Venture capital is a unique
kind of investment as the investors often take an active role in the operation of the company . The
relationship between the entrepreneur and the venture capitalist can also exist at various stages
of business development, from the initial stages (start-up) to later stages such as expansion .
Venture capital investment is included as a measure of entrepreneurship because it cap-
tures, at least in part, the process of bringing a new innovation or business idea to market . As
economists Josh Lerner and Samuel Kortum explain, venture capitalists not only supply funds,
but they also provide the expertise necessary for entrepreneurs to create businesses, innovate,
bring new products or processes to market, and hire workers (Lerner, 2002; Kortum and Lerner,
1998) .[35] In addition to supplying funds, they also work closely with the entrepreneur to success-
fully bring the idea to the market .[36] In this sense, venture capitalists may become entrepreneurs
themselves while simultaneously fulfilling the capitalist function described by Schumpeter and
Kirzner.
Advantages and disadvantagesOne advantage of venture capital as an indicator of entrepreneurship is that it is well connected
tothekeyconceptualframeworksdiscussedinthefirstsectionofthisstudy.Privateventurecapi-
tal, in particular, can be considered enterprising because it is focused on bringing new innova-
tions to the market, in the face of uncertain outcomes . Furthermore, in terms of economic change,
it is associated with job creation, wealth generation, and economic growth . However, it is impor-
tant to note that the strength of venture capital as a measure entrepreneurship is reflected in its
ability to capture the process, and not strictly the function, to use Schumpeter’s terms .
One disadvantage of venture capital as an indicator of entrepreneurship is that it only
involves a small percentage of people and businesses and may not, by itself, be a broad measure
of entrepreneurship . Indeed, venture capital may only capture the radical end of the spectrum
of entrepreneurial action and not measure replicative or incremental kinds of entrepreneurship .
A current practical disadvantage of venture capital as a measure of entrepreneurship is the lim-
35 HellmannandPuri(2002)explainthatventurecapitalistsprovidevalue-addedservices,helpprofessional-izethecompaniestheyfinance,andhelpfirmsestablishthemselvesinthemarketplace.
36 PaulGompersandhiscolleagues(2006)foundthatentrepreneurialskill,morethanluck,explainsthesuc-cess of firms backed by venture capital .
Fraser Institute / Studies in Entrepreneurship and Markets 7
32 / Measuring Entrepreneurship: Conceptual Frameworks and Empirical Indicators
itedavailabilityofdata,organizedbyvarioustypesofventurecapital,fortheUnitedStates(see
Appendix A for a more detailed description of the data) .
ObservationsVenture capital is measured in terms of the total amount of venture capital investment per capita
ineachCanadianprovinceandUSstate.[37]Populationisusedtodeterminetherelativedegree
ofentrepreneurshipindifferentsizedjurisdictionssothatthesizeofaparticularjurisdictiondoes
not bias the results .[38] Venture capital is also measured in terms of the amount spent on proj-
ects within each jurisdiction, regardless of the origin of those funds . Focusing on where money
is spent rather than raised is an important characteristic of this form of measurement .
One way in which venture capital data is collected is by the location of the investor, or the
venture capital fund, regardless of where the capital is invested . While it could be argued that the
act of investing in a venture capital fund is part of the larger entrepreneurial process, it is not an
entrepreneurial function . The process of actively participating in the launch or development of
a business better reflects the entrepreneurial function . As such, the other way in which venture
capital data is collected—measuring where venture capital is spent, regardless of its origin—is
a better measure of the entrepreneurial process as it includes both the entrepreneurial and the
capitalist function .
Of all the Canadian provinces and US states, Massachusetts had the highest venture capital
per person in 2005 ($379 .39) (figure 6) .[39] This means that, on a per person basis, Massachusetts
attracted the most venture capital—from both internal and external sources—and invested these
funds in entrepreneurial businesses . California followed Massachusetts, attracting $295 .50 per per-
son . These two states were well ahead of the third highest ranked jurisdiction, Colorado, which
brought in $134 .99 of venture capital per person . The lowest rank was shared by South Dakota, Okla-
homa, North Dakota, Kansas, and Alaska, all of which did not record any venture capital in 2005 .
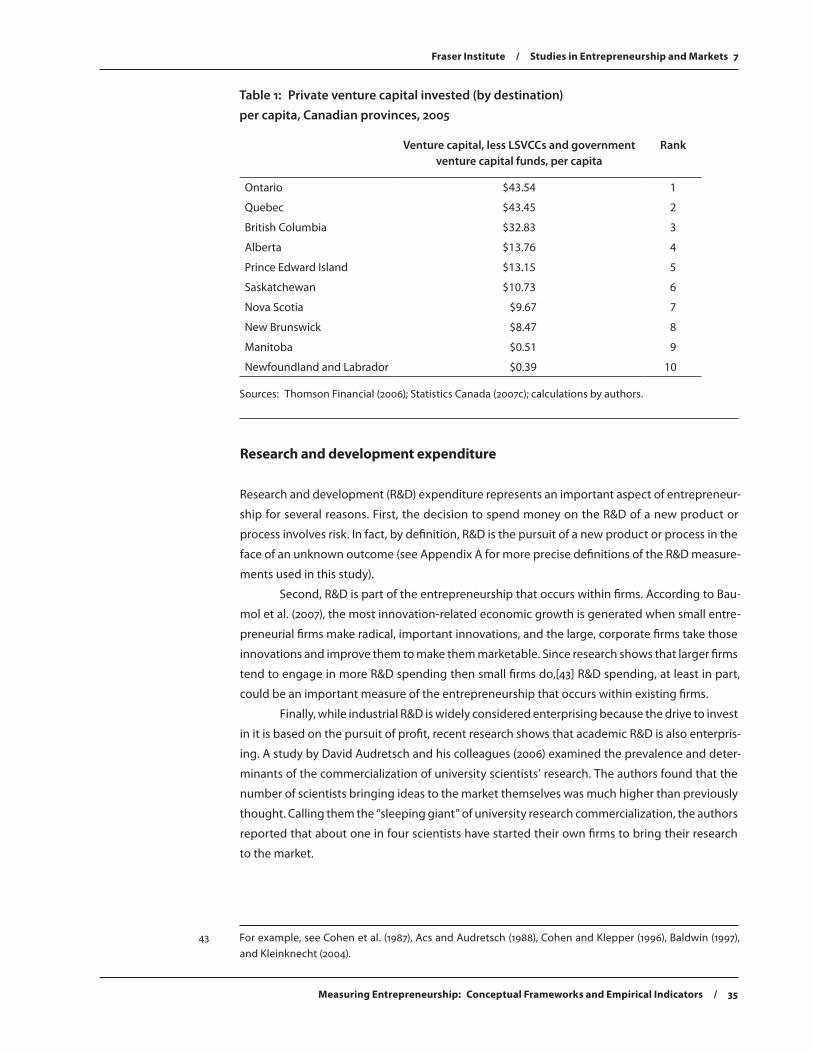
Quebec, which was seventh in the rankings, was the only Canadian province in the top 10,
recording $93 .43 per person . The other nine provinces were distributed throughout the rankings .
Only three provinces (Ontario, British Columbia, and Saskatchewan) other than Quebec ranked
in the top half . Newfoundland (54th) was the lowest ranked Canadian province, recording only
$0 .39 per person . Overall, though Quebec and Ontario performed moderately well, the Canadian
37 Thank you to an anonymous reviewer for pointing out that the measure of venture capital supply by ven-ture capital funds, labour sponsored venture capital corporations (LSVCCs), government, and other pro-viders can be influenced by the demand for venture capital by entrepreneurs . That is, in a situation where demand exceeds the supply of venture capital, the level of venture capital (and thus entrepreneurship based on this measure) would be lower than it would be otherwise . While this effect is somewhat miti-gated by the relative ease of capital mobility across subnational jurisdictions, it could potentially have a more important impact if there are barriers to venture capital mobility across international lines .
38 There are other ways to make venture capital data comparable across jurisdictions, the most notable of whichismeasuringventurecapitalasapercentageofGDP.Whentheauthorsmeasuredventurecapitalinthis way, neither the rankings nor the interpretation of the results changed .
39 This measure only includes data from 2005 . For smaller jurisdictions, which experience more fluctuations in their level of venture capital from year to year than larger jurisdictions, results that are based on one year of data may be misleading . For this publication, there was a practical cost barrier which prevented the collection of multiple years of data . The eventual index will include an average of multiple years’ worth of data to mitigate the impact of highly variant years in some jurisdictions .
Fraser Institute / Studies in Entrepreneurship and Markets 7
Measuring Entrepreneurship: Conceptual Frameworks and Empirical Indicators / 33
$0 $100 $200 $300 $400
South DakotaOklahoma
North DakotaKansasAlaska
LouisianaNewfoundlandSouth Carolina
AlabamaMaine
MississippiNebraska
IowaArkansas
IdahoWest Virginia
KentuckyWyomingManitobaMichigan
OhioTennessee
HawaiiWisconsin
IndianaNova Scotia
AlbertaIllinois
Prince Edward IslandNew Brunswick
MissouriFlorida
ArizonaMontana
GeorgiaSaskatchewan
DelawarePennsylvania
OregonNevada
MinnesotaNew Mexico
TexasBritish Columbia
VirginiaNew YorkVermont
OntarioNorth Carolina
ConnecticutRhode Island
MarylandNew Hampshire
QuebecNew Jersey
UtahWashington
ColoradoCalifornia
Massachusetts
Figure 6: Venture capital invested (by destination) per capita, 2005*
*Note: Venture capital is defined as the amount of venture capital invested in each jurisdiction . All US figures have been converted to 2005 Canadian dollars . Sources: Thomson Financial (2006); National Venture Capital Association (2006); Statistics Canada (2007c); United States Census Bureau (2007a); Statistics Canada (2007d); calculations by authors .
$379 .39$295 .50$134 .99$123 .14
$102 .06$98 .84$93 .43$90 .19$81 .95$74 .42$61 .80$60 .22$59 .77$58 .22$56 .68$54 .84$53 .00$47 .88$47 .34$46 .97$44 .94$39 .19$39 .10$31 .89$31 .16
$30 .00$29 .75$25 .63$21 .10$21 .02$20 .76$20 .17
$20 .02$19 .61$18 .45$15 .82$12 .65$12 .20$11 .36$10 .71$9 .69$9 .31$8 .14$7 .91
$6 .28$5 .78$4 .83$4 .19$3 .53$3 .20$2 .36$1 .36$1 .21
$0 .39$0 .23$0 .00$0 .00$0 .00$0 .00$0 .00
Fraser Institute / Studies in Entrepreneurship and Markets 7
34 / Measuring Entrepreneurship: Conceptual Frameworks and Empirical Indicators
provinces were well behind the US states in terms of venture capital . The difference between the
Canadian provinces and US states was particularly evident in the dramatically larger California
and Massachusetts venture capital markets .
However, the measures of total venture capital investment, from which the above data
was calculated, may be misleading . Total venture capital spending consists of a number of sourc-
es, two of which are retail funds and government funds .[40] Retails funds in Canada are largely
made up of labour sponsored venture capital corporations (LSVCCs) . LSVCCs and government
funds should be excluded from the calculation of venture capital investment because they do not
represent entrepreneurial decision making in the context of the concepts of entrepreneurship
putforthbySchumpeter,Knight,orKirzner.Thesetwotypesofventurecapitalarenotinvested
by enterprising individuals who are using their own money to invest in the face of an uncertain
outcome . Rather, they are created by the government and would not exist otherwise . For exam-
ple, research shows that people invest in LSVCCs for the purpose of gaining generous tax benefits,
and not for the sake of investing in entrepreneurial firms (Cumming and MacIntosh, 2006) .[41]
For the above-noted reasons, this study presents another measure of venture capital,
one that excludes retail and government venture capital funds and focuses on private venture
capital (table 1) . Currently, these data are only available for Canadian provinces .[42] When LSVCCs
and government venture capital funds are excluded from the measurement of venture capital,
the values and rankings for the Canadian provinces change . As with the previous measurement,
venture capital was measured in relation to population so that venture capital could be com-
paredacrossdifferentsizedjurisdictions.Whenonlyprivateventurecapitalismeasured,Ontario
becomes the highest ranked province with $43 .54 per person, while Quebec is a close second
with $43 .45 per person . British Columbia remains the third highest ranked province with $32 .83
per person . Manitoba and Newfoundland are still the lowest ranked jurisdictions, but Alberta
andPrinceEdwardIslandmoveuppastSaskatchewan.
These results provide some indication as to which provinces rely more on government
intervention to increase venture capital activity, and which ones rely more on private initiative .
A greater reliance on private venture capital relative to government and retail venture capital is
considered more entrepreneurial because the former involves enterprising and risk-taking while
thelatterinvolvestheallocationofcapitalbygovernment.Putdifferently,privateventurecapital
reflects the various aspects of entrepreneurship—enterprising, risk-taking, process, innovation,
hierarchy of entrepreneurial action, and economic change—better than government investment,
which does not involve individuals making entrepreneurial decisions .
40 Venturecapital investmentisgenerallyorganizedintoseventypesofinvestors:corporate,government,institutional, retail, private independent, foreign, and other .
41 A series of studies by professors Douglas Cumming and Jeffrey MacIntosh (2004; 2006) show that people invest in LSVCCs for the generous tax benefits and not necessarily for the sake of investing in entrepreneur-ial endeavours . These studies also show that LSVCC performance continues to lag behind private funds, and that LSVCCs maintain a large portion of their portfolio in cash, which is not being invested in firms . Intheir2006study,CummingandMacIntoshfoundevidence“notmerelythatLSVCCshavecrowdedoutotherCanadianfunds,butthattheyhaveledtoareductionintheoverallsizeoftheventurecapitalpool”(2006: 574) . For a non-technical review of this research, see Cumming et al . (2007) .
42 The National Venture Capital Association in the United States has a breakdown of private investment by type of investor for the United States as whole, but not for individual states .
Fraser Institute / Studies in Entrepreneurship and Markets 7
Measuring Entrepreneurship: Conceptual Frameworks and Empirical Indicators / 35
Research and development expenditure
Researchanddevelopment(R&D)expenditurerepresentsanimportantaspectofentrepreneur-
shipforseveralreasons.First,thedecisiontospendmoneyontheR&Dofanewproductor
processinvolvesrisk.Infact,bydefinition,R&Disthepursuitofanewproductorprocessinthe
faceofanunknownoutcome(seeAppendixAformoreprecisedefinitionsoftheR&Dmeasure-
ments used in this study) .
Second,R&Dispartoftheentrepreneurshipthatoccurswithinfirms.AccordingtoBau-
mol et al . (2007), the most innovation-related economic growth is generated when small entre-
preneurial firms make radical, important innovations, and the large, corporate firms take those
innovations and improve them to make them marketable . Since research shows that larger firms
tendtoengageinmoreR&Dspendingthensmallfirmsdo,[43]R&Dspending,atleastinpart,
could be an important measure of the entrepreneurship that occurs within existing firms .
Finally,whileindustrialR&Diswidelyconsideredenterprisingbecausethedrivetoinvest
initisbasedonthepursuitofprofit,recentresearchshowsthatacademicR&Disalsoenterpris-
ing . A study by David Audretsch and his colleagues (2006) examined the prevalence and deter-
minantsofthecommercializationofuniversityscientists’research.Theauthorsfoundthatthe
number of scientists bringing ideas to the market themselves was much higher than previously
thought.Callingthemthe“sleepinggiant”ofuniversityresearchcommercialization,theauthors
reported that about one in four scientists have started their own firms to bring their research
to the market .
43 For example, see Cohen et al . (1987), Acs and Audretsch (1988), Cohen and Klepper (1996), Baldwin (1997), and Kleinknecht (2004) .
Table 1: Private venture capital invested (by destination) per capita, Canadian provinces, 2005
Venture capital, less LSVCCs and government venture capital funds, per capita
Rank
Ontario $43.54 1
Quebec $43.45 2
British Columbia $32 .83 3
Alberta $13.76 4
PrinceEdwardIsland $13.15 5
Saskatchewan $10.73 6
Nova Scotia $9.67 7
New Brunswick $8.47 8
Manitoba $0.51 9
Newfoundland and Labrador $0.39 10
Sources: Thomson Financial (2006); Statistics Canada (2007c); calculations by authors .
Fraser Institute / Studies in Entrepreneurship and Markets 7
36 / Measuring Entrepreneurship: Conceptual Frameworks and Empirical Indicators
Advantages and disadvantagesAnimportantadvantageofR&Dasanindicatorofentrepreneurshipisthatitisameasureof
risk-takingandenterprise.AnotherimportantadvantageofR&Disthatismeasures,inpart,the
entrepreneurshipthatoccurswithin(larger)existingbusinesses.However,sinceR&Disconcen-
tratedinlargerfirms,itislikelythatR&Dspendingisassociatedmorewithincrementalinnova-
tions, rather than with the more radical innovations that stem from independent entrepreneurs
or small entrepreneurial businesses .
ApotentialdisadvantageassociatedwithusingR&Dasanindicatorofentrepreneurship
is that it may reflect the number of innovations (or inventions) produced in a jurisdiction, but not
the extent to which the jurisdiction is entrepreneurial (Baumol et al ., 2007) . For example, in the
formerUSSR,significantamountsofmoneyandeffortwereputtowardsR&D(primarilybythe
government); however, virtually none of the ideas produced by this research were brought to the
market . While this example may be less applicable to Canada and the United States, it is impor-
tanttoconsidertheinstitutionalcontextinwhichR&Disoccurring.Anotherpotentialproblem,
particularlywithacademicR&D,isthatasignificantportionofthis“spending”isfundedbythe
government . Similar to venture capital, the inclusion of government funding may bias the results
in favour of jurisdictions that receive more government funding, and thus the results may not
accurately reflect levels of entrepreneurship . Finally, a unique challenge associated with using
R&Dasanindicatoristhatitisnotameasureoftheentrepreneurshipfunctionperse,butisa
measure of the larger entrepreneurial process .
ObservationsR&DasanindicatorofentrepreneurshipmeasurestheamountofR&Dspendinginaparticular
jurisdictionrelativetothesizeoftheeconomyinthatjurisdiction.[44]Thesizeoftheeconomy
(GDP)isusedtocapturetheintensityofR&Dspendingandtoprovidearelativemeasurethat
enablescomparisonacrossjurisdictions.TwomeasuresofR&Dspendingareused:1)industry
R&Dspending;and2)academicR&Dspending(seeAppendixAforamoredetaileddescription
of the data) .
Industrial R&DIndustrialR&DreferstotheR&Dspendingundertakenbybusinessesforwhichtheprimarypur-
poseofR&Dinvestmentismakingaprofit.[45]Figure7showsthatMichiganhadthehighestlevel
ofindustrialR&Dspendingoutofthe10Canadianprovincesand50USstates(4.25%ofitsGDP)
in2003.[46]WashingtonandMassachusettsfollowedclosebehindwithindustrialR&Dspending
that amounted to 3 .83% and 3 .78%, respectively . The lowest ranked jurisdiction, Alaska, recorded
industrialR&Dspendingof0.12%ofitsGDP.
44 All figures are presented in 2003 Canadian dollars . US figures were converted to Canadian dollars using Purchasing Power Parity and Real Expenditures, United States and Canada, 1992 to 2005, a report by Statistics Canada (2007c) .
45 CanadianindustrialR&Ddataincludesgovernmentownedenterprisesandpublicutilities.Whilemanyoftheseorganizationshaveprofitasanobjective,itisstillamatterofdebateastowhethertheyareentre-preneurial in the way specified by the key theorists .
46 ThelatestyearforwhichR&DdataisavailablefortheUnitedStatesis2003.ThelatestyearforwhichCana-dianR&Ddataisavailableis2006.SeeAppendixAformoredetails.
Fraser Institute / Studies in Entrepreneurship and Markets 7
Measuring Entrepreneurship: Conceptual Frameworks and Empirical Indicators / 37
0 1 2 3 4 5
AlaskaNewfoundland
WyomingPrince Edward Island
LouisianaSaskatchewan
MontanaNova Scotia
South DakotaNew Brunswick
HawaiiArkansas
ManitobaNevadaAlberta
West VirginiaKentucky
MaineOklahomaNebraska
FloridaNew Mexico
GeorgiaTennessee
South CarolinaAlabama
British ColumbiaIowa
MissouriNorth Dakota
New YorkUtah
TexasWisconsin
VirginiaMississippi
ArizonaNorth Carolina
OntarioOhio
PennsylvaniaIllinois
QuebecIndiana
VermontKansas
MarylandColorado
IdahoMinnesota
OregonDelaware
New HampshireNew Jersey
Rhode IslandCalifornia
ConnecticutMassachusetts
WashingtonMichigan
Figure 7: Total industrial R&D expenditure (performing) as a percentage of GDP, 2003
Sources: Statistics Canada (2006a); National Science Foundation, Division of Science Resources Statistics (2006); Statistics Canada (2007b); United States Department of Commerce, Bureau of Economic Analysis (2007); calculations by authors .
Percent
4 .25%3 .83%3 .78%3 .43%3 .35%3 .06%2 .93%2 .80%2 .67%2 .44%2 .40%1 .95%1 .89%1 .87%1 .79%1 .75%1 .70%1 .66%1 .63%1 .61%1 .56%1 .47%1 .45%1 .43%1 .41%1 .37%1 .34%1 .33%1 .32%1 .01%1 .00%0 .89%0 .81%0 .77%0 .77%0 .76%0 .75%0 .66%0 .61%0 .57%0 .56%0 .56%0 .50%0 .48%0 .47%0 .46%0 .44%0 .36%0 .36%0 .29%0 .28%0 .27%0 .27%0 .25%0 .23%0 .20%0 .18%0 .17%0 .14%0 .12%
Fraser Institute / Studies in Entrepreneurship and Markets 7
38 / Measuring Entrepreneurship: Conceptual Frameworks and Empirical Indicators
Thetop-rankedCanadianprovincewasQuebecwhereindustrialR&Dspendingamount-
edto1.66%ofitsGDP.TherestoftheCanadianprovinces,exceptOntario,wereinthelowerhalf
of the rankings . Newfoundland (59th), the lowest ranked Canadian province, recorded industrial
R&Dspendingamountingto0.14%ofitsGDP.
Overall,apartfromQuebecandOntario,whichspentmoderateamountsonR&D,theCana-
dianprovincesgenerallylaggedbehindtheUSstatesintermsofindustrialR&Dspending.[47]
Academic R&DAcademicR&DreferstoR&Dspendingundertakenbyallpost-secondaryinstitutions,includ-
ing research institutes and clinics operating under post-secondary institutions . Of the Canadian
provincesandUSstates,MarylandrecordedthehighestamountspentonacademicR&D(0.95%
ofitsGDP)(figure8).TwoCanadianprovinces,QuebecandNovaScotia,followedclosebehind
with 0 .94% and 0 .90%, respectively . The lowest ranked jurisdiction, Nevada, recorded academic
R&Dspendingamountingto0.18%ofitsGDP.
The Canadian provinces occupied seven positions in the top 10 and all of the provinces fell
within the top twenty jurisdictions . Apart from Quebec and Nova Scotia, the Canadian provinces
performed relatively similarly, spending between 0 .67% (Saskatchewan) and 0 .49% (Alberta) on
academicR&D.
Overall,CanadianprovincesperformedwellintermsofspendingonacademicR&D,but
poorlywithrespecttoindustrialR&DspendingrelativetotheUSstates.Unfortunately,interms
oftotalspending,industryR&DfaroutweighsacademicR&D.[48]Thus,whileCanadaappearsto
rankwellintermsofacademicR&DspendingrelativetotheUSstates,theserankingsshouldbe
viewedinthecontextoftheprovinces’relativelypoorperformanceintermsofindustrialR&D
spending, the larger area of spending .
Patents
Thenumberofpatentsinajurisdiction,similartoR&D,isaproxyfortheinnovativeaspectofthe
entrepreneurialprocess.ButunlikeR&D,apatentisapropertyrightentitlingtheholdertothe
use of a new product or process; it does not measure the act of innovating itself . While empiri-
calresearchshowsR&Dandpatentsarehighlycorrelated(CreponandDugeut,1997;Griliches,
1990)[49], it is important to measure the two separately to understand, at least in part, how entre-
preneurial a jurisdiction is despite how much it spends on developing new innovations .
47 To test foranychanges, theauthorsof this studyalsocomparedR&Dspending relative topopulationacrossjurisdictions.TherewereafewminorchangesintheindustrialR&Drankings,whichrepresentoverfour-fifthsofR&Dactivity.However,therewereconsiderablechangesinacademicR&Drankings—namely,the Canadian provinces generally ranked much lower .
48 WhenStatisticsCanada(2006a)dataisused,academicR&Drepresented37.3%ofthetotalR&DspendinginCanadain2003.WhenNationalScienceFoundation(2006)dataisused,academicR&Drepresentedonly16 .7% of the total for the same year .
49 Griliches(1990)reportsthemedianR-squarebetweenR&Dandpatentsis0.9.TheR-squaremeasurestheproportionofthevariationoftheindependentvariable(R&D)thatcanbeattributedtothevariationinthedependent variable (patents) . R-square values vary from 0 to 1, with 1 indicating a perfect correlation .
Fraser Institute / Studies in Entrepreneurship and Markets 7
Measuring Entrepreneurship: Conceptual Frameworks and Empirical Indicators / 39
Figure 8: Total academic R&D expenditure (performing) as a percentage of GDP, 2003
Sources: Statistics Canada (2006a); National Science Foundation, Division of Science Resources Statistics (2006); Statistics Canada (2007b); United States Department of Commerce, Bureau of Economic Analysis (2007); calculations by authors .
0 1 2 3 4 5
NevadaSouth Dakota
MaineNew Jersey
DelawareFlorida
ArkansasMinnesota
VirginiaWest Virginia
IdahoWyoming
OklahomaTennessee
KentuckyOhio
IllinoisKansas
TexasIndianaArizona
South CarolinaConnecticut
LouisianaOregon
WashingtonNew York
GeorgiaColoradoCaliforniaMichigan
HawaiiMissouriAlabama
MississippiWisconsin
AlaskaNorth Carolina
PennsylvaniaNebraska
Rhode IslandAlberta
IowaUtah
VermontNew HampshireNew Brunswick
New MexicoBritish Columbia
MontanaNorth Dakota
MassachusettsNewfoundland
ManitobaOntario
Prince Edward IslandSaskatchewan
Nova ScotiaQuebec
Maryland
Percent
0 .95%0 .94%0 .90%0 .67%0 .66%0 .65%0 .64%0 .63%0 .62%0 .62%0 .55%0 .54%0 .53%0 .53%0 .52%0 .52%0 .51%
0 .49%0 .49%0 .48%0 .47%0 .46%0 .46%0 .45%0 .45%0 .45%0 .43%0 .41%
0 .40%0 .39%0 .38%0 .37%0 .37%0 .36%0 .36%0 .36%0 .36%0 .35%0 .34%0 .34%0 .34%0 .33%0 .33%0 .32%0 .32%0 .30%0 .30%0 .29%0 .28%0 .28%0 .26%0 .26%0 .25%0 .24%0 .22%0 .22%0 .19%0 .19%0 .18%0 .18%
Fraser Institute / Studies in Entrepreneurship and Markets 7
40 / Measuring Entrepreneurship: Conceptual Frameworks and Empirical Indicators
Patentsalsoindicateotheraspectsofentrepreneurship.Forinstance,testingwhethera
patent will be successful in the market involves risk . In terms of measurement, more patents in
a jurisdiction may indicate that more people are taking (or attempting) a risk in order to bring a
new product or process to the market . The number of patents may also provide some indication
of the types of innovation present in a jurisdiction, in terms of the spectrum of entrepreneurial
action . That is, patents may provide information on whether a jurisdiction’s innovations tend to
be radical or incremental .
Advantages and disadvantagesTheadvantageofthenumberofpatentsasanindicatorofentrepreneurship,muchlikeR&D,is
that it measures the innovative aspect of entrepreneurship . In particular, it provides a proxy for
people who are engaging in risk-taking by trying to develop a marketable product .
A potential disadvantage of this measure is that it includes the total number of patents
rather than just patents that come to the market . A region could be producing a high number
of patents but transforming only a few of them into business opportunities .[50] As was the case
withR&D,achallengeofthisindicatoristhatitisnotameasureoftheentrepreneurshipfunction
per se, but is a measure of the larger entrepreneurship process .
ObservationsThis indicator is measured in terms of the total number patents granted (all types) per 1,000
persons in a particular jurisdiction . This number is measured relative to population to adjust for
differentsizedjurisdictionsandenablecomparison(seeAppendixAforamoredetaileddescrip-
tion of the data) .
Of the Canadian provinces and US states, Idaho was the highest ranked jurisdiction with
1 .086 patents per 1,000 persons (figure 9) . Following Idaho, Vermont generated 0 .663 patents per
1,000 persons . Newfoundland was the lowest ranked jurisdiction, recording only 0 .004 patents
per 1,000 persons . The highest ranked Canadian province, Alberta (42nd), had 0 .091 patents per
1,000 people . The other Canadian provinces had 0 .062 or fewer patents relative to 1,000 people,
falling between 47th and 60th in the rankings . British Columbia, Nova Scotia, New Brunswick,
PrinceEdwardIsland,andNewfoundlandoccupiedthebottomfiverankings.
Overall, the US states far outperformed the Canadian provinces in terms of their numbers
of patents relative to population . The top six states—Idaho, Vermont, California, Massachusetts,
Oregon, and Minnesota—generated more than five times the number of patents, relative to
population, than Alberta, the highest ranked Canadian province .
Other potential indicators
Business expansionBusiness expansion measures the rate at which firms grow, the expectation being that a higher
rate indicates a more entrepreneurial region . Rates of growth can be based on the number of
50 This could mean that firms are filing patents to thwart the innovation of their competitors, rather than acting entrepreneurially .
Fraser Institute / Studies in Entrepreneurship and Markets 7
Measuring Entrepreneurship: Conceptual Frameworks and Empirical Indicators / 41
Figure 9: Number of patents granted (all types) per 1000 people, 2005
Sources: CanadianIntellectualPropertyOffice(2007);UnitedStatesPatentandTrademarkOffice(2007);Statistics Canada (2007c); United States Census Bureau (2007a); calculations by authors .
0.0 0.2 0.4 0.6 0.8 1.0 1.2
NewfoundlandPrince Edward Island
New BrunswickNova Scotia
British ColumbiaMississippi
QuebecHawaii
ManitobaOntario
West VirginiaAlaska
ArkansasSaskatchewan
LouisianaAlabama
South DakotaKentucky
AlbertaWyomingNebraska
TennesseeMaine
OklahomaMissouri
South CarolinaMontana
North DakotaVirginia
New MexicoGeorgiaFloridaKansas
NevadaIndiana
PennsylvaniaNorth Carolina
IowaMaryland
OhioTexas
IllinoisUtah
ArizonaNew York
Rhode IslandWisconsin
New JerseyMichigan
WashingtonDelaware
New HampshireColorado
ConnecticutMinnesota
OregonMassachusetts
CaliforniaVermont
Idaho
Number of patents
1 .0860 .6630 .5460 .5140 .5090 .5050 .4810 .4220 .413
0 .4060 .3960 .3630 .3310 .317
0 .2920 .2750 .2680 .2590 .2570 .2420 .2380 .2300 .2130 .212
0 .2060 .1990 .1840 .1660 .1530 .1490 .1420 .1360 .1270 .1270 .1270 .1260 .1210 .1210 .1190 .117
0 .1090 .0910 .0900 .0870 .0790 .0660 .0620 .0550 .0540 .0540 .0470 .0470 .0460 .0440 .0440 .0320 .0200 .0150 .0140 .004
Fraser Institute / Studies in Entrepreneurship and Markets 7
42 / Measuring Entrepreneurship: Conceptual Frameworks and Empirical Indicators
new jobs created or the amount of revenue generated relative to a starting point . It may be
worthwhiletousethismeasuretofocusoncertainfirmsbasedonsizeorindustrysuchassmall
innovative businesses .
There is a practical problem associated with measuring business expansion in Canada
and the United States . Data sources for the two countries use different definitions of a business
when generating these statistics . The US data source uses a business establishment—one physical
location of business activity—as its definition, while the Canadian source uses a firm—one organi-
zationundercommonownershipwhichcouldincludemultipleestablishments.Whilesomecom-
parisons can be done at the small firm level because the number of firms and establishments are
virtuallythesame,comparisonsinvolvingmedium-andlarge-sizedfirmswouldnotbeaccurate.
Business ownershipBusiness ownership measures the number or rate of employer-owned businesses . Similar to the
small business measure, this indicator is designed to measure the number of people who have
left wage-based employment and taken the risk of starting their own businesses . The expec-
tation when this indicator is used is that a higher level of business ownership indicates a more
entrepreneurial region . After reviewing a number of measures of entrepreneurship, Gartner and
Shane (1995) concluded that business ownership is an ideal measure because it removes the need
tomeasurefirmsbysize.
Business ownership could be a valuable indicator . However, it is unclear how differ-
ent ownership structures and arrangements would be measured . For example, it is not clear
whetheronlysoleproprietorswouldbeincluded,orwhetherorganizationswhereownership
is divided, such as partnerships and corporations, would be included as well . Other conceptual
issues include determining how solely owned subsidiaries or franchises would be measured, and
whether enterprises would be measured as an establishment or a firm .
InnovationIfentrepreneurshipcanbroadlybedefinedastheprocessofcommercializingideas,thentheact
of creating new and different combinations of resources to generate innovations is a key aspect
ofthatprocess.AsdiscussedintheR&Dandpatentssectionsabove,innovationisuniqueinthat
thecombinationofideasthatarecommercializedandthosethatarenotcanbeconsideredtobe
enterprising and risk-taking . In other words, innovation is considered entrepreneurial because it
is an attempt to market an idea and not to generate an idea for its own sake .
Both Canada and the United States have measures of innovation . In Canada, Statistics
Canada conducts a report every three to four years titled, Survey of Innovation. This report surveys
over 17,000 businesses across Canada, asking questions about their innovative activity . In the
United States, the Council on Competitiveness, as well as Innovate America, conducts a number
of surveys and reports measuring the level of innovative activity in the United States . However,
because the Canadian and American surveys are often conducted at different times and ask dif-
ferent questions, they are not comparable .
Initial public offerings (IPOs)Aninitialpublicoffering(IPO)isalegaldeclarationwherebyownershipofabusinessischanged
frombeingexclusivelyprivatetoopenlypublic.Publicownershipmeansthatownershipofthe
Fraser Institute / Studies in Entrepreneurship and Markets 7
Measuring Entrepreneurship: Conceptual Frameworks and Empirical Indicators / 43
companyisdividedintonumerousshareswhichareavailableforpurchase.IPOstypicallyoccur
when an entrepreneur has developed their business to the point where expansion is not possible
withoutaninfluxofmoneyfromnewpartowners.Similartoventurecapital,thenumberofIPOs
is a potential measure of entrepreneurship because it indicates how many businesses that have
a high potential for success are being created or, more accurately, expanded .
OneproblemwithIPOs,however,isthatthedecisionregardingwheretophysicallyissue
theIPOmaybedrivenbypolicyfactorsandnotbyentrepreneurialactivity.[51]Forexample,a
numberofcompanieschoosetoincorporateandissuetheirIPOinDelaware,whichhasmore
favourable liability laws and other legal requirements than other jurisdictions .
Business lossesA recent study by Julie Berry Cullen and Roger Gordon (2007) measured entrepreneurial risk-tak-
ing in terms of business losses . Business losses occur if an entrepreneur’s business has expenses
that exceed its revenues (on a yearly basis) . Higher business losses indicate that entrepreneurs
are taking more risks to bring new ideas (i .e ., goods and services) to the market .
A potential problem associated with using business losses as a measure of entrepreneur-
ship is that it only measures unsuccessful attempts to bring new ideas or innovations to the
market.[52]Thisraisesthequestionofwhetheritisbesttomeasureonly“successful”entrepre-
neurship (i .e ., new businesses or ideas that are brought to the market), or to measure the combi-
nation of successes and failures . The research indicates that this issue is certainly still a matter of
debate, but a review of the key conceptual frameworks in the first section of this study suggests
that it may be worthwhile to measure both successes and failures .
A practical problem associated with the measurement of businesses losses is the different
policy treatment (i .e ., with respect to taxes) of business losses across jurisdictions, particularly
between Canada and the United States . Future research could focus on how this issue may be
reconciled .
Conclusion
A review of the research on entrepreneurship reveals that there is no consensus as to the mean-
ing of entrepreneurship . As a result, current measures of entrepreneurship are highly scattered,
either providing narrow measures of just one aspect of entrepreneurship or providing measures
that are only loosely connected to the conceptual frameworks . This section aimed to present and
discuss a number of empirical indicators that could be used to create a comprehensive measure
of entrepreneurship . While these indicators have survived numerous rounds of consultation by
entrepreneurship experts, this does not mean that they comprise the optimal list . The authors
would like to encourage feedback regarding the conceptual frameworks, the selection of indica-
tors, and any practical measurement issues discussed in this paper .
51 ThereareotherissueswithIPOstatistics.SeeCarpentieretal.(2003).
52 Thank you to an anonymous reviewer for this point .
Fraser Institute / Studies in Entrepreneurship and Markets 7
44 / Measuring Entrepreneurship: Conceptual Frameworks and Empirical Indicators
4 Conclusions and recommendations
This study is the first installment in a long-term research project aimed at measuring entrepre-
neurship across geographical jurisdictions . This study explored existing research to develop a
comprehensive understanding of entrepreneurship on which the measurement of entrepreneur-
ship can be based . A comprehensive approach is important because existing research is highly
scattered and thus fails to provide a readily available and easy to understand tool for comparing
entrepreneurship across regions .
A major barrier to measuring entrepreneurship is the lack of consensus as to its meaning .
To help fill the void in this area, this study presented the most important conceptual frameworks
of entrepreneurship and examined their common themes and important differences . One of the
most important findings was that, despite their unique characteristics, the German, Chicago,
and Austrian schools of thought have six common aspects: enterprise, innovation, process, risk-
taking, spectrum of entrepreneurial action, and economic change . As we move forward, using
these common areas of agreement and understanding the differences may be the key to being
able to measure entrepreneurship .
A key recommendation of this study is that these aspects should be openly and care-
fully reviewed and discussed in terms of relevance and priority, so as to determine how a unified
conceptual framework for measurement could be constructed .
An equally important aspect of measuring entrepreneurship is the choice of empirical
indicators . This study showed that the current measures of entrepreneurship remain scattered
and rely on different definitions . In addition, much of the current stock of measures is narrowly
focused and suffers from statistical problems . While some measures may be applicable to certain
aspects of entrepreneurship or specific geographic regions, the current stock of measures fails
to provide a comprehensive picture of entrepreneurship .
Accordingly,thisstudypresentedandanalyzedanumberofempiricalindicatorsofentre-
preneurship that could be used to create a comprehensive measure . In particular, the study
explored six indicators that have readily available and comparable data: business creation, self-
employment,smallbusinesses,venturecapital,R&D,andpatents.Mostoftheseempiricalindi-
cators had a fairly wide distribution, which suggests that there are important differences in the
structure and level of entrepreneurial activity across jurisdictions . However, the self-employment
and small businesses indicators seemed to suffer from important measurement problems . In
addition to having little variation across jurisdictions, other factors, such as industrial structure,
were driving the results of those measures .
This study also briefly discussed other potential measures which, unfortunately, are not
currently comparable across jurisdictions . These measures included business expansion, busi-
ness ownership, innovation, initial public offerings, and business losses . As well, one question
that must be considered as we move forward is whether a comprehensive measure of entrepre-
neurship should be based on the entrepreneurship function or the entrepreneurship process .
Another key recommendation of this study is that the potential measures presented
shouldbefurtherscrutinizedanddiscussedtodeterminewhethertheyshouldbeincludedina
comprehensive measure of entrepreneurship, and how they might best be measured .
Fraser Institute / Studies in Entrepreneurship and Markets 7
Measuring Entrepreneurship: Conceptual Frameworks and Empirical Indicators / 45
Having a sound concept of entrepreneurship and knowing where it flourishes will have
profound effects on the discussion of public policy . Once we can measure entrepreneurship,
we can investigate the reasons why some regions have more than others, and then we can
begin to understand and promote policies that will create an environment that is conducive to
entrepreneurship .
Fraser Institute / Studies in Entrepreneurship and Markets 7
46 / Measuring Entrepreneurship: Conceptual Frameworks and Empirical Indicators
Appendix A: Data sources and comparability
Included below is a more detailed description of the measurement and data sources for each
potential indicator . It is designed to provide a description of the comparability issues for inter-
ested readers and other researchers .
Business creation
Measurements
• Average business births as a percentage of total businesses with 1-9 employees,
2002-2003(figure1);
• Averagenetbusinesscreationasapercentageoftotalbusinesseswith1-9employees,
2002-2003(figure2).
Data sources and comparability
CanadaThe source of the Canadian data is a custom tabulation done by the Small Business and Special
Surveys Division of Statistics Canada . It includes the number of business births, number of busi-
ness deaths, total number of businesses, and the total employment by province and by industry
for 2002, 2003, and 2004 .
TheoriginaldatausedisfromtheLongitudinalEmploymentAnalysisProgram(LEAP)of
StatisticsCanada.LEAPisacompany-leveldatabasethatincludesallemployersinCanada,both
incorporatedandunincorporated.LEAPdefinesacompanyasafirm—onebusinessundercom-
monownershipthatconsistsofoneormorebusinessestablishments(see“SmallBusinesses,”pg.
27,forfurtherdiscussion).TheLEAPdatabasetrackstheemploymentandpayrollcharacteristics
of individual firms from their year of entry into the market to their year of exit . To collect payroll
andemploymentinformation,LEAPreliesontaxinformationsubmittedtotheCanadaRevenue
Agency . For more information, see Godin and Clemens (2007) .
United StatesThe source of data for the United States is the Company Statistics Division of the United States
Census Bureau (http://www .census .gov/csd/susb/susb .htm) . The main source of original data is
theCountyBusinessPatternsdatabase(see“SmallBusinesses,”pg.27).Thisincludesinformation
regarding business establishments, employment, and annual payroll . This division produces a
uniquedatasetcalled“dynamicdata”whichincludesbusinessbirths,deaths,expansions,and
contractionsorganizedbythesizeofabusinessestablishment(intermsofemployees),aswell
as by state and industry .
Fraser Institute / Studies in Entrepreneurship and Markets 7
Measuring Entrepreneurship: Conceptual Frameworks and Empirical Indicators / 47
Self-employment
Measurements
• Unincorporatednon-agriculturalself-employmentasapercentageoftotalnon-agricul-
turalemployment,2002(figure3).
Data source and comparability
CanadaThe source of self-employment data for Canada is the Labour Force Survey (LFS), an annual data-
baseofCanada’slabourmarketproducedbyStatisticsCanada.Self-employmentisorganizedby
industryandbusinessincorporationstatus.An“employee”isdefinedasapersonaged15years
or older who:
(a) did any work at all at a job or business; that is, paid work in the context of an employer-
employee relationship, or self-employment . Employment also includes unpaid family
work, which is defined as unpaid work contributing directly to the operation of a farm,
business, or professional practice owned and operated by a related member of the same
household; or
(b) had a job but was not at work due to factors such as own illness or disability, personal
or family responsibilities, vacation, labour dispute, or other reasons (excluding persons
on layoff, between casual jobs, and those with a job to start at a future date) (Statistics
Canada,2006b).
United StatesEmployment data for the United States comes from the Bureau of Labor Statistics (BLS) of the
United States Department of Labor . In particular, the self-employment and employment data
are sourced from the Geographic Profile of Employment and Unemployment (United States Depart-
ment of Labor, Bureau of Labor Statistics, 2007). TheBLSdefines“employees”aspersonsaged
16 years or older who:
(a) didanyworkatall(atleast1hour)aspaidemployees,workedintheirownbusinessor
professionorontheirownfarm,orworked15hoursormoreasunpaidworkersinan
enterprise operated by a member of the family; or,
(b) were not working but had jobs or businesses from which they were temporarily absent
because of vacation, illness, bad weather, childcare problems, maternity or paternity
leave, labor management dispute, job training, or other family or personal reasons,
whether or not they were paid for the time off or were seeking other jobs .
The BLS collects self-employment data for unincorporated persons only . Incorporated
self-employed individuals are treated as employees of the corporation, and thus are not included
in the overall number of self-employed persons . For this reason, incorporated self-employed
persons in Canada were not included so that the data would be comparable .
Fraser Institute / Studies in Entrepreneurship and Markets 7
48 / Measuring Entrepreneurship: Conceptual Frameworks and Empirical Indicators
Small businesses
Measurements
• Averagenumberofsmallbusinesseswith1-9employeesasapercentageoftotalbusi-
nesses,2003-2004(figure4);
• Averagenumberofsmallbusinesseswith10-49employeesasapercentageoftotal
businesses,2003-2004(figure5).
Data source and comparability
CanadaA custom tabulation from the Business Register of Statistics Canada (2007h) provided the figures
forthenumberofbusinessesinCanada.Thereareseveraldefinitionsor“statisticalunits”ofbusi-
nesses.Theunitusedforthismeasureis“businessestablishment.”StatisticsCanadadefinesa
business establishment as the level at which the accounting data required to measure produc-
tionisavailable(principalinputs,revenues,salariesandwages):“theestablishment,asastatisti-
cal unit, is defined as the most homogeneous unit of production for which the business maintains
accounting records from which it is possible to assemble all the data elements required to com-
pile the full structure of the gross value of production (total sales or shipments, and inventories),
thecostofmaterialsandservices,andlabourandcapitalusedinproduction”(StatisticsCanada,
2006c) .
Thisisdifferentfromanothercommonlyuseddefinitionofabusiness—the“enterprise.”
According to the definition used by Statistics Canada, the enterprise is associated with a complete
setoffinancialstatements:“theenterprise,asastatisticalunit,isdefinedastheorganizational
unit of a business that directs and controls the allocation of resources relating to its domestic
operations, and for which consolidated financial and balance sheet accounts are maintained
from which international transactions, an international investment position, and a consolidated
financial position for the unit can be derived . It corresponds to the institutional unit as defined
fortheSystemofNationalAccounts”(StatisticsCanada,2006c).
The Business Register Division of Statistics Canada collects business data for all active
businesses in Canada that have a corporate income tax account (T2), have employees, or have a
GST account with an annual gross income of over $30,000 . Data are collected from survey respon-
dents, extracted from administrative files, and derived from other Statistics Canada surveys and/
or other sources .
United StatesUS business statistics are sourced from the United States Census Bureau’s Statistics of US Busi-
nesses (2007b) and County Business Patterns (2008). For comparability, business establishments
were also used as the base measure . The United States Census Bureau defines an establishment
as a single physical location where business is conducted or where services or industrial opera-
tions are performed . Similar to the definition used by Statistics Canada, the United States Cen-
susBureaudefinesanenterpriseasabusinessorganizationconsistingofoneormoredomestic
establishments that were specified under common ownership or control . The enterprise and the
Fraser Institute / Studies in Entrepreneurship and Markets 7
Measuring Entrepreneurship: Conceptual Frameworks and Empirical Indicators / 49
establishment are the same for single-establishment firms . Each multi-establishment company
forms one enterprise, and the enterprise employment and annual payroll are summed from the
associated establishments .
The County Business Patterns database is sourced from a number of United States Cen-
sus Bureau files . The primary source is the Business Register, a collection of all establishments
that have been issued an Employer Identification Number (EIN) by the Internal Revenue Ser-
vice.TheannualCompanyOrganizationSurveyprovidesindividualestablishmentdatafor
multi-establishment businesses . Specifically, data for single-establishment businesses are
obtained from various Census Bureau programs, such as the Annual Survey of Manufactur-
ers and Current Business Surveys, as well as administrative records of the Internal Revenue
Service, the Social Security Administration, and the Bureau of Labor Statistics (United States
Census Bureau, 2007c) . The geographic locations of business establishments are provided by
various Census Bureau programs and are supplemented with information from the Internal
Revenue Service .
Venture capital investment
Measurements
• Venturecapitalinvested(bydestination)percapita,2005(figure6);
• Privateventurecapitalinvested(bydestination)percapita,Canadianprovinces,2005
(table1).
Data source and comparability
CanadaCanadian venture capital data is sourced from Thomson Financial . Thomson Financial defines
venturecapitalasaspecializedformofprivateequity,characterizedchieflybyhigh-riskinvest-
ment in new or young companies following a growth path in technology and other value-added
sectors (Thomson Financial, 2007) .
Thomson Financial collects quarterly survey information from members of the Cana-
dian Venture Capital Association, the Reseau de capital risqué du Quebec, other venture funds,
market agents, institutional investors, and other sources . This information is supplemented by
other information such as public announcements of financings and related industry events, and
reports from foreign investors or portfolio companies . More information is available from Thom-
son Financial’s web site: www .canadavc .com .
United StatesUS venture capital data is sourced from the National Venture Capital Association’s (NVCA) Year-
book 2006.ThereportisproducedbyThomsonFinancialbutitutilizestheMoneyTreereportby
PriceWaterhouseCoopersandothersurveysbytheNVCA.TheNVCAdefinesventurecapitalas
long-term, hands-on, equity investment in high-potential companies by professional investors .
The primary use of venture capital funds is to grow a company’s valuation (NVCA, 2006) .
Fraser Institute / Studies in Entrepreneurship and Markets 7
50 / Measuring Entrepreneurship: Conceptual Frameworks and Empirical Indicators
Morespecifically,venturecapitalinvestmentincludesinvestmentsmadeby“professional
venture capital firms with or without a US office, venture arms of corporations, small business
investment companies (SBICs), institutions, investment banks, and similar entities whose pri-
maryactivityisfinancialinvesting”(NVCA,2006:28).Venturecapitalinvestmentexcludes“debt,
buyouts,recapitalizations,secondarypurchases,initialpublicofferings(IPOs),investmentsin
publiccompaniessuchasPIPES(privateinvestmentsinpublicentities),investmentsforwhich
the proceeds are primarily intended for acquisition such as roll-ups, change of ownership, and
other forms of private equity that do not involve cash such as services-in-kind and venture leas-
ing”(NVCA,2006:101).
Research and development (R&D) expenditure
Measurements
• TotalindustrialR&Dexpenditure(performing)asapercentageofGDP,2003(figure7);
• TotalacademicR&Dexpenditure (performing)asapercentageofGDP,2003 (figure
8) .[53]
Data source and comparability
CanadaR&DdataissourcedfromStatisticsCanada.StatisticsCanadadefinesR&Dasthe“systematic
investigation carried out in the natural and engineering sciences by means of experiment or
analysis to achieve a scientific or commercial advance . Research is defined as original investi-
gation undertaken on a systematic basis to gain new knowledge . Development is the applica-
tion of research findings or other scientific knowledge for the creation of new or significantly
improved products of processes . If successful, development will usually result in devices or pro-
cesseswhichrepresentanimprovementinthe‘stateoftheart’andarelikelytobepatentable”
(Statistics Canada, 2007e: 19) .
IndustrialR&Dexpenditure isdefinedastheR&DexpenditureofCanadianbusiness
enterprises . Statistics Canada defines this sector as business and government enterprises, includ-
ing public utilities and government owned firms (Statistics Canada, 2007f) .
ThemethodologyofStatisticsCanadaforcollectingindustrialR&Ddatainvolvesacom-
bination of survey data and administrative data collected from tax files . Companies that spend
over$1.0milliononR&DaresentamandatorysurveythatdetailstheirR&Dactivity.Companies
thatspendlessthan$1.0milliononR&Darenotsentasurvey;however,StatisticsCanadarecords
theirR&DactivitydirectlythroughdataprovidedbytheCanadaRevenueAgency.
53 TherearetwomeasuresofR&Dexpenditure:fundingandperforming.Fundingreferstotheamountofmoney earmarked for the eventual purpose of spending on R&D. Performing refers to the amount ofmoneyactuallyspentonR&Dactivitiesbyorganizations.Thereasonforthedistinctionisthatsomefund-ingsources(i.e.,governments)transfermoneytootherorganizationssuchasprivatecompaniesoraca-demicinstitutionswhichactuallyconductR&Dactivity.
Fraser Institute / Studies in Entrepreneurship and Markets 7
Measuring Entrepreneurship: Conceptual Frameworks and Empirical Indicators / 51
AcademicR&DexpenditureisdefinedastheR&Dexpenditureinthehighereducation
sector.StatisticsCanadadefinesthissectoras“alluniversities,collegesoftechnologyandother
institutes of post-secondary education, whatever the source of finance or legal status . It also
includes all research institutes, experimental stations and clinics operating under the direct con-
trolof,oradministeredby,orassociatedwith,thehighereducationestablishments”(Statistics
Canada, 2007f: 23) .
United StatesR&DdatafortheUnitedStatesispublishedbytheNationalScienceFoundation(NSF).TheNSF
definesR&Dasthe“planned,systematicpursuitofnewknowledgeorunderstandingtoward
general application (basic research); the acquisition of knowledge or understanding to meet a
specific,recognizedneed(appliedresearch);ortheapplicationofknowledgeorunderstanding
towardtheproductionorimprovementofaproduct,service,process,ormethod(development)”
(NSF, 2006: 260) .
TheNSFdefinesindustryR&Dasthepursuitofnewscientificknowledgeorunderstand-
ing that does not have specific immediate commercial objectives, although it may be in fields of
presentorpotentialcommercialinterest.Specifically,“industrialappliedresearchisinvestigation
that may use findings of basic research toward discovering new scientific knowledge that has
specific commercial objectives with respect to new products, services, processes, or methods;
industrial development is the systematic use of the knowledge or understanding gained from
research or practical experience directed toward the production or significant improvement
of useful products, services, processes, or methods, including the design and development of
prototypes,materials,devices,andsystems”(NSF,2006:260).
TheNSFsurvey thatmeasuresR&D in theUnitedStatescovers industrialR&Dper-
formed by people trained, either formally or by experience, in engineering or in the physi-
cal, biological, mathematical, statistical, or computer sciences, and employed by a publicly
or privately owned firm that is engaged in for-profit activity in the United States . Quality
control, routine product testing, market research, sales promotion, sales service, and other
non-technological activities; routine technical services; and research in the social sciences or
psychology are excluded from the survey (see National Science Foundation, Division of Sci-
ence Resources Statistics, 2006) .
AcademicR&DexpendituresaresourcedfromtheNSF’sSurvey of Research and Develop-
ment Expenditures at Universities and Colleges (NSF, 2006) . This survey collects information from
every university and college in the United States that grants a bachelor’s degree or higher in
scienceandengineeringandexpendsatleast$150,000inseparatelybudgetedR&Dinscience
andtechnology.Therewere630organizationsofthiskindin2003.
Patents
Measurement
• Number of patents granted (all types) per 1,000 people, 2005 (figure9).
Fraser Institute / Studies in Entrepreneurship and Markets 7
52 / Measuring Entrepreneurship: Conceptual Frameworks and Empirical Indicators
Data source and comparability
CanadaPatentdataforCanadaissourcedfromtheCanadianIntellectualPropertyOffice(CIPO).Tabula-
tionsofpatentswereprovidedbye-mailcorrespondencefromtheCIPOonFebruary2,2007.The
CIPOdefinesapatentasagovernmentdocumentthatgivesaninventortherighttoexcludeoth-
ers from making, using, or selling an invention from the day the patent is granted to a maximum
of 20 years after the day on which the patent application is filed . An inventor can use a patent to
makeaprofitbysellingit,licensingit,orusingitasanassettonegotiatefunding(CIPO,2007).
United StatesTheUnitedStatesPatentandTrademarkOffice(USPTO)isthesourceofpatentdatafortheUnit-
edStates.TheUSPTOdefinesapatentasthegrantofapropertyrighttotheinventor,issuedby
theUnitedStatesPatentandTrademarkOffice(USPTO,2005).Morespecifically,itistherightto
“excludeothersfrommaking,using,offeringforsale,orsellingtheinventionintheUnitedStates
or‘importing’theinventionintotheUnitedStates”(USPTO,2005).Patentsareissuedfor20years
from the date on which the application for the patent was filed and are effective only within the
United States, US territories, and US possessions .
Fraser Institute / Studies in Entrepreneurship and Markets 7
Measuring Entrepreneurship: Conceptual Frameworks and Empirical Indicators / 53
Appendix B: Supplement to key conceptual
frameworks—William Baumol
While William Baumol did not provide a distinct, overarching concept of entrepreneurship as
Schumpeter,Knight,orKirznerdid,hemadeanumberofsignificantcontributionstoourunder-
standing of the entrepreneurship process, particularly in the context of economic growth . First,
Baumol was a leader among modern mainstream economists in pointing out that the entrepre-
neur was largely absent from economic analysis . Second, and more importantly with respect to
measuring entrepreneurship, he advanced our understanding of two of the common themes
found in the key conceptual frameworks: hierarchy of entrepreneurial action and economic
change .
Economic theory is “entrepreneurless”
In 1968, William Baumol wrote an article in the American Economic Review titled“Entrepreneur-
shipinEconomicTheory.”Baumoltooktheviewthattheentrepreneuris“theapexofhierarchy
that determines the behaviour of the firm and thereby bears a heavy responsibility for the vital-
ityofthefreeenterprisesociety”(1968:64).BuildinglargelyuponSchumpeter’sview,hemade
a distinction between the manager and the entrepreneur . He defined the manager as the indi-
vidual who oversees the ongoing efficiency of continuing processes of the firm . The manager
takes charge of the activities and decisions encompassed in the traditional economic models
of the firm .[54] The entrepreneur’s function (whether or not he or she is a manager as well) is to
“locatenewideasandtoputthemintoeffect.”
One of Baumol’s key arguments, however, was that the current theory (current in 1968)
ofthefirmwas“entrepreneurless.”Henotedthatthiswasnotacriticismofthemodel,orthe
wayeconomistshaveanalyzedthefirm,explaining,“itdoeswhatitwasdesignedtodoand
doesitwell.”InBaumol’sview,thecurrentmodelwas“essentiallyaninstrumentofoptimality
analysis of well-defined problems, and it is precisely such (very real and important) problems
whichneednoentrepreneurfortheirsolution”(1968:67).SimilartoKirzner,hearguedthatthe
firminvolvesmanagementwhereitbecomesa“passivecalculatorthatreactsmechanicallyto
changes”toexternalevents.
Foreshadowingtheworkthatwouldtakeplacenearly30yearslater,Baumolrecognized
thatcurrentresearchmaynotbeabletoanalyzeindetailthesupplyofentrepreneurship,the
entrepreneurs’ strategy choices, their attitudes to risk, or the sources of their ideas . However,
researchers today can examine what can be done to encourage entrepreneurial activity . Indeed,
54 While the focus of his article is entrepreneurship, Baumol argues that the managerial role within the firm is critical . Making reference to Massachusetts Institute of Technology economist Carl Kaysen, Baumol ex-plains that, in practice, most firms are well inside their production possibility loci, and one of their most challenging tasks is to find ways of approaching those loci more closely .
Fraser Institute / Studies in Entrepreneurship and Markets 7
54 / Measuring Entrepreneurship: Conceptual Frameworks and Empirical Indicators
Baumol argued that a central research focus should be the examination of the determinants
of the payoff to entrepreneurial activity (see Baumol, 1993) . A few examples of such research
includeanalyzinghowthemarginalcostsofriskbearingcanbereduced,howtomakeiteasier
toundertakeR&D,andhowvarioustaxarrangementsimpacttheirpayoff.Overall,whileBau-
molnotedthatmuchmoreresearchisrequiredinthefieldofentrepreneurship,hestated,“ina
growth conscious world I remain convinced that encouragement of the entrepreneur is the key
tothestimulationofgrowth”(1968:71).
Hierarchy of entrepreneurial action and economic change
In 1968, Baumol argued that the entrepreneur is a vital component of the process of economic
growth . Referring to Robert Solow’s work on economic growth theory, Baumol noted that the
historical record of economic growth can largely be explained by advances in technological
change and the increase in the use of capital, two factors that require entrepreneurial initiative
to be introduced (see Solow, 1957) . For this reason, he argued that entrepreneurship should be
cited as an important factor in economic development .
In a 1990 article in the Journal of Political Economy, Baumol expanded his theory to include
different types of entrepreneurship and specified how these types relate to economic growth .
Essentially, Baumol adopted and expanded Schumpeter’s concept of the entrepreneurial process
bydividingtheentrepreneurialfunctionintoproductiveandunproductiveactions.Productive
entrepreneurshipremainsrelativelyunmodifiedinBaumol’sframework.Productiveentrepre-
neurship refers to Schumpeter’s innovator: a person who creates a new combination of resources
tobringanewideatothemarket.Baumolemphasizedthatproductiveentrepreneurshipis
the type of entrepreneurship that drives economic change and creates wealth . Unproductive
entrepreneurship, on the other hand, while entrepreneurial in the sense that these type of entre-
preneurs identify a new way of doing things and generate profit from their actions, is merely
a reaction to opportunities in institutional frameworks and does not create a new product or
process, per se . An example of unproductive entrepreneurship is a law firm that develops con-
tractstohelpbusinessescircumventburdensomelabourlaws.Putdifferently,whileunproduc-
tive entrepreneurship is legal, it generally does not contribute to economic growth; it is largely
a process of arbitrage .[55] This type of entrepreneurship is considered unproductive because
resources are used to redistribute wealth instead of creating wealth or economic change . The
combination of productive and unproductive entrepreneurship makes up what Baumol refers
to as the allocation of entrepreneurship in an economy .
Another key insight from Baumol’s 1990 study is that the allocation of entrepreneurship—
the mix of productive or unproductive entrepreneurship—can be largely explained by the qual-
ity of institutions and laws that govern the economy . As Baumol explained,
55 RobinDouhanandMagnusHenrekson(2007)expandonBaumol’sandothers’theoriestoinclude“preda-tory”entrepreneurshipasatypeofentrepreneurship.Predatoryentrepreneurship involvesanoutrightattack on productive entrepreneurs, capturing some portion of the productive entrepreneurs’ profits . Il-legal crime syndicates are an example of predatory entrepreneurs .
Fraser Institute / Studies in Entrepreneurship and Markets 7
Measuring Entrepreneurship: Conceptual Frameworks and Empirical Indicators / 55
If entrepreneurship is the imaginative pursuit of position, with limited concern about
the means used to achieve the purpose, then we can expect changes in the structure of
rewards to modify the nature of the entrepreneur’s activities, sometimes drastically . The
rules of the game can then be a critical influence helping to determine whether entre-
preneurship will be allocated predominantly to activities that are productive or unpro-
ductiveandevendestructive.(1990:909)
Inotherwords,society’s“rulesofthegame”determinetherelativepayoffstothediffer-
ent types of entrepreneurial activity . Changing the rules will channel entrepreneurs’ efforts into
productive or unproductive activities because their potential rewards and, therefore, incentives
change . This insight has important implications for wealth creation and economic growth . A
jurisdiction that has an institutional framework that does not provide sufficient incentives and
rewards for productive entrepreneurship will have trouble creating wealth and fostering eco-
nomic prosperity, and will find many of their entrepreneurs engaged in unproductive activities .
On the other hand, a jurisdiction that creates an institutional and legal environment that provides
sufficient incentives and rewards for productive entrepreneurship will likely see more wealth
creation and higher economic growth .[56]
In his 2002 book, The Free-Market Innovation Machine, Baumol explained that produc-
tive entrepreneurship creates different types of innovations and that this process thrives in a
capitalist economic system . He stressed that capitalism and the innovations that come with it
(innovations in a Schumpeterian sense) are key factors when explaining the success of capitalism
in terms of economic growth . In particular, Baumol argued that capitalism is successful because
thereisacombinationof“routinized”innovationsbylargefirmsandstrongfinancialincentives
forindependentorsmallerfirmentrepreneurstoinnovatethenext“bigidea.”Putdifferently,
thiswasthefirsttimeBaumolexplainedwhatSchumpeterandKirznerearliertheorized—that
there is a hierarchy of entrepreneurial action which separates radical innovations and other incre-
mental innovations .
Similar to Robert Litan and Carl Schramm, Baumol advanced his theory of entrepreneur-
ship even further in 2007, explaining that the mix between productive and unproductive entre-
preneurship,themixofradicalideasandroutinizedinnovation,andthemixofinstitutional
frameworks not only differentiate capitalist systems around the world, but also help explain dif-
ferences in their success (Baumol et al ., 2007) . Baumol and his colleagues explained that the most
effective type of capitalism is that which includes a mix of strong incentives for entrepreneurs
tomakegrandinventions,andforlargerfirmstoinvestandperformR&Dtofurtherdevelop
innovations and bring them to the market . While not a unique addition to the common themes
found in the key conceptual frameworks discussed in the first section of this study, Baumol’s
work furthers our understanding of what a hierarchy of entrepreneurial action looks like and
how it relates to economic change .
56 Sobel (2006) empirically tested Baumol’s claim by examining the relationship between measures of pro-ductive and unproductive entrepreneurship and measures of institutions . Overall, he found that jurisdic-tionsthathaveinstitutionscharacterizedbyhighereconomicfreedomtendtohavehigherratesofpro-ductive entrepreneurship and lower rates of unproductive entrepreneurship .
Fraser Institute / Studies in Entrepreneurship and Markets 7
56 / Measuring Entrepreneurship: Conceptual Frameworks and Empirical Indicators
References
Acs, Zoltan (2006). Start-ups and Entry Barriers: Small and Medium-Sized Firms Population Dynamics. In
M. Casson, B. Yeung, A. Basu, and N. Wadeson (eds.), The Oxford Handbook of Entrepreneurship
(Oxford University Press): 194–224.
Acs, Zoltan, and David Audretsch (1988). Innovation in Large and Small Firms: An Empirical Analysis.
American Economic Review 78, 4: 678–690.
Acs, Zoltan, and David Audretsch (1993). Small Firms and Entrepreneurship: An East-West Perspective. Cam-
bridge University Press.
Acs, Zoltan J., and Laszlo Szerb (2007). Entrepreneurship, Economic Growth and Public Policy. Small Busi-
ness Economics 28: 109–122.
Aghion, Philippe, and Peter Howitt (1992). A Model of Growth Through Creative Destruction. Economet-
rica 60, 2: 323–351.
Ahmad, Nadim (2006). A Proposed Framework for Business Demography Statistics. Working Paper. Organi-
sation for Economic Co-operation and Development.
Ahmad, Nadim, and Richard Seymour (2008). Defining Entrepreneurial Activity: Definitions Supporting
Frameworks for Data Collection. OECD Working Paper , Vol. STD, No. Doc (1). Organisation for Eco-
nomic Co-operation and Development.
Alvarez, Sharon (2005). Theories of Entrepreneurship: Alternative Assumptions and the Study of Entre-
preneurial Action. Foundations and Trends in Entrepreneurship 1, 3: 105–148.
Amit, Raphael, Lawrence Glosten, and Eitan Muller (1993). Challenges to Theory Development in Entre-
preneurship Research. Journal of Management Studies 30, 5 (September): 815–834.
Audretsch, David (1995). Innovation and Industry Evolution. MIT Press.
Audretsch, David (2002). Entrepreneurship: A Survey of the Literature. Prepared for the European Commis-
sion, Enterprise Directorate General. European Commission, Enterprise and Industry.
Audretsch, David, Taylor Aldridge, and Alexander Oettl (2006). The Knowledge Filter and Economic Growth:
The Role of Scientist Entrepreneurship. Ewing Kauffman Foundation.
Audretsch, David, Martin Carree, Adriaan van Stel, and Roy Thurik (2002). Impeded Industrial Restructur-
ing: The Growth Penalty. Kyklos 55, 1: 81–98.
Baldwin, John (1997). The Importance of Research and Development for Innovation in Small and Large Cana-
dian Manufacturing Firms. Research Paper No. 107. Statistics Canada.
Baldwin, John (1999). A Portrait of Entrants and Exits. Research Paper No. 121. Statistics Canada.
Baptista, Rui, Vitor Escaria, and Paulo Madruga (2008). Entrepreneurship, Regional Development and Job
Creation: The Case of Portugal. Small Business Economics 30, 1: 49–58.
Baptista, Rui, and Miguel Torres Preto (2007). Entrepreneurship and Industrial Restructuring: What Kinds of
Start-ups Matter for Job Creation? Working Paper. Max Planck Institute of Economics.
Baumol, William (1968). Entrepreneurship in Economic Theory. American Economic Review 58, 2: 64–71.
Baumol, William (1990). Entrepreneurship: Productive, Unproductive, and Destructive. Journal of Politi-
cal Economy 98, 5: 893–921.
Baumol, William (1993). Entrepreneurship, Management and the Structure of Payoffs. MIT Press.
Baumol, William (2002). The Free-Market Innovation Machine: Analyzing the Growth Miracle of Capitalism.
Princeton University Press.
Fraser Institute / Studies in Entrepreneurship and Markets 7
Measuring Entrepreneurship: Conceptual Frameworks and Empirical Indicators / 57
Baumol, William, Robert Litan, and Carl Schramm (2007) . Good Capitalism, Bad Capitalism, and the Eco-
nomics of Growth and Prosperity. YaleUniversityPress.
Benz,Matthias(2006).Entrepreneurship as a Non-profit-seeking Activity.WorkingPaperNo.243.Institute
forEmpiricalResearchinEconomics,UniversityofZurich.
Birch, David (1999) . Entrepreneurial Hot Spots. Cognetics Inc .
Blanchflower, David, and Andrew Oswald (1998) . What Makes an Entrepreneur? Journal of Labor Econom-
ics 16:26–60.
Blanchflower, David, and Andrew Oswald (2001) . Measuring Latent Entrepreneurship Across Nations . In
A . Jolly (ed .), The European Business Handbook(KoganPage):6–8.
Blau, David (1987) . A Time Series Analysis of Self-Employment in the United States . Journal of Political
Economy 95,2:445–467.
Bordt, Michael, Louise Earl, Charlene Lonmo, and Robert Joseph (2004) . Characteristics of Firms that Grow
from Small to Medium Size: Growth Factors-Interviews and Measurability . Statistics Canada, Science,
InnovationandElectronicInformationDivisionWorkingPaper.CatalogueNo.88F0006XIE–No.
21 . Statistics Canada .
Bosma, Niels, Gerrit de Wit, and Martin Carree (2005) . Modelling Entrepreneurship: Unifying the Equi-
librium and Entry/Exit Approach . Small Business Economics 25,1:35–48.
Byers, Tom, Heleen Kist, and Robert Sutton (1997) . Characteristics of the Entrepreneur: Social Crea-
tures, Not Solo Heroes . In R . Dorf (ed .), The Handbook of Technology Management(CRCPress).
<http://faculty .dccc .edu/~alynn/Entrepreneur-Social%20Creatures%20not%20Solo%20
Heroes .doc> .
CanadianIntellectualPropertyOffice[CIPO](2006).A Guide to Patents. CanadianIntellectualProperty
Office .
CanadianIntellectualPropertyOffice[CIPO](2007).Patent Statistics for the Canadian Provinces.Personal
correspondence with Keith Godin via e-mail, February 2, 2007 .
Cantillon, Richard (1755/1979) . Essai sur la Nature du Commerce en Général . (Takumi Tsuda, ed .) . Kinokuniya
Bookstore Co .
Carland, James, Frank Hoy, William Boulton, and Jo Ann Carland (1984) . Differentiating Entrepreneurs from
SmallBusinessOwners:AConceptualization.Academy of Management Review 9,2:354–359.
Carpentier, Cecile, Maher Kooli, and Jean-Marc Suret (2003) . Initial Public Offerings: Status, Flaws and Dys-
functions.ResearchPaperpreparedfortheSmallBusinessPolicyBranchaspartoftheSmalland
Medium-sizedEnterprise(SME)FinancingDataInitiative.IndustryCanada.
Carree, Martin, Andre van Stel, Roy Thurik, and Sander Wennekers (2002) . Economic Development and
BusinessOwnership:AnAnalysisUsingDataof23OECDCountriesinthePeriod1976-1996.Small
Business Economics 19,3:271–290.
Casson, Mark (2003) . The Entrepreneur. EdwardElgarPublishing.
Casson, Mark, and Nigel Wadeson (2007) . The Discovery of Opportunities: Extending the Economic The-
ory of the Entrepreneur . Small Business Economics28:285–300.
Cohen,W.,andS.Klepper(1996).ARepriseofSizeandR&D.Economic Journal 106,437:925–951.
Cohen,W.,R.Levin,andD.Mowery(1987).FirmSizeandR&DIntensity:ARe-Examination.Journal of
Industrial Economics 35,4:543–565.
Companys, Yosem E ., and Jeffery S . McMullen (2007) . Strategic Entrepreneurs at Work: The Nature,
Discovery, and Exploitation of Entrepreneurial Opportunities . Small Business Economics 28:
301–322.
Fraser Institute / Studies in Entrepreneurship and Markets 7
58 / Measuring Entrepreneurship: Conceptual Frameworks and Empirical Indicators
Congregado, Emilio, Antonio Anibal Golpe, Jose Maria Millan, and Concepcion Roman (2008) . Building
a Statistical System on Entrepreneurship: A Theoretical Framework Tools . In E . Congregado (ed .)
Measuring Entrepreneurship: Building a Statistical System (Springer):307–338.
Crepon, Bruno, and Emmanuel Duguet (1997) . Research and Development, Competition and Innovation
Pseudo-maximumLikelihoodandSimulatedMaximumLikelihoodMethodsAppliedtoCount
Data Models with Heterogeneity . Journal of Econometrics 79:355–378.
Cullen, Julie Berry, and Roger H . Gordon (2007) . Taxes and Entrepreneurial Risk-Taking: Theory and Evi-
dence for the US . Journal of Public Economics91:1479–1505.
Cumming, Douglas, and Jeffrey MacIntosh (2004) . Canadian Labour Sponsored Venture Capital Corpo-
rations: Bane or Boon? In A . Ginsberg and I . Hassan (eds .), New Venture Investment: Choices and
Consequences(ElsevierScienceAcademicPress):169–200.
Cumming,Douglas,andJeffreyMacIntosh(2006).CrowdingOutPrivateEquity:CanadianEvidence.Jour-
nal of Business Venturing 21:569–609.
Cumming, Douglas, Jeffrey MacIntosh, and Keith Godin (2007) . Crowding Out Private Equity: Canadian
Evidence . Fraser Alert . Fraser Institute .
Cunningham, J . Barton, and Joe Lischeron (1991) . Defining Entrepreneurship . Journal of Small Business
Management 29,1(January):45–61.
Davis, Tim (2008) . Understanding Entrepreneurship: Developing Indicators for Internal Comparisons
and Assessments . In E . Congregado (ed .), Measuring Entrepreneurship: Building a Statistical Sys-
tem(Springer):39–63.
Douhan,Robin,GunnarEliasson,andMagnusHenrekson(2007).IsraelM.Kirzner:AnOutstandingAus-
trian Contributor to the Economics of Entrepreneurship . Small Business Economics 29:213–223.
Douhan, Robin, and Magnus Henrekson (2007) . The Political Economy of Entrepreneurship . IFN Working
PaperNo.716.ResearchInstituteofIndustrialEconomics.
Evans, David, and Linda Leighton (1989) . Some Empirical Aspects of Entrepreneurship . American Eco-
nomic Review 79,3:519–535.
Fairlie, Robert (2006) . Kauffman Index of Entrepreneurial Activity: National Report, 1996-2005. Ewing Marion
Kauffman Foundation .
Fairlie, Robert, and Christopher Woodruff (2005) . Mexican Entrepreneurship: A Comparison of Self-Employ-
ment in Mexico and the United States.NBERWorkingPaperNo.11527.NationalBureauofEconomic
Research .
Fölster, Stefan (2000) . Do Entrepreneurs Create Jobs? Small Business Economics 14,2:137–148.
Frank, Mark (1998) . Schumpeter on Entrepreneurs and Innovation: A Reappraisal . Journal of the History
of Economic Thought 20,4:505–516.
Gartner, William, and Scott Shane (1995) . Measuring Entrepreneurship Over Time . Journal of Business
Venturing 10:283–301.
Georgellis, Yannis, and Howard Wall (2000) . What Makes a Region Entrepreneurial? Evidence from Britain .
The Annals of Regional Science 34:385–403.
Georgellis,Yannis,andHowardJ.Wall(2006).EntrepreneurshipandthePolicyEnvironment.Federal
Reserve Bank of St. Louis Review88,2(March/April):95–111.
Glaeser, Edward L . (2007) . Entrepreneurship and the City . Working paper prepared for the Kauffman-
PlanckAnnualSummitonEntrepreneurshipResearchandPolicy2007.EwingMarionKauffman
Foundation .
Fraser Institute / Studies in Entrepreneurship and Markets 7
Measuring Entrepreneurship: Conceptual Frameworks and Empirical Indicators / 59
Godin, Keith, and Jason Clemens (2007) . Measuring Business Creation in Canada and the United States . Stud-
ies in Entrepreneurship and Markets No . 5 . Fraser Institute .
Gompers,Paul,AnnaKovner,JoshLerner,andDavidScharfstein(2006).Skill vs. Luck in Entrepreneurship
and Venture Capital: Evidence from Serial Entrepreneurs.NBERWorkingPaperNo.12592.National
Bureau of Economic Research .
Griliches,Zvi(1990).PatentStatisticsasEconomicIndicators:ASurvey.Journal of Economic Literature 28
(December):1661–1707.
Grilo, Isabel, and Jesus-Maria Irigoyen (2006) . Entrepreneurship in the EU: To Wish and Not to Be . Small
Business Economics26,4:305–318.
Hall,B.(1987).TheRelationshipBetweenFirmSizeandFirmGrowthintheUSManufacturingSector.Jour-
nal of Industrial Economics 35:583–606.
Hart, David (ed .) (2003) . The Emergence of Entrepreneurship Policy: Governance, Start-ups and Growth in the
US Knowledge Economy.CambridgeUniversityPress.
Hart, Mark, and Eric Hanvey (1995) . Job Generation and New and Small Firms: Some Evidence from the
Late 1980s . Small Business Economics 7:97–109.
Hart,P.,andN.Oulton(1996).GrowthandSizeofFirms.Economic Journal 106:1242–1252.
Hawley, Frederick Barnard (1907) . Enterprise and the Production Process. G.P.Putnam.
Hébert, Robert, and Albert Link (1989) . In Search of the Meaning of Entrepreneurship . Small Business
Economics 1:39–49.
Hellmann,T.,andM.Puri(2002).VentureCapitalandProfessionalizationofStart-ups:EmpiricalEvidence.
Journal of Finance 57:169–197.
Holtz-Eakin, Douglas (2000). Public Policy Toward Entrepreneurship. Small Business Economics 15:
283–291.
Holtz-Eakin,Douglas,andHarveyRosen(eds.)(2004).Public Policy and the Economics of Entrepreneur-
ship. MITPress.
IndustryCanada,SmallBusinessResearchandPolicy(2003).Initial Public Offerings: Status, Flaws and Dys-
functions . Industry Canada .
IndustryCanada,SmallBusinessResearchandPolicy(2004).Canadian Venture Capital Activity: An Analysis
of Trends and Gaps (1996-2002). Industry Canada .
Iversen, Jens, Rasmus Jorgensen, Nikolaj Malchow-Moller, and Bertel Schjerning (2005) . Defining and Mea-
suring Entreprenuership.DiscussionPaper2005-17.CentreforEconomicandBusinessResearch.
Jaffe,Adam(1986).TechnologicalOpportunityandSpilloversofR&D:EvidencefromFirms’Patents,Prof-
its, and Market Value . American Economic Review 76:984–1001.
Jaffe, Adam (1989) . Real Effects of Academic Research . American Economic Review 79:957–970.
Kanagarajah, Sri (2006) . Business Dynamics in Canada 2003.StatisticsCanadaCatalogueNo.61-534-XIE.
Statistics Canada .
Kirzner,Israel(1973).Competition and Entrepreneurship.UniversityofChicagoPress.
Kirzner,Israel(1979).Perception, Opportunity, and Profit: Studies in the Theory of Entrepreneurship. Univer-
sityofChicagoPress.
Kirzner, Israel (1997). Entrepreneurial Discovery and the CompetitiveMarket Process: An Austrian
Approach . Journal of Economic Literature 35(March):60–85.
Kleinknecht,A.(2004).FirmSizeandInnovation.Small Business Economics 1,3:215–222.
Knight, Frank (1921/1964) . Risk, Uncertainty and Profit. Augustus M . Kelley, Bookeller .
Fraser Institute / Studies in Entrepreneurship and Markets 7
60 / Measuring Entrepreneurship: Conceptual Frameworks and Empirical Indicators
Knight,Frank(1942).ProfitandEntrepreneurialFunctions.The Journal of Economic History 2 (Supplement,
December):126–132.
Kortum, Samuel, and Josh Lerner (1998) . Does Venture Capital Spur Innovation?NBERWorkingPaperNo.
6846 . National Bureau of Economic Research .
Lazear,Edward(2003).Entrepreneurship.DiscussionPaperNo.760.ForschungsinstitutzurZukunftder
Arbeit (Institute for the Study of Labor) .
Lerner, Josh (2002) . Boom and Bust in the Venture Capital Industry and the Impact of Innovation . Harvard
NOMResearchPaperNo.03-13.HarvardUniversity.
Li, David Daokui, and Junxin Feng (2005) . Institutional Entrepreneurs . <http://www .aeaweb .org/annual_
mtg_papers/2006/0107_1015_0803 .pdf> . Accessed May 1, 2007 .
Ma,Hao,andJustinTan(2006).KeyComponentsandImplicationsofEntrepreneurship:A4-PFramework.
Journal of Business Venturing21:704–725.
Marshall, Alfred (1860/1930) . Principles of Economics. Macmillan and Co .
McDaniel, Bruce (2005) . A Contemporary View of Joseph A . Schumpeter’s Theory of the Entrepreneur .
Journal of Economic Issues 39,2:485–489.
Michelacci,Claudio(2003).LowReturnsinR&DDuetotheLackofEntrepreneurialSkills.Economic Jour-
nal 113:207–225.
Montanye, James (2006) . Entrepreneurship . The Independent Review 10,4(Spring):549–571.
Murphy,Patrick, JianwenLiao, andHaroldWelsch (2006).AConceptualHistoryofEntrepreneurial
Thought . Journal of Management History 12,1:12–35.
National Agency for Enterprise and Construction (2005) . Entrepreneurship Index 2005: Entrepreneurship
Conditions in Denmark. National Agency for Enterprise and Construction .
National Science Foundation, Division of Science Resources Statistics (2006) . Research and Development
in Industry: 2003 . NSF 07-314 . National Science Foundation .
National Venture Capital Association [NVCA] (2006) . Yearbook 2006 . National Venture Capital Association .
North, Douglass (1990) . Institutions, Institutional Change and Economic Performance. Cambridge Univer-
sityPress.
O’Kean, Jose Maria, and Jose Manuel Menudo (2008) . Entrepreneurial Tools . In E . Congregado (ed .), Mea-
suring Entrepreneurship: Building a Statistical System (Springer):21–36.
Organisation for Economic Co-operation and Development [OECD] (1998) . Fostering Entrepreneurship.
Organisation for Economic Co-operation and Development .
Organisation for Economic Co-operation and Development [OECD] (2006) . Understanding Entrepreneur-
ship: Developing Indicators for International Comparisons and Assessments . STD/CSTAT 2006(9).
Organisation for Economic Co-operation and Development .
Parker,Simon(2005).TheEconomicsofEntrepreneurship:WhatWeKnowandWhatWeDon’t.Founda-
tions and Trends in Entrepreneurship 1,1:1–54.
Parker,Simon(2008).StatisticalIssuesinAppliedEntrepreneurshipResearch:Data,MethodsandChalleng-
es . In E . Congregado (ed .), Measuring Entrepreneurship: Building a Statistical System (Springer):9–20.
Phelps,Edmund,andGylfiZoega(2007).Entrepreneurship, Culture and Openness . Working paper prepared
fortheKauffman-PlanckAnnualSummitonInnovationandOpenness2007.EwingMarionKauff-
man Foundation .
Picot,G.,J.Baldwin,andR.Dupuy(1994).Have Small Firms Created a Disproportionate Share of New Jobs
in Canada? A Reassessment of the Facts . Statistics Canada, Micro-Economic Studies and Analysis
DivisionPeriodicPaperNo.71.StatisticsCanada.
Fraser Institute / Studies in Entrepreneurship and Markets 7
Measuring Entrepreneurship: Conceptual Frameworks and Empirical Indicators / 61
Quince, Thelma, and Hugh Whittaker (2003) . Entrepreneurial Orientation and Entrepreneurs’ Intentions and
Objectives.ESRCCentreforBusinessResearchWorkingPaperNo.271.ESRCCentreforBusiness
Research .
Reynolds,Paul,DavidStorey,andPaulWesthead(1994).Cross-NationalComparisonsoftheVariationin
New Firm Formation Rates . Regional Studies 28,4:443–456.
Ricketts, Martin (2006) . Theories of Entrepreneurship: Historical Development and Critical Assessment .
In M . Casson, B . Yeung, A . Basu, and N . Wadeson (eds .), The Oxford Handbook of Entrepreneurship
(OxfordUniversityPress):33–58.
Riverin,Nathaly,LouisJacquesFilion,DanielF.Muzyka,IlanVertinsky,AviadPe’er,JoeyComeau,AvivaLi,
andOanaBranzei(2003).Global Entrepreneurship Monitor: Canadian National Report 2003. Global
Entrepreneurship Monitor .
Robbins, Lord Lionel (1932/1984) . An Essay on the Nature and Significance of Economic Science. Palgrave
Macmillan .
Sandler, Daniel (2004) . Venture Capital and Tax Incentives: A Comparative Study of Canada and the United
States. CanadianTaxPaperNo.108.CanadianTaxFoundation.
Santarelli, Enrico, and Marco Vivarelli (2006) . Entrepreneurship and the Process of Firms’ Entry, Survival and
Growth.IZADiscussionPaperNo.2475.ForschungsinstitutzurZukunftderArbeit(Institutefor
the Study of Labor) .
Sarasvathy,D.K.,H.A.Simon,andL.Lave(1998).PerceivingandManagingBusinessRisks:Differences
Between Entrepreneurs and Bankers . Journal of Economic Behavior 33,2:207–225.
Say, Jean-Baptiste (1803/1971) . A Treatise on Political Economy or the Production, Distribution and Consump-
tion of Wealth. A.M.KelleyPublishers.
Schultz,Theodore(1975).TheValueoftheAbilitytoDealwithDisequilibria.Journal of Economic Litera-
ture 13,3:827–846.
Schultz,Theodore(1980).InvestmentinEntrepreneurialAbility.Scandinavian Journal of Economics 82,
4:437–448.
Schumpeter, Joseph (1934/2005) . The Theory of Economic Development. TransactionPublishers.
Schumpeter, Jospeh (1942) . Capitalism, Socialism and Democracy. Harper&RowPublishers.
Schumpeter, Joseph (1947/ 2005) . The Creative Response in Economic History . In R . Clemence (ed .), Essays
on Entrepreneurs, Innovations, Business Cycles, and the Evolution of Capitalism (TransactionPublish-
ers):221–231.
Schumpeter, Joseph (1949/2005) . Economic Theory and Entrepreneurial History . In R . Clemence (ed .),
Essays on Entrepreneurs, Innovations, Business Cycles, and the Evolution of Capitalism (Transaction
Publishers):253–271.
Shane, Scott (1996) . Explaining Variation in Rates of Entrepreneurship in the United States: 1899-1988 .
Journal of Management 22,5:747–781.
Shane,Scott,andS.Venkataraman(2000).ThePromiseofEntrepreneurshipasaFieldofResearch.Acad-
emy of Management Review 25,1:217–226.
Sobel, Russell (2006) . Testing Baumol: Institutional Quality and the Productivity of Entrepreneurship . Depart-
ment of Economics, University of West Virginia . <http://www .be .wvu .edu/div/econ//work/pdf_
files/06-06 .pdf> .
Solow,Robert(1957).TechnicalChangeandtheAggregateProductionFunction.Review of Economics
and Statistics 39(August):312–320.
Fraser Institute / Studies in Entrepreneurship and Markets 7
62 / Measuring Entrepreneurship: Conceptual Frameworks and Empirical Indicators
Statistics Canada (2006a) . Estimates of Canadian Research and Development Expenditure (GERD), Canada,
1996 to 2006, and by Province 1995 to 2004.CatalogueNo.88F0006XIE–No.009.StatisticsCanada.
Statistics Canada (2006b) . Labour Force Survey . Catalogue No . 71-543-GIE . Statistics Canada .
Statistics Canada (2006c) . Standard Statistical Units . Statistics Canada . <http://www .statcan .ca/english/
concepts/stat-unit-def .htm> .
Statistics Canada (2007a) . Estimation of Higher Education Research and Development Estimates, 2004/05 .
Statistics Canada .
Statistics Canada (2007b) . Gross Domestic Product, Expenditure-Based, by Province and Territory . CANSIM
Table 384-0002 . Statistics Canada .
Statistics Canada (2007c) . Population by Year, by Province and Territory . CANSIM Table 051-0001 . Statistics
Canada .
Statistics Canada (2007d) . Purchasing Power Parities and Real Expenditures, United States and Canada,
1992-2005 . 13-604-MIE, No . 53 . Statistics Canada .
Statistics Canada (2007e) . Science Statistics: November 2007 Edition.CatalogueNo.88-001-X.Statistics
Canada .
Statistics Canada (2007f) . Science Statistics: December 2007 Edition.CatalogueNo.88-001-X.Statistics
Canada .
Statistics Canada (2007g) . Business Firms and Employment for Canada by Industry Division, Employment Size
and Life Status . Special Tabulation from the Small Business and Special Surveys Division: Longitu-
dinalEmploymentAnalysisProgram.ReceivedJuly17,2007.
Statistics Canada (2007h) . Business Establishments, 2003-2004 . Special Tabulation from Statistics Canada
Business Register . Received April 12, 2007 .
Tamasy, Christine (2006) . Determinants of Regional Entrepreneurship Dynamics in Contemporary Ger-
many: A Conceptual and Empirical Analysis . Regional Studies 40,4:365–384.
Thomson Financial (2006) . VC Industry Overview, 2005 [Microsoft Excel file] . Last updated February 1, 2007 .
Thomson Financial .
Thomson Financial (2007) . Glossary of Terms . <http://www .canadavc .com/info .aspx?page=glossary> .
Accessed March 15, 2007 .
United States Census Bureau (2007a) . Population Estimates. <http://www .census .gov/popest/estimates .
php> . Accessed June 26, 2007 .
United States Census Bureau (2007b) . Statistics of US Businesses – Dynamic Data. <http://www .census .gov/
csd/susb/susbdyn .htm>. Accessed July 16, 2007 .
United States Census Bureau (2007c) . Statistics of US Businesses, Tabulations by Enterprise Size, Introductory
Text . <www .census .gov/epcd/susb/introusb .htm> .
United States Census Bureau (2008) . County Business Patterns . <http://www .census .gov/epcd/cbp/view/
cbpview .html> . Accessed May 12, 2008 .
United States Department of Commerce, Bureau of Economic Analysis (2007) . Gross Domestic Product
(GDP) by State. United States Department of Commerce .
United States Department of Labor, Bureau of Labor Statistics (2007) . Geographic Profile of Employment
and Unemployment. United States Department of Labor, Bureau of Labor Statistics .
UnitedStatesPatentandTrademarkOffice[USPTO](2005).General Information Concerning Patents . <http://
www .uspto .gov/web/offices/pac/doc/general/index .html#ptsc> . Accessed May 12, 2008 .
UnitedStatesPatentandTrademarkOffice[USPTO](2007).Patent Counts by Country/State and Year. United
StatesPatentandTrademarkOffice.
Fraser Institute / Studies in Entrepreneurship and Markets 7
Measuring Entrepreneurship: Conceptual Frameworks and Empirical Indicators / 63
Van Osnabrugge, Mark, and Robert Robinson (2000) . Angel Investing: Matching Start-Up Funds with Start-Up
Companies – The Guide for Entrepreneurs, Individual Investors, and Venture Capitalists. Jossey-Bass .
VanPraag,C.Mirjam(1999).SomeClassicViewsonEntrepreneurship.De Economist 147, 3 (September):
311–335.
VanPraag,C.Mirjam,andPeterH.Versloot(2007).What is the Value of Entrepreneurship? A Review of the
Recent Research. IZADPNo.3014.ForschungsinstitutzurZukunftderArbeit(Instituteforthe
Study of Labor) .
von Mises, Ludwig (1949/1998) . Human Action: A Treatise on Economics. The Foundation for Economic
Education, Inc .
Walker, Deborah (2007) . Austrian Economics . The Concise Encyclopedia of Economics . The Library of Eco-
nomics and Liberty, Liberty Fund, Inc . <http://www .econlib .org/Library/Enc/AustrianEconomics .
html> .
Wennekers, Sander, and Roy Thurik (1999) . Linking Entrepreneurship and Economic Growth . Small Busi-
ness Economics 13,1:27–55.
White, Lawrence (1976/1990) . Entrepreneurship, Imagination, and the Question of Equilibrium . In S . Lit-
tlechild (ed .), Austrian Economics(Vol.3)(EdwardElgar):87–104.
World Bank Group (2008) . Entrepreneurship Database . <http://www .gcgf .org/ifcext/sme .nsf/Content/
Entrepreneurship+Database> .
Fraser Institute / Studies in Entrepreneurship and Markets 7
64 / Measuring Entrepreneurship: Conceptual Frameworks and Empirical Indicators
About the authors
Jason Clemens istheDirectorofResearchatthePacificResearchInstitute(PRI).HealsodirectsbudgetingandstrategicplanningforPRI.PriortojoiningPRI,heheldanumberofpositions throughout his ten-year tenure at the Fraser Institute, including the Director of ResearchQuality,ResidentScholarinFiscalStudies,andtheDirectorofStrategicPlanningand Budgeting . He has a Bachelor’s degree (Hons .) of Commerce and a Master’s degree inBusinessAdministrationfromtheUniversityofWindsor,aswellasaPostBaccalaureatedegreeinEconomicsfromSimonFraserUniversity.Hehaspublishedover50majorstudieson a wide range of topics, including taxation, government spending, labour market regula-tion, banking, welfare reform, productivity, entrepreneurship, public choice economics, and economicprosperity.Hehaspublishedover200shorterarticles,whichhaveappearedinsuch newspapers as The Wall Street Journal, Investors Business Daily, National Post, The Globe and Mail, and all major daily papers in Canada . Mr . Clemens has been a guest on numerous radio and television programs across the country . He has appeared before committees of boththeHouseofCommonsandtheCanadianSenateasanexpertwitness.In2006,hereceivedtheprestigiousCanada’sTop40Under40awardpresentedbyCaldwellPartners,as well as an Odyssey Award from the University of Windsor .
Keith GodinisaSeniorPolicyAnalystintheCentreforEntrepreneurshipandMarketsatthe Fraser Institute . He has published numerous major studies on a range of policy issues including entrepreneurship, taxation, banking, labour regulation and performance, and investment . Most recently, he has authored or co-authored Bank Lending and Entrepreneur-ial Finance: The Performance of Canadian Banks (2008),Measuring Business Creation in Cana-da and the United States (2007),Crowding Out Private Equity: Canadian Evidence (2007),The Economic Costs of Capital Gains Taxes (2007),andMeasuring Labour Markets in Canada and the United States (2007).Hehasalsowrittenshorterstudiesonfiscalpolicyandgovernmentfailure, as well as commentaries in newspapers across Canada including the National Post, Toronto Sun, Ottawa Citizen, The Vancouver Sun, and Business in Vancouver . Mr . Godin holds a Bachelor’sDegreeinEconomicsandaMaster’sDegreeinPublicPolicyfromSimonFraserUniversity . His thesis focused on entrepreneurship and venture capital .
Niels Veldhuis is the Director of Fiscal Studies at the Fraser Institute . Since joining the Insti-tutein2002,hehasauthoredorco-authoredthreebooksand24comprehensivestudiesona wide range of topics including taxation, productivity, entrepreneurship, labour markets, andgovernmentfailure.Mr.Veldhuishaswrittenover100articles,whichhaveappearedinover40newspapersincludingNational Post, The Globe and Mail, and Wall Street Journal . He appears regularly on radio and television programs across the country and has appeared before committees of both the House of Commons and the Canadian Senate as an expert witness . Mr . Veldhuis received a Bachelor’s degree in Business Administration, with joint majors in business and economics, and a Master’s Degree in Economics from Simon Fraser University .
Fraser Institute / Studies in Entrepreneurship and Markets 7
Measuring Entrepreneurship: Conceptual Frameworks and Empirical Indicators / 65
Acknowledgments
First, we would like to thank the supporters of Centre for Entrepreneurship and Markets at the Fraser Institute who generously made resources available to undertake this study . We wouldalsoliketoexpressoursincerestappreciationtotheCentre’sPanelofAdvisorsfortheir excellent assistance and insight throughout this project . In particular, we would like tothankProfessorRussellSobel,WestVirginiaUniversity;TimDavis,OrganisationforEco-nomicCo-operationandDevelopment;ProfessorThomasHellmann,UniversityofBritishColumbia;Dr.JohnBaldwin,StatisticsCanada;RobinLouis,VenturesWest;ProfessorDanielSandler,UniversityofWesternOntario;andProfessorDouglasCumming,YorkUniversity.We would also like to thank the Fraser Institute staff who participated in numerous brain-storming sessions . In addition, the authors would like to thank three anonymous reviewers for their valuable comments and suggestions . Finally, we would like to thank several gov-ernment employees who supplied information and patiently answered questions, and the publications and communications departments of the Fraser Institute for their assistance and diligence . Any remaining errors, omissions, or mistakes remain the sole responsibility of the authors . As the authors have worked independently, the views and analysis expressed in this document remain those of the authors and do not necessarily represent those of the supporters, trustees, or other staff of the Fraser Institute .