Studies in Parkinson’s Studies in Parkinson’s Disease and Dystonia: Disease and Dystonia: An Epidemiologic An Epidemiologic Perspective Perspective Caroline M Tanner MD PhD Director, Parkinson’s Disease Research, Education and Clinical Center, San Francisco Veterans Affairs Medical Center, & Professor, Neurology, University of California-San Francisco, CA, USA Presented at Parkinson’s Australia, Adelaide, May 2015
Transcript
Studies in Parkinson’s Disease Studies in Parkinson’s Disease and Dystonia: An Epidemiologic and Dystonia: An Epidemiologic
Perspective Perspective
Caroline M Tanner MD PhDDirector, Parkinson’s Disease Research, Education and Clinical
Center, San Francisco Veterans Affairs Medical Center,&
Professor, Neurology, University of California-San Francisco, CA, USA
Presented at Parkinson’s Australia, Adelaide, May 2015
Topics Topics • Primary torsion dystonia (PTD)
– Incidence of PTD
– Risk factors for PTD
– Diagnostic error in PTD
• Parkinson’s Disease
– World wide distribution
– Studies of causes
– Next steps: treatment, prevention
Challenges in Studying DystoniaChallenges in Studying Dystonia
• Rare • Many causes• Many syndromes • Requires expert identification• No biomarkers• No definitive post-mortem findings
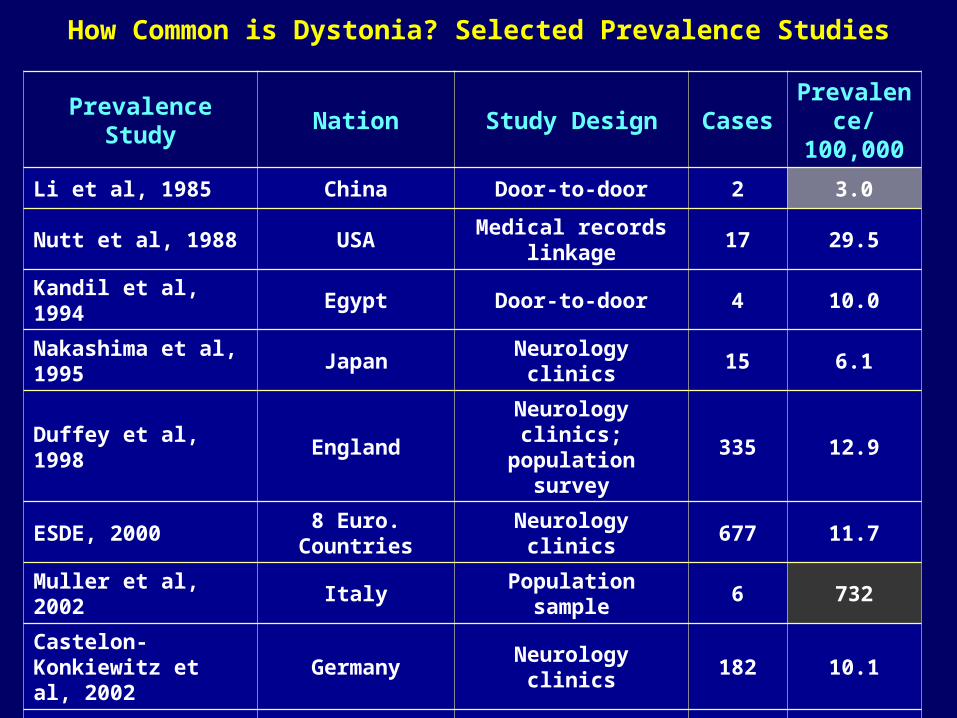
How Common is Dystonia? Selected Prevalence Studies
Prevalence Study Nation Study Design CasesPrevalence/ 100,000
Li et al, 1985 China Door-to-door 2 3.0
Nutt et al, 1988 USAMedical records
linkage17 29.5
Kandil et al, 1994 Egypt Door-to-door 4 10.0
Nakashima et al, 1995 Japan Neurology clinics 15 6.1
Duffey et al, 1998 EnglandNeurology clinics; population survey
335 12.9
ESDE, 2000 8 Euro. Countries Neurology clinics 677 11.7
Muller et al, 2002 Italy Population sample 6 732
Castelon-Konkiewitz et al, 2002
Germany Neurology clinics 182 10.1
Butler et al, 2004 England Medial records linkage 43 43.0
Sugawara et al, 2006 Japan Medical clinics 169 15.1
Das et al, 2007 India Population sample 23 49
Problems with Studying Prevalent CasesProblems with Studying Prevalent Cases
May not accurately represent all disease:
Persons with long survival , more benign course over-represented
SOLUTION: Investigate incident cases• # of new cases of disease in a population • More accurate estimate of disease frequency
PROBLEM: Few Incidence studies of PTD:1980: Israel 8 cases, est. .042/100,000 & 1985,88, 2003: Minnesota, 36 cases, est. 0.2/100,000 – 1.2/100,000
• Fresno
• San Francisco• San Jose
• Sacramento
Serves 30% of population in the geographic region
Group practice prepaid HMO with > 3 million members
21 hospitals, 43 outpatient clinics
Physicians work only for KPMCP (> 65 neurologists)
Uniform health care coverage
Representative of underlying population for ethnicity, age, SES
Kaiser Permanente Northern California Medical Plan
Computerized utilization report
(n = 7711)
BIDS-m Questionnaire;
exam
Incident casesExpert medical record review
Case Ascertainment Methods
Stage 1
Neurologist utilization reviewStage 2
Stage 3
Incidence period 2003-2007
Stage 4
MD Permission to contact
Cannot contact / Refused
Expert diagnosis
Incidence of Dystonia by Subtype / 100,000 p-y Incidence of Dystonia by Subtype / 100,000 p-y adjusted for age, gender to US Census 2000 2003-adjusted for age, gender to US Census 2000 2003-2007 KPNC2007 KPNC
Risk Factors for Dystonia Risk Factors for Dystonia Some Proposed Nongenetic Risk FactorsSome Proposed Nongenetic Risk Factors
• Physical activity/overuse
• Antecedent trauma: local; head injury
• Infection, fever
• Smoking (inverse)
• Elevated serum homocysteine
• Antecedent or comorbid anxiety disorder (vs. hemifacial spasm patients)
• Very little risk factor investigation to date
Preliminary Assessment: Medically Documented Trauma Preliminary Assessment: Medically Documented Trauma and Risk of Primary Dystonia in Kaiser Permanente N and Risk of Primary Dystonia in Kaiser Permanente N
California 2003-2007California 2003-2007
2.91
1.78 1.76
00.5
11.5
22.5
33.5
44.5
OD
DS
RA
TIO
S*
*Adjusted for age, gender, membership time before ref date
Cases: 617Controls: 6009
Risk Factors in Incident Laryngeal Dystonia: Risk Factors in Incident Laryngeal Dystonia: Case Control - N CA Kaiser Case Control - N CA Kaiser
• LD Cases & Controls Matched for Age, Gender• Questionnaire & Telephone Interview • Self-reported Medical history, lifestyle, family history, job & hobby with
repetititve tasks
Key Results:
Ever Held a Job or Hobby Requiring Repetitive Use if Voice?: SD 56% , Controls 44%
Diagnostic Error in Dystonia Diagnostic Error in Dystonia STUDY GOALSSTUDY GOALS
• To identify the frequency of incorrect diagnosis of dystonia.
• To describe the characteristics of diagnostic error associated with primary dystonia
Methods:• Interview incident cases with PTD• Analyze health care contacts prior to diagnosis of dystonia in cases & index date in matched controls (1 case:10 controls)
Consequences of Diagnostic Error in Consequences of Diagnostic Error in Dystonia – Response to InterviewDystonia – Response to Interview
1. From the time you first started noticing symptoms, how long did it take to be diagnosed with dystonia?
Mean: 5.1 years (Range: 1 week – 50 years)
Median: 2 years
2. How many MD visits before correct diagnosis?
Mean: 4.2 (Range: 0 - 90) ; Median: 2
3. How many M.D.s? 50% saw >1 specialty ; 24% > 3
4. Other diagnosis? 54% given some other diagnosis before dystonia; 33% psychiatric diagnoses
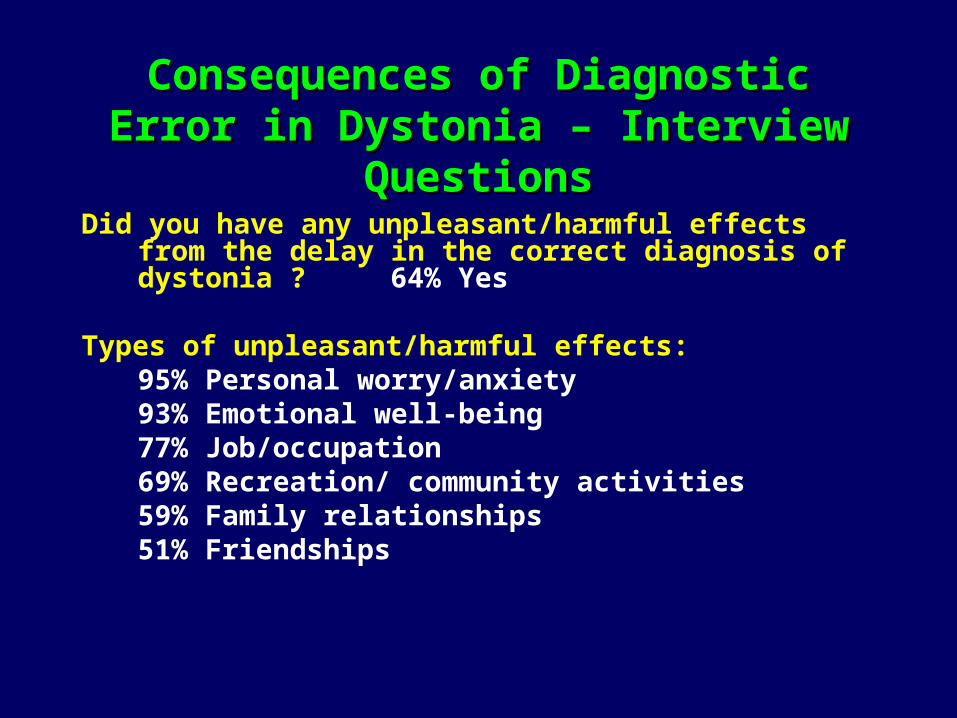
Consequences of Diagnostic Error in Consequences of Diagnostic Error in Dystonia – Interview QuestionsDystonia – Interview Questions
Did you have any unpleasant/harmful effects from the delay in the correct diagnosis of dystonia ? 64% Yes
Types of unpleasant/harmful effects:
95% Personal worry/anxiety93% Emotional well-being 77% Job/occupation69% Recreation/ community activities59% Family relationships51% Friendships
Consequences of Diagnostic Error in Consequences of Diagnostic Error in Dystonia – Interview QuestionsDystonia – Interview Questions
Have you needed to change your job duties or activities as a result of dystonia symptoms? Yes 39%
Have the treatments you received for dystonia allowed you to resume job activities? Yes 75%
Sy
mp
tom
ati
c
Ascertainment of Dystonia: The Iceberg Problem
Asymptomatic
Symptoms, Not Diagnosed:
• Misdiagnosed
• Did not seek care
No Rx
Rx
Iden
tified
clin
ically
How many cases are missed?
Future Directions in Epidemiologic Future Directions in Epidemiologic Investigation of Dystonia Investigation of Dystonia
• Improved case recognition
• Risk factor studies – are there environmental triggers? Is there gene-environment interaction? Risk factors determining expression in gene carriers?
• Animal models – what mechanisms?
• Better treatments
• Prevention
What Causes Parkinson’s Disease?
Why Study Etiology?
- May lead to better treatments
- May identify persons at risk
- May lead to prevention of disease or slowing of disease progression
Estimated Age-Specific PD Incidence Kaiser Permanente of N. California, 1994 - 1995
0
50
100
150
200
250
<30 30-39 40-49 50-59 60-69 70-79 80+
PD
In
cid
en
ce p
er
100,0
00 p
-y
Male
Female
Age (years)
PD Incidence Increases with Age
Life Expectancy Is Expected to Increase World Wide
AGE 60+
2015
22
Consequently, the global burden of Parkinson’s disease is expected to increase
Change in number of people with Parkinson’s disease in the world’s most populous nations from 2005 to 2030*
Source: Dorsey et al, Neurology 2007;68:384-6
*Among individuals over 50 in the world’s ten most and Western Europe’s five most populous nations
Consequences for Society
Costs: –Direct costs of health care–Indirect costs:
• Loss of years worked, lost societal contributions
• Mental & physical costs • Affects person with PD & family members, colleagues, friends
Can We Bridge the Gap ?
Unmet needs
Knowledge gaps
What Causes Parkinson’s Disease?
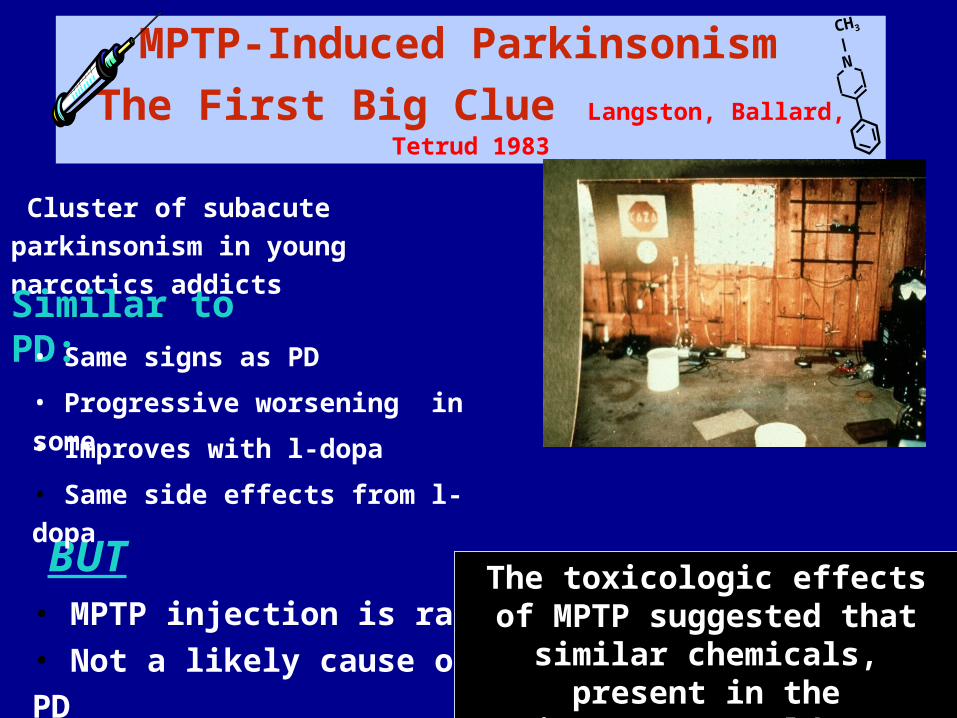
MPTP-Induced Parkinsonism
The First Big Clue Langston, Ballard, Tetrud 1983
Cluster of subacute parkinsonism
in young narcotics addicts
Similar to PD:
BUT• MPTP injection is rare
N
CH3
• Same signs as PD
• Progressive worsening in some
• Improves with l-dopa
• Same side effects from l-dopa
• Not a likely cause of PD
The toxicologic effects of MPTP suggested that similar
chemicals, present in the environment, could cause PD
Is Parkinson’s disease an
environmental disorder?
“These findings favor monogenic autosomal dominant inheritance and show reason to argue against a multifactorial etiology or heteroplasmy.”
Duvoisin & Johnson Brain Pathology 1992
Is Parkinson’s Disease a monogenic disorder?
Is Parkinson’s disease an inheriteddisorder?
Twins: Mother Nature's Controlled Study
•MZ twins share ~100% of genes
•DZ twins share ~50% of genes
Hypothesis: If Parkinson’s disease is primarily a genetic disorder, then concordance in MZ twins should be > than in DZ twins.
NAS/NRC WWIIVETERAN TWINS ROSTER
31,848 TWINS BORN 1917 - 1927
Results: MZ & DZ concordance similar ; Except young onset MZ > DZ
Conclusion: Environment is an important contributor to the cause of PD
Tanner, et al, JAMA, 1999
Inherited parkinsonism is rare, but yields clues to the cause of typical Parkinson’s Disease
• Current evidence suggests only ~ 10 % of all PD is caused by a single genetic defect
• In many, inherited parkinsonism begin at an earlier than expected age • In many, inherited parkinsonism has different clinical features than “typical”
PD
Normal protein products of these genes are all likely involved in protein degradation & /or cellular response to toxicant injury or oxidative stress
Studying Twin Pairs Discordant for PD Can Yield Clues Regarding
Causes
OR 95% CI p-value*
Overall 3.0 1.14-9.2 0.023
MZ 3.3 0.86-19 0.092
DZ 2.7 0.64-16 0.23
Head Injury and PD Risk in WWII Veteran TwinsGoldman, Tanner et al, Annals of Neurology 2006
Subjects: 93 discordant pairs with complete information 26 pairs with at least one head injury
Results: 14.7% with head injury; 7.8% hospitalized Head injury 37.4 yrs (mean) before PD onset Increased Risk of PD with head injury
*McNemar’s
PD risk further increased with > 1 head injury: 1 injury: OR 2.6 (1.07,6.5; p = 0.035)2 injuries: OR 5.1 (0.54, 48; p = 0.16)
Test for trend 0.042
Head Injury & PD
Mild-moderate head injury associated with PD in >70% of studies.