STUDIES OF DIFLUOROPHOSPHORIC ACID AND ITS ALKALI METAL SALTS by WILLIAM REED B.Sc, University of Durham, 1963 A THESIS SUBMITTED IN PARTIAL FULFILMENT OF THE REQUIREMENTS FOR THE DEGREE OF MASTER OF SCIENCE in the Department of Chemistry We accept this thesis as conforming to the required standard THE UNIVERSITY OF BRITISH COLUMBIA September, 1965
Transcript
STUDIES OF DIFLUOROPHOSPHORIC ACID AND ITS ALKALI METAL SALTS
by
WILLIAM REED
B.Sc, University of Durham, 1963
A THESIS SUBMITTED IN PARTIAL FULFILMENT OF
THE REQUIREMENTS FOR THE DEGREE OF
MASTER OF SCIENCE
in the Department
of
Chemistry
We accept this thesis as conforming to the
required standard
THE UNIVERSITY OF BRITISH COLUMBIA
September, 1965
In presenting th i s thes i s in p a r t i a l f u l f i lmen t of
the requirements for an advanced degree at the Un ivers i ty of
B r i t i s h Columbia, I agree that the L ibrary sha l l make i t f r ee l y
a va i l ab l e fo r reference and study, I fur ther agree that per
mission for extensive copying of t h i s thes i s for scho la r l y
purposes may be granted by the Head of my Department or by
his representatives.. It i s understood that copying or p u b l i
ca t ion of t h i s thes i s for f i n a n c i a l gain sha l l not be allowed
without my wr i t ten permiss ion.
Department of C \ i £ M i S>i jg>/
The Un ivers i ty of B r i t i s h Columbia Vancouver 8, Canada
Date q<? -Kv /Uf
i
ABSTRACT
Difluorophosphoric acid was purified by a double distillation
technique. Alkali metal difluorophosphates were prepared by reaction
of the metal chlorides with purified difluorophosphoric acid; x-ray
powder photographs and infra-red spectra of the salts were obtained.
Electrical conductivity measurements were made on solutions of the
alkali metal difluorophosphates in difluorophosphoric acid as solvent.
The order of mobility of the alkali metal cations in this solvent was
found to be Li>Na>K>Rb>Cs. Results indicate that the difluorophosphate
ion does not conduct by a proton transfer process in this solvent.
Conductimetric studies on solutions of a number of other compounds
Analysis of the equilibrium product showed that 33% H PO was unchanged,
60% was transferred to the monofluorophosphoric acid but only 7% to the
difluorophosphoric acid.
Variations on previous methods were attempted in order to synthesize
the acid. Anhydrous monofluorophosphoric and difluorophosphoric acids were
prepared** by allowing orthophosphoric acid and phosphoryl trifluoride to
react at 70°-80*. However, the usual problem of a mixture of products was 12 13 obtained . Further work by Lange and Livingston consisted of a study
3
of the fluorophosphoric acids and a preparation of anhydrous difluoro
phosphoric acid. The hydrolysis of phosphoryl trifluoride was investigated
and i t was found that pure acid could be obtained by the reaction:
POFj • POP(OH)£ * 2POF2(OH)
Experimental details are given in the article together with various 25°
properties of the acid (d » 1.583, m.p. «* -96.5° * 1* and b.p. • 115.9°). 14
The system H O-HF-P O was further examined by Shaposhnikova ;
difluorophosphoric acid was prepared by adding P 20 5 to an ice eold solution
of HF in fluorosulphuric acid. The product was distilled in vacuo and
fractionated; difluorophosphoric acid was found to decompose at its boiling
point of 108°, its molecular heat of evaporation is given as 9125-360 cals.
and Trouton's constant as 23.7-24.6. The acid was found to attack silicates
at room temperature, the rate increasing with rise of temperature.
Nuclear magnetic resonance studies of solutions in the homogeneous
region of the system H20«HF-P205 confirm the presence of a mixture of acids.
Ames, Ohashi, Callis and Van Wazer15 detected the presence of HPO F*,, H P Pg»
HjPO^ and H J P O J F in the system and estimated their relative concentrations 19 31
by examining the F and P nuclear magnetic resonance spectra. An actual
total of nine structural entities were found; in addition to the above
acids, free water, end- and middle-phosphate structure units and a new structure
unit containing one fluorine per phosphorus atom which is believed to be a
monophosphate end group, were also found.
Various other workers have investigated the fluorophosphoric acids by
nuclear magnetic resonance; multiple magnetic resonance lines have been
observed for F 1 9 and P 3 1 nuclei in H P O J P J , PFj, PH3, H J P O J F and HPFfi in the
4
liquid state. At a field strength of 6385 gauss a splitting of 0.244
gauss was obtained by Gutowsky, McCall and Slichter 1 6 for the P 1 9 resonance 17
in HPOjFj* Quinn and Brown measured the nuclear magnetic resonance 19
splittings for F in HP02F2 in weak fields. At a magnetic field strength of approximately 550 gauss they obtained a splitting of 0.240 gauss, but
19 the doublet structure obseived for the F resonance in HP02F2 coalesced as the field was decreased until a single broad resonance was obtained at
18 approximately 200 gauss. However, Roux and Bene obtained spectra at
35-15 gauss and found a doublet; the results were in general agreement
with experiments at higher fields (at a field strength of 37 gauss a
splitting of 0.245 gauss was observed), but as no singlet was observed
i t was concluded that the singlet observed by Quinn and Brown in the field
of 200 gauss cannot be explained in terras of the size of the main field only.
Further information regarding indirect coupling of nuclear spins in 19
molecules containing P-F and P-H bands has been reported by Frank ; the
relative magnitude of J p _ p and J H p are given for HP02F2 and other phosphorus
compounds. For the series (i) FjPO, (ii) F2P0(0H), ( i i i ) FP0(0H)2 and (iv) 20
PO(OH)3 Gutowsky and McCall found phosphorus resonance in (ii) and (iv),
with phosphorus shielding greater in ( i i ) ; the fluorine shielding increases
with F-substitution. 21
Several salts of difluorophosphoric acid are known; the ammonium salt
can be prepared by the fusion of phosphoric oxide with ammonium fluoride,
the product being extracted with dry alcohol to remove the ammonium difluoro-phosphate which is then recrystallised from hot water. Dilute solutions of the ammonium salt treated with a soluable salt of nitron give a crystalline
2 precipitate of nitron-difluorophosphate. Lange prepared a number of salts
5
by treating hot aqueous solutions of nitron difluorophosphate with
metallic nitrates, nitron nitrate was filtered off and the solution
evaporated to dryness to recover the difluorophosphate. Most of the salts
were found to be very soluble in water but the potassium and the cesium
salts only moderately so. The difluorophosphates are stable in neutral
solution, but less so in alkaline or acid solutions. Their general behaviour
is similar to that of the perchlorates (and also the fluoroborates and
fluorosulphates), the less soluble salts of both acids being the potassium
and cesium salts. The alkali salts are isomorphous with the perchlorates,
fluorosulphates and fluoroborates; this resemblance is due to these a l l 3
being strong monobasic acids with tetrahedral anions of nearly the same size . 22
Jonas was able to prepare difluorophosphates by allowing salts of hexa-fluorophosphoric acid to react with oxides such as: Si0 2, B 20j, WO ; CaO or sodium metaphosphate. Quantitative yields were obtained. Ryss and
23 Tul'chinskii investigated a new method to prepare the sodium salt free
from other fluorophosphates. NaHF2 arid P20g were allowed to react in a
platinum crucible, the product being extracted with absolute methanol. Rates
of hydrolysis of the sodium salt were investigated and i t was found that in
neutral aqueous solution, hydrolysis was slow even at 100*. However, on
heating in 0.1 N NaOH solution at a 3:1 ratio of OH* to NaP02F2 for 10
minutes at 70* quantitative hydrolysis occurred by the reaction:
P0 2F 2" • 20H" — POjF2" • F" • H20
On heating with excess of 0.1 N. NaOH in a stainless steel ampoule for about
2 hours at 160* complete decomposition occurred by the reaction
P0 2F 2" + 30H" HPoJ" + 2F~ • HjO
6
Of the salts, only the potassium and the ammonium salt have been 24
investigated spectroscopically; Corbridge and Lowe examined the infra-red
spectra of ammonium difluorophosphate in the region 5,000 - 6S0 cm."1, and
an assignment of the frequencies was made. Buhler and Bues investigated
the vibration spectra of fluorophosphate melts and crystals; the infra-red
and Raman spectra of crystalline KP02F2, KPFg and ^POjF are reported and
assignments made. The force constants and bond orders in these and in
related anions are discussed.
The only conductivity studies on difluorophosphoric acid have been
made by Barr, Gillespie and Robinson , who measured the electrical
conductivity of solutions of HC104, HSOjF, H P O J F J, and HSOjCl in sulphuric
acid. They found that HSOjF and HSOjCl behaved as acids, whereas HP02F2
and CHJSOJH were bases in the H2S04 system. Difluorophosphoric acid has found l i t t l e use in inorganic chemistry*,
27 28 however, Stolzer and Simon * have used the acid extensively in organic
29 reactions. Hood has shown that the treatment of difluorophosphoric acid
with aliphatic alcohols yields alkyl hydrogen phosphorofluoridates;
HP02F2 • ROH > (RO) (OH) P0F2
30 & \)
The fluorophosphoric acids have been used as polymerisation ' , condensation
and alkylatlon catalysts, and also as anhydrous acids in the non-oxidising
refining -Spoils.
The salts of difluorophosphoric acid have been used industrially: 32
Na, K, L i , Ba and Pb salts stabilize chloroethylene polymers ; Zn, Co, Pb, 33
Fe and Cd salts are used as catalysts in the preparation of 8-lactones , and, substituted aluminium chlorides, e.g., A1C12P02F2 serve as alkylatlon
34 catalysts .
7
00 Purpose of the present work The purpose of this work is to investigate the properties of solutions
in difluorophosphoric acid and in so doing extend the range of studied
protonic solvent systems. As no complete study of a l l the alkali metal
difluorophosphates has ever been made by a single author these compounds
have been investigated further by infra-red and x-ray powder diffraction
methods.
EXPERIMENTAL
I. Preparation and purification of materials
(a) Difluorophosphoric Acid
Commercial difluorophosphoric acid, supplied by Ozark-Mahoning
Chemical Company, was purified by five double distillations at 9.0 cms. of 26
mercury and a temperature range of 45*-49*C, (Gillespie used 15 mms and 35
44tt_46°) in the apparatus shown in Fig. I. The procedure was as follows.
The apparatus was evacuated and flamed out with a hot bunsen flame. Dry
air was allowed to enter through tap H until atmospheric pressure was
attained. A dry, dropping funnel (Fig. 3a) was fi l l e d , in a dry box, with
difluorophosphoric acid and was then fitted into the distillation apparatus
at L. The acid was allowed to drain into the flask A. The dropping funnel
was removed and the thermometer well replaced. The system, which was
connected to a vacuum pump at N via liquid nitrogen traps and an acetone-dry
ice trap, was evacuated to about 9 cms. of mercury. The acid was then
refluxed for about 30 minutes to remove hydrogen fluoride which was condensed
out in the liquid nitrogen traps. The acid was distilled into tube C until
a temperature of 45°C. was reached. At this temperature the distillate was
directed into flask B by the fraction collector E (E is shown in more detail
in Fig. 2). Tap M was then closed and the vacuum pump was disconnected
from N and attached to 0.
The second distillation was carried out under the same conditions, but
in this case separation was achieved by rotating F within the B.19 ground
glass socket at G so that the acid could be directed into either D or J as 8
9
desired. Flask D containing the required acid was quickly detached and
capped; i t was then transferred to the dry box and the acid poured into
the dropping funnel. Clean, dry apparatus was set up and the distillation
repeated. In the first two or three double distillations considerable
attack of glass occurred. In an attempt to reduce this, the acid was
first refluxed under vacuum at temperatures slightly above room temperature
for 24 hours in a stainless steel condenser and flask; however, on subsequent
distillation in the glass apparatus no improvement was observed. Carrying
out the same procedure as above but at room temperature had no effect on
the result.
Periodic checks of acid purity were made by examination of the fluorine 14
nuclear magnetic resonance spectrum '
(b) Difluorophosphates
Ammonium, lithium, sodium, potassium, rubidium and cesium difluorophosphates
were prepared by the reaction:
M Cl • H P0 2F 2 > M P0 2F 2 + H Cl
where M is the metal cation. Fig. 4 shows the apparatus used. The dry
metal chloride was placed in the reaction vessel D which was then attached
to the acid distillation apparatus at K in Fig. 1. The apparatus was
evacuated and then flamed out in the normal manner. Difluorophosphoric acid
was distilled at the usual pressure and temperature onto the chloride which
immediately reacted with the acid resulting in the evolution of HCl. When
sufficient acid had been added to dissolve a l l of the solid the reaction
vessel was removed from the distillation apparatus and a ground glass B 19
FIG. I. DIFLUOROPHOSPHORIC ACID DISTILLATION APPARATUS
12
FIG. 3(a) DROPPING FUNNEL (b) WEIGHT DROPPER
APPARATUS USED FOR THE PREPARATION OF THE ALKALI METAL DIFLUOROPHOSPHATES
300
14
cap was quickly placed on Q. Tube R was then removed and the reaction
vessel was attached via S to the vacuum pump. The excess difluorophosphoric
acid was removed at a pressure of about 0.5 irons, of mercury, with occasional
warming of the vessel D with a bunsen flame. When a l l the acid had been
removed the product was washed with ether and then recrystallized from dry
methanol (except the sodium salt which was found to be exceedingly soluble
and was, therefore, recrystallized from dry ethanol). Finally the
difluorophosphates were washed with ether, dried and stored over phosphoric
oxide in a vacuum desiccator.
Aqueous solutions of the salts showed no precipitation on addition of
silver nitrate solution (negative test for chloride) and no precipitation 36
on addition of lead and barium nitrate solutions (negative tests for
monofluorophosphate and fluoride).
Fluorine and phosphorus microanalysis were obtained in the A. Bernhardt
Microanalytical Laboratories, Germany, and the results are shown in Table I
below. TABLE I
calc. Li
obt. calc. Na
obt. calc. K
obt.
%P 28.81 28.7 24.99 24.82 22.12 22.1
%F 35.21 35.5 30.65 30.80 27.14 27.29
calc. Rb
obt. calc. Cs
obt. calc. NH. 4 obt.
%P 16.61 16.53 13.24 13.14 26.03 25.83
%F 20.38 20.42 16.25 16.42 31.93 32.23
%N - 11.76 11.63
15
(c) Other Materials
sodium monofluorophosphate: Commercial Na2POjF obtained from Alfa
Inorganics Inc. was recrystallized once from water.
sodium fluoride: Chemically pure NaF was dried in a drying pistol
at 80° and a pressure of 10 rams, of mercury for three days.
fluorosulphuric acid: Commercial HS03F obtained from the Allied
Chemical Co. was double-distilled at 164*.
potassium fluorosulphate: KSO F was prepared by the method used
by Gillespie et a l . 3 7
dry air: The air allowed to flow into the vacuum distillation
system was passed first through calcium chloride, then magnesium perchlorate
and finally through a liquid nitrogen trap followed by an acetone/dry ice
trap. As some compounds, as well as the acid, were handled in the dry
box, compressed air was passed first through three gas wash-bottles
containing concentrated sulphuric acid, then through a tube containing
calcium chloride and finally through a tube containing magnesium perchlorate.
The air, dried in this way, was always tested for traces of water by means
of the m ,drying-train M tester, shown in Fig. 5. The air was allowed to
enter the tester at A from the outlet of the dry box, then pass over 30%
oleum contained in B and exit via C. If the air caused no fuming in the
vessel i t was considered to be dry enough for use. Air, dried in this manner
was passed through the dry box for several hours before use. Several dishes
of phosphoric oxide were placed at various locations in the dry box to
ensure as dry an atmosphere as possible.
17
1 1 • Physical Methods
(a) Electrical Conductivity
The design of the cell used to measure the conductivities of
solutions in difluorophosphoric acid is shown in Fig. 6. The cell could
be attached to the distillation apparatus at K by means of the B.19 ground
glass cone L. The cell has three electrodes and was designed so that the
cell constant, when using electrodes B and C, was approximately 5 while
the constant, when used electrodes B and A was approximately 15. Thus,
accurate conductivity measurements could be made on weakly conducting
solutions using the electrodes A and B, while measurements on more strongly
conducting solutions were made using electrodes B and C. The capacity of
the cell was about 400 mis.
The cell was cleaned with aqua-regia and the electrodes were plated
with platinum black by electrolyzing a chloroplatinic acid solution prepared 38
according to Jones and Bollinger . The solution consisted of a 0.3%
solution of chloroplatinic acid in 0.025N. hydrochloric acid with 0.02% lead
acetate added, A current of 10 milliaraps. was passed for 15 mins. with a
reversal of current every 10 seconds. The cell was steamed out, dried and
then calibrated using aqueous potassium chloride solution according to the 39
method of Lind, Zwolenik and Fuoss . The cell was replated and recalibrated
after every four or five experiments.
All measurements were made with the cell immersed in an o i l bath
regulated by means of a mercury-thallium regulator at 25i 0.002°. The
temperature of the thermostat was measured by Beckmann thermometers which
had been calibrated against a platinum resistance thermometer.
FIG. 6. DIFLUOROPHOSPHORIC ACID CONDUCTIVITY CELL
19
The apparatus used to make so l id additions to the c e l l i s shown in
F ig. 7. It consisted of a "T"-shaped glass tube with B.19 ground glass
sockets at the ends 0 and P, and a B.24 ground glass cone with an extension
at M. The corks at 0 and P were made of teflon and they were t ight ly f i t ted
with stainless steel pistons A and B respectively. The f l a t "runners"
which were also made from tef lon interlocked at Q and lay on the bottom of
the tubes. The compound to be added to the c e l l was weighed into small,
preweighed, dry, glass boats which were inserted through 0 of the sidearm.
Approximately eight boats could be accommodated in the sidearm. The loaded
injector was then connected at M tr a rotary vacuum pump v ia l iquid
nitrogen traps, warmed and evacuated. This was done to remove any water
absorbed during the weighing-out process. After several hours the injector
was detached from the pump and stored unt i l use in the dry box.
A conductivity run was carried out in the following manner; the
conductivity c e l l was attached by means of a B.19 inner ground glass joint
d irect ly to the d i s t i l l a t i on apparatus at K and flushed out with dry a i r .
Difluorophosphoric acid was d i s t i l l e d d irect ly into the c e l l ; acid obtained
-4 -4
in this way usually had a conductivity between 2.41 x 10 and 2.51 x 10
ohm. cm. ~*. At a l l times in handling the acid great care was taken to
exclude water. It was found that there was a gradual increase in the specif ic
conductivity with time; over a period of 4-5 hours a 1% increase in K was
observed. Solutions for conductivity measurements were prepared as follows:
difluorophosphoric acid was d i s t i l l e d d irect ly into the c e l l which was
weighed before and after addition of the acid. The B.24 stopper was removed
and the injector was quickly inserted into the c e l l at F. Mercury was
poured into the glass tubes holding the platinum electrodes, care being taken
20
to remove a l l the air bubbles. The cell and the injector were then placed
on a support in the o i l bath. To make an addition, a glass boat was pushed
by the piston A from the sidearm into the main tube, the boat was then
moved by piston B along N and pushed into the acid.
After each addition of solute the cell was well shaken to ensure
good mixing, and returned to the thermostat. After sufficient time had
elapsed to allow for temperature equilibrium (IS to 20 minutes) the
resistance measurements were made. The cell was then removed from the
thermostat, shaken again, and the resistance measurements repeated. In
this manner errors due to insufficient mixing were eliminated.
Fluorosulphuric acid was added to the cell by means of the weight
dropper shown in Fig. 3b. As both adds hydrolyze in air, the weighed
sample was added to the cell in the dry box. The cell was returned to the
thermostat and the above procedure for measuring resistance was followed.
Resistances of solutions were measured on a precision a-c resistance
bridge which has been previously described by Daggett40. A 2,000 c/s
oscillator was employed as the source and a telephone headset was used as
the null-detector.
Throughout this work,specific conductance will be referred to by the
symbol K.
(b) Infra-red spectra
All spectra were recorded from 4,000 to 250 cm. on a Perkin-Elraer
421 Double Beam Spectrophotometer under "normal" operating conditions. The
materials were examined as fine powders spread on cesium iodide plates. This
was accomplished by finely grinding the sample and then dissolving i t in dry
21
22
methanol. A thin layer of the resulting solution was obtained on the
cesium iodide, which was then placed on a hot plate to drive off the
methanol. Specimens were obtained as a thin layer, thicker samples being
used when searching for weak absorption. A decrease in transmittance above
about 2,000 cm. "* due to scattered radiation was observed in many spectra;
this was not removed on decreasing the particle size. By taking spectra
with Nujol mulls in the higher frequency region, sharper absorptions were
obtained.
(c) X-ray powder photographs
X-ray powder samples of the difluorophosphates were prepared in 0.3 41
mm. quartz capillaries by the method described by Azaroff and Buerger .
The x-ray photographs were taken using a General Electric Camera of 14.32
cm. diameter. This camera employs Straumanis loading. Nickel filtered
(using a 0.089 cm. thick Ni-foil) Cu-Ko radiation (X«- 1.5418 A) was used
as the source. The x-ray tube was operated at 35 kilovolts and 15 milliamps.
The camera employed a s l i t collimator, for which the exposure time required
was between 3-6 hours depending on the sample.
RESULTS AND DISCUSSION
(a) Electrical Conductivity
The results of the conductivity measurements on solutions of metal
difluorophosphates in difluorophosphoric acid at 25± 0.002" are given in
Table II. As a l l the solutions were made up by weight the concentrations
are expressed in molal units (m); due to the lack of accurate density
data no attempt was made to express the concentrations in molar units. In
each case a plot of ie against molality was made (Fig. 8). By analogy
with other protonic solvent systems HPO.^ would be expected to undergo
autoprotolysis according to the equation:
2HP02F2 ^ = ± H2P02F2* • P02F2- 1
In this system then, bases may be defined as substances which, when dissolved
in difluorophosphoric acid, increase the concentration of the difluorophosphate
anion P02F2~, and acids may be defined as any substance which increases the
concentration of the difluorophosphoric acidium ion HjPO^P^*/ It i s ,
therefore, expected that the alkali and alkaline earth difluorophosphates
will behave as strong bases in this system.
M P0 2F 2 M* + P0 2F 2" 2
In solvents where the mobilities of the autoprotolysis ions are very
much greater than the mobilities of other ions (due to a proton transfer
mechanism of conduction for the former ions), strong bases exhibit almost
identical conductivity curves at low concentrations with small deviations 37
noticeable only in the more concentrated solutions . As the conductivity
curves for the alkali metal difluorophosphates deviate from each other at
even the lowest concentrations measurable, i t must be concluded that
P0„F„~ ion does not show abnormal conduction.
24
TABLE II
SPECIFIC CONDUCTANCES OF SOME DIFLUOROPHOSPHATES AT 25°C.
LiP0 oF o KPO-F- RbPO-F, 9 * * 4 2 4 2 4 10 in 10\ 10 m 10 tc 10 m 10%
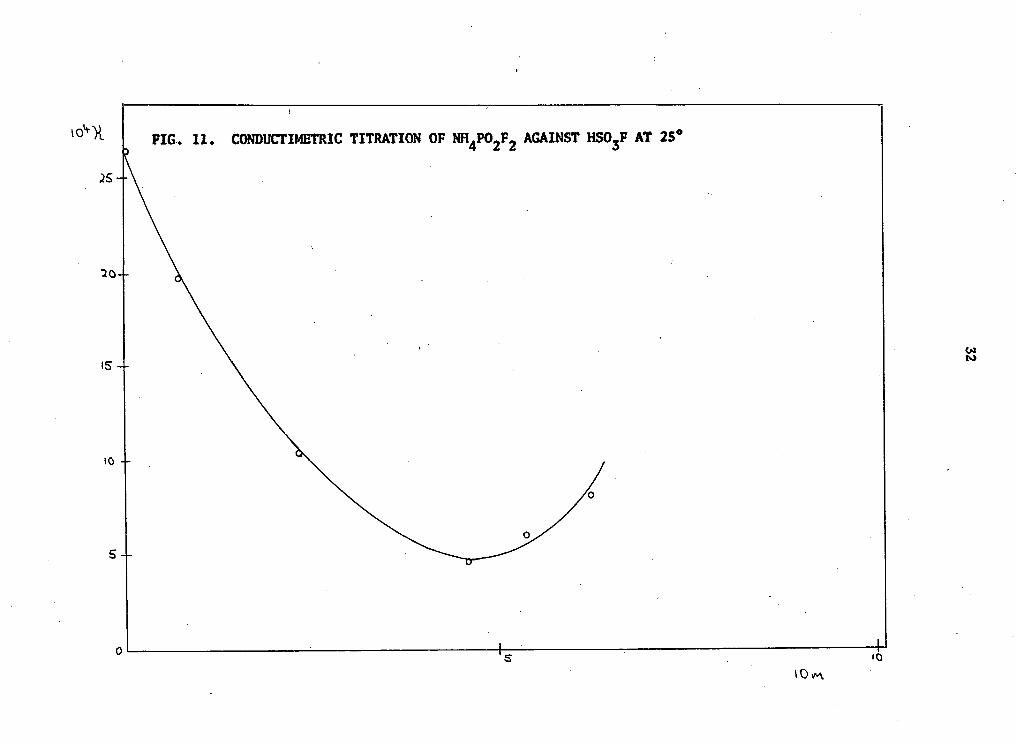
The K versus m curve for HSOjF shows an i n i t i a l flat portion followed by a
linear increase in conductivity with concentration. On extrapolation
of the linear portion to zero concentration the curve does not pass through
the ini t i a l point corresponding to solvent conductivity but appears to
pass through the origin. If the impurity in the solvent is in fact basic
then addition of HSOjF should neutralize this impurity. In fact the flat
portion of the HSOjF curve may be attributed to titrating the impurity.
Since the slope of the linear portion of the HSOjF curve is similar to the
slopes of the curves for the difluorophosphates i t may be concluded that
fluorosulphuric acid is undergoing dissociation to roughly the same extent
as occurs with the alkali metal difluorophosphates. Hence fluorosulphuric
acid appears to be a strong acid in this solvent, a result which is consistent 26
with ;the conclusion of Gillespie et al. that HSOgF is a very much stronger acid than HPOjFj.
44 Gillespie has suggested that the strengths of inorganic oxyacids are
determined largely by the number of equivalent oxygen atoms in the anion over
which the negative charge may be spread. The strength of the acid increases
with the number of equivalent oxygen atoms, therefore, HSO F, HSOgCl and
HSOjOH are of the same type, having the anions FSOj", CISOj" and HOSOj" with
three equivalent oxygen atoms. C104~ should, therefore, be the anion of the
stronger acid HCIO , which has four equivalent oxygen atoms, and (H0)2P02~
and F2P02~ anions of weaker acids, having only two equivalent oxygen atoms.
However, i t seems reasonable to suppose that some of the charge on the anion
is accommodated on the halogen atom and i f the sharing of the charge between
3 4
the oxygen atoms and halogen are equal HSOjF and HSO^Cl would be in the same
class as HCIO^. A similar effect for P O2
F 2 ~ w o u l d P u t t n e a c * d *-n t h e s a m e
class as HC10A and i t would be expected to be stronger, rather than weaker , t n a n
2 6 H J S O J . G i l lespie et a l . have made comparisons of acid strengths of
di lute solutions of various acids with that of H SO^ in bulk, and obtained
the order: H 2 S 2 0 7 >HSO s F>HSOjCl>HC10 4 >HP0 2 F 2 ; they have indicated that the
acid strength of H 2SOA in bulk may, because of co-operative hydrogen bonding,
be considerably greater than that of H 2 S 0 4 in di lute solution. This suggests
that HP0 2F 2 may in fact be a stronger acid in bulk but our results do not
substantiate th i s , since even in bulk HP0 2F 2 i s a very much weaker acid than
HSOjF
Conclusions
Difluorophosphoric acid i s a solvent of weak solvating ab i l i t y as shown
by the low so lub i l i ty of salts such as KSOjF and the order of mobilities
of the a lka l i metal cations.
Since one of the requirements for proton transfer conduction in a
solvent is association between the autoprotolysis ions and the solvent
molecules through strong hydrogen bonds, then the absence of proton transfer
conduction in this solvent may be due to a large extent to the inab i l i ty of
the solvent to solvate the ions strongly. Indeed the relat ive low boi l ing
point of difluorophosphoric acid compared to the boi l ing points of HSO,F
( 1 6 3 * ) and H 2 S 0 4 ( 2 9 0 - 3 1 7 ° ) for example indicates that hydrogen bonding in
this solvent i s very weak.
35
(b) Infra-red spectra
Results of measurements of the infra-red spectra of the difluorophosphates
in the region 4,000-300 cm."1 are given in Table IV. The position of the
peaks is In good agreement with the reported spectra for difluorophosphates;
the absence of any absorption in the monofluorophosphate region indicates
l i t t l e contamination of the compounds used in this work by monofluorophosphate
impurity. The spectrum for the lithium salt differs from that of the other
salts studied; this could be due to a basic difference in the crystal
structure. Spectra of CsPQ2F2 and NaPO*2F2 are given in Fig. 12 as typical
spectra.
P-0 stretching vibration region:
The ionic phosphate vibration has already been connected with absorption .44 .45 .46
at 1040-1000 cm. , 1110-1050 cm. , and 1,170-1,000 cm. . In the
series of compounds studied only absorption in the last range of values
was observed. The difference in position of the ionic phosphate absorption
bands of the difluorophosphates compared with other phosphates has been
connected with the presence of highly electronegative F atoms bonded to the 47 24 phosphorus atom . Corbridge and Lowe examined the spectra of ammonium
difluorophosphate in the region 5,000-650 cm.**1 and their values are given
in the table. It can be seen that they obtained an extra peak at 1,005 cm."1
and i t appears likely that this may be due to monofluorophosphate (which
absorbs in the region 1,070-1,000 cm."1) as no peak was detected in any
difluorophosphate studied in this work. A difference of 30 cm."1 was found
for the asymmetric PO stretching frequency from that found by Corbridge. 25
However, the value obtained by Buhler and Bues for the asymmetric P0 stretch
36
in KP02F2 agrees well with that found in this work. Their values for
K P O J F J are also given in the Table; i t is felt that the peak they report
at 535 cm."1 is due to monofluorophosphate which absorbs at 530 cm."1 in
48 Robinson has recently discussed P-0 stretching frequencies in a
number of phosphorus compounds. He found a linear relationship existed
between the symmetric and asymmetric stretching frequencies of the P02
group. In ammonium difluorophosphate 1,125 cm."1 was assigned to the
symmetric PO stretching frequency and 1,262 cm."1 to the asymmetric. However
Robinson used only the ammonium difluorophosphate in his plot of symmetric
against asymmetric PO stretches; the straight line correlation is given
by the equation: *sym. ' °* 6 5 W • 2 7 0
Making use of the information obtained here on the difluorophosphates a better value for the straight line correlation i s :
v««« " °* 7 0 va e«n, • 2 1 0 sym. asym.
P-P stretching vibration region.
P-F stretch has been assigned to the region 990-840 cm."1 in
PFj, P0F3 and PF,.4** and 980-740 cm."1 in organophosphorous compounds47. The
absorption at 835-720 cm."1 found in a l l the monofluorophosphates has been 24
assigned by Corbridge and Lowe as probably due to P-F stretching; they
also found that ammonium difluorophosphate absorbs in this region. However
examination of Table indicates that the P-F stretch of the difluorophosphat
lies in the region 940-818 cm."1. I t 5 0 has been shown that the symmetric PFj deformation occurs around 500 cm."1 and this agrees well with the values
25 obtained. However Buhler and Bues have also assigned the symmetric P02
deformation to about the same region, namely 535 cm."1.
37
TABLE IV
INFRA-RED DATA OP THE DIFLUOROPHOSPHATES
(FREQUENCIES IN cm.*1)
LiP0 2F 2 NaP02F2 K P 02 F2 RbPOjFj
1273s 1309s (1332s (1330s 1164 s 1152 s [1310 s \l310 s 940 s (868 s 1148 s 1145 s 890 s 1844 s j 850 s (846 m ("525 s [502 s L832 s 1827 s 1498 s 1458 m [503 s (505 ra (426 s 360 w 1495 s 1492 s 1415 s-("357 s 1342 s
CsPO,F- NH-P0,F, NH.PO-F, (Corbridge KPO-F, (Buhler , c
3 MO a 2680 . vb 4 2 2 and Lowe") 2 2 and Bues25) 3,380-2,2680 m,vb. 2 ) 9 0 0 . 2 > S 5 0
(1321 s [1443 s (1445 w,sh 1330 w U299 s (1410 s 11414 s 1311 s 1137 s 1292 s 1262 s 1145 s (843 m.sh 1138 s 1125 s f857 8 1818 s (860 m,sh 1005 ww 834 s (503 m 1842 s (870 w,sh. 535 w 1489 s 500 s (.832 s (512 m
1481 s 286 w
Note: Brackets indicate incompleted resolved bands (see Fig.12)
s * strong; m '*> medium; w • weak; sh » shoulder
FIG. 12. INFRA-RED SPECTRA
1.000 I.S00 1,000 500
WAVE NUMBER (cm."*1)
(b) C S P 0 2 F 2
2.000 1,500 1,000 500 200
WAVE NUMBER (cm. )
39
The influence of the cations on the spectra do not appear to be very
marked, except in the case of the lithium salt. A pronounced shift of a l l
peaks to lower frequency was observed, excepting the asymmetric PO
stretching frequency which occurs at 1,273 cm.-1. These shifts are
probably bound up with the tendency of lithium salts to exhibit some
covalency. With the remaining alkali metal salts, a tendency for the
shift of certain peaks to higher frequency with increasing mass is notice
able. The progressive shift is most evident with the symmetric PO stretching
frequency, i.e. in LiP0 2F 2 i t is 1,164 cm."1, and drops gradually to 1,137 cm.
in CsPOjPj.
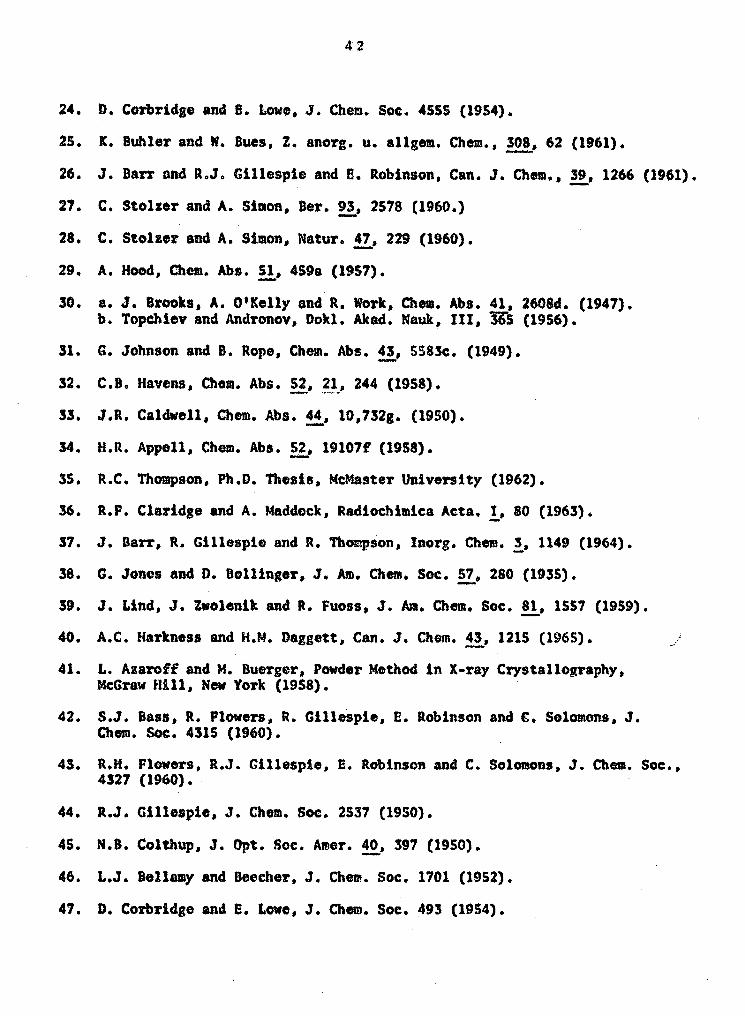
(c) X-ray powder photographs
Inspection of the x-ray powder films (Fig. 13) indicates that with the
exception of LiP0 2F 2 and possibly NaPOjFj the alkali metal and ammonium
difluorophosphates are isoroorphous. The anomality of the lithium salt may
be due to the tendency of the lithium atom to attain only 4 co-ordination
in the crystal while the other larger alkali metal cations attain 6
co-ordination.
The presence of numerous lines in the NaP02F2 powder film indicates
either that considerable impurity occurred in the sample used or that the
NaP09F, is in fact not isomorphous with the other salts.
ray Powder Fi1ms
4;1
REFERENCES
1. W. Lange, Ber. 60B, 962 (1927).
2. W. Lange, Ber. 62B, 786 (1929).
3. N.V. Sidgwick, Chemical Elements and their Compounds, Vol. 1, Oxford (1950).
4. W. Lange, Ber. 61, 799 (1928).
5. F. Ephraigm, Inorganic Chemistry, Gumey and Jackson (1943).
6. T. Moeller, Inorganic Chemistry, Wiley (1955).
7. G. Tarbutton, E. Egan and S. Frary, J. Am. Chem. Soc. 63, 1782 (1941).
8. W. Lange, Chem. Abs. Al, 572f. (1947).
9. W. Lange and R. Livingston, J. Am. Chem. Soc. 69, 1073 (1947).
10. W. Lange, Ber. 62, 1084 (1929).
11. W. Lange and R. Livingston, Chem. Abs. 42_, 1711h (1948).
12. W. Lange, Fluorine Chemistry, Vol. I, ed. J. Symons, Academic Press (1950) J.R. Van Wazer, Phosphorus and its Compounds, Vol. I, Interscience (1958).
13. W. Lange and R. Livingston, J. Am. Chem. Soc. 72, 1280 (1950).
14. M. Shaposhnikova and Alliloeva, Zh. Prikl. Khim. 35, 760 (1962).
15. D. Ames, S. Ohashi, C. Callis and J. Van Wazer, J. Am. Chem. Soc. 81, 6350 (1959). "~
16. H.S. Gutowsky, D. McCall and C. Slichter, J. Chem. Phys. 22, 162 (1954).
17. W. Quinn and R. Brown, J. Chem. Phys. 21_, 1605 (1953).
18. D. P. Roux and G. Bene, J. Chem. Phys. 26, 968 (1957).
19. P.J. Frank, Helv. Phys. Acta. 31_, 54 (1958).
20. H.S.,Gutowsky and D. McCall, J. Chem. Phys. 2j2, 162 (1954).
21. W. Lange, Inorganic Synthesis, Vol. II, ed. Fernelius, McGraw-Hill (1946).
22. H. Jonas, Chem. Abs. 46, 11603a (1952).
23. I. Ryss and B. Tul'chinskij, Russ. J. Inorg. Chem. 7, 677 (1962).
24. D. Corbridge and 6 . Lowe, J . Chem. Soc. 4S55 (1954).
25. K. Buhler and W. Bues, Z. anorg. u. allgem. Chem., 308, 62 (1961).
26. J . Barr and R.J. Gi l lespie and E . Robinson, Can. J . Chem., 39, 1266 (1961).
27. C. Stolzer and A . Simon, Ber. 93, 2578 (1960.)
28. C. Stolzer and A. Simon, Natur. 47, 229 (1960).
29. A. Hood, Chem. Abs. 51, 459a (1957).
30. a. J . Brooks, A. 0 'Kel ly and R. Work, Chem. Abs. 41, 2608d. (1947). b. Topchiev and Andronov, Dokl. Akad. Nauk, III, 365 (1956).
31. 6. Johnson and B. Rope, Chem. Abs. 43, 5583c. (1949).