Studies of Human Adipose Tissue ADIPOSE CELL SIZE AND NUMBER IN NONOBESE AND OBESE PATIENTS LESTER B. SALANS, SAMUEL W. CUSHMAN, and RODGER E. WEISMANN From the Departments of Medicine and Surgery, Dartmouth-Hitchcock Medical Center, Hanover, New Hampshire 03755 A BS TRA CT The cellular character of the adipose tissue of 21 nonobese and 78 obese patients has been examined. Adipose cell size (lipid per cell) was de- termined in three different subcutaneous and deep fat depots in each patient and the total number of adipose cells in the body estimated by division of total body fat by various combinations of the adipose cell sizes at six different sites. Cell number has also been estimated on the basis of various assumed distribution of total fat between the subcutaneous and deep fat depots. Obese patients, as a group, have larger adipose cells than do nonobese patients; cell size, however, varies considerably among the fat depots of individuals of either group. The variation in cell size exists not only between, but also within subcutaneous and deep sites. Estimates of total adipose cell number for a given in- dividual based upon cell size can, therefore, vary by as much as 85%. On the basis of these studies it is sug- gested that the total adipose number of an individual is best and most practically estimated, at this time, by division of total body fat by the mean of the adipose cell sizes of at least three subcutaneous sites. Irrespective of the method by which total adipose cell number is estimated, two patterns of obesity emerge with respect to the cellular character of the adipose tissue mass of these patients: hyperplastic, with in- creased adipose cell number and normal or increased size, and hypertrophic, with increased cell size alone. These two cellular patterns of obesity are independent of a variety of assumed distributions of fat among the Dr. Salans is the recipient of a Research Career Develop- ment Award from the Institute of Arthritis and Metabolism of the National Institutes of Health. Dr. Cushman is a re- cipient of an American Diabetes Association Research and Development Award. Received for publication 21 September 1972 and in revised form 13 December 1972. subcutaneous and deep depots. When these different cellular patterns are examined in terms of various aspects of body size, body composition, and the degree, duration, and age of onset of obesity, only the latter uniquely distinguishes the hyperplastic from the hyper- trophic: hyperplastic obesity is characterized by an early age of onset, hypertrophic, by a late age of onset. These studies indicate that there are two distinct periods early in life during which hypercellularity of the adipose tissue are most likely to occur: very early within the first few years, and again from age 9 to 13 yr. INTRODUCTION Obesity is characterized anatomically by an excessive adipose tissue mass. The development of new and re- liable methods for counting adipose cells and measuring their size in isolated fragments of adipose tissue has permitted a detailed examination of the cellular charac- ter of the expanded adipose depot of obese humans (1-3). Two apparently distinct cellular patterns have been described: in one, the expanded adipose depot contains increased numbers of somewhat enlarged adipose cells; in the second, the adipose cells- are enlarged but are present in normal numbers (4-6). In all of the above studies total adipose cell number has been estimated by dividing total body fat by adipose cell size (lipid content per cell). To date only subcu- taneous fat cell size has been used in this calculation; in some instances, a single subcutaneous site has been used (2, 6); in others, three sites (4, 5, 8). The size of the subcutaneous cells measured had been assumed to represent the average adipose cell size of the body and the number of fat cells calculated from this average to be a meaningful estimate of the total for that in- dividual. Adipose cell size, however, differs significantly The Journal of Clinical Investigation Volume 52 April 1973 929
From the Departments of Medicine and Surgery, Dartmouth-HitchcockMedical Center, Hanover, NewHampshire 03755
A BS TRACT The cellular character of the adiposetissue of 21 nonobese and 78 obese patients has beenexamined. Adipose cell size (lipid per cell) was de-termined in three different subcutaneous and deep fatdepots in each patient and the total number of adiposecells in the body estimated by division of total bodyfat by various combinations of the adipose cell sizes atsix different sites. Cell number has also been estimatedon the basis of various assumed distribution of total fatbetween the subcutaneous and deep fat depots.
Obese patients, as a group, have larger adipose cellsthan do nonobese patients; cell size, however, variesconsiderably among the fat depots of individuals ofeither group. The variation in cell size exists not onlybetween, but also within subcutaneous and deep sites.Estimates of total adipose cell number for a given in-dividual based upon cell size can, therefore, vary by asmuch as 85%. On the basis of these studies it is sug-gested that the total adipose number of an individual isbest and most practically estimated, at this time, bydivision of total body fat by the mean of the adipose cellsizes of at least three subcutaneous sites.
Irrespective of the method by which total adipose cellnumber is estimated, two patterns of obesity emergewith respect to the cellular character of the adiposetissue mass of these patients: hyperplastic, with in-creased adipose cell number and normal or increasedsize, and hypertrophic, with increased cell size alone.These two cellular patterns of obesity are independentof a variety of assumed distributions of fat among the
Dr. Salans is the recipient of a Research Career Develop-ment Award from the Institute of Arthritis and Metabolismof the National Institutes of Health. Dr. Cushman is a re-cipient of an American Diabetes Association Research andDevelopment Award.
Received for publication 21 September 1972 and in revisedform 13 December 1972.
subcutaneous and deep depots. When these differentcellular patterns are examined in terms of variousaspects of body size, body composition, and the degree,duration, and age of onset of obesity, only the latteruniquely distinguishes the hyperplastic from the hyper-trophic: hyperplastic obesity is characterized by anearly age of onset, hypertrophic, by a late age of onset.These studies indicate that there are two distinct periodsearly in life during which hypercellularity of the adiposetissue are most likely to occur: very early within the firstfew years, and again from age 9 to 13 yr.
INTRODUCTION
Obesity is characterized anatomically by an excessiveadipose tissue mass. The development of new and re-liable methods for counting adipose cells and measuringtheir size in isolated fragments of adipose tissue haspermitted a detailed examination of the cellular charac-ter of the expanded adipose depot of obese humans (1-3).Two apparently distinct cellular patterns have beendescribed: in one, the expanded adipose depot containsincreased numbers of somewhat enlarged adipose cells;in the second, the adipose cells- are enlarged but arepresent in normal numbers (4-6).
In all of the above studies total adipose cell numberhas been estimated by dividing total body fat by adiposecell size (lipid content per cell). To date only subcu-taneous fat cell size has been used in this calculation;in some instances, a single subcutaneous site has beenused (2, 6); in others, three sites (4, 5, 8). The size ofthe subcutaneous cells measured had been assumed torepresent the average adipose cell size of the body andthe number of fat cells calculated from this averageto be a meaningful estimate of the total for that in-dividual. Adipose cell size, however, differs significantly
The Journal of Clinical Investigation Volume 52 April 1973 929
not only from one subcutaneous site to another (5),but also from subcutaneous to intra-abdominal sites (9).Thus, a cell derived from one or even multiple sub-cutaneous sites may yield an erroneous estimate of totaladipose cell number. Furthermore, differences in cellnumber between nonobese and obese individuals based onthese estimated may be misleading.
The present study was undertaken to more fullydefine the cellular character of the adipose depots ofnonobese and obese individuals. Adipose cell size hasbeen determined in several deep, as well as subcutaneousfat depots and a comparison of these sizes made. Severalmethods for estimating total cell number on the basisof these subcutaneous and deep cell sizes have beenevaluated. Finally, the relationships among variousparameters of body size and composition, age, and adi-pose tissue cellularity have been examined.
METHODS78 obese and 21 nonobese patients were studied. Individualswere classified as obese or nonobese on the basis of standardheight, weight tables: obese patients ranged from 15% togreater than 100% overweight; nonobese patients were nevermore than 5% above their ideal body weight. 10 of thenonobese and 52 of the obese were female. Details of theanthropometric traits, body composition, and general char-acteristics of each of the two groups are shown in Table I.Individuals with recent weight loss or a history of nutri-tional or endocrine dysfunction, and nonobese patients witha past or family history of obesity were excluded from thisstudy. A careful history was obtained from each patientin order to establish the age of onset of obesity; wherepossible, photographic and medical record documentation wasobtained. Patients were hospitalized at the Mary HitchcockMemorial Hospital and all studies were performed duringperiods of relatively constant body weight. Most of the obesepatients underwent jejuno-ileal bypass operations after com-pletion of this study. The nonobese patients were individualsundergoing other. intra-abdominal surgical procedures.
Fragments of adipose tissue were obtained from threesubcutaneous sites (upper outer gluteal quadrant, abdominalwall just lateral to the umbilicus, and midarm triceps re-gion) by the method of needle aspiration (10). Tissue fromthree deep sites (preperitoneal just lateral to the umbilicus,mesenteric at the ligament of Treitz, and midline omentum)
were obtained at the time of surgery. Tissues were kept inKrebs-Ringer bicarbonate buffer, pH 7.4 at 37°C until proc-essing. Lipid per cell (adipose cell size) at each site wasmeasured in duplicate by the method described by Hirschand Gallian (1). The total number of adipose cells in thebody was estimated by dividing total body fat, calculatedfrom measurements of body water and lean body mass (7,11), by various combinations of the adipose cell sizes at thesix different tissue sites.
Statistical analyses of the experimental results were per-formed as described by Sokal and Rohlf (12), on the Dart-mouth College GE 635 Time-Sharing Computer System. Anested analysis of variance was employed to define thevariability of cell size and cell number within and betweenpatients and sites. In order to evaluate the various alterna-tives for calculating the average adipose cell size and esti-mating the total cell number, a simple linear regressionanalysis, stepwice multiple linear regression analysis, and acomplete second order polynomial regression analysis wereemployed. The degree of association between the cellularcharacter of the adipose tissue and the general patient char-acteristics was examined by correlation analysis and calcu-lation of the coefficient of determination. Significance testingwas performed by analysis of variance and significant valuesreported at P < 0.05.
RESULTSBody size, body composition, and general character-
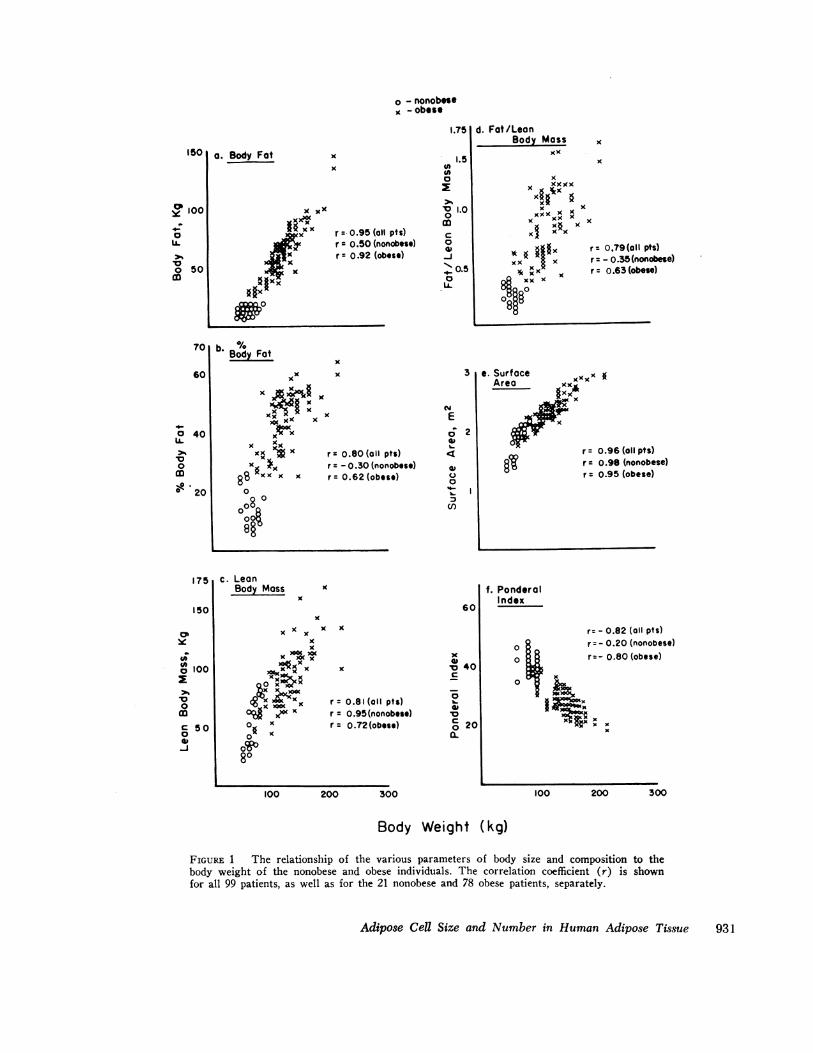
istics of obese and nonobese patient groups. The obesepatients weigh more and have a significantly greaterbody fat, percent body fat, lean body mass, body fat/lean body mass, surface area, and ponderal index(height/\/3 weight) than the nonobese patients (TableI). The nonobese females have increased percent bodyfat and fat: lean ratio compared with the men butthese sex differences are not present in the obese. Fig.1 shows the relationship between each of these indicesand body weight. When all of the patients are consideredtogether, each of the anthropometric and body composi-tion parameters correlates highly with body weight, butthese relationships may differ within the nonobese andobese subgroups.
The mean age of onset of obesity for the 78 patientsis just under 10 (±1SEM) yr of age, the individualages ranging from birth to 45 yr. Age of onset corre-
TABLE IGeneral Characteristics of Nonobese and Obese Patient Groups
Patient Surface Body Percent Body fat/ Ponderalgroup Age Weight* Height area* fat* body fat* LBM* LBM* index*
Values, representing the mean ±SEM for (n) patients, were calculated as follows: surface area = (weight0425 X height0-715)X 71.84, lean body mass (LBM) = total body water/0.73, body fat = weight - LBM, percent body fat = body fat/weight,and ponderal index = height/!4weight. Significance of differences between obese and nonobese groups was tested by analysisof variance; differences significant at the P < 0.05 are indicated by an asterisk.
930 L. B. Salans, S. W. Cushman, and R. E. Weissmann
o - nonobeseK - obese
'.75
r 00.95 (all pts)r = 0.50 (nonobese)r = 0.92 (obese)
b. %o/Body Fat
x
xx x
xl xxxAx^- x
xxx XxKXX*x r- 0.80 (all pts)
x x r = - 0.30 (nonobese)K8xx x x r- 0.62(obese)0
0o
000
i.5000
0 1.00co
C)0IV-J*s 0.50
LA.
CYE
o2
0
IU
cn
d. Fat/LeonBody Mass
XX
xxxxx
x
x xx x x
x§ xxi x x
* 0 $X§§x sr 0.79(oll pts)KX I r = - 0.35(nonobese)* xx x r - 0.63 (obese)
FIGURE 1 The relationship of the various parameters of body size and composition to thebody weight of the nonobese and obese individuals. The correlation coefficient (r) is shownfor all 99 patients, as well as for the 21 nonobese and 78 obese patients, separately.
Adipose Cell Size and Number in Human Adipose Tissue 931
1501a. Body Fat x
x
0
y 100;
0
10o 50
CD
70
60
o 40UA.
0co0 20
175
lSO10'
cx
0o 100
*00coC 500
-J
r = v.:.
lates negatively with body weight (r = - 0.80) indi-cating that, in general, the earlier that obesity begins,the more severe the obesity.
Adipose cell size in obese and nontobese patient groups.Adipose cell size was determined at six individual sub-cutaneous and deep sites and the mean calculated forthe three subcutaneous, the three deep and all of thesix sites. Cell size was highly variable in these 99patients.
The sources of variance of adipose cell size wereexamined by means of a nested analysis of variance.70% of the total variance is accounted for by the differ-ences between obese and nonobese patients, obese pa-tients having larger cells. Fig. 2a illustrates the bimodaldistribution of the mean of the cell sizes at all six sitesamong the 99 patients. A similar pattern was observedfor each of the individual cell sizes and the mean of thethree subcutaneous and three deep sizes. Fig. 2b, inwhich the percent frequency distribution of cell sizewithin the nonobese or obese patient groups has beencalculated, demonstrates that this bimodal distribution
CELL SIZEa
cC)a0L)
L-0)-
b
Mean ofAll 6 Sites
xxxxxx x
x xx XXXXXXXxx xxxxxxxxxxxxx xxxxxxxxxxxxxx xxxxxxxxxxx xXXY XXXXXX VXX
xxxxxxxxxxxxxxxxxxxxx x
is entirely attributable to the differences in cell size be-tween the nonobese and obese patients. Table II sum-marizes the mean cell size of the individual sites andthe means of the three subcutaneous, the three deep, andall six sites. The adipose cells of the obese patient groupare significantly larger than those of the nonobese groupfor each of the nine determinations.
18% of the total variance of adipose cell size in the99 patients is due to differences among the six sitessampled within each patient. The site to site variabilityof cell size was similar in the obese and nonobese pa-tients (expected means squares = 0.0052 vs. 0.0054).The extent to which cell size may vary between fatdepots within an individual is, in large part, maskedwhen the mean cell sizes of the group are considered(Table II), and can only be appreciated by examiningthe cell sizes from different sites in individual patientsas shown in Table III. The 12 patients, for whom theindividual cell sizes have been listed, are representativeof the wide range of body weights and cell sizes of thosewho comprise the nonobese and obese groups. Cell
CELL NUMBERC
Mean ofAll 6 Sites
x xx xx
xx xxxx xxxxxxxx xxxx xx
xxxxx xxxx xx xxxxxxx xxxxxxx xxxxxxx xxxxxxxxxxx xX XX
xxxxxxxxxxxxxxxxxxxxxxx xxx xx
d0c0)030) 50
U-0)
a..- %..
o tXo 0 w (Na (9 . NDAM0D6 6 - - I
I N cN cN0 2 0 - X a
6 6O - z0 0
FIGURE 2 Distribution of adipose cell size and total cell number. Adipose cell size is expressedas the mean of the six individual cell sizes and total cell number is estimated by division oftotal body fat by this mean cell size. a,c): Frequency distribution of adipose cell size andnumber over the 99 patients (X). b,d): Percent frequency distribution of adipose cell size andnumber in the nonobese ( ) and 78 obese (--- ) patients.
932 L. B. Salans, S. W. Cushman, and R. E. Weissmann
.1 ---z I-
TABLE 1 IAlean Values for Adipose Cell Size
Subcutaneous Deep MeanPatientgroup Gluteal Abdomen Triceps Preperitoneal Mesentery Omentum Subcutaneous Deep All
Values represent the mean 5sEM for (n) patients in each group. Significance of differences between obese and nonobesegroups was tested by analysis of variance; all differences were significant at the P < 0.05.
size within a single patient may differ by more than100% (T. B., M. R.), or only slightly (R. G., R. B.).The three subcutaneous cell sizes may be quite similarin a single patient while the three deep sizes differ notonly from the subcutaneous sizes but from each other(E. J., E. D.); the reverse is also observed (H. J.,N. Y.). Furthermore, although Table II indicates thatthe site to site order of cell size within each patientgroup is gluteal > preperitoneal > abdomen > mesentery> triceps > omentum, Table III demonstrates that thesite to site order of cell size may differ considerablywithin the individual patients in each group. Less than1% of the total variance of cell size represents theinteraction between sites and patients. Neither the siteto site order of cell size nor the magnitude of site tosite variability appears, therefore, to be a function ofthe degree of adiposity.
The variability between duplicate determinations ofcell size from a given site in an individual patient wasquite small and within the previously defined precisionof the method (1, 5).
The variability of cell size among the female andmale patients is similar within each group, and thesources of variance are similar to those described above.
Adipose cell number in obese and nonobese patientgroups. Adipose cell number is estimated by dividingtotal body fat by adipose cell size. The variability oftotal cell number, although quantitatively greater, is,therefore, qualitatively similar to that observed for adi-pose cell size. The largest source of variance in cellnumber is due to the difference between the obese andnonobese groups. As with cell size, this source of vari-ance was considerably greater than that due to patientto patient and site to site variability within each group.
An attempt was then made to examine the extent towhich the variability in the size of adipose cells ob-tained from different fat depots influences the estimationof total cell number and the comparison of obese andnonobese patients. Seven methods for estimating cellnumber from body fat and adipose cell size have beentested.
TABLE I I IAdipose Cell Size in Selected Nonobese and Obese Patients
Subcutaneous Deep MeanBody
Patient weight Gluteal Abdominal Triceps Preperitoneal Mesentery Omental Subcutaneous Deep All
Adipose Cell Size and Ntumber in Human Adipose Tissue 933
Method I estimates total cell number from total bodyfat and the size of adipose cells at the six individualsites. The cell size at each site is assumed to representthe "average" cell size of a given patient. Methods 11,III, and IV estimate total cell number from total bodyfat and the mean size of the three subcutaneous, threedeep and all six sites, respectively.
In Methods V, VI, and VII, total cell number is esti-mated from various assumed distributions of total bodyfat between the subcutaneous and deep depots. The fol-lowing five distributions of body fat have been assumed:(a) all of the body fat is in the subcutaneous depotand cell number is estimated from subcutaneous cell sizeonly; (b) all of the fat is in the deep depots and cellnumber is estimated from deep cell size only; (c) 60%of the fat is in the subcutaneous, 40% in the deep depotand cell number is estimated from subcutaneous anddeep cell size; (d) 40% of the fat is in the subcutaneousand 60% in the deep depots, and cell number is esti-mated from subcutaneous and deep cell size; (e) totalbody fat is distributed evenly between subcutaneous anddeep depots and cell number is estimated using bothsubcutaneous and deep cell size. In Method V the meansubcutaneous and the mean deep cell sizes are assumedto represent the "average" cell size of their respectivedepots. In Method VI the largest of the three subcu-taneous and three deep cell sizes are assumed to be themost representative cells of each depot; and in MethodVII, the smallest.
The total number of adipose cells per individualvaries considerably and significantly depending upon themethod used: in general, cell number is greatest withomental cell size (range over 21 nonobese patients, 23-65 X 10'; over 78 obese patients, 37-237 X 10') andsmallest with gluteal (range over 21 nonobese patients,20-41 X 10'; over 78 obese patients, 28-128 X 10').Nevertheless, mean adipose cell number for the obesegroup is always significantly greater than that for thenonobese, irrespective of the cell size used and of theassumed distribution of total body fat (nonobese, 28-49 x 10'; obese 65-88 X 10'). Individual nonobese andobese patients do, however, overlap considerably in cellnumber; the overlap is greatest with omental cell sizeand least with the mean size of all six sites.
Factors responsible for the difference in total cellnumber between obese and nonobese patient groups.Fig. 2c illustrates the frequency distribution over allpatients of total cell number calculated from total bodyfat and the mean of cell sizes determined at all six sites.A bimodal distribution of cell number is observed, butin contrast to cell size, the two populations are notsimply a reflection of the obese and nonobese patientgroups (Fig. 2d); the population with the lower cellnumber contains not only the 21 nonobese, but in addi-
tion, 17 of the obese patients. All 61 of the individualswithin the population of higher cell number are obese.An evaluation of the factors which might be responsiblefor the two patterns of cellularity in the obese patientshas been undertaken.
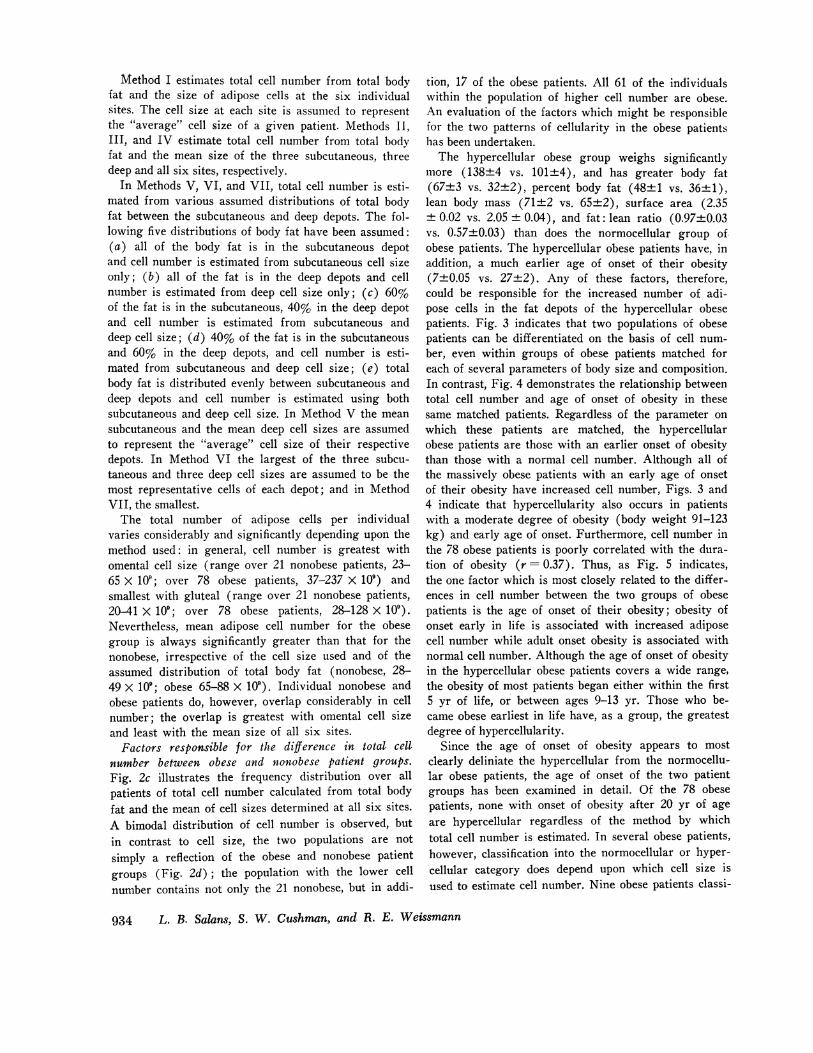
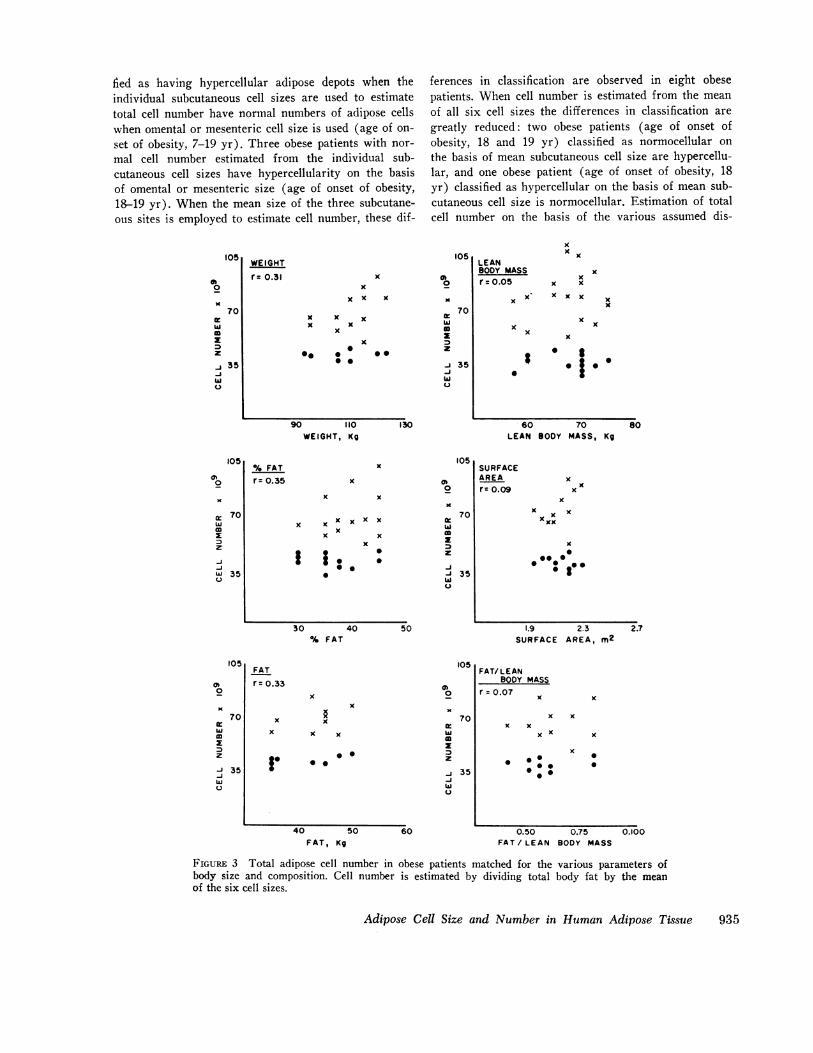
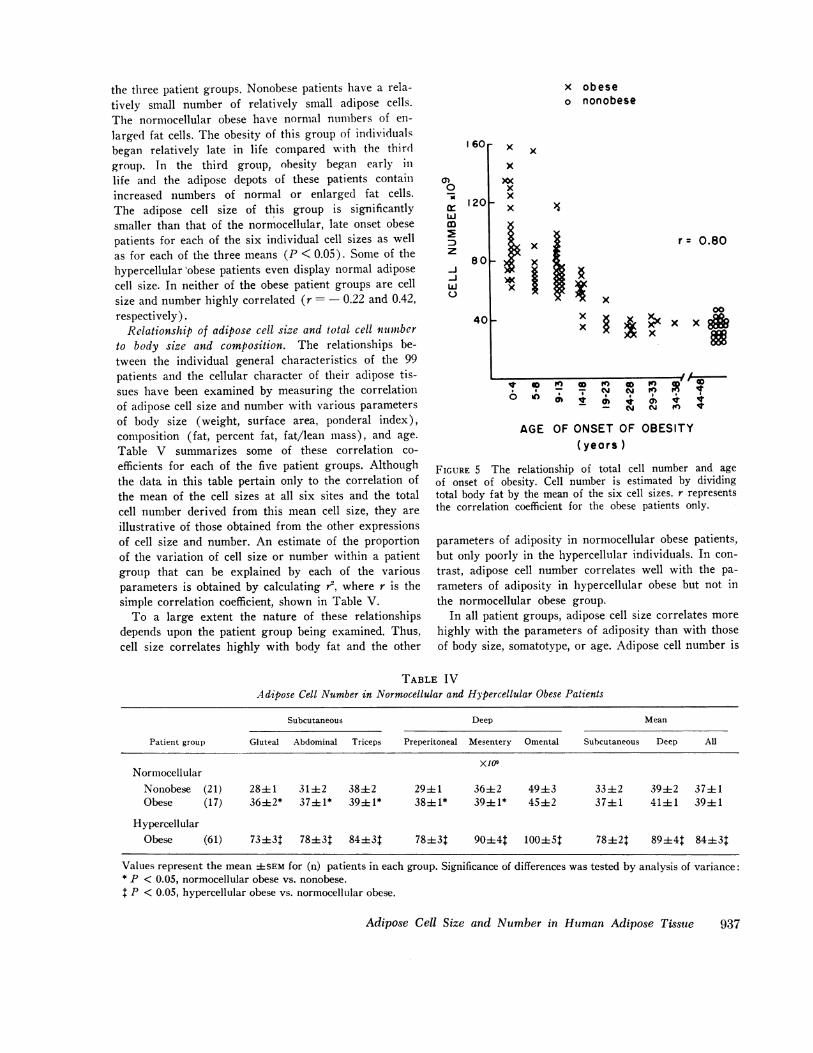
The hypercellular obese group weighs significantlymore (138±4 vs. 101±4), and has greater body fat(67±3 vs. 32±2), percent body fat (48±1 vs. 36±1),lean body mass (71±2 vs. 65±2), surface area (2.35+ 0.02 vs. 2.05 ± 0.04), and fat: lean ratio (0.97±0.03vs. 0.57±0.03) than does the normocellular group ofobese patients. The hypercellular obese patients have, inaddition, a much earlier age of onset of their obesity(7±0.05 vs. 27±2). Any of these factors, therefore,could be responsible for the increased number of adi-pose cells in the fat depots of the hypercellular obesepatients. Fig. 3 indicates that two populations of obesepatients can be differentiated on the basis of cell num-ber, even within groups of obese patients matched foreach of several parameters of body size and composition.In contrast, Fig. 4 demonstrates the relationship betweentotal cell number and age of onset of obesity in thesesame matched patients. Regardless of the parameter onwhich these patients are matched, the hypercellularobese patients are those with an earlier onset of obesitythan those with a normal cell number. Although all ofthe massively obese patients with an early age of onsetof their obesity have increased cell number, Figs. 3 and4 indicate that hypercellularity also occurs in patientswith a moderate degree of obesity (body weight 91-123kg) and early age of onset. Furthermore, cell number inthe 78 obese patients is poorly correlated with the dura-tion of obesity (r = 0.37). Thus, as Fig. 5 indicates,the one factor which is most closely related to the differ-ences in cell number between the two groups of obesepatients is the age of onset of their obesity; obesity ofonset early in life is associated with increased adiposecell number while adult onset obesity is associated withnormal cell number. Although the age of onset of obesityin the hypercellular obese patients covers a wide range,the obesity of most patients began either within the first5 yr of life, or between ages 9-13 yr. Those who be-came obese earliest in life have, as a group, the greatestdegree of hypercellularity.
Since the age of onset of obesity appears to mostclearly deliniate the hypercellular from the normocellu-lar obese patients, the age of onset of the two patientgroups has been examined in detail. Of the 78 obesepatients, none with onset of obesity after 20 yr of ageare hypercellular regardless of the method by whichtotal cell number is estimated. In several obese patients,however, classification into the normocellular or hyper-cellular category does depend upon which cell size isused to estimate cell number. Nine obese patients classi-
934 L. B. Salans, S. W. Cushman, and R. E. Weissmann
fied as having hypercellular adipose depots when theindividual subcutaneous cell sizes are used to estimatetotal cell number have normal numbers of adipose cellswhen omental or mesenteric cell size is used (age of on-set of obesity, 7-19 yr). Three obese patients with nor-mal cell number estimated from the individual sub-cutaneous cell sizes have hypercellularity on the basisof omental or mesenteric size (age of onset of obesity,18-19 yr). When the mean size of the three subcutane-ous sites is employed to estimate cell number, these dif-
105
00
70
z0z
-J 35-jwU
WEIGHT
r= 0.31x
x x x
x x xx x
x
x
0 0
90 110WEIGHT, Kg
ferences in classification are observed in eight obesepatients. When cell number is estimated from the meanof all six cell sizes the differences in classification aregreatly reduced: two obese patients (age of onset ofobesity, 18 and 19 yr) classified as normocellular onthe basis of mean subcutaneous cell size are hypercellu-lar, and one obese patient (age of onset of obesity, 18yr) classified as hypercellular on the basis of mean sub-cutaneous cell size is normocellular. Estimation of totalcell number on the basis of the various assumed dis-
105
0)
Ixc 70
D0zM
-J 35w
u
130
xx
LEANBODY MASSr =.o5
x x
x
0
60LEAN
x
xx x
x x x
x
x
xx
x
x
0.1.. * |
70BODY MASS, Kg
80
105x
x x
x x x x x xx
x xxg ; . :0
0
a,0x
70w0z
z
-1-J 35wU
30 40 50% FAT
SURFACEAREAr= 0.09
K
x xxx
x
x0
*0 00 00 *
.38
1.9 2.3SURFACE AREA, m2
FATr= 0.33
x
x x
x x x
I .
x
10s
00
70
I:
z
-J 35
wu
. 0
40 50 60FAT, Kg
FAT/ LEANBODY MASS
r= 0.07x
xx x
xx
00
.0
x
00
0.50 0.75FAT/ LEAN BODY MASS
FIGURE 3 Total adipose cell number in obese patients matched for the various parameters ofbody size and composition. Cell number is estimated by dividing total body fat by the mean
of the six cell sizes.
Adipose Cell Size and Number in Human Adipose Tissue 935
%FATr= 0.35
105
a,m
,0a 70wImIDz
-3-jw 35u
105
00
70
m
z
-J 35-jwu-
2.7
0.100
tributions of subcutaneous and deep body fat does notalter these observations. Thus, when cell number isestimated from the mean of all six cell sizes, 61 obesepatients exhibit adipose hypercellularity and 17, normalcell number compared with the 21 nonobese patients.
Table IV summarizes the cell number data of thesethree patient groups. In the early onset obese patientscell number is greater than that of either the nonobese
105
S
K 70
hIa
z35
-J-ihiU
xx x
xx
x
WEIGHTr = - o.83
x
xx
x
or the late onset obese groups. Cell number in the lateonset obese patient group is similar to that of the non-obese except when calculated from the gluteal, preperi-toneal, or the superficial abdominal cell sizes, in whichcases the differences are small.
Fig. 6 demonstrates that the relationship betweenmean cell number and mean cell size in the 99 patientsstudied falls into three patterns which correspond to
105
S0
K 70
hIw0z
0 mz35
-J-ihiU
xxXx
xxx
xx
LEAN BODY MASSr = - 0.79
x
x
x
0 :0
* 0* 000
0
105x °/ FAT
r :-o.789*0
70
x wx 0
Ig * 3
hi
105FATr = -0.81
x
0
0
0 I
0)0
go
mz
-i
0
70
35
In
ONSET OF OBEEYEARS
x
x
0
In 2 ln 0 in 2 of)
I I I I I I4 0 0 0
0@ =_ OF
AGE OF
x
x
SURFACE AREA
r= -0.83xx
x
x
0
FAT/LEAN
x r= - 0.73K
x x
oxxx xX x S
.I~~~~~~~~~~~~~v
An0In 0
oD 2 e 0CY to to£
' ID=I00:I 0 -0& - 0to
S I T Y
FIGURE 4 The relationship of total cell number and the age of onset of obesity in the obesepatients matched for the various parameters of body size and composition. Cell number isestimated by dividing total body fat by the mean of the six cell sizes.
936 L. B. Salans, S. W. Cushman, and R. E. Weissmann
x
xx
x
xxx
x
x
x gxx
105
Cb0
-70
m= 35z-J-Jw
105
Gb0
K 70
hiID
z3SN-Ihiu I
x0
0 00 : 's
the three patient groups. Nonobese patients have a rela-tively small number of relatively small adipose cells.The normocellular obese have normal numbers of en-larged fat cells. The obesity of this group of individualsbegan relatively late in life compared with the thirdgroup. In the third group, obesity began early inlife and the adipose depots of these patients containincreased numbers of normal or enlarged fat cells.The adipose cell size of this group is significantlysmaller than that of the normocellular, late onset obesepatients for each of the six individual cell sizes as wellas for each of the three means (P < 0.05). Some of thehypercellular obese patients even display normal adiposecell size. In neither of the obese patient groups are cellsize and number highly correlated (r=- 0.22 and 0.42,respectively).
Relationship of adipose cell size and total cell numberto body size and composition. The relationships be-tween the individual general characteristics of the 99patients and the cellular character of their adipose tis-sues have been examined by measuring the correlationof adipose cell size and number with various parametersof body size (weight, surface area, ponderal index),composition (fat, percent fat, fat/lean mass), and age.Table V summarizes some of these correlation co-efficients for each of the five patient groups. Althoughthe data in this table pertain only to the correlation ofthe mean of the cell sizes at all six sites and the totalcell number derived from this mean cell size, they areillustrative of those obtained from the other expressionsof cell size and number. An estimate of the proportionof the variation of cell size or number within a patientgroup that can be explained by each of the variousparameters is obtained by calculating r2, where r is thesimple correlation coefficient, shown in Table V.
To a large extent the nature of these relationshipsdepends upon the patient group being examined. Thus,cell size correlates highly with body fat and the other
x obeseo nonobese
60r
a)0
m
z
-j-J
0
120p
80p
x x
x
x
xx .
xx
r= 0.80
x
~jx xm40p
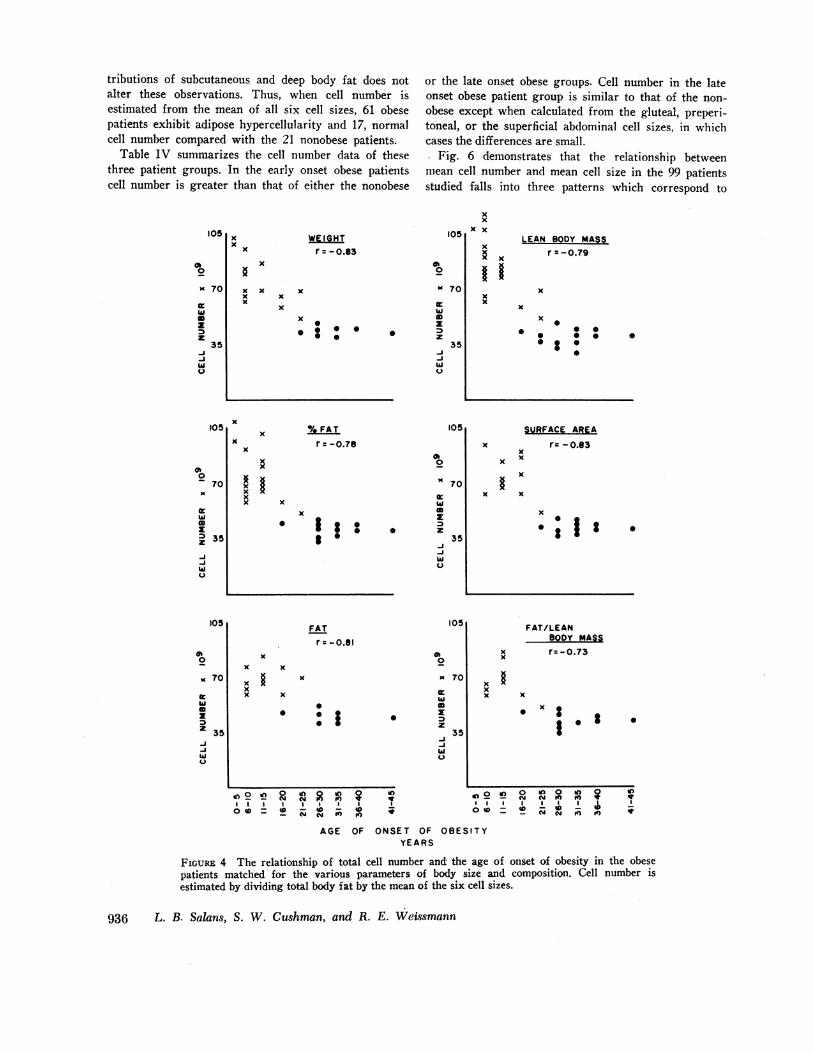
AGE OF ONSETOF OBESITY(years )
FIGURE 5 The relationship of total cell number and ageof onset of obesity. Cell number is estimated by dividingtotal body fat by the mean of the six cell sizes. r representsthe correlation coefficient for the obese patients only.
parameters of adiposity in normocellular obese patients,but only poorly in the hypercellular individuals. In con-trast, adipose cell number correlates well with the pa-rameters of adiposity in hypercellular obese but not inthe normocellular obese group.
In all patient groups, adipose cell size correlates morehighly with the parameters of adiposity than with thoseof body size, somatotype, or age. Adipose cell number is
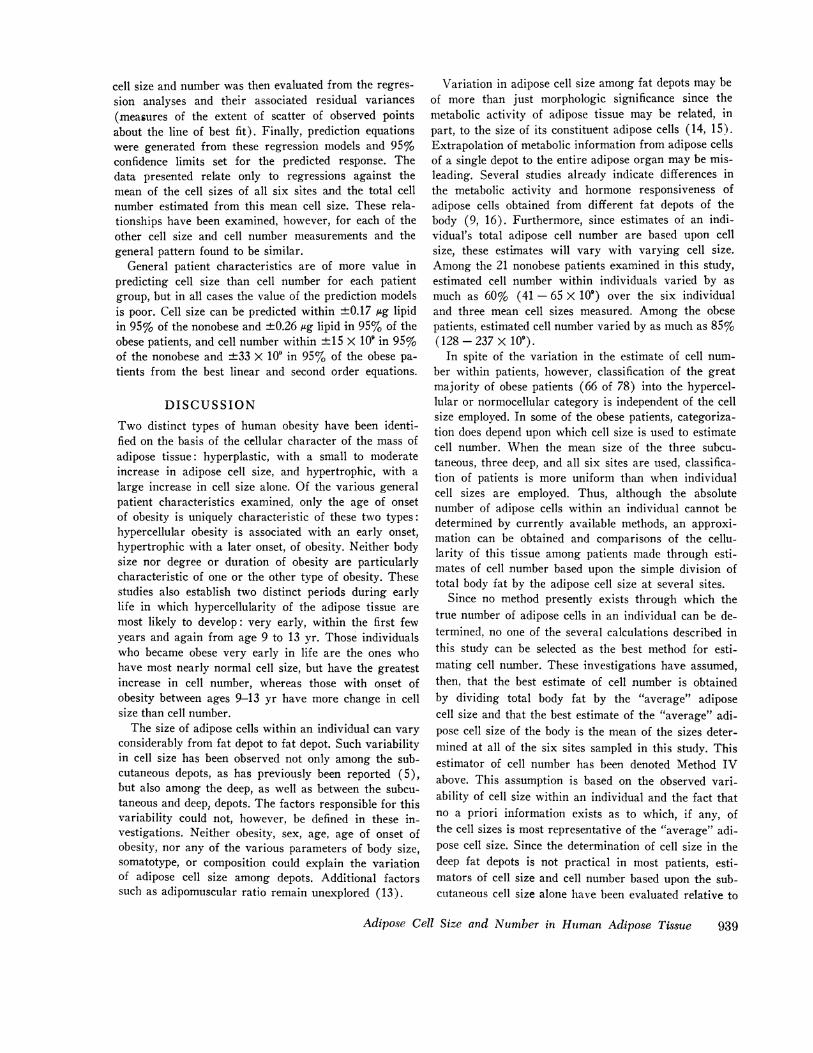
TABLE IVAdipose Cell Number in Normocellular and Hypercellular Obese Patients
Subcutaneous Deep Mean
Patient group Gluteal Abdominal Triceps Preperitoneal Mesentery Omental Subcutaneous Deep All
Values represent the mean ±SEM for (n) patients in each group. Significance of differences was tested by analysis of variance:* P < 0.05, normocellular obese vs. nonobese.t P < 0.05, hypercellular obese vs. normocellular obese.
Adipose Cell Size and Number in Human Adipose Tissue
V 0 M X M 0 K X C
6 7 7 N N a tI_ _ N N to It
937
o -nonobese* - normocellular obesex - hypercellular obese
150
0nE
Z 100= M
4)0u Ox
In0
50Vl 5
xx
xx x
xx x
X * x §x
0
0.5 1.0 1.5
Adipose Cell Size.ig lipid/cell
FIGURE 6 The relationship of adipose cell size and totaladipose cell number. Adipose cell size is expressed as themean of the six individual cell sizes and cell number esti-mated by division of total body fat by this mean cell size.
also most highly correlated with the parameters of adi-posity in those groups which contain all of the patients,all of the obese patients, or only the hypercellular obesepatients. In the remaining two groups of patients, cellnumber correlates best with the ponderal index but therelationship is poor (r = < 0.30). Cell number is more
highly correlated with the various parameters of adi-
posity than is cell size in all but the nonobese andnormocellular obese groups, in which the associationof this cellular character and all parameters of body sizeand composition is poor (r = < 0.30). Both cell sizeand number correlate more highly with body fat thanwith percent body fat or the fat: lean ratio.
An estimate of the proportion of the variation of cellsize or number within each patient group that can beexplained by combinations of parameters of body size(weight, surface area, and height) or adiposity (fat,percent fat, and fat: lean ratio) is obtained by calcu-lating r', where r is the multiple correlation coefficient(12). Such combinations of parameters increase theproportion of explained variance only very slightly overthat explained by the most highly correlated individualparameter and do so without substantially altering therelationships described above. In all of the patientgroups, the combination of body fat, percent fat, and fat:lean ratio accounts for more of the variation in cellnumber and cell size than do the combined parametersof body size. Within the nonobese group, the ponderalindex accounts for more of the variation in cell number(9%) than do combinations of either body size oradiposity parameters.
Predicting cell size and cell number from parametersof body size, body composition, and age. The ability topredict cell size and cell number in an individual pa-tient from the various anthropometric, body compositionand age parameters has been tested. For this purpose thegeneral characteristics of the 99 patients were first re-gressed, alone and in combination, against their adiposecell size and number. Both linear and curvilinear (com-plete second order polynomial regression) relationshipswere examined by means of a multiple regression analy-sis. The value of each of the parameters for predicting
TABLE V
Correlations of Adipose Cell Size and Adipose Cell Numberwith Body Weight and Adiposity
Patient group Body weight Body fat Body fat Body fat/LBM
938 L. B. Salans, S. W. Cushman, and R. E. Weissmann
cell size and number was then evaluated from the regres-sion analyses and their associated residual variances(measures of the extent of scatter of observed pointsabout the line of best fit). Finally, prediction equationswere generated from these regression models and 95%confidence limits set for the predicted response. Thedata presented relate only to regressions against themean of the cell sizes of all six sites and the total cellnumber estimated from this mean cell size. These rela-tionships have been examined, however, for each of theother cell size and cell number measurements and thegeneral pattern found to be similar.
General patient characteristics are of more value inpredicting cell size than cell number for each patientgroup, but in all cases the value of the prediction modelsis poor. Cell size can be predicted within ±0.17 Ag lipidin 95% of the nonobese and ±0.26 Ag lipid in 95% of theobese patients, and cell number within ±15 X 10W in 95%of the nonobese and +33 X 109 in 95%/ of the obese pa-tients from the best linear and second order equations.
DISCUSSION
Two distinct types of human obesity have been identi-fied on the basis of the cellular character of the mass ofadipose tissue: hyperplastic, with a small to moderateincrease in adipose cell size, and hypertrophic, with alarge increase in cell size alone. Of the various generalpatient characteristics examined, only the age of onsetof obesity is uniquely characteristic of these two types:hypercellular obesity is associated with an early onset,hypertrophic with a later onset, of obesity. Neither bodysize nor degree or duration of obesity are particularlycharacteristic of one or the other type of obesity. Thesestudies also establish two distinct periods during earlylife in which hypercellularity of the adipose tissue aremost likely to develop: very early, within the first fewyears and again from age 9 to 13 yr. Those individualswho became obese very early in life are the ones whohave most nearly normal cell size, but have the greatestincrease in cell number, whereas those with onset ofobesity between ages 9-13 yr have more change in cellsize than cell number.
The size of adipose cells within an individual can varyconsiderably from fat depot to fat depot. Such variabilityin cell size has been observed not only among the sub-cutaneous depots, as has previously been reported (5),but also among the deep, as well as between the subcu-taneous and deep, depots. The factors responsible for thisvariability could not, however, be defined in these in-vestigations. Neither obesity, sex, age, age of onset ofobesity, nor any of the various parameters of body size,somatotype, or composition could explain the variationof adipose cell size among depots. Additional factorssuch as adipomuscular ratio remain unexplored (13).
Variation in adipose cell size among fat depots may beof more than just morphologic significance since themetabolic activity of adipose tissue may be related, inpart, to the size of its constituent adipose cells (14, 15).Extrapolation of metabolic information from adipose cellsof a single depot to the entire adipose organ may be mis-leading. Several studies already indicate differences inthe metabolic activity and hormone responsiveness ofadipose cells obtained from different fat depots of thebody (9, 16). Furthermore, since estimates of an indi-vidual's total adipose cell number are based upon cellsize, these estimates will vary with varying cell size.Among the 21 nonobese patients examined in this study,estimated cell number within individuals varied by asmuch as 60% (41 - 65 X 10') over the six individualand three mean cell sizes measured. Among the obesepatients, estimated cell number varied by as much as 85%(128-237 x 109).
In spite of the variation in the estimate of cell num-ber within patients, however, classification of the greatmajority of obese patients (66 of 78) into the hypercel-lular or normocellular category is independent of the cellsize employed. In some of the obese patients, categoriza-tion does depend upon which cell size is used to estimatecell number. When the mean size of the three subcu-taneous, three deep, and all six sites are used, classifica-tion of patients is more uniform than when individualcell sizes are employed. Thus, although the absolutenumber of adipose cells within an individual cannot bedetermined by currently available methods, an approxi-mation can be obtained and comparisons of the cellu-larity of this tissue among patients made through esti-mates of cell number based upon the simple division oftotal body fat by the adipose cell size at several sites.
Since no method presently exists through which thetrue number of adipose cells in an individual can be de-termined, no one of the several calculations described inthis study can be selected as the best method for esti-mating cell number. These investigations have assumed,then, that the best estimate of cell number is obtainedby dividing total body fat by the "average" adiposecell size and that the best estimate of the "average" adi-pose cell size of the body is the mean of the sizes deter-mined at all of the six sites sampled in this study. Thisestimator of cell number has been denoted Method IVabove. This assumption is based on the observed vari-ability of cell size within an individual and the fact thatno a priori information exists as to which, if any, ofthe cell sizes is most representative of the "average" adi-pose cell size. Since the determination of cell size in thedeep fat depots is not practical in most patients, esti-mators of cell size and cell number based upon the sub-cutaneous cell size alone have been evaluated relative to
Adipose Cell Size and Number in Human Adipose Tissue 939
those based upon the mean of the cell sizes at all sixsites.
The mean of the cell sizes at all three of the subcu-taneous sites correlates more highly with the mean cellsize of the six sites than does the size at any individualsubcutaneous site, in both nonobese (r = 0.97) and obese(r = 0.93) patient groups. The variation of the meansubcutaneous size from the mean of all six sizes is±0.05 lug lipid/cell in 95% of the nonobese patients and+0.12 Ag lipid/cell in 95% of the obese patients. Simi-larly, cell size estimated from the mean subcutaneoussize correlates more highly with that estimated from themean of all six sizes in both the nonobese (r = 0.83, er-ror= ±5 X 10⁹ in 95% of the patients) and obese (r=0.97, error 12 X 109) patients, than does cell numberestimated from the individual subcutaneous sizes. Tricepscell size in the nonobese and superficial abdominal cellsize in the obese yield the best estimates of total cellnumber of the individual subcutaneous sizes (r= 0.93,error = +8 X 10 r = 0.90, error = ±18 X 109, in 95%of the patients, respectively). Classification of individualsas normo- or hypercellular is more difficult, however, asdiscussed above, when total cell number is estimatedfrom individual cells sizes than from mean cell size.Thus, until a direct measure of total cell number becomesavailable, or until the contribution of each fat depot tototal body fat is known, division of total body fat bythe mean of the cell sizes of at least the three subcutane-ous depots examined in this study appears to providethe best estimate of total adipose cell number.
The inability to differentiate cell lipid from structuralfat and the insensitivity to extremely small cells whichcontain less than 0.01 Ag lipid/cell, remain limitations ofthe osmic acid method by which adipose cells in thisstudy have been counted and sized. The former wouldlead to an underestimation, and the latter, an overesti-mation of adipose cell number. The recent observationsof Sjostrom, Bjorntorp, and Vrana (3), however, sug-gest that the error of the latter type is likely to be quitesmall. Other limitations of potential significance in thecalculation of total cell number by this method relateto the error in the measurement of total body fat frombody water. Although not specifically examined in thisstudy, others have found that the technique of isotopedilution provides an estimate of total body fat in non-obese and obese patients that is similar to that obtainedby other methods, is reproducible, and is associated witha relatively small measurement error (2, 7, 17).
In the present study adipose cell size and total cellnumber were found to be more highly correlated withbody fat than any parameter of adiposity including per-cent body fat and the fat: lean ratio. These observationsconflict with a recent preliminary report which sug-gests that adipose cell size correlates more highly with
percent body fat than with total fat mass and that adiposecell hypertrophy is the major characteristic of the ex-panded adipose depot in obesity (18). The present studyclearly demonstrates two different mechanisms for theexpansion of the adipose depot in obese patients. Thedifference between these conflicting studies may lie, inpart, in the type of obese patients included in the latter,since the present study indicates that the relationshipsbetween these general patient characteristics and thecellular character of the adipose tissue depends upon thegroup of patients being examined.
The present study also suggests that the different cel-lular patterns of the expanded adipose tissue mass ofobese patients is not a simple function of the degree ofobesity (8); several of the moderately obese patients ex-hibit a hypercellular tissue mass. All of the grossly obesepatients, however, are hypercellular. These studies havenot included massively obese individuals who becameobese as adults, the greatest weight in the normocellularobese being 123 kg. It remains possible that more se-verely obese individuals, with onset of obesity in adultlife, might show mild degrees of hypercellularity.
The one factor most closely associated with, and perhapswhich best accounts for, the two different mechanisms bywhich expansion of the adipose tissue mass occurs inobesity is the time of life at which obesity begins; theearlier the onset the more likely that cell number willbe increased. These studies do not indicate, however,that this phenomenon is related to the duration of theobesity. These observations support those previously re-ported by Hirsch and Knittle (4) and Brook, Lloyd, andWolf (19). The age of onset of obesity could not bedocumented with assurance in most patients; too oftenthis depended upon the reliability of historical informa-tion. Thus, the age at which adipose cell number canno longer be influenced could not be established withcertainty. Although the latest age of onset of obesity forwhich hypercellularity has been observed in this studywas 19 yr, small increases in cell number (estimatedfrom subcutaneous cell size alone) in patients with on-set of obesity later in life have ben reported by Brayand Gallagher (20) and Hirsch and Knittle (4). Thisinability to reliably document the age of onset of obesityalso limits the interpretation of the observation that ageof onset of obesity in the hypercellular patients is mostprevalent within the first 5 yr of life and then again fromages 9-13 yr. This finding is, however, compatible withthe observation of Tanner that the adipose tissue massgrows rapidly during the first 2 yr of life, then plateausuntil about age 7 yr when its rate of growth increasesonce again (21).
Finally, the value of general patient characteristicstowards a prediction of adipose cell size and number hasbeen examined through the construction of linear and
940 L. B. Salans, S. W. Cushman, and R. E. Weissmann
complete second order multiple regression models. Theerror of prediction from even the best of these models is,however, of such magnitude that the separation of non-obese and obese patients and the classification of obesepatients into normo- and hypercellular groups are un-reliable. The estimation of adipose cell size or numberwithout direct measurements is, therefore, not recom-mended at least until additional parameters are evaluatedand/or better models constructed.
ACKNOWLEDGMENTSThe authors gratefully acknowledge the excellent technicalassistance of Mary Jane Zarnowski and Ruth Segal andthe aid of Professor Harrison D. Weed, Department ofMathematics, Dartmouth College, in the statistical analysisof these data. We wish to express special gratitude to Dr.Jules Hirsch, The Rockefeller University, for his help andguidance in establishing the methods by which adipose cellswere sized and counted during this study.
This study was supported by grant no. AM 13321 fromthe National Institutes of Health, and a grant from theHitchcock Foundation.
REFERENCES1. Hirsch, J., and E. Gallian. 1968. Methods for the de-
termination of adipose cell size in man and animals.J. Lipid Res. 9:110.
2. Bray, G. A. 1970. Measurement of subcutaneous fat cellsfrom obese patients. Ann. Intern. Med. 73: 565.
3. Sjostrom, L., P. Bjorntorp, and J. Vrana. 1971. Micro-scopic fat cell size measurements on frozen-cut adiposetissue in comparison with automatic determinations ofosmium-fixed fat cells. J. Lipid Res. 12: 521.
4. Hirsch, J., and J. L. Knittle. 1970. Cellularity of obeseand nonobese human adipose tissue. Fed. Proc. 29: 1516.
5. Salans, L. B., E. S. Horton, and E. A. H. Sims. 1971.Experimental obesity in man: cellular character of theadipose tissue. J. Clin. Invest. 50: 1005.
6. Bjorntorp, P., B. Hood, A. Martinsson, and B. Persson.1966. The composition of human subcutaneous adiposetissue in obesity. Acta Med. Scand. 180: 117.
7. Bray, G. A., M. Schwartz, R. Rozin, and J. Lister. 1970.Relationships between oxygen consumption and bodycomposition of obese patients. Metab. (Clin. Exp.). 19:418.
8. Bjorntorp, P., and L. Sjorstrom. 1971. Number andsize of adipose tissue fat cells in relation to metabolismin human obesity. Metab. (Clin. Exp.). 20: 703.
9. Goldrick, R. B., and G. M. McLoughlin. 1970. Lipolysisand lipogenesis from glucose in human fat cells of dif-ferent sizes. Effects of insulin, epinephrine, and theophyl-line. J. Clin. Invest. 49: 1213.
10. Hirsch, J., J. W. Farquhar, E. H. Ahrens, Jr., M. L.Peterson, and W. Stoffel. 1960. Studies of adipose tissuein man: a microtechnique for sampling and analysisAm. J. Clin. Nztr. 8: 499.
11. Pace, N., and E. N. Rathbun. 1945. Studies on bodycomposition. III. The body water and chemically com-bined nitrogen content in relation to fat content. J. Biol.Chem. 158: 685.
12. Sokal, R. R., and F. J. Rohlf. 1969. Biometry. W. H.Freeman and Company Publishers, San Francisco. 1stedition.
13. Vague, J., J. Borger, J. Jubelin; C. Nicoline, and C.Pinto. 1968. Adipomuscular ratio in human subjects. InPhysiopathology of Adipose Tissue. J. Vague, editor.Excerpta Medica Foundation, Amsterdam. 360.
14. Salans, L. B., J. L. Knittle, and J. Hirsch. 1968. Therole of adipose cell size and adipose tissue sensitivityin the carbohydrate intolerance of human obesity. J. Cliti.Invest. 47: 153.
15. Knittle, J. L., and F. G. Ginsberg-Fellner. 1972. Effectof weight reduction on in vitro adipose tissue lipolysisand cellularity in obese adolescents and adults. Diabetes.21: 754.
16. Hamosh, M., P. Hamosh, J. A. Bar-Moar, and H.Cohen. 1963. Fatty-acid metabolism by human adiposetissues. J. Clin. Invest. 42: 1648.
17. Lesser, G. T., I. Kumar, and J. M. Steele. 1963. Changein body composition with age. Ann. N. Y. Acad. Sci.110: 578.
18. Stern, M., and G. Reaven. 1972. Role of fat cell hyper-trophy vs. adipose tissue hyperplasia in obesity. Clin.Res. 20: 558.
19. Brook, C. G. D., J. K. Lloyd, and 0. H. Wolf. 1972.Relationship between age of onset of obesity and sizeand number of adipose cells. Br. Med. J. 2: 25.
20. Bray, G. A., and T. F. Gallagher, Jr. 1970. Regulatoryobesity in man. Clin. Res. 18: 537.
21. Tanner, J. M. 1964. Relationships of different bodily tis-sues during growth and in the adult. In Diet and BodilyConstitution. G. E. W. Wolstenholme and M. O'Connor,editors. Little, Brown and Company, Boston, 19.
Adipose Cell Size and Number in Human Adipose Tissue 941