Studies of the plume emission during the femtosecond and nanosecondablation of graphite in nitrogen
Gareth M. Fuge and Michael N. R. Ashfolda�
School of Chemistry, University of Bristol, Bristol BS8 1TS, United Kingdom
Simon J. HenleyAdvanced Technology Institute, School of Electronics and Physical Sciences, University of Surrey, GuildfordGU2 7XH, United Kingdom
�Received 25 March 2005; accepted 18 November 2005; published online 12 January 2006�
Comparative studies of the pulsed laser ablation of graphite in 20 mTorr of N2 using both 15 ns and450 fs pulses at a wavelength of 248 nm are reported. Emissions from the resulting ablation plumes,and from collisions with ablated material and the background N2 gas molecules, have beeninvestigated by wavelength-, space-, and time-resolved optical emission spectroscopy �OES�, andthe observations correlated with the results of the analyses of films formed when such material isincident on a silicon substrate. Wavelength-dispersed spectra of the plume arising in nanosecondablation reveal C I, C II, and C2 emissions—concentrated close to the target—and, at greaterdistances, strong CN and weak N2
+ emissions. N2+�B–X� emission dominates in the case of
femtosecond ablation. Time-gated imaging studies have allowed estimation of propagationvelocities for these various emissions. Possible production routes for secondary emitters such as CNand N2
Nitrogen-containing, hydrogen-free, diamondlike carbon�DLC�—henceforth identified as CNx—films have been in-vestigated quite extensively over the past decade. Most suchfilms have been produced by deposition on a suitable sub-strate following nanosecond ultraviolet �UV� pulsed laser ab-lation �PLA� of a graphite target in a low-pressure back-ground of nitrogen gas.1–3 The resulting films have beensuggested to offer a number of benefits in comparison withpure carbon films, including increased resilience to mechani-cal wear4 and reduced surface roughness.5 Such CNx filmshave been subjected to many different analysis techniques inan attempt to understand the film characteristics and to cor-relate these with properties of the ablation plume from whichthe films are formed, e.g., the relative number densities andthe velocity �and energy� distributions of the various speciesin the plume.6,7 Femtosecond �as compared with nanosec-ond� PLA offers somewhat different deposition conditions—e.g., less material transfer per pulse and reduced laser-plumeinteractions, but the initial kinetic-energy distribution of theejected material is higher, as is its average degree ofionization.8 Material and structural properties of nitrogen-free DLC thin films deposited by femtosecond PLA of graph-ite in vacuum have been investigated9–13 and deduced tohave an sp3 content of �70% and to contain some nanocrys-
a�Author to whom correspondence should be addressed; fax: �117�-9250612;
Downloaded 25 Apr 2006 to 137.222.40.127. Redistribution subject to
talline diamond phase within an amorphous matrix.10 Thehigh sp3 content has been attributed to the increased kinetic,and thus impact, energy of the ejected particles arising inPLA induced with shorter pulse durations.8 Possible advan-tages of producing CNx thin films using subpicosecond laserpulses have been investigated by a few groups,14–17 not leastwith the aim of reducing the particulate density within andon the resulting film.
Here we report wavelength-, time-, and spatially re-solved measurements of the optical emissions that accom-pany the plume arising in the 248 nm PLA of graphite in lowbackground pressures of nitrogen, together with limitedanalyses �visible Raman spectroscopy and scanning electronmicroscopy� of the as-deposited films. Results obtained us-ing both nanosecond and femtosecond laser pulses are com-pared and contrasted, and possible implications for CNx filmgrowth discussed.
EXPERIMENT
The ablation apparatus, shown in Fig. 1, consisted of ahigh-vacuum stainless-steel chamber which was evacuatedby a turbomolecular pump, backed by a rotary pump, to abase pressure of �1�10−6 Torr. The chamber was backfilled with 20 mTorr of N2 during all ablation and depositionexperiments reported here. The incident laser beam was di-rected through one of the chamber side arms �which wassealed with a quartz window� and focused �30 cm focal
length �fl� biconvex lens� onto the target at 45° to the surface
014309-2 Fuge, Ashfold, and Henley J. Appl. Phys. 99, 014309 �2006�
normal �here defined as the x axis�. The target, a 2 in. diam-eter disk of highly oriented pyrolytic graphite �HOPG,99.9% purity�, was rotated to minimize repeated ablation ofthe same spot. Pulses of 248 nm radiation with respectivefull width at half maxima �FWHM� of 15 ns and 450 fs weregenerated using two different laser systems, as describedpreviously.8,18 The respective pulse energies were�47 mJ/15 ns pulse and �8.2 mJ/450 fs pulse. The two la-ser outputs have different spatial profiles, beam divergences,etc., the spot sizes on the target were thus very different. Theincident fluence in each case was similar ��12.5 J cm−2�,though the respective power densities were of course verydifferent: �6.3�108 and �2.8�1013 W cm−2.
Optical emission accompanying the PLA process wasviewed along the y axis �i.e., parallel to the front face of thetarget�, as a function of x and in the xz plane, as describedpreviously.18 The variation of the optical emission spectrumwith x was studied using arrangement �A� in Fig. 1. Theemission was focused onto the entrance of a translatablequartz single fiber, the exit of which was arranged to aboutthe entrance slit of a 0.32 m spectrometer coupled to an in-tensified charge-coupled device �i-CCD�. Evolving spatialdistributions of selected emitting species were measured witharrangement �B�. In such studies, the total emission, or justthe fraction that is transmitted through an appropriate narrowbandpass interference filter, was focused �2:1 magnification�directly onto the 1024�256 diode array of the i-CCD �thusenabling use of its full response range which extends to �
�900 nm�. The initial delay before an i-CCD image couldbe collected was limited to t�120 ns by the response time ofthe available electronics.
Films were deposited on n-type single-crystal �100� sili-con substrates, which were mounted with their surface per-pendicular to the target surface normal and 30 mm distantfrom the focal spot. The resulting films were analyzed byRaman spectroscopy �Renishaw 2000 system, equipped witha 514.5 nm laser� and by scanning electron microscopy
FIG. 1. Schematic illustration of the experimental apparatus. Alternativearrangements used for collecting �A� wavelength-resolved and �B� time-gated OES are depicted to the right.
�SEM� �JEOL 6300LV�.
Downloaded 25 Apr 2006 to 137.222.40.127. Redistribution subject to
RESULTS
Wavelength- and spatially resolved OES
Figure 2 shows optical emission spectra from PLA ofgraphite in 20 mTorr of N2 using �a� 15 ns and �b� 450 fslaser pulse durations, recorded over the wavelength range of290–750 nm. Signal was collected using arrangement �A�,with a long ��t�1 �s� time gate that opened at t�120 nsafter the instant the laser pulse was incident on the target.The displayed spectra were each collected by accumulatingfor 80 laser shots while viewing close to the laser/target in-teraction volume �i.e., at x=0 mm, upper trace in each panel�and at x=5 mm �lower trace�. No attempt has been made tocorrect for any wavelength dependence in the detection sen-sitivity. The quasicontinuous rising signal at long wave-lengths in the x�5 mm spectrum in Fig. 2�a� is part of thestrong 385 nm band appearing in second order. The spectrumobtained when viewing close to the target �Fig. 2�a�� displaysstrong C2�d 3�g−a 3�u� Swan band emission �the strongest,Franck-Condon diagonal, band is centered at �515 nm�,several sharp lines due to electronically excited neutral car-bon �C I� atoms and C+ �C II� ions,8 and relatively weakemission from electronically excited CN�B� radicals at�385 nm. C2�d–a� emission is still discernible in the OES
FIG. 2. Wavelength-dispersed spectra �in the range of 290–750 nm� of theplume emission accompanying 248 nm PLA of graphite in N2 using �a�nanosecond and �b� femtosecond laser pulses. The emission is capturedusing a 1 �s time gate, delayed by t=120 ns from the start of the laserexcitation, and accumulated over 80 laser shots. The upper �right axis� andlower �left axis� traces in each panel show spectra recorded at x=0 and5 mm, respectively.
recorded at x=5 mm �lower trace in each panel of Fig. 2�a��,
AIP license or copyright, see http://jap.aip.org/jap/copyright.jsp
014309-3 Fuge, Ashfold, and Henley J. Appl. Phys. 99, 014309 �2006�
but this spectrum is dominated by the CN�B 2�+−X 2�+�emission that is characteristic of many carbon plasmas in thepresence of active nitrogen. Previous studies of 248 nm PLAof graphite, in vacuum, have revealed C2�d–a� emission—but only in the region immediately adjacent to the targetsurface.8 Formation of emitting C2 species is usually consid-ered to involve gas phase collisional processes, in the high-pressure and high-temperature region near the target. Intro-duction of a background gas, as here, and in companionstudies of the effect of Ar additions,19 should enhance theprobability of three-body recombination and/or collisionalexcitation processes within the plume—consistent with ourobservation of more intense and extensive C2�d–a� emissionthan in the case of PLA in vacuum.
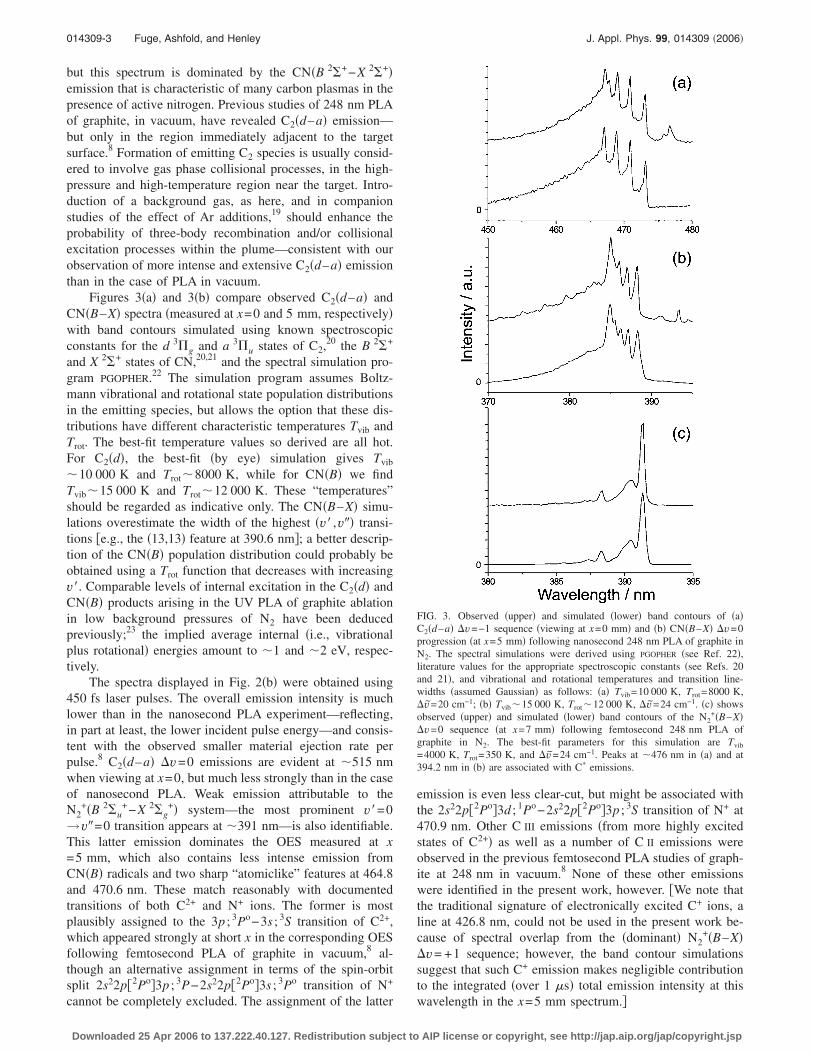
Figures 3�a� and 3�b� compare observed C2�d–a� andCN�B–X� spectra �measured at x=0 and 5 mm, respectively�with band contours simulated using known spectroscopicconstants for the d 3�g and a 3�u states of C2,20 the B 2�+
and X 2�+ states of CN,20,21 and the spectral simulation pro-gram PGOPHER.22 The simulation program assumes Boltz-mann vibrational and rotational state population distributionsin the emitting species, but allows the option that these dis-tributions have different characteristic temperatures Tvib andTrot. The best-fit temperature values so derived are all hot.For C2�d�, the best-fit �by eye� simulation gives Tvib
�10 000 K and Trot�8000 K, while for CN�B� we findTvib�15 000 K and Trot�12 000 K. These “temperatures”should be regarded as indicative only. The CN�B–X� simu-lations overestimate the width of the highest �v� ,v�� transi-tions �e.g., the �13,13� feature at 390.6 nm�; a better descrip-tion of the CN�B� population distribution could probably beobtained using a Trot function that decreases with increasingv�. Comparable levels of internal excitation in the C2�d� andCN�B� products arising in the UV PLA of graphite ablationin low background pressures of N2 have been deducedpreviously;23 the implied average internal �i.e., vibrationalplus rotational� energies amount to �1 and �2 eV, respec-tively.
The spectra displayed in Fig. 2�b� were obtained using450 fs laser pulses. The overall emission intensity is muchlower than in the nanosecond PLA experiment—reflecting,in part at least, the lower incident pulse energy—and consis-tent with the observed smaller material ejection rate perpulse.8 C2�d–a� v=0 emissions are evident at �515 nmwhen viewing at x=0, but much less strongly than in the caseof nanosecond PLA. Weak emission attributable to theN2
+�B 2�u+−X 2�g
+� system—the most prominent v�=0→v�=0 transition appears at �391 nm—is also identifiable.This latter emission dominates the OES measured at x=5 mm, which also contains less intense emission fromCN�B� radicals and two sharp “atomiclike” features at 464.8and 470.6 nm. These match reasonably with documentedtransitions of both C2+ and N+ ions. The former is mostplausibly assigned to the 3p ; 3Po−3s ; 3S transition of C2+,which appeared strongly at short x in the corresponding OESfollowing femtosecond PLA of graphite in vacuum,8 al-though an alternative assignment in terms of the spin-orbitsplit 2s22p�2Po�3p ; 3P−2s22p�2Po�3s ; 3Po transition of N+
cannot be completely excluded. The assignment of the latter
Downloaded 25 Apr 2006 to 137.222.40.127. Redistribution subject to
emission is even less clear-cut, but might be associated withthe 2s22p�2Po�3d ; 1Po−2s22p�2Po�3p ; 3S transition of N+ at470.9 nm. Other C III emissions �from more highly excitedstates of C2+� as well as a number of C II emissions wereobserved in the previous femtosecond PLA studies of graph-ite at 248 nm in vacuum.8 None of these other emissionswere identified in the present work, however. �We note thatthe traditional signature of electronically excited C+ ions, aline at 426.8 nm, could not be used in the present work be-cause of spectral overlap from the �dominant� N2
+�B–X�v= +1 sequence; however, the band contour simulationssuggest that such C+ emission makes negligible contributionto the integrated �over 1 �s� total emission intensity at this
FIG. 3. Observed �upper� and simulated �lower� band contours of �a�C2�d–a� v=−1 sequence �viewing at x=0 mm� and �b� CN�B–X� v=0progression �at x=5 mm� following nanosecond 248 nm PLA of graphite inN2. The spectral simulations were derived using PGOPHER �see Ref. 22�,literature values for the appropriate spectroscopic constants �see Refs. 20and 21�, and vibrational and rotational temperatures and transition line-widths �assumed Gaussian� as follows: �a� Tvib=10 000 K, Trot=8000 K,v=20 cm−1; �b� Tvib�15 000 K, Trot�12 000 K, v=24 cm−1. �c� showsobserved �upper� and simulated �lower� band contours of the N2
+�B–X�v=0 sequence �at x=7 mm� following femtosecond 248 nm PLA ofgraphite in N2. The best-fit parameters for this simulation are Tvib
=4000 K, Trot=350 K, and v=24 cm−1. Peaks at �476 nm in �a� and at394.2 nm in �b� are associated with C* emissions.
wavelength in the x=5 mm spectrum.�
AIP license or copyright, see http://jap.aip.org/jap/copyright.jsp
014309-4 Fuge, Ashfold, and Henley J. Appl. Phys. 99, 014309 �2006�
Figure 4 depicts the x dependence of selected emissionfeatures obtained by analyzing OES like those displayed inFig. 2, taken at many different x values. Figure 4�a� showsdata for the case of nanosecond excitation. Emissions attrib-utable to pure carbon species, i.e., C I, C II, and C2 �moni-tored via the 4p ; 3P−3s ; 3Po line at 476.7 nm, the4f ; 2Fo–3d ; 2D transition at 426.8 nm, and the d−a �0,0�peak at 516.6 nm, respectively�, are all seen to maximize atx�0. The most intense feature is the CN�B–X� v=0 se-quence, centered �and measured� at 385 nm, which appearsto peak at x�5 mm. The signal associated with N2
+ showsthe weakest x dependence, maximizing at x�9 mm and de-clining very gradually thereafter. Clearly, it is necessary toexercise some caution when assessing rather weak N2
+�B–X�signals in the presence of stronger �and overlapping�CN�B–X� emissions; trends for the former species were de-duced from analysis of emissions at �391 and �356 nm.
Figure 4�b� shows the corresponding emission intensityversus x dependences obtained by analyzing spectra of theplume emission during femtosecond PLA. One difference is
+
FIG. 4. Plots showing the x dependences of the peak emission intensitiesassociated with C2, C I, C II, C III, CN, and N2
+ species following 248 nmPLA of graphite in N2 using �a� nanosecond and �b� femtosecond laserpulses. The plotted relative intensities are as observed, except in the case ofN2
+ signal in �b� which has been reduced fourfold so that the x-dependenttrends of the other emitters can be seen more clearly. These relative scalingsinvolve considerable arbitrariness, since they depend on many factors, in-cluding the average excited-state populations during the 1 �s observationtime, the radiative and quenching properties of the various emitters, thechoice of wavelength for monitoring any particular emitter, and thewavelength-dependent spectrometer response function.
immediately apparent: emission from N2 �B� ions, rather
Downloaded 25 Apr 2006 to 137.222.40.127. Redistribution subject to
than CN�B� radicals, dominates the OES at larger x. Therelative intensities of the N2
+�B–X� signals in Fig. 4�b� havebeen reduced fourfold to allow clearer observation of theother species trends. The N2
+�B–X� emission intensity peaksat x�8 mm �similar to the nanosecond case� and is still thedominant emission at x�20 mm. Figure 3�c� shows simula-tions of the observed band contours, using PGOPHER �Ref.22� together with known spectroscopic constants for the Band X states.20 The temperatures so derived, Tvib�4000 Kand Trot�350 K, are strikingly different from those obtainedfor the C2�d� and CN�B� emitters observed in the case ofnanosecond PLA. Emission at 464.7 nm—due to electroni-cally excited C2+ ions—peaks at x�6 mm. Emission fromany other carbon-based species at such large x is negligiblein comparison. Emission from CN�B� radicals peaks at x�3 mm, i.e., �2 mm closer to the laser-target interactionregion than in the nanosecond case, and thereafter declinescomparatively slowly. The weak C2�d–a� emission peaks ateven smaller x—as in the nanosecond case.
Spatially and temporally resolved images of selectedoptical emissions
Spatially and wavelength-resolved data of the kindshown in Fig. 2, analyzed to yield the plots in Fig. 4, arerecorded using a �1 �s time gate. Such spectra allow unam-biguous species identification, and provide time-integratedinformation about the spatial distributions of the variousemitting species. Time-resolved measurements of the kindshown in Figs. 5 and 6 have the potential to provide alterna-tive and additional insights into these spatial distributionsand the formation and destruction mechanisms of the emit-
FIG. 5. i-CCD images of wavelength-selected components of the OES ��a�–�c�� and the total OES �d� from the nanosecond 248 nm PLA of graphite inN2. Each image was recorded using a 20 ns intensifier time gate, delayed byt=120, 200, and 300 ns relative to the laser pulse �left-hand center, and righthand columns, respectively�, and is displayed using the full range of theavailable gray scale. Wavelength-selected images were taken using �a� a426 nm narrow bandpass filter, �b� a bandpass filter centered at 520 nm, and�c� a long pass filter that only transmits ��780 nm. The white arrow shownin the bottom left-hand panel only, but applicable to all of the displayedimages, indicates the projection of the laser propagation axis onto the view-ing �xz� plane.
ting species. Figure 5 shows CCD images of the plume ac-
AIP license or copyright, see http://jap.aip.org/jap/copyright.jsp
014309-5 Fuge, Ashfold, and Henley J. Appl. Phys. 99, 014309 �2006�
companying nanosecond PLA using arrangement �B�, and avery short ��t=20 ns� intensifier gate width delayed by t=120, 200, and 300 ns �left-hand, center, and right-hand col-umns, respectively�. Each is a projection of the three-dimensional �3D� plume emission squashed into the x�horizontal�—z �vertical� plane. The white arrow �shown inthe bottom left-hand panel only, but applicable to all of thedisplayed images� shows the projection of the laser propaga-tion axis onto the viewing plane. Images in rows �a� and �b�were taken through narrow bandpass filters centered at 426and at 520 nm, respectively. Images in row �c� were recordedthrough a long pass filter that only transmits wavelengths ��780 nm, while those in row �d� are of the total �i.e., unfil-tered� emission. Clearly, the 520 nm emission is only ob-served close to the target surface, and expands much moreslowly than the other components. Figure 6 shows the corre-sponding set of images obtained in the case of femtosecondPLA.
Discussion of the carriers of these various emissions isinvolved, and thus reserved until later, pending analysis ofthe intensity profiles to allow estimation of the propagationvelocities �v� of the various emitters. Figure 7 shows repre-sentative intensity �I� vs x cuts along the center axis of the�a� 426 nm, �b� 520 nm, and �c� ��780 nm images resultingfrom nanosecond PLA, recorded at four different delays, t.Each such profile was fitted using one or more skewedGaussian functions, mainly to determine the position of peakemission intensity, xpeak. Figure 8 shows corresponding I vs xplots derived from the �a� 426 nm, �b� ��780 nm, and �c�total OES images resulting from femtosecond PLA, againrecorded at four different delays, t, while Figs. 9�a� and 9�b�show plots of the derived xpeak values versus t from images
FIG. 6. i-CCD images of wavelength-selected components of the OES ��a�–�c�� and the total OES �d� from the femtosecond 248 nm PLA of graphite inN2. As in Fig. 5, each image was recorded using a 20 ns intensifier timegate, delayed by t=120, 200, and 300 ns relative to the laser pulse �left-handcenter, and right-hand columns, respectively�, and is displayed using the fullrange of the available gray scale. Wavelength-selected images were takenusing �a� a 426 nm narrow bandpass filter, �b� a bandpass filter centered at520 nm, and �c� a long pass filter that only transmits ��780 nm. The whitearrow shown in the bottom left hand panel only, but applicable to all of thedisplayed images, indicates the projection of the laser propagation axis ontothe viewing �xz� plane.
recorded in both the nanosecond and femtosecond PLA ex-
Downloaded 25 Apr 2006 to 137.222.40.127. Redistribution subject to
periments. The slopes of such plots provide measures of thepropagation velocities of the various emissions, though werecognize that plume expansion in the xz plane means thatany analysis based solely on a slice along the center �z=0�axis will tend to underestimate the relative yield of fast ma-terial and thus �v�.
We focus first on the emissions accompanying nanosec-ond PLA. The xpeak values for the total emission intensityprofiles are denoted by � in Fig. 9�a�. A propagation velocity�v�=41.3±0.6 km s−1 along the surface normal can be de-duced by a straight line fit to the short distance, early time,observations �xpeak10 mm, t280 ns�; the available datathereafter are more widely spaced in t but suggest that theexpansion of the peak of the distribution of emitting speciesstagnates �until t�1250 ns� and then accelerates again. Asdiscussed more fully later, the apparent behavior at larger x iscomplicated by the effects of species being reflected from thesubstrate, the front surface of which is at x=30 mm. The426 nm emission ��� data yields a similar propagation ve-locity �v�=36.4±0.5 km s−1, but has faded to invisibility byt�380 ns. The ��780 nm emission ��� shows a lower ini-tial slope ��v�=20.8±1.2 km s−1�, but then appears to accel-
FIG. 7. Intensity �I� vs distance �x� profiles derived from wavelength-selected i-CCD images of the plume arising from the nanosecond 248 nmPLA of graphite in N2, recorded at t=120, 200, 300, and 600 ns. The rowlabels �a�, �b�, and �c� display images taken using �a� a 426 nm narrowbandpass filter, �b� a bandpass filter centered at 520 nm, and �c� a long passfilter that only transmits ��780 nm, respectively. Peak values �xpeak� havebeen obtained by fitting skewed Gaussian functions to these profiles.
FIG. 8. I vs x profiles derived from wavelength-selected i-CCD images ofthe plume from femtosecond 248 nm PLA of graphite in N2, recorded at t=120, 200, 300, and 600 ns: �a� 426 nm emission; �b� ��780 nm emission,and �c� total OES. Peak values �xpeak� have been obtained by fitting skewed
Gaussian functions to the derived profiles.
AIP license or copyright, see http://jap.aip.org/jap/copyright.jsp
014309-6 Fuge, Ashfold, and Henley J. Appl. Phys. 99, 014309 �2006�
erate so that, by t�400 ns, the average propagation velocityof this emission is similar to that of both the total and the426 nm emissions; thereafter, the ��780 nm emission alsoappears to expand much more slowly.
We now try to correlate these data with the wavelength-dispersed spectra of the plume accompanying nanosecondPLA recorded with a long �1 �s� time gate. The upper �x=0� spectrum shown in Fig. 2�a� is dominated by emissionsfrom C atoms, C+ ions, and C2�d� radicals, whereas CN�B�radicals make the dominant contribution in the lower �x=5 mm� spectrum. Clearly, the species that show strongly inthese spectra must be those that make the greatest contribu-tion when integrating throughout the 1 �s viewing window,but additional information is needed if we are to tell whetherany given feature is from a relatively intense but short-livedemission or from a weaker but persistent emission. The time-gated images provide some of the necessary insights. Imagesrecorded through the 520 nm bandpass filter are unarguablyassociated with C2�d–a� emission. This emission is mostintense at small x and at short t, but decays rapidly at longer
FIG. 9. xpeak vs t plots derived from fitting skewed Gaussian profiles to I vsx plots of the kind illustrated in Figs. 7 and 8 which, in turn, are derivedfrom analysis of time-gated imaging of the plume accompanying �a� nano-second and �b� femtosecond 248 nm PLAs of graphite in N2. The gradientsof the illustrative lines of best fit �dotted lines� provide propagation veloci-ties for the various emissions, labeled as follows: total OES ���, 426 nmemission ��� and ��780 nm emission ���. The inset in �a� provides anexpanded view of the early time xpeak vs t trends in the case of nanosecondPLA.
time delays. The wavelength-dispersed spectra �Fig. 2�a��,
Downloaded 25 Apr 2006 to 137.222.40.127. Redistribution subject to
the peak intensity versus distance dependence derived therefrom �Fig. 4�a��, and the time-gated images all indicate thatC2�d� species are concentrated close to the laser-target inter-action region. The localized contributions from C2�d–a�emission are also recognizable �at x�0� in the images oftotal emission �bottom row in Fig. 5�.
The total emission images reveal the presence of fastercomponents in the plume. Figure 4�a� suggests that much ofthe imaged total emission must be associated with CN�B�radicals, but none of the bandpass filters employed are ap-propriate for isolating CN�B–X� emission. CN radicals intheir lower-lying A 2� state, if present, would emit at ��780 nm,20 however. So, too, would a range of C I
transitions—which have been observed in previous studies ofgraphite ablation, in vacuum, in this apparatus.8 Thus, wepropose two distinct contributions to the time-gated imagesof ��780 nm emission; C I emissions, which are most im-portant at small x and t, and CN�A–X� emission which be-comes dominant as x, t, and the number of collisions be-tween ablated carbon species and background N2 increases.Such an interpretation is supported by the I vs x plots derivedfrom the ��780 nm images �Fig. 7�c��, which we interpretin terms of a slow component, that appears strongly at earlytime but fades as t increases, and a less intense but morepersistent faster �i.e., larger x� component that dominates thelater time images. This progressive switch in the identity ofthe dominant emitter accounts for the nonlinearity in theearly time part of the x vs t plot derived from the ��780 nm images �Fig. 9�a��. Previous studies of C I emis-sions arising in the 248 nm PLA of graphite, in vacuum, inthis same apparatus, yielded initial propagation velocities�v��17 km s−1 �Ref. 8�—similar to the early time slope ofthe ��780 nm emission in Fig. 9�a�. Reasons why theCN�A� emitters—that are proposed to develop with increas-ing t—should exhibit faster expansion velocities than the C I
emissions are discussed later. Nonetheless, the accumulatedevidence at this stage suggests that CN�B� and CN�A� radi-cals both contribute to the time-gated total emission images,that the latter make a major contribution to the ��780 nmimages, and that both emissions propagate with similarvelocities—i.e., �40 km s−1 up to t�400 ns and moreslowly thereafter.
We now consider the images obtained viewing the plumeaccompanying nanosecond PLA through the 426 nm band-pass filter. This filter will transmit C II emission associatedwith the C+�4f ; 2Fo–3d ; 2D� transition at 426.7 nm—whichshowed strongly in studies of the 248 nm PLA of graphite invacuum8 and in low pressures of Ar.19 It would also transmitN2
+�B–X� v= +1 emission—if present. N2+�B–X� emis-
sion is clearly evident in the femtosecond PLA studies and,as Fig. 2�b� illustrates, the Franck-Condon factors associatedwith the N2
+�B–X� transition ensure that the v=0 sequencewill always be much more intense than the v= +1 se-quence. Wavelength-dispersed spectra obtained followingnanosecond PLA of graphite in N2 �Fig. 2�a�� show no obvi-ous N2
+�B–X� emission. Thus we conclude that the 426 nmimages shown in Fig. 5�a� map the propagation of emittingC+ ions. This emission has died out by t�400 ns, but the
deduced propagation velocity up to that time, �v�
AIP license or copyright, see http://jap.aip.org/jap/copyright.jsp
014309-7 Fuge, Ashfold, and Henley J. Appl. Phys. 99, 014309 �2006�
=36.4±0.5 km s−1, is similar to that found for the CN emis-sions. The deduction that the speeds of the emitting C+ ionsand CN radicals are similar, and faster than those of theemitting C neutrals, may offer clues about the collisionalprocesses responsible for the observed CN emissions.
Analysis of wavelength-dispersed spectra of the plumeemission accompanying femtosecond PLA such as thoseshown in Fig. 2�b� revealed the presence of C2�d� radicals atsmall x, CN�B� radicals—localized at smaller x than in thecase of nanosecond PLA—and substantial emission fromN2
+�B� ions. The short �20 ns�-time-gated images shown inFig. 6 provide complementary insights. As in the nanosecondPLA studies, the weak, rapidly decaying emission imagedthrough the 520 nm bandpass filter and localized close to thelaser-target interaction volume is attributable to C2�d� radi-cals. As discussed above, the 426 nm bandpass filter cantransmit both C+�4f ; 2Fo–3d ; 2D� and N2
+�B–X� v= +1emissions. The latter dominate the �time-integrated�wavelength-dispersed emission spectra, but the deducedspeed of the 426 nm emitters in the short t images shown inFig. 6�a� suggests that, as in the nanosecond case, excited C+
ions are the main contributions to the early time emission atthis wavelength. As Fig. 9�b� shows, the average speed ofthese emitting C+ ions must be �75 km s−1 in the early �t120 ns�, preobservation stages of the expansion; the best-fit gradient of the xpeak vs t plot in the observation range120 t350 ns is �v�=28±2 km s−1. These values, and thetrend in the xpeak vs t plot, are reminiscent of those found inthe case of femtosecond 248 nm PLA of graphite invacuum.8 The ��780 nm images �Fig. 6�c�� also revealemission from a spread of x values at early t. As in thenanosecond PLA experiments, we associate this with CN�A�fragments which we assume to be formed in parallel with theCN�B� fragments identified in the wavelength-dispersedspectra recorded at small x. What is also evident from theimages in Fig. 6�c�, however, and clearer still from the gra-dient of the corresponding xpeak vs t plot �Fig. 9�b��, is thatthe subsequent expansion of this emission is slow, �v�=3.4±0.6 km s−1.
One other notable aspect of Fig. 6 is the dissimilaritybetween the images of the total OES and those of the variouswavelength-selected emissions recorded with the same timegate. Clearly, the dominant contributor to the total OESpropagates at lower velocity than the species responsible forthe early time 426 nm and ��780 nm emissions �i.e., C+
ions and CN�A� radicals, respectively�. Such faster emissionis discernable in the total OES images shown in Fig. 6�d�,and can be seen more clearly from the corresponding I vs xplots shown in Fig. 8�c�. Given the dominance of N2
+�B–X�emission in the wavelength-resolved spectra recorded at x�0 �see Fig. 4�b�, and the x=5 mm data shown in Fig. 2�b��,it is reasonable to assume that this emission is the dominantcontributor to the total OES images also. The gradient of thexpeak vs t plot of this emission �� in Fig. 9�b�� yields anapparent propagation velocity �v�=9.7±0.2 km s−1.
Analysis of deposited CNx films
Material coating was not the major thrust of the present
work. Nonetheless, it was clearly important to establish that
Downloaded 25 Apr 2006 to 137.222.40.127. Redistribution subject to
the process conditions employed did yield CNx films. Thusfilms were grown by both nanosecond and femtosecondPLA, on Si substrates maintained at room temperature andmounted at x=30 mm with their front surface perpendicularto the surface normal, and then analyzed visually, by SEMand by Raman spectroscopy �514.5 nm excitation wave-length�. SEM showed both sets of films to be smooth andrelatively free from particulates. Films grown by nanosecondPLA were significantly thicker, however. For example,�900 ns laser pulses were sufficient to produce a visiblebrown coating, whereas the corresponding film produced us-ing 900 fs pulses could not be distinguished �by eye� fromthe underlying silicon surface. As Fig. 10 shows, both sets offilms showed characteristic CNx Raman signatures in the1050–1800 cm−1 region.24 These were deconvoluted intocontributions associated with the D and G vibrational modesof graphite,25 using Gaussian functions as shown in Fig. 10.The D to G band intensity ratio, I�D� / I�G�, can provide in-sights into the extent of clustering induced when N is incor-porated into amorphous carbon films. Higher I�D� / I�G� ra-tios are considered to imply increased clustering and largercluster sizes of the sp2 phase material. The I�D� / I�G� valuesderived for the present CNx thin films are 0.87 and 0.74, forthe case of nanosecond and femtosecond PLA, respectively.These values are both comparable to those found in previousstudies of films deposited at room temperature using nano-second 193 nm PLA of graphite in 20 mTorr of N2 ��0.9,
FIG. 10. Raman spectra �514.5 nm excitation wavelength� of CNx filmsdeposited on Si by �a� nanosecond and �b� femtosecond PLAs of graphite inN2. Also shown are deconvolutions of the 1050–1800 cm−1 feature in termsof two independent Gaussian functions �solid curves� after subtraction of a�linear� background contribution attributable to photoluminescence. Residu-als of the fit are shown by dotted lines. The strong peak centered at�950 cm−1 is due to the underlying Si substrate.
Ref. 24�, and much higher than the �0.15 values found in
AIP license or copyright, see http://jap.aip.org/jap/copyright.jsp
014309-8 Fuge, Ashfold, and Henley J. Appl. Phys. 99, 014309 �2006�
the N2-free case, e.g., when N2 is replaced by an equivalentbackground pressure of Ar.19,24 Such relatively highI�D� / I�G� values for CNx thin films deposited at room tem-perature confirm nitrogen incorporation within the carbonlattice, where it serves to relax some of the constraints asso-ciated with nanocrystalline domain formation.24 So, too, doesthe weak feature at �2225 cm−1 in the spectrum of the filmgrown by nanosecond PLA. This peak is traditionally attrib-uted to the presence of the nitrile �CwN� group. Its non-observation in the Raman spectra of films grown by femto-second PLA may suggest that the extent of N incorporationand/or bonding is lower than in the case of films grown bynanosecond PLA—consistent with the somewhat lowerI�D� / I�G� ratios observed for such films. However, we alsonote the comparative weakness of the Raman signal from theCNx film grown by femtosecond PLA �as compared with thebackground Si feature at �950 cm−1 �Fig. 10�b���, reflectingthe facts that femtosecond PLA yields thinner films thanthose grown from nanosecond pulses of the same fluence,and that the amount of material ejected per femtosecondpulse is much smaller.
DISCUSSION
Film analysis confirms that CNx films are grown by248 nm PLA of graphite in a low pressure of N2, using bothnanosecond and femtosecond laser pulse durations, and thatnanosecond PLA results in films that are thicker and have ahigher degree of N incorporation. The main focus of thepresent work, however, is the use of wavelength-, spatially,and temporally resolved OESs to unravel clues as to how Nis incorporated within such films.
Irrespective of the pulse duration, the initial laser-targetinteraction can only lead to ejection of carbonaceous mate-rial, mainly atoms and atomic ions, as well as electrons. Asin the case of ablation in vacuum,8 or in a low backgroundpressure of Ar,19 the most likely route to forming C2 specieswill involve atom-atom recombination reactions, stabilizedby a third body �generally N2 in the present case�. Since theC atom �and ion� density will be highest in the small volumeadjacent to the irradiated area on the target surface, the ob-servation that the C2�d–a� emission intensity peaks at smallx and t is unsurprising. Similarly, the observation that theC2�d–a� emission in the femtosecond PLA study is weaker,and even more spatially localized, accords with the findingthat femtosecond PLA causes less material removal perpulse.
Emitting C, C+, and C2+ species have all been identifiedin previous UV PLA studies of graphite in vacuum,8,26 and inAr,19 and propagation velocities reported that are similar tothose measured in the present work. The natural radiativelifetimes �rad of many of the emitting states of these atomicspecies are significantly shorter than the times over whichtheir emission is observed, implying the operation of one �ormore� mechanism for populating the observed emitting lev-els, post-ablation. One such mechanism in the case of atomicspecies is collisionally assisted electron-ion recombination�EIR�, whereby Mn+ ions and electrons combine to yield
�n−1�+
M species in high-lying Rydberg states; these subse-
Downloaded 25 Apr 2006 to 137.222.40.127. Redistribution subject to
quently relax—collisionally and/or by radiative cascade—through a manifold of relatively long-lived Rydberg statesand eventually pass through the transitions monitored byOES.26 Analyses of wavelength-dispersed OES accompany-ing previous femtosecond PLA studies of graphite in vacuumhave indicated a significantly higher degree of ionizationwithin the ejected material than in the case of nanosecondPLA.8 Such is expected to be the case here also, but theemissions from most of the excited Cn+ species �e.g., the C II
emissions imaged in Fig. 6�a�� are presumably too weak, anddecay �radiatively or collisionally� too rapidly, to make adiscernible contribution to the wavelength-dispersed OES re-corded with a long �1 �s� time gate.
Of the other observed molecular emitters, CN�B� andN2
+�B� species both have �rad values �in the range of60–70 ns �Ref. 20�� that are also much less than the timesover which their emission is observed. �rad for the CN�A�radical is about one order of magnitude longer.20 It seemsreasonable to assume that CN formation involves reactionbetween a carbon-containing species in the ablation plumeand a background N2 molecule. However, any detailed inter-pretation will require more detailed knowledge of the carbonatom and ion, and C2 radical, number density distributions,their respective kinetic-energy distributions, and their respec-tive collision-energy-dependent reaction cross sections withN2 than can be provided simply by OES measurements.
Previous investigations of emitting electronically, vibra-tionally, and rotationally excited CN radicals �henceforthrepresented simply as CN* if the electronic state is unimpor-tant� formed via PLA of graphite in N2 �Refs. 27–30� haveinvoked a role for the four-center reaction
C2 + N2 → 2CN, �1�
which is only slightly endothermic, H00�0.51 eV, but has
an activation energy of �1.8 eV �for the ground-statespecies�.31 Such a proposal appears attractive, both on ener-getic grounds and because of the obvious correlation be-tween the relative strengths of the CN�B–X� and C2�d–a�emission intensities. It also accords, qualitatively, with theobservation �Fig. 4� that the fall in the density of emittingC2�d� radicals �with increasing x� roughly complements thegrowth of CN�B� emission. Such an interpretation is unlikelyto be the complete story, however—particularly when itcomes to explaining production of the fastest emitting CNproducts.
Plume production and propagation through a backgroundgas are often discussed in terms of a three-stage process:linear expansion, shock wave formation, and plume stop-ping. The first stage involves free expansion of the plume,with little influence from the background gas. Such is prob-ably appropriate for the case of the species responsible forthe C I and C II emissions above, the velocities of whichshow no obvious retardation with increasing x. New and/orenhanced emissions are observed away from the target sur-face, once some mixing of the plume species and the back-ground gas has occurred—and assuming that the ensuing en-counters result in reaction and/or excitation. This stage mayinvolve formation of a shock front, if the background pres-
sure is sufficiently high. Given the low N2 pressures in the
AIP license or copyright, see http://jap.aip.org/jap/copyright.jsp
014309-9 Fuge, Ashfold, and Henley J. Appl. Phys. 99, 014309 �2006�
present work, we neglect possible shock wave formation anduse simple kinetic theory of gases arguments to estimate afew relevant time scales and distances. On this basis, themean free path for an ablated particle propagating at20 km s−1 in 20 mTorr of N2 would be a few millimeters,and the mean time ��� between collisions for such a particlewill be 10–20 ns. For two background N2 gas molecules, thecorresponding values are the same few millimeters and ��5 �s. The CN* emissions observed in the nanosecondPLA studies are seen to maximize at x�5 mm—as observedby others also.32–34 The apparent propagation velocities ofthe CN* emitters are comparable to those deduced for theemitting C+ ions and C neutrals, but about an order of mag-nitude faster than those of the observed C2�d� radicals.
How should we interpret the apparent propagation veloc-ity of CN* radicals derived from plots like those in Fig. 9?As pointed out previously,35 the short radiative lifetime ofthe CN�B� state dictates that such excited radicals must emitalmost as soon as they are formed, i.e., that the time-gatedimages of the CN�B–X� emission reveal the positions ofsuccessful CN�B� forming encounters during the time win-dow of the observation. We note that the later-time ��780 nm images in Fig. 5�c�, which we attribute largely toCN�A–X� emission, appear somewhat fuzzier than the cor-responding total OES images �Fig. 5�d�, which are domi-nated by CN�B–X� emission�. Such is consistent with thelonger �rad value of the CN�A� state, which allows somerelaxation of the constraint that precludes the emitting prod-uct traveling any significant distance in the time betweencreation and emission.
Thus we view CN* emission as a signifier of the firstreactive encounter involving its C-containing precursor gen-erated in the PLA process. Contrary to at least one previousdiscussion,23 the “velocity” of the CN* products deducedfrom the initial slope of a plot such as that shown in Fig. 9does not provide a measure of the velocity �or thus of thekinetic energy� of the CN* radicals themselves. Rather, theyprovide some measure of the velocity of the reactive precur-sor involved in CN* radical formation. The “velocities” de-rived from analysis of the short-time images of both theCN�A� and CN�B� emissions exceed the velocity of the C I
emission observed in the nanosecond 248 nm PLA of graph-ite in vacuum.8 Conceivably, this could indicate that thefaster fraction of the carriers responsible for the C I emissionhas a higher reaction probability with N2. We note, however,that the early time velocity of the CN�B� products matcheswell with that derived by monitoring the C II emission. Ourearlier thesis that C II emission is a signifier of ablation prod-ucts that begin life as C2+ ions and then undergo electron-ionrecombination in the early stages of the expansion, thus leadsto the suggestion that the faster CN* products observed in theearly time images are probably formed via abstraction–charge-transfer reactions such as36–38
C+ + N2 → N+ + CN, �2�
or even, possibly, from C2++N2 collisions. Reaction �2� isendothermic, H0
0�5.26 eV,36 when all reactants and prod-ucts are in their respective ground states. However, the C+
2+ 39
→C ionization energy is 24.38 eV. The Rydberg states of
Downloaded 25 Apr 2006 to 137.222.40.127. Redistribution subject to
C+ that are assumed to be present in the plume will thus haveample internal �electronic� energy to drive the forward reac-tion. As shown below, the likely collision energies are alsomore than sufficient to surmount an activation barrier of thismagnitude. A recent study by Park and Lee40 lends support tothis proposed mechanism. These workers investigated theOES accompanying nanosecond 266 nm PLA of graphite ina range of N2 pressures but, in contrast to the present study,mapped the emission in the xy plane, by viewing down the zaxis. Spatially localized C2�d–a� and CN�B–X� emissionswere observed, at a number of different time delays. Theformer expanded more slowly, and died out morequickly—as in the present work. One other, significant, dif-ference was apparent, however. The C2�d–a� emission wasobserved to expand symmetrically about the surface normal�x�, but the CN�B–X� emission was found to be anisotropicabout x and to propagate along an axis inclined towards theaxis of the incident laser beam.40 Such behavior has beenseen previously, for the case of the C II emissions arising inthe nanosecond 193 nm PLA of graphite in vacuum, andrationalized in terms of preferential multiphoton excitationand ionization of C species in the leading part of the expand-ing plasma ball that are exposed to the greatest incident pho-ton flux, and subsequent EIR and radiative decay.26 Suchanisotropy could not be seen in the present study because ofthe viewing geometry, whereby the incident laser axisprojects onto the surface normal. Any asymmetry evident inthe present images �see, e.g., Fig. 5�a�� is attributed to theinhomogeneous spatial profile of the nanosecond excimer la-ser output.
Given the foregoing interpretation of the apparent ve-locities of the CN* emitters, there remains a question as towhat might be the real impact velocity of such species on thesurface of the substrate on which a CNx film is grown.Analyses of images of CN* emission taken at later t �the xpeak
data from which are summarized in Fig. 9� imply muchslower expansion velocities, but still do not provide any clearanswer. The substrate in our experiments is positioned at x=30 mm, and inspection of I vs x plots such as those shownin Fig. 7�c� shows a definite enhancement in the CN* emis-sion intensity at larger x in images recorded at later t. Asnoted previously,23 the presence of the substrate introducesseveral possible secondary excitation mechanisms. For ex-ample, collision of a gas phase species with the substratesurface offers a route for converting the incident kinetic en-ergy of the former into internal �electronic, vibrational, rota-tional� excitation. Such gas-surface collisions can also leadto compaction of previously deposited material within thefilm, and to the sputtering of such material back into the gasphase. Purely gas phase collisions involving an incident spe-cies and one that has scattered from the surface will involvehigher than average collision energies. All such processescould lead to an increase in optical emission in the vicinity ofthe substrate; the relative intensities, and the spatial extent,of any such emissions will vary with t because of the timedependence of the density, composition, and energy contentof the incident pulse of gas created by the PLA event �andmodified by subsequent gas phase collisions�.
One estimate of the average velocity with which CN
AIP license or copyright, see http://jap.aip.org/jap/copyright.jsp
014309-10 Fuge, Ashfold, and Henley J. Appl. Phys. 99, 014309 �2006�
radicals strike the substrate can be obtained from the colli-sion frequency and mean-free-path estimates quoted previ-ously. Let us start by assuming that fast CN* radical forma-tion is via the C++N2 abstraction–charge-transfer reaction�2�, that the initial C+ ion velocity vx=20 km s−1 along thetarget surface normal and, for simplicity, that the backgroundN2 molecules are stationary. In this model, the laboratory andcenter-of-mass frames are equivalent, and the initial C++N2
collision energy �Ecoll�17.5 eV� is more than sufficient toovercome the endothermicity of reaction �2�. The C+ ionsseen in the OES carry electronic energy also, but we assumethat most of the C+ ions available to participate in reaction�2� are in their ground state, so we ignore possible additional�electronic� contributions to the energy available for reaction.Given these assumptions, the energy available to the N+
+CN products is �12.1 eV ��8.9 eV in the case that the CNproducts are in the v=0 level of the B state�. If all of thisavailable energy is partitioned into product translation, theresulting CN�B� fragments can have any velocity in therange of 10.8�vx�1.2 km s−1, where the limits correspondto, respectively, pure stripping and pure rebound dynamics.These numbers are meant to be illustrative only. Clearly,some reactive encounters will involve greater initial energies�either from reactant electronic excitation, or as a result of ahigher impact kinetic energy� but equally, in many cases,more of the reaction exoergicity than has been assumed herewill be channeled into non-translational degrees of freedom�e.g., CN�B� vibrational excitation or electronic excitation ofthe N+ cofragment�. Given a target-substrate separation of30 mm and an estimated mean free path in 20 mTorr of N2
of 5 mm, the resulting CN radical is likely to suffer severalfurther �non-reactive� collisions—most probably with back-ground N2 molecules—before striking the substrate. If wepersist with the foregoing simplifications, momentum con-servation could cause �vx� to be reduced by as much as 50%in each subsequent collision. Thus it is difficult to envisagethat the average impact velocity of CN radicals striking asubstrate 30 mm distant from a graphite target subjected tonanosecond 248 nm PLA in 20 mTorr of N2 will be morethan a few km s−1 �vx=5 km s−1 equates to an impact energyof �7 eV�.
In closing this discussion of CN radical formation,propagation, and impact on the substrate surface we recallthat C I emissions also contribute to the observed OES. Theultimate result of such emissions will be formation ofground-state C atoms. Reaction �3�, the activation energy forwhich has been estimated at �1.9 eV,31,41 thus representsanother potential source of CN radicals,
C + N2 → CN + N. �3�
The total C atom density in the ablation plume is likely to befar higher than the C+ ion density. Recall that the EIR inter-pretation associates C I emissions with species created as C+
ions in the initial PLA event. Charged species experience aninitial �Coulombic� acceleration not available to neutralejecta, and will thus typically exhibit higher recoil velocities.The C atoms available to react with background N2 gas mol-ecules are thus expected to have a broad velocity distribu-
+
tion, with a faster fraction deriving from C ions that have
Downloaded 25 Apr 2006 to 137.222.40.127. Redistribution subject to
undergone EIR and subsequent relaxation, and a slower com-ponent that was created as neutral atoms. Ecoll for the fasterfraction of C+N2 collisions may well be �10 eV, so itwould be foolish to exclude reaction �3� as another probablesource of CN radicals available for incorporation in anyeventual CNx film. That said, it is hard to see how CN radi-cals formed via this route could have incident kinetic ener-gies larger than those deduced in the foregoing considerationof the C++N2 reaction products. Reaction �1� is unarguablycapable of producing CN radicals also, but the slow recoilvelocities deduced for the emitting C2 species in the plumesuggest that these will, if anything, have even smaller vx
values.N2
+�B–X� emission is evident in the OES accompanyingnanosecond 248 nm PLA of graphite in N2, and dominatesthe emission seen in the femtosecond studies. FemtosecondPLA releases much less carbon per pulse, so the relativeyield of C2 radicals �which are considered to arise via recom-bination of gas phase C atoms� would be expected, and isobserved, to be much lower than in the corresponding nano-second study. Femtosecond PLA involves much higher peakintensities, and the resulting plume is generally more highlyionized. Thus the plume formed via femtosecond PLAshould contain a higher Cn+ /C ratio �n�1�—a prediction inaccord with the present OES data, and with femtosecondPLA studies of graphite in Ar �Ref. 19� and in vacuum.8
Cn++N2 collisions should thus be relatively more importantin the case of femtosecond PLA. We have argued that C+
+N2, C+N2, and C2+N2 reactive encounters probably allcontribute to the CN* emission seen in the nanosecond PLAstudies. The CN* emission following femtosecond PLA ismuch weaker—reflecting the reduced contributions from, es-pecially, reactions �1� and �3�. Previous guided ion massspectrometry studies of the C++N2 reaction have revealed asubstantial role for the charge-transfer channel
C+ + N2 → C + N2+, �4�
at all collision energies above threshold �H00=4.32 eV for
all ground-state species, and 7.48 eV for ground-state reac-tant forming N2
+�B��; this channel becomes totally dominantat Ecoll�20 eV.36 We have found no detailed studies of theway in which C+ electronic excitation affects the productbranching, or of the related reaction involving C2+ ions. It isthus tempting to attribute the dominance of N2
+�B–X� emis-sion in the OES following femtosecond PLA of graphite inN2 to reaction �4�. The comparatively slow speed with whichthis localized emission expands, and its persistence, bothmerit comment, however. Inspection of Fig. 9�b� suggestssome curvature of the xpeak vs t plot for the N2
+�B–X� emis-sion; the gradient first increases and then appears to decreasewith increasing t. The deduced propagation speed at earlytimes is, in fact, rather similar to that predicted by the pre-vious momentum conservation arguments, and could be rea-sonable if charge transfer is favored by a stripping-typemechanism, and less momentum is thus transferred to theresulting N2
+ ion. If this ion was formed in its B state, itshould decay radiatively, within �60 ns—i.e., essentially atthe point where the charge transfer occurred. This mecha-
nism alone is thus unable to account for the persistence of
AIP license or copyright, see http://jap.aip.org/jap/copyright.jsp
014309-11 Fuge, Ashfold, and Henley J. Appl. Phys. 99, 014309 �2006�
the N2+�B–X� emission, which is observable at �1 �s after
the PLA event.We recognize that C2++N2 charge-transfer collisions
could offer a route to N2+�B� products. We also recognize
that the present observations could be explained by invokingpopulation of a higher-energy, metastable, state of N2
+,which feeds into the �observed� N2
+�B� state over an ex-tended time scale. In the absence of additional informationabout C2++N2 reaction mechanisms, and/or about suitablemetastable excited states of N2
+, however, we consider thefollowing to be the most plausible explanation for the presentobservations: Femtosecond PLA leads to a relatively low �incomparison with nanosecond PLA� yield of ejected materialper pulse, comprising neutrals, Cn+ ions, and electrons.Charge transfer results in N2
+ ion formation, and rapid deple-tion of the Cn+ number density—at small x. Some momen-tum is transferred in the charge-transfer process, so the re-sulting N2
+ ions acquire an expansion velocity. The electronsformed in the ablation process track the positive charges,which now reside with the expanding cloud of N2
+ ions �am-bipolar expansion�. Numerous studies, involving a widerange of laboratory and astrophysical plasmas, have demon-strated that electron collisions with N2
+ ions lead to intenseN2
+�B–X� emission. Calculated electron-impact excitationcross sections42 for this process accord with the observeddominance of the v�=0→v�=0 band at 391.4 nm. Thecharge-transfer mechanism �4�, followed by one �or possiblymore� subsequent electron-impact excitations, can also ac-count for the modest N2
+ rotational excitation deduced fromthe simulations of the observed OES. Electron collisionswith neutral N2 molecules can also lead to N2
+�B–X� emis-sion if the collision energies are sufficiently high; such exci-tations may gain in importance at larger x as the density ofN2
+ falls �as it must do if any of the electron-ion encountersresult in a dissociative recombination rather than excitation�and might help to explain both the persistence of this par-ticular emission and the observed slowing of the N2
+�B–X�emission at large x.
CONCLUSION
Fundamental aspects of the nanosecond and femtosec-ond 248 nm PLAs of graphite in low pressures of N2 havebeen investigated by wavelength-, space-, and time-resolvedoptical emission spectroscopy and by analysis of the result-ing CNx films. Nanosecond laser excitation provided �5�higher pulse energies, but the superior beam quality of thefemtosecond pulse enabled comparative studies at similar in-cident fluences �though, necessarily, very different incidentintensities�. Nanosecond PLA results in significantly morematerial removal per pulse. Laser Raman spectroscopy con-firms successful incorporation of nitrogen within the filmsgrown by both nanosecond and femtosecond PLAs; theformer films are deduced to be both thicker and to havehigher N content. OES studies of the nanosecond ablationplume reveal C I, C II, and C2 emissions—concentrated closeto the target—and, at larger x, weak N2
+ and strong CNemissions. In contrast, wavelength-resolved spectra of the
plume accompanying femtosecond PLA are dominated by
Downloaded 25 Apr 2006 to 137.222.40.127. Redistribution subject to
N2+�B–X� emission. Analysis of time-gated images of the
respective emissions has allowed estimation of the propaga-tion speeds of the various carriers, and revealed contributionsfrom secondary excitation and/or material sputtering near thesurface of the depositing film. Possible production routes forsecondary emitters such as CN and N2
+ are discussed. Ob-servation of CN�B–X� emission confirms CwN bond for-mation in the gas phase. Arguments are presented to demon-strate that any apparent propagation “velocity” deduced byanalysis of such secondary emission is unlikely to provide auseful measure of the kinetic energy with which such carriersimpact on the growing film.
ACKNOWLEDGMENTS
The authors are very grateful to Dr. D. Anglos and Pro-fessor C. Fotakis for their support of this work, the majorpart of which was performed at the Ultraviolet Laser Facilityoperating at IESL FORTH, Heraklion, and supported by theEU through the Research Infrastructures activity of FP6�Contract No. RII3-CT-2003-506350: Laserlab-Europe�. Theauthors are also grateful to Professor A. J. Orr-Ewing, Dr. J.A. Smith, Dr. C. M. Western �Bristol�, A. Egglezis, and A.Klini �FORTH� for their many contributions to the work de-scribed herein, and to EPSRC for funding via two portfoliogrants �LASER and Integrated Electronics� and the CarbonBased Electronics Initiative.
1C. W. Ong, X.-A. Zhao, Y. C. Tsang, C. L. Choy, and P. W. Chan, ThinSolid Films 280, 1 �1996�.
2J. P. Zhao, Z. Y. Chen, T. Yano, T. Ooie, and M. Yoneda, J. Appl. Phys.89, 1580 �2001�.
3E. Gyorgy, V. Nelea, I. N. Mihailescu, A. Perrone, H. Pelletier, A. Cornet,S. Ganatsios, and J. Werckmann, Thin Solid Films 388, 93 �2001�.
4J. Neidhardt, L. Hultman, E. Broitman, T. W. Scharf, and I. L. Singer,Diamond Relat. Mater. 13, 1882 �2004�.
5N. Hellgren, M. P. Johansson, E. Broitman, P. Sandstrom, L. Hultman, andJ.-E. Sundgren, Thin Solid Films 382, 146 �2001�.
6S. Muhl and J. M. Mendez, Diamond Relat. Mater. 8, 1809 �1999�.7S. E. Rodil and S. Muhl, Diamond Relat. Mater. 13, 1521 �2004�.8F. Claeyssens, M. N. R. Ashfold, E. Sofoulakis, C. G. Ristoscu, D. Anglos,and C. Fotakis, J. Appl. Phys. 91, 6162 �2002�.
9P. S. Banks, L. Dinh, B. C. Stuart, M. D. Feit, A. M. Komashko, A. M.Rubenchik, M. D. Perry, and W. McLean, Appl. Phys. A: Mater. Sci.Process. 69, S347 �1999�.
10A. S. Loir et al., Appl. Surf. Sci. 208, 553 �2003�.11M. D. Shirk and P. A. Molian, Carbon 39, 1183 �2001�.12M. Okoshi, S. Higuchi, and M. Hanabusa, J. Appl. Phys. 86, 1768 �1999�.13S. Rey, F. Antoni, B. Prevot, E. Fogarassy, J. C. Arnault, J. Hommet, F. Le
Normand, and P. Boher, Appl. Phys. A: Mater. Sci. Process. 71, 433�2000�.
14Z. Geretovszky, Z. Kantor, and T. Szorenyi, Appl. Surf. Sci. 208, 547�2003�.
15T. Szorenyi, E. Fogarassy, C. Fuchs, J. Hommet, and F. Le Normand,Appl. Phys. A: Mater. Sci. Process. 69, S941 �1999�.
16Z. Geretovszky, Z. Kantor, I. Bertoti, and T. Szorenyi, Appl. Phys. A:Mater. Sci. Process. 70, 9 �2000�.
17S. Acquaviva, A. Perrone, A. Zocco, A. Klini, and C. Fotakis, Thin SolidFilms 373, 266 �2000�.
18S. J. Henley, G. M. Fuge, and M. N. R. Ashfold, J. Appl. Phys. 97,023304 �2005�.
19S. J. Henley, J. D. Carey, S. R. P. Silva, G. M. Fuge, M. N. R. Ashfold,and D. Anglos, Phys. Rev. B 72, 205413 �2005�.
20K. P. Huber and G. Herzberg, Molecular Spectra and Molecular StructureIV. Constants of Diatomic Molecules �van Nostrand, New York, 1979�.
21F. J. LeBlanc, J. Chem. Phys. 48, 1980 �1968�.22C. M. Western, PGOPHER, a program for simulating rotational structure,
University of Bristol, http://pgopher.chem.bris.ac.uk
AIP license or copyright, see http://jap.aip.org/jap/copyright.jsp
014309-12 Fuge, Ashfold, and Henley J. Appl. Phys. 99, 014309 �2006�
23A. A. Voevodin, J. G. Jones, J. S. Zabinski, and L. Huttman, J. Appl. Phys.92, 724 �2002�.
24G. M. Fuge, C. J. Rennick, S. R. J. Pearce, P. W. May, and M. N. R.Ashfold, Diamond Relat. Mater. 12, 1049 �2003�, and references therein.
25A. C. Ferrari and J. Robertson, Phys. Rev. B 61, 14095 �2000�, andreferences therein.
26F. Claeyssens, R. J. Lade, K. N. Rosser, and M. N. R. Ashfold, J. Appl.Phys. 89, 697 �2001�.
27R. K. Thareja, R. K. Dwivedi, and K. Ebihara, Nucl. Instrum. MethodsPhys. Res. B 192, 301 �2002�.
28S. Abdelli-Messaci, T. Kerdja, A. Bendib, and S. Malek, J. Phys. D 35,2772 �2002�.
29S. Wee and S. M. Park, Opt. Commun. 165, 199 �1999�.30C. Vivien, J. Hermann, A. Perrone, C. Boulmer-Leborgne, and A. Luches,
J. Phys. D 31, 1263 �1998�.31T. Sommer, T. Kruse, P. Roth, and H. Hippler, J. Phys. Chem. A 101,
3720 �1997�.32S. Trusso, E. Barletta, F. Barreca, and F. Neri, Appl. Phys. A: Mater. Sci.
Downloaded 25 Apr 2006 to 137.222.40.127. Redistribution subject to
Process. 79, 1997 �2004�.33S. Acquaviva and M. L. De Giorgi, J. Phys. B 35, 795 �2002�.34E. Aldea, A. P. Caricato, G. Dinescu, A. Luches, and A. Perrone, Jpn. J.
Appl. Phys., Part 1 36, 4686 �1997�.35K. L. Saenger, J. Appl. Phys. 66, 4435 �1989�.36J. D. Burley, L. S. Sunderlin, and P. B. Armentrout, J. Chem. Phys. 94,
1939 �1991�.37R. C. C. Lao, R. W. Rozett, and W. S. Koski, J. Chem. Phys. 49, 4202
�1968�.38Ch. Ottinger and J. Simonis, Chem. Phys. 28, 97 �1978�.39NIST Atomic Spectra Database, http://physics.nist.gov/cgi-bin/AtData/
main_asd40S. M. Park and K. H. Lee, Appl. Surf. Sci. 178, 37 �2001�.41A. J. Dean, R. K. Hanson, and C. T. Bowman, J. Phys. Chem. 95, 3180
�1991�.42O. Nagy, C. P. Balance, K. A. Berrington, P. G. Burke, and B. M.
McLaughlin, J. Phys. B 32, L469 �1999�.
AIP license or copyright, see http://jap.aip.org/jap/copyright.jsp