Louisiana State University LSU Digital Commons LSU Historical Dissertations and eses Graduate School 1955 Studies of ermal Conductivity of Liquids. Byron C. Sakiadis Louisiana State University and Agricultural & Mechanical College Follow this and additional works at: hps://digitalcommons.lsu.edu/gradschool_disstheses is Dissertation is brought to you for free and open access by the Graduate School at LSU Digital Commons. It has been accepted for inclusion in LSU Historical Dissertations and eses by an authorized administrator of LSU Digital Commons. For more information, please contact [email protected]. Recommended Citation Sakiadis, Byron C., "Studies of ermal Conductivity of Liquids." (1955). LSU Historical Dissertations and eses. 8127. hps://digitalcommons.lsu.edu/gradschool_disstheses/8127
Transcript
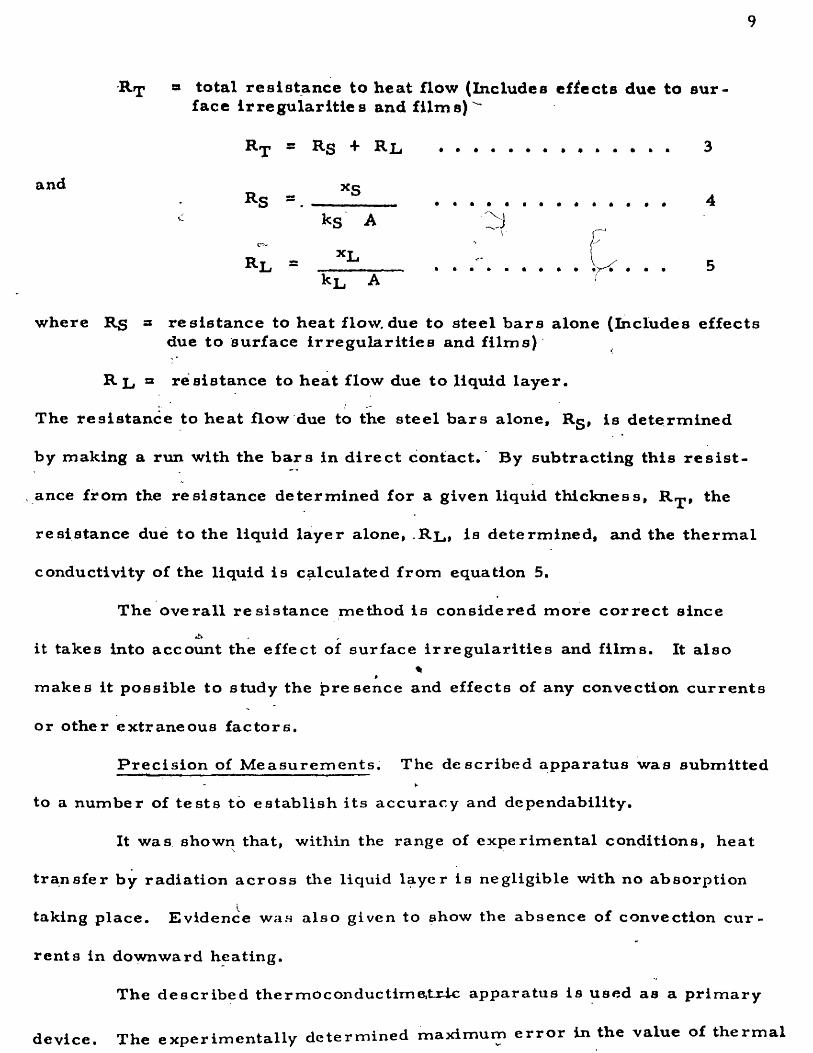
Louisiana State UniversityLSU Digital Commons
LSU Historical Dissertations and Theses Graduate School
1955
Studies of Thermal Conductivity of Liquids.Byron C. SakiadisLouisiana State University and Agricultural & Mechanical College
Follow this and additional works at: https://digitalcommons.lsu.edu/gradschool_disstheses
This Dissertation is brought to you for free and open access by the Graduate School at LSU Digital Commons. It has been accepted for inclusion inLSU Historical Dissertations and Theses by an authorized administrator of LSU Digital Commons. For more information, please [email protected].
Recommended CitationSakiadis, Byron C., "Studies of Thermal Conductivity of Liquids." (1955). LSU Historical Dissertations and Theses. 8127.https://digitalcommons.lsu.edu/gradschool_disstheses/8127
Submitted to the Graduate Faculty of the Louisiana State University and
Agricultural and Mechanical College in part ia l fulfillment of the
requ irem en ts for the degree of Doctor of Philosophy
in
The Department of Chemical Engineering
byByron C.Sakiadis
B .S . , Louisiana State University, 1951 M. S . , L ouisiana State University, 1953
June 19 55
UMI Number: DP69505
All rights reserved
INFORMATION TO ALL USERS The quality of this reproduction is dependent upon the quality of the copy submitted.
In the unlikely event that the author did not send a complete manuscript and there are missing pages, these will be noted. Also, if material had to be removed,
a note will indicate the deletion.
Dissertation Publishing
UMI DP69505
Published by ProQuest LLC (2015). Copyright in the Dissertation held by the Author.
1. Allied Chemical & Dye a. Pure - 99 mol% min..2 . Brothers Chemical b. Reagent, Research, Eastm an3. Carbide &r Carbon Highest Purity.4. City Chemical c. Technical - 95 mol% min.5. Eastman Kodak d. Prac t ica l - 95-98%6 . F isher Sci.7. Matheson, Coleman &r Bell8 . Merck9. Phillips Petroleum0 . U. S. Industrial
13x
about 5 % lower consistently than the values calculated by the co rrec t overall
resis tance to heat flow method. The difference is due to surface i r r e g u la r i
ties and films(5). This effect may be evaluated also from the overall r e
sistance of the b a rs when in d irec t contact. The presence of surface i r r e g
ularities and films would increase the resis tance to heat flow of the bars .
Hence, it was found that if all the surface effects are due to surface i r r e g u
larities, they are of the order of 0. 0008 in. Since the metal surfaces were
carefully machined, plated and highly polished, at least to the same extent
as in apparatus of other investigators, it is concluded that some of the best
li terature values of thermal conductivity are about 4 to 5% lower than the
correc t values.
The apparatus used by O.K. Bates et al is a thick film apparatus. The
liquid layer thickness was about 2 in . , and the temperature drop acVoss a
given liquid film thickness was determined by thermocouples placed within the
liquid layer wi/th their hot junctions located approximately 1/4 in. apart.r The
values obtained by O.K.' Bates et al agree well with the results of this invest i
gation calculated by the co rrec t overall resis tance method. This was to be
expected since the liquid film thickness is determined directly within the
liquid layer, and therefore is free of surface i r regu lar i t ies and films.
Although the results of T. K. Slawecki were calculated by the ex trapola
tion method they agree with'the author's resu lts calculated by the overall r e
sistance to heat flow method. This is probably due to the fact that the liquid
layer thickness, in the apparatus used by Slawecki, was determined by e lec tr ica l
capacitance methods which should give a true average value.
A comparison of the temperature coefficients of thermal conductivity
for some liquids with li te ra ture values was/made, and it was noted that the
14
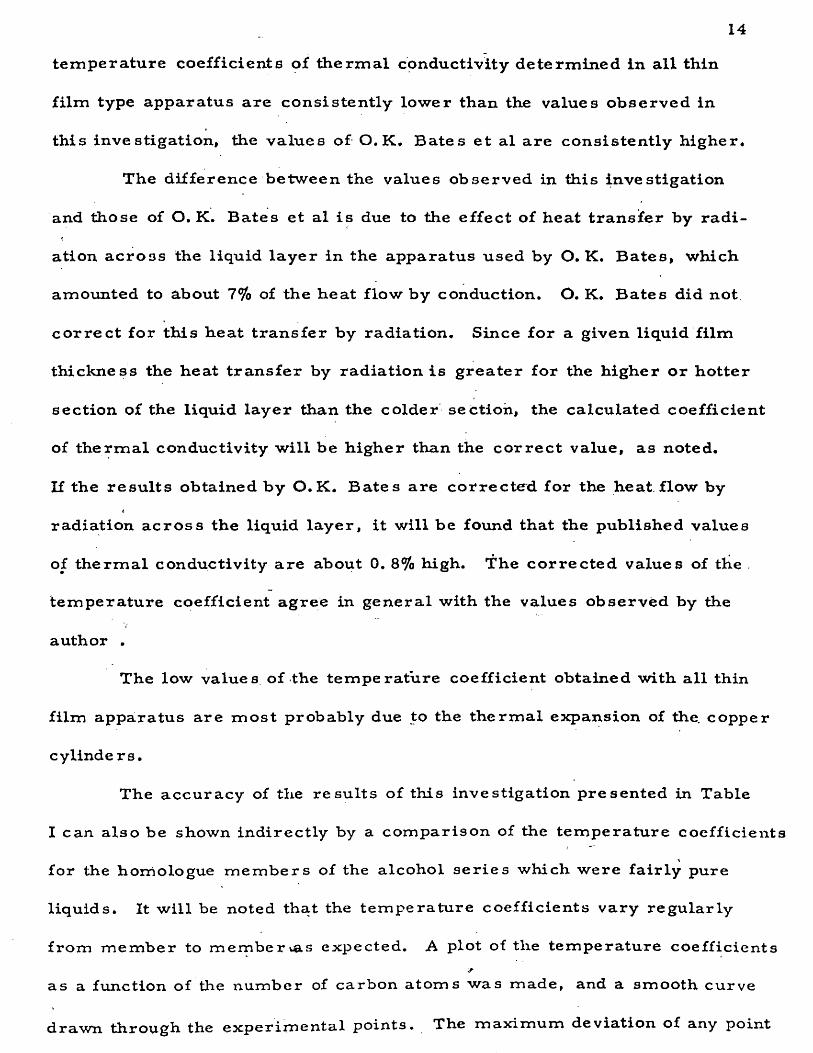
temperature coefficients of therm al conductivity determined in all thin
film type apparatus are consistently lower than the values observed in
this investigation, the values of O.K. Bates et al are consistently higher.
The difference between the values observed in this investigation
and those of O. K. Bates et al is due to the effect of heat t ransfe r by ra d i
ation across the liquid layer in the apparatus used by O.K. Bates, which
amounted to about 7% of the heat flow by conduction. O. K. Bates did not
c o r rec t for this heat t ransfe r by radiation. Since for a given liquid film
thickness the heat t ransfe r by radiation is grea ter for the higher or hotter
section of the liquid layer than the colder section, the calculated coefficient
of therm al conductivity will be higher than the co rrec t value, as noted.
If the resu l ts obtained by O.K. Bates are correc ted for the heat flow by
radiation ac ro ss the liquid layer, it will be found that the published values
of therm al conductivity are about 0. 8 % high. The correc ted values of the .
temperature coefficient agree in general with the values observed by the
author .
The low values of the temperature coefficient obtained with all thin
film apparatus are m ost probably due to the therm al expansion of the. copper
cylinde rs .
The accuracy of the results of this investigation presented in Table
I can also be shown indirectly by a comparison of the tem perature coefficients
for the homologue m em bers of the alcohol ser ies which were fairly pure
liquids. It will be noted that the temperature coefficients vary regularly
from member to member >as expected. A plot of the temperature coefficients
as a function of the number of carbon atoms was made, and a smooth curve
drawn through the experimental points. The maximum deviation of any point
from the curve was noted to be + 0.08 x 10“^ B tu /h r - f t^> (°F /f t ) /°F .
For a tem peratu re range of 74° F covered in this investigation this c o r
responds to a maximum deviation of + 0. 65% in the values of thermal
conductivity. This includes the deviation due to any impurities in the
liquids. The tem peratu re coefficients for the same liquids determined
by other investigators vary i r regu la r ly from liquid to liquid.
Correlation of Results.
The.basic conditions underlying the theory of corresponding states
have been clearly stated (2). If all the conditions are met, i t can be shown
(2 ) that two systems should exhibit corresponding behavior if they are at
i N ;the same reduced tem perature and p ressu re or volume. Most liquids
actually do not meet all the conditions. However, a corresponding states' )
behavior could a r ise unde?: some, other circumstances than those given,
although the detailed behavior would be different.\
Such a situation would arise when homologous m em bers of the same
se r ies are considered. Hence the condition that all molecules should be
spherically symm etrica l could be changed to mean a group of nonspherical
molecules having the same shape factor. This changes also the condition
that the potential energy is a function only of in termolecular distance to
a condition in which the potential energy has the same proportional depend
ence of potential on angular orientation. This permits the inclusion of
polar substances. Finally the potential function may have a different shape,
but it will be^expected to vary uniformly.
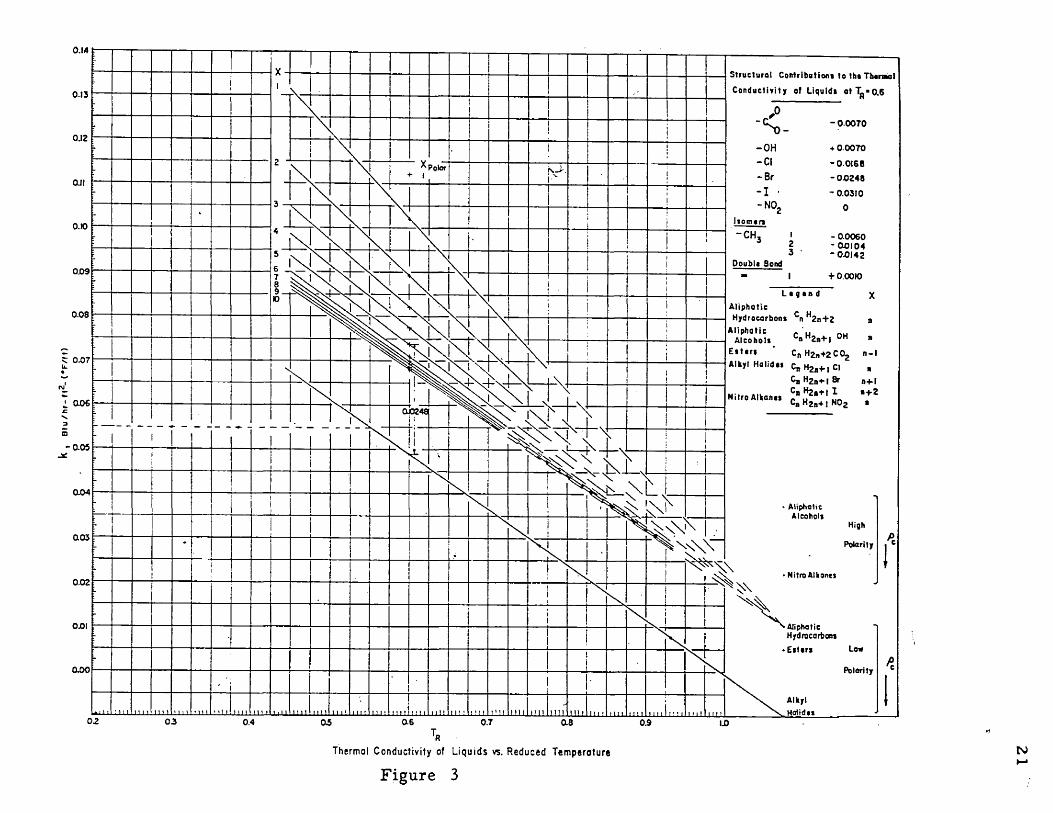
The theory of corresponding states may then be stated on a broad
basis , in a different form. The sam e.m embers of two different ser ies will
16
exhibit corresponding behavior to the same other m em bers of the ir r e
spective se r ie s , provided they are at the same reduced temperature/
and p re ssu re . Since the effect of p ressu re on therm al conductivity is
rela tively sm all ( 1), the reduced p ressu re may be omitted from the c o r
relation. Hence* a plot of therm al conductivity as a function of num
b er of carbon atoms, for the chain compounds, at the $ame reduced
tem perature should resu lt in a family of curves of s im ilar shape. Such
a plot is shown in Figure 2. As predicted, the curves are parallel and
have the same shape. The contribution to the thermal conductivity ofi K
a given functional group or atom in the molecule was determined by tak- %
ing the hydrocarbon se r ies as a basis and obtaining the difference be-
/ tween it and other se r ie s . These contributions are presented in Table 2.
J TABLE 2
Structural Contribution to the Therm al Conductivity of Liquids at T^s 0 . 6
Aliphatic alcohols — OH dk, B tu /h r - f t2 - (°F /f t) <,+ 0. 0070 *
E s te r s —- C \ -0,0070O —
Alkyl halides - C l -0.0168
— Br -0.0248
- I -0. 0310r
Nitrated Alkanes — NO2 0 ** The f i r s t m em bers of associated se r ies , such as alcohols and nitrated alkanes, have an abnormally high thermal conductivity^ However, their
• relative values are consistent with the contributions given in Table 2. Hence any member of the alcohol ser ies will differ from a corresponding mem ber of the nit ra ted alkane ser ies by 0 . 0070 B tu /h r - f t2 - (°F /f t) , in cluding methyl alcohol and nitromethane. However methyl alcohol will d if fe r more than 0. 0070 B tu /h r - f t 2 -(°F/ft) from the f irs t member of the hydrocarbon ser ies or methane.
17
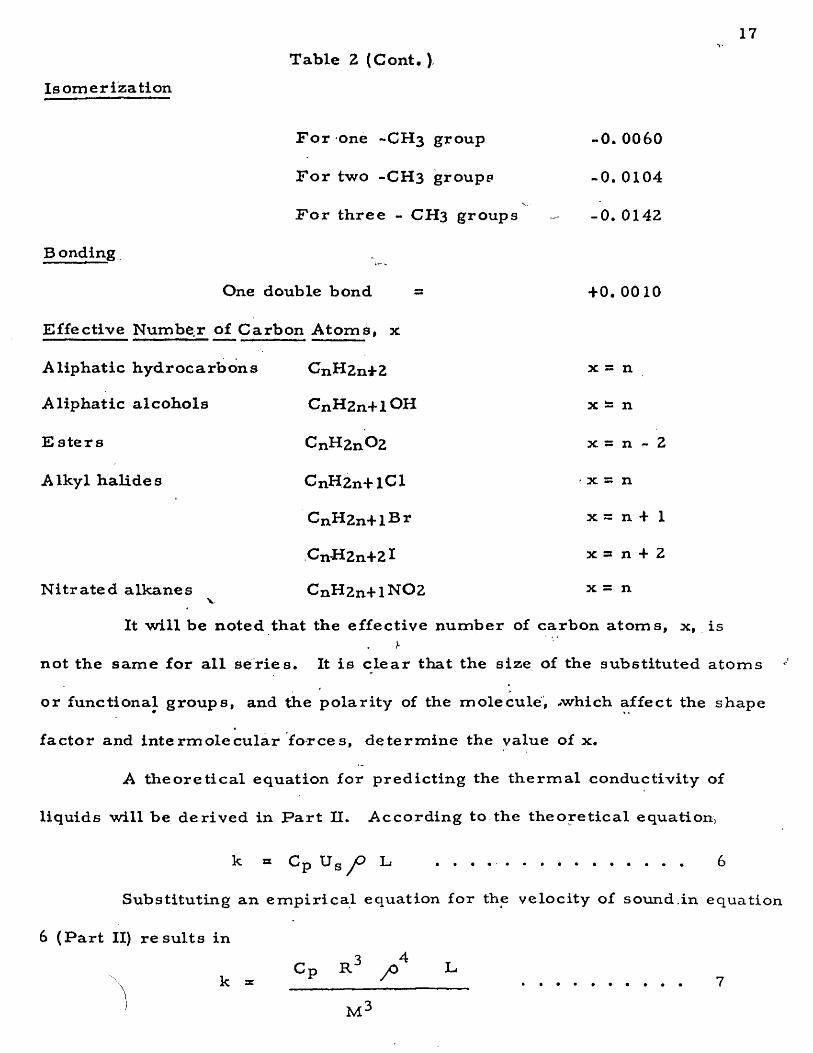
Isomerization
Table 2 (Cont. )
F o r one -CH3 group
F o r two -CH3 groups
F o r three - CH3 groups
B onding
One double bond
- 0 . 0 0 6 0
-0.0104
-0.0142
+0.0010
Effective Number of Carbon Atoms, x
Aliphatic hydrocarbons
Aliphatic alcohols
E s ter s
Alkyl halides
Nitrated alkanes
QnH2n+2
CnH2n+l OH
CnH2n02
CnH2n+lCl
CnH2n+lBr
CnH2n+2l
CnH2n-flN02
x = n
x - n
x = n - 2
x = n
x = n + l
x = n + 2
x = n
It will be noted that the effective number of carbon atoms, x, is)•
not the same for all se r ies . It is c lear that the size of the substituted atoms
or functional groups, and the polarity of the molecule", -which affect the shape
factor and in termolecular forces, determine the value of x.
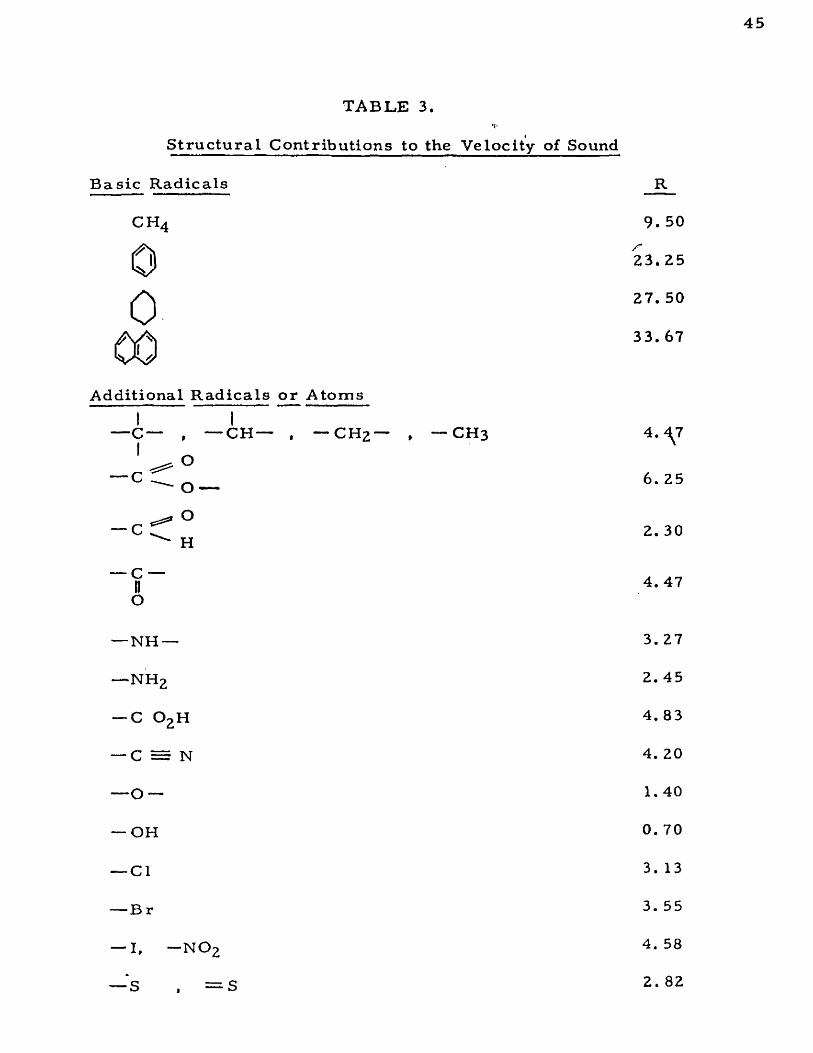
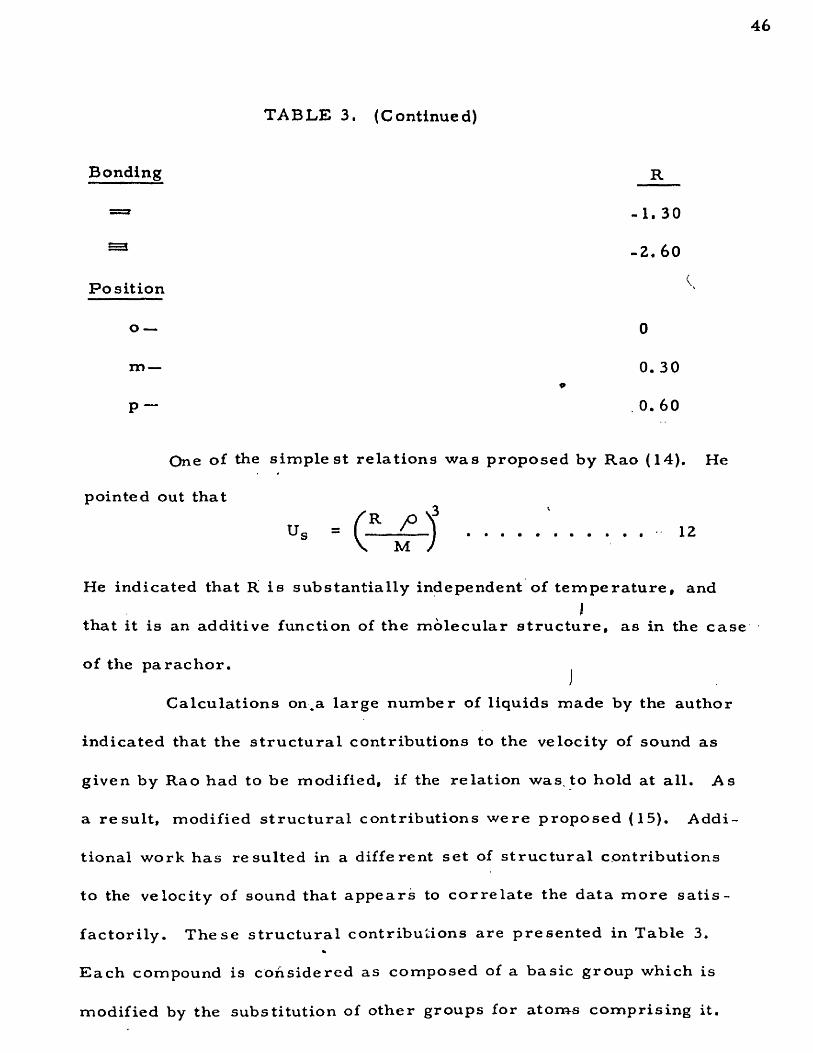
A theoretical equation for predicting the thermal conductivity of
liquids will be derived in P a r t II. According to the theoretical equation,
k = Cp Us yO L ............................................ 6
Substituting an empir ical equation for the velocity of sound.in equation
6 (Part II) resu lts in
k „ c p r 3 / L ................................................ 7
M
k, B
tu/h
r-ft
-(
°F/f
t)
at Tr
= 0.
6
18
0.15
0.14L E G E N D
A lcoho ls • Hydrocarbons a Esters Acetate □
Propionate^ Butyrate n
Alkyl Bromides*
0.13
0.12
0.11
0.10
0.0!
0.08
0.05
0 0 4
0.03
T h e r ma l Conduc t i v i t y vs. E f f e c t i v e Number of Carbon Atoms
Figure 2
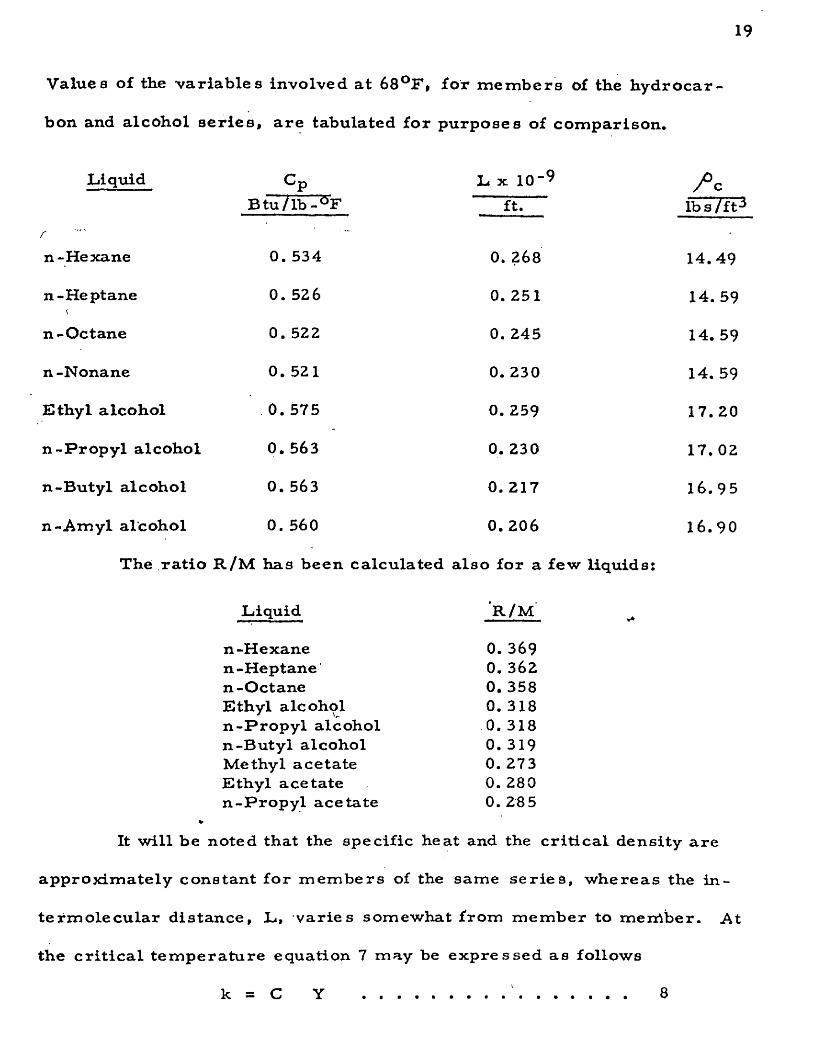
19
Values of the -variables involved at 6 8 °F, for m em bers of the hyd roca r
bon and alcohol se r ies , a re tabulated for purposes of comparison.
Liquid Cp L x 1 0 “ 9 CB tu / lb -°F ft. lb s /f
r
n-Hexane 0. 534 0 . 2 6 8 14.49
n-Heptane<
0. 526 0. 251 14. 59
n-Octane 0. 522 0. 245 14. 59
n-Nonane 0. 521 0. 230 14. 59
Ethyl alcohol 0. 575 0 . 259 17. 20
n -P ropy l alcohol 0. 563 0. 230 17. 02
n-Butyl alcohol 0. 563 0. 217 16.95
n-Amyl alcohol 0. 560 0 . 206 1 6 . 9 0
The ra t io R /M has been calculated also for a few liquids:
* Estimated values a. k = Btu/hr-ft^-{°F/ft) b. Per cent Deviation of calculated from observed values.
effective value of x will establish, the structural contribution of the
functional group in the ser ies . The thermal conductivity at any tem
perature , for any member of the ser ies , j.5 then readily determined.
The required single value may be calculated from the theoretical equa
tion presented in Par t II, in which case no experimental data are need
ed.
Summa ry
Observed values of thermal conductivity and temperature co
efficients are presented for 53 pure organic liquids. Values of thermal
conductivity or temperature coefficients for 3 1 of these liquids have
not been previously reported. It is indicated that, the best lite ra ture
values of therm al conductivity are most probably low, on account of
surface effects that were not considered in most investigations.
A method of correlating the thermal conductivity of liquids1 —
based on the theory of corresponding states has been presented, and
tested on a large number of liquids. The thermal conductivity of a
se r ies of liquids may be determined from one known value, at any one
temperature, of one of its members.
NOTATION
A = heat t ransfe r area, normal to heat flow, ft^
Cp — specific heat at constant p ressure , B tu / lb -°F
C = group of constants v-
k = thermal conductivity, B tu /hr-f t^ -(°F /f t ) ^
L# = mean available intermolecular distance, surface to surface, ft
M = molecular weight, lbs
n = number of carbon atoms
q = rate of heat flow, B tu /hr
R = resistance to heat flow, °F -h r /B tut
R = additive constant
T = absolute temperature, °R
t = temperature, °F
Us = velocity of sound, f t /sec
x = effective number of carbon atoms
x = thickness, ft
Y = group of additive factors
/> = density, lbs/ft^ ^
A t = temperature drop, °F
Z (A t) = overall temperature drop, °F
Subscripts
c = critical S = steel
L = liquid T = total
r = reduced
25
SELECTED BIBLIOGRAPHY
1. Bridgman, P. W .f Am. Acad. Arts and Sci. , 4 % 141 (1923)
2. PitzeY, K. S . , "Quantum C hem is try ," Prentice-Hall , N .Y . , 1953
3. Sakiadis, B. C . , and J . Coates, A Litera ture Survey of the Therm alConductivity of Liquids, Bui. No. 34, Eng. Exp. Station, Louisiana State University, Baton Rouge, La. ,1 9 5 2
4. Sakiadis, B. C . , and J. Coates, An Investigation of F ac to rs Affecting the Design of a Liquid Thermoconductimetric Apparatus, Bui. No. 3 5, Eng. Exp. Station, Louisiana State University, Baton Rouge, La . , 19 54
5. Sakiadis, B. C . , and J. Coates, A Thermoconductimetric Apparatusfor Liquids, Bui. No. 45, Eng. Exp. Station, Louisiana State University, Baton Rouge, L a . , 1954
6 . Sakiadis, B. C . , and J . Coates, Supplement 1 to Bui. No. 34, ALite ra ture Survey of the Thermal Conductivity of Liquids, Bui. No. 48, Eng. Exp. Station, Louisiana State University, Baton Rouge, L a . , 19 54
26
STUDIES OF THERMAL CONDUCTIVITY OF LIQUIDS
FART II
In P a r t I (16) of this se r ies , the values of therm al conduc
tivity observed in this investigation were correla ted on the basis of
a modified statement of the theory of corresponding states. This
method of correla tion perm its the calculation of the thermal con
ductivity of a se r ie s of liquids at any temperature from a single
known value of one member. Further , the c r i t ical density for any
one member must be known,' to establish a convergence point for
the se r ie s . Another constant required is the effective number of
carbon atoms which can be determined by an examination of the struc
,.ture of the m em bers of the se r ies .
This pa r t of the se r ies presents the results of an attempt to
derive a simple theoretical equation for the prediction of thermal
conductivity and its temperature coefficient, with no experimental
information.
The equation is derived on the basis of a particular molecu
la r arrangement in the liquid, consistent with the results of X-ray
diffraction studies in liquids. The equation is applicable to both
normal and associated liquids. The success of the equation in p r e
dicting the therm al conductivity of liquids justifies indirectly the a s
sumptions made in its derivation, and throws light on the mechanism
28
of heat conduction in liquids.
The equation has been tested on a large number of liquids.
The experimental data were presented in P a r t I ( 1 6 ),
Previous Work
A number of equations, mostly empirical, for predicting the
therm al conductivity of liquids have been presented. None of the
theoretical equations appears to be satisfactory. The predicted val
ues of thermal conductivity vary widely from experimental data. The
empir ical equations relating the therm al conductivity to other liquid
propert ies are little bet ter .
The theory of the liquid state has not been developed to the
point where a satisfactory equation for the therm al conductivity may
be a rr ived at without vitiating assumptions. A s a resu lt an equation
with as simplified a theoretical background as possible is desirable .
One such equation was f irs t developed by P. W. Bridgman (1 )
in 1923. He assumed that the liquid molecules were arranged in a
cubical lattice, at a distance d ft. apart, vibrating about centers,v
/ XX \ 1/ 3d = (----- M---------)V N p J
\ • —
The total energy of a molecule was taken as 3RT/N (3/2 RT/N
kinetic energy and 3/2 RT/N potential energy) or 1/2 RT/N for each
degree of freedom. This was assumed to be propagated along a row
of molecules with the velocity of sound, Us f t /sec . in the liquid.
He obtained the equation
k = 3 R ° 3 B tu /h r - f t2 -(°F/ft)N d2
Kardos (8 ) in 19 34 modified Bridgman’s equation to avoid
specifying the amount of molecular energy. He considered an en
ergy drop between adjacent molecular surfaces. Further , he sub
stituted the distance, L, between the surfaces of adjacent molecules
instead of the distance, d, of their centers. He arrived, by a r e a
soning s imila r to that of Bridgman, to the following relation
k s L Us ^ Cp
He recommended that L be taken as a constant equal to 3. 1Z x 10"*^
The therm al conductivity of 6 liquids selected at random was
calculated using Bridgman’s and Kardo’s equations. The maximum
deviation of the calculated from the observed values of therm al con
ductivity was found to be + 40%. This indicates that the equations
are satisfactory only in predicting the right order of magnitude for
the thermal conductivity.
The theoretical equation proposed by Kardos will be derived
once more on the basis of recent developments, and methods for de
termining the variables involved given. It will be shown that, when
the variables involved a re properly evaluated, the predicted values
of therm al conductivity agree well with the values of thermal conduc
tivity observed in. this investigation.
30
Basic Concepts. The liquid state differs from the gas state
in that the individual molecules are affected considerably by the p r e s
ence of the ir neighboring molecules. It differs from the solid state
in that the molecules hava a certain degree of freedom On the m a c ro
scopic scale. The setting up of a temperature gradient across a
liquid layer should resu l t in the formation of isothermal planes of liq-*
uid molecules having the same mean energy. This arrangement will
cause the molecules to move in the direction of heat flow only* Due
to the large inte rmolecular forces existing in the liquid state, only a
small fraction of the total energy is t ransfe rred by individual mole
cules over relatively long distances. The greater part of*energy
t ran s fe r takes place by the distant action of neighboring molecules,
much in the same way that mechanical motion is t ransfe rred from point
to point along a vibrating network of spheres connected by springs. F u r
ther, as a good approximation, it can be assumed that, on the average,
the energy t ra n s fe r re d in a given time by a molecule moving freely
in the direction of heat flow is equal to that t ransfe rred by a molecule
vibrating about a mean position during the same time. This simplified
model is substantially in agreement with the "cybotactic sta te11 p ro
posed by G. W. Stewart and co-workers (17, For other references
see files Dept, of Chemical Engineering) for isothermal conditions.I
G. W. Stewart attr ibutes a ’’m icro-crysta l l ine" s tructure to a liquid
by assuming the presence of a large number of "cybotactic
31
g roups .” These groups are not permanent and do not have sharp
boundaries as in a crystal. Rather, over any appreciable time,
there are a g rea te r number of these groups than of groups having
completely disordered arrangement. The more elongated the mole
cule, as in a chain, the better the arrangement within the groups.
The existence of a temperature gradient in a liquid layer should
favor such an internal molecular arrangement.
Consider the case of a long chain hydrocarbon liquid, such .
as n-Heptane (Similar considerations apply to different shaped mole-
cules). The molecules in the liquid layer are oriented end to end
on long chains on a two dimensional pattern. The chains or layers
repeat-themselves throughout most of the liquid layer. Occasionally
some chains are disordered by molecules assuming different o r ien
tation. Some groups may be broken up and new ones formed. The
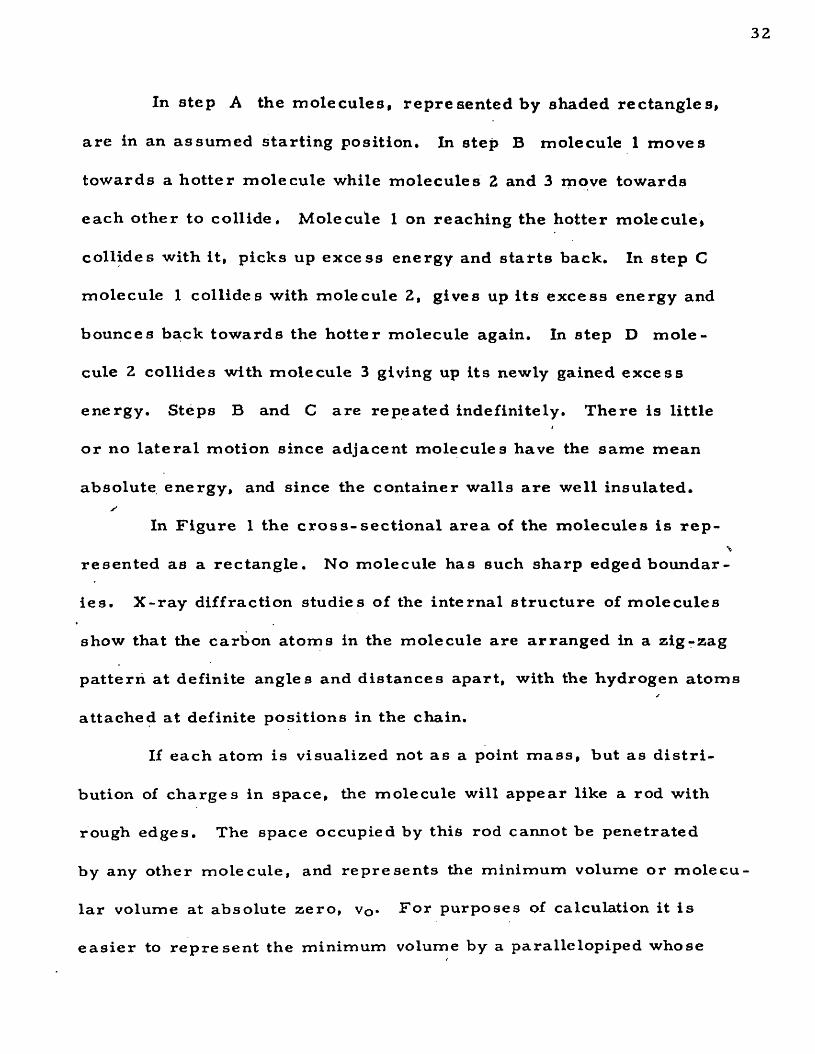
process of heat conduction may be visualized as shown in Figure 1.
t i > t 2
I—I
l Z
r
D
Figure 1
^999999
32
In step A the molecules, represented by shaded rectangles,
are in an assumed starting position. In step B molecule 1 moves
towards a hotter molecule while molecules 2 and 3 move towards
each other to collide. Molecule 1 on reaching the hotter molecule,
collides with it, picks up excess energy and s tar ts back. In step C
molecule 1 collides with molecule 2 , gives up its excess energy and
bounces ba.ck towards the hotter molecule again. In step D m ole
cule 2 collides with molecule 3 giving up its newly gained excess
energy. Steps B and C are repeated indefinitely. There is little
or no la tera l motion since adjacent molecules have the same mean
absolute energy, and since the container walls are well insulated.s
In Figure 1 the c ross-sec t ional a rea of the molecules is rep -
resented as a rectangle. No molecule has such sharp edged boundar
ies. X-ray diffraction studies of the internal s tructure of molecules
show that the carbon atoms in the molecule are arranged in a zig-zag
pattern at definite angles and distances apart, with the hydrogen atoms
attached at definite positions in the chain.
If each atom is visualized not as a point m ass, but as d i s t r i
bution of charges in space, the molecule will appear like a rod with
rough edges. The space occupied by this rod cannot be penetrated
by any other molecule, and represents the minimum volume or m olecu
lar volume at absolute zero, vQ- For purposes of calculation it is
e as ie r to represen t the minimum volume by a parallelopiped whose
33
/
height and width, d, equals the d iam eter of the rod. The c ross s e c
tion of the molecule then may be represented by d rectangle as in F ig
ure 1 .
At the absolute zero the m olar volume, V0, is simply the sum
of the minimum molecular volumes or.
As the tem perature inc reases , the molecules begin to vibrate and the
m olar volume inc reases . The difference between the molar volume,
V, at a given tem pera tu re , and that at absolute zero is simply empty
space within which the molecules move. As a consequence of the a s -\
sumption made above, that the molecules vibrate about fixed equili
brium positions, the available volume, Va a V - V0» will be distribut
ed around the minimum molecular volume, as shown in Figure 1 by
dotted lines. It is c lear therefore that according to the suggested
mechanism of heat conduction, the significant in termolecular distance
is the available distance between the molecular surfaces, L, and not/*
the molecular d iameter d.
Derivation of Equation. Consider an energy drop of
(d-T)per molecule along a row of molecules in the direction of heat flow,
where x = d + L».
Assuming that heat is t ransmit ted through the liquid with a velocity
34
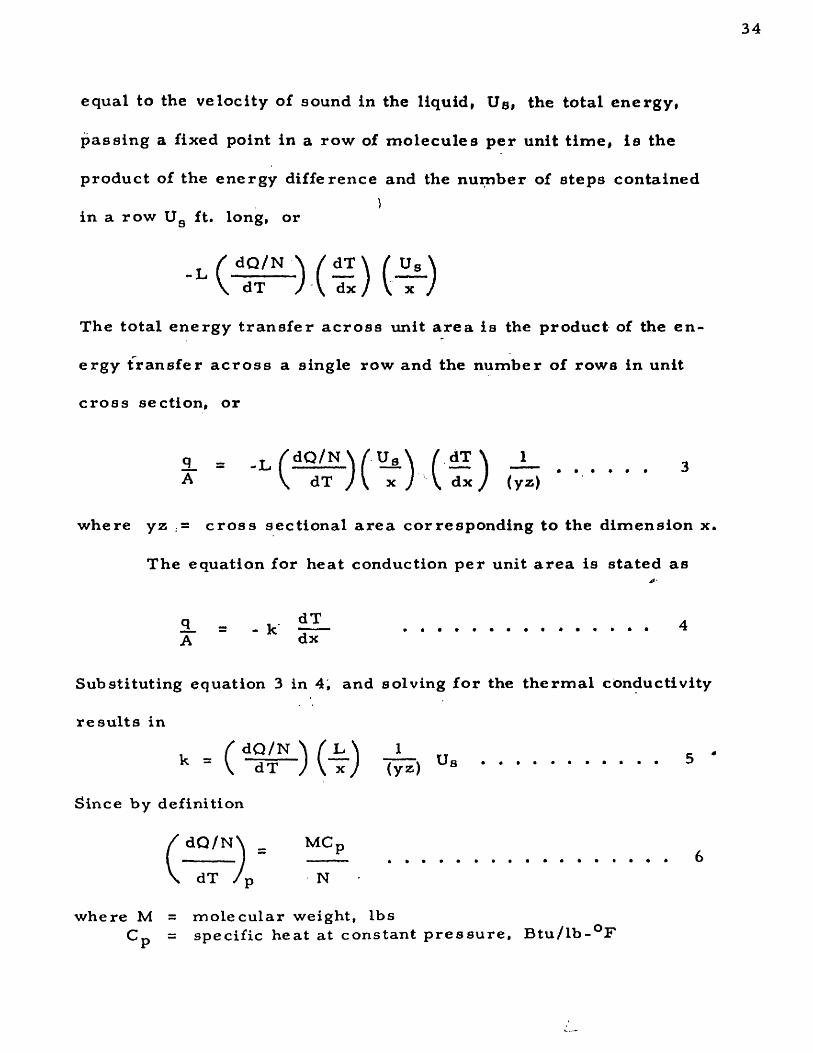
equal to the velocity of sound in the liquid, Us, the total energy,
passing a fixed point in a row of molecules per unit time, is the
product of the energy difference and the number of steps contained)
in a row U9 ft. long, or
-L cm (£) m
The total energy transfe r across unit a rea is the product of the e n
ergy transfe r across a single row and the number of rows in unit
cross section, or
a. = ( - H \ J L ............... 3A \ dT / \ x J \ d x J (yz)
where yz .= c ross sectional a rea corresponding to the dimension x.
The equation for heat conduction per unit a rea is stated as
3_ = - k « 4A dx
Substituting equation 3 in 4, and solving for the thermal conductivity
resu lts in
( dQ/N ^ f L , \ 1k = \ dT A x / (yz) Us ............................................
Since by definition
/ dQ /N \ = MCp
\ dT / p N
where M = molecular weight, lbs
pCD = specific heat at constant p ressure , B tu / lb -°F
35
Also the molecular volume, v, Is
Myzx =yON
where yO = liquid density, lb s / f t3.
Substituting equations 6 and 7 in 5, and cancelling te rm s, results in
k = Cp Us p L. ............................................................. 8
where Cp = Specific heat at constant p ressure , B tu / lb -°FUs = velocity of sound in the liquid, f t /h r
p = liquid density, lb s / f t3 L» s available intermolecular distance, ft.k = therm al conductivity of liquid, Btu/hr-ft^-(OF/ft)
The significance of the inte rmolecular distance L will be shown by
considering the case of n-Heptane.
n-Heptane at 6 8 °F .
Data. k = 0.0767 B tu /h r-f t^ -(°F /f t) , value observed in this in vestigation
Cp = 0. 526 B tu / lb -°Fp a 42. 60 lb s / f t3 U8 = 1. 364 x 107 f t /hr .
Substituting the given data in equation 8 , and solving for JL results
in Li = 0.251 x 10"^ ft.
X-ray diffraction studies by G. W. Stewart and co-workers
have shown that the d iameter of the heptane molecule at about 6 8 °F
q ' ois 1.77 x 10 ~ y ft ( 5. 40 A ). This diameter actually corresponds to
the dimension x shown in Figure 1, or
, d + L = 1. 77 x 10- 9 ft.
It was stated above that the - mole cular volume for heptane may be taken
as a parallelopiped, or:
36
NV = v * ..............................9
v = /o n = (d + L) y z .................................................7aand M
?
where since z = x = d + L
v = (d + L)2 y ............................................................... 7b
Substituting values in equation 7a, results in
, 1 x ^ 7 3 xY62<> “ 8.61 x 10*27 ft3
and 8 . 61 x 1 0 ” 27 _oy a --------;--------------- = 2.752 x 10 7 ft
(1. 77 x 10" 9 ) 2
It will be shown in the Appendix that the dimension y is actually
equal to the molecular length 1 , or in other words there is no avail
able volume between the ends of the molecules in a given layer, as
if the molecules we re arranged in long continuous chain. If the in-
termolecular distance L is the only available distance, it should be
Lpossible to calculate the minimum molecular volume at absolute zero
as follows
v o -* ’J 2
Hence
v0 -* d 1 10
v,
d = 1. 77 x 10‘ 9 - 0.251 x 10’ 9 = 1. 519 x 10 ' 9 ft.
o a ( 1.519 x 10“9 ) 2 (2.752 x 10⁻⁹ ) = 6 . 35 x 10- 2 7 f t3*
If the density at absolute zero is available, the obtained answer can
be checked. However the results can be checked by a different method
if the cri tical djensity is known. For n-Heptane, yOc = 14. 58 lbs /f t .
37
The cri tical vblume is next calculated by equation 7, or
vc = ---------L °0^0------- 6 . 25.2 x 10⁻²⁷ ft30 14.58 x 2.73 x lO20
The ratio of the c r i t ica l volume to the volume at absolute zero is
* Estimated valuesa. Per cent deviation of calculated from observed values of thermal conductivityb. For methyl and ethyl alcohol, nitromethane and nitroethane, the molecular length is much
smaller than the diameter, and a different molecular arrangement becomes necessary
u>v O
40
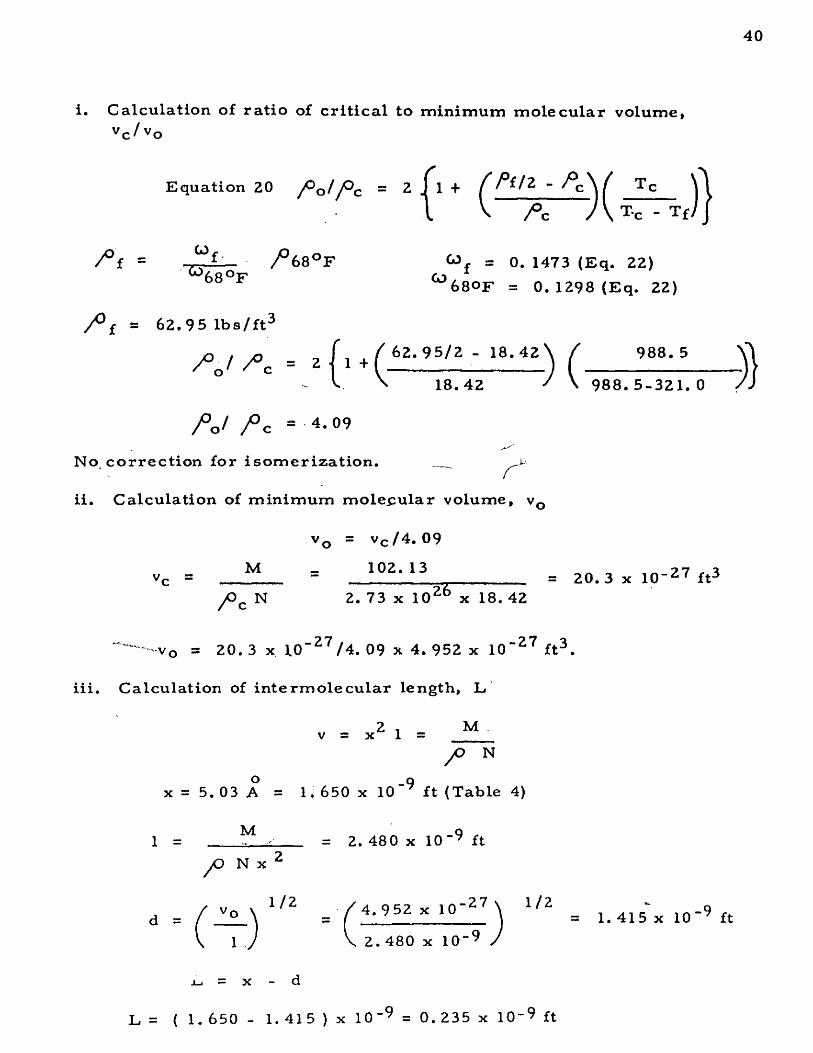
i. Calculation of ratio of cri tical to minimum molecular volume,vc/vo
Equation 20
/ ° f = / >68°F = 0. 1473 (Eq. 22)CO/loOtt O
68°F = 0. 1298 (Eq. 22)
/ ° f = 62.95 lb s / f t3
/ V ^ c ■ 2 ( 1 - l8- 42 ')° - v \ 18.42 ' \ 988. 5-321. 0 / J
A . / A c = 4 - 0 9
No. correction for isomerization.
oii. Calculation of minimum molecular volume, v
vo = vc /4. 09
M _ 102. 13 27 r 3vc = " = 20. 3 x 10 ft^y O c N 2. 73 x 1026 x 18. 42
-v0 = 2 0 . 3 X 1 0 ' 2 7 / 4 . 09 X 4 . 9 5 2 X 1 0 ' 27 f t 3 .
iii. Calculation of inte rmolecular length, L
2 i Mv = x 1 =
A N
° -9x = 5.03 A = 1. 650 x 10 7 ft (Table 4)
1 = M - - = 2. 480 x 10“9 ftyO N x 2
d = / I ^ \ 1/Z = / 4.952 x 10⁻²⁷ \ ^ 2 = 1<415' x 10-9 ft
V 1 J \ 2.480 x 10⁻⁹ J_i_i = x - d
L = ( 1. 650 - 1.415 ) x 10-9 = 0 . 2 3 5 x 1 0 - 9 ft
41
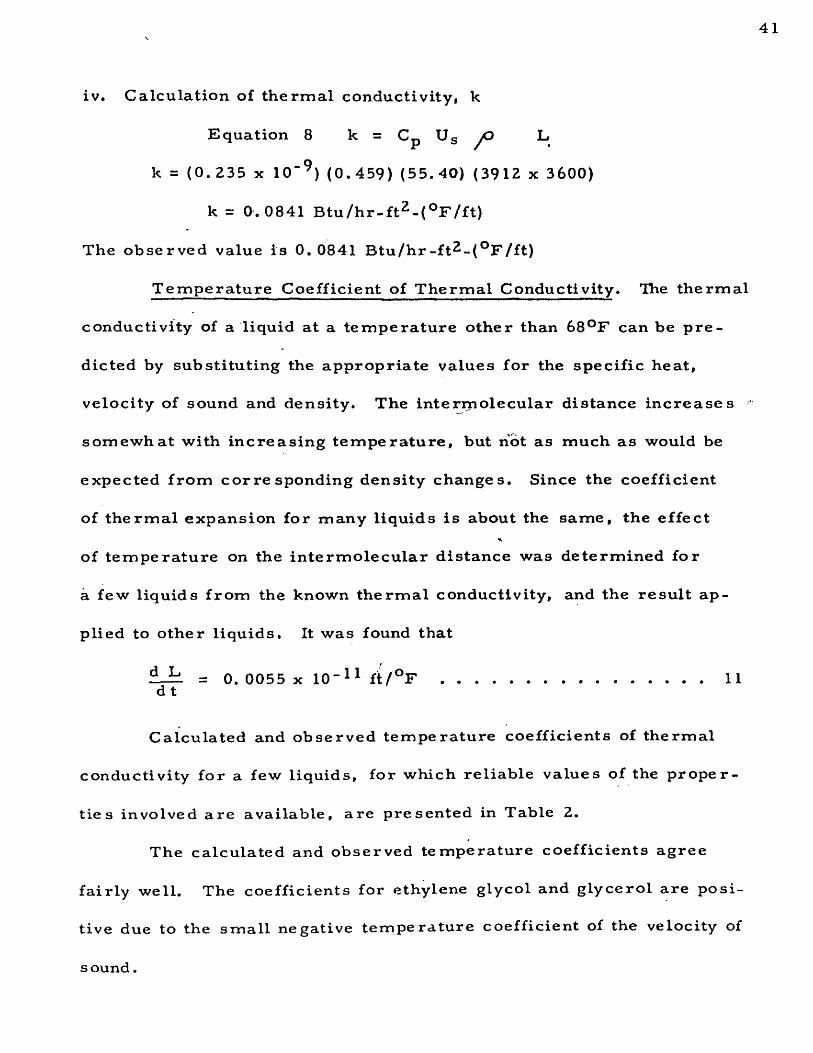
iv. Calculation of thermal conductivity, k
Equation 8 k = Cp Us J O L
k = (0.235 x 1 0 '9) (0.459) (55.40) (3912 x 3600)
k = 0.0841 B tu /h r - f tZ-(°F/f t)
The observed value is 0. 0841 B tu /h r- f t^ - (°F /f t )
Temperature Coefficient of Thermal Conductivity. The thermal
conductivity of a liquid at a temperature other than 68°F can be p r e
dicted by substituting the appropriate values for the specific heat,
velocity of sound and density. The inte rmolecular distance increases
somewhat with increasing tem perature , but not as much as would be
expected from corresponding density changes. Since the coefficient
of thermal expansion for many liquids is about the same, the effect
of temperature on the in termolecular distance was determined for
a few liquids f rom the known thermal conductivity, and the result ap
plied to other liquids. It was found that
fLil = 0. 0055 x 10-11 f i / ° F .......................................................................11d t
Calculated and observed temperature coefficients of thermal
conductivity for a few liquids, for which reliable values of the p ro p e r
ties involved are available, are presented in Table 2.
The calculated and observed temperature coefficients agree
fairly well. The coefficients for ethylene glycol and glycerol are posi
tive due to the small negative temperature coefficient of the velocity of
s ound.
42
T A B L E 2.
C alculated and Observed Temperature Coefficients of Thermal Conductivity dk/dt x IQ-4, B tu /h r - f t2 - (°F /f t) / °F
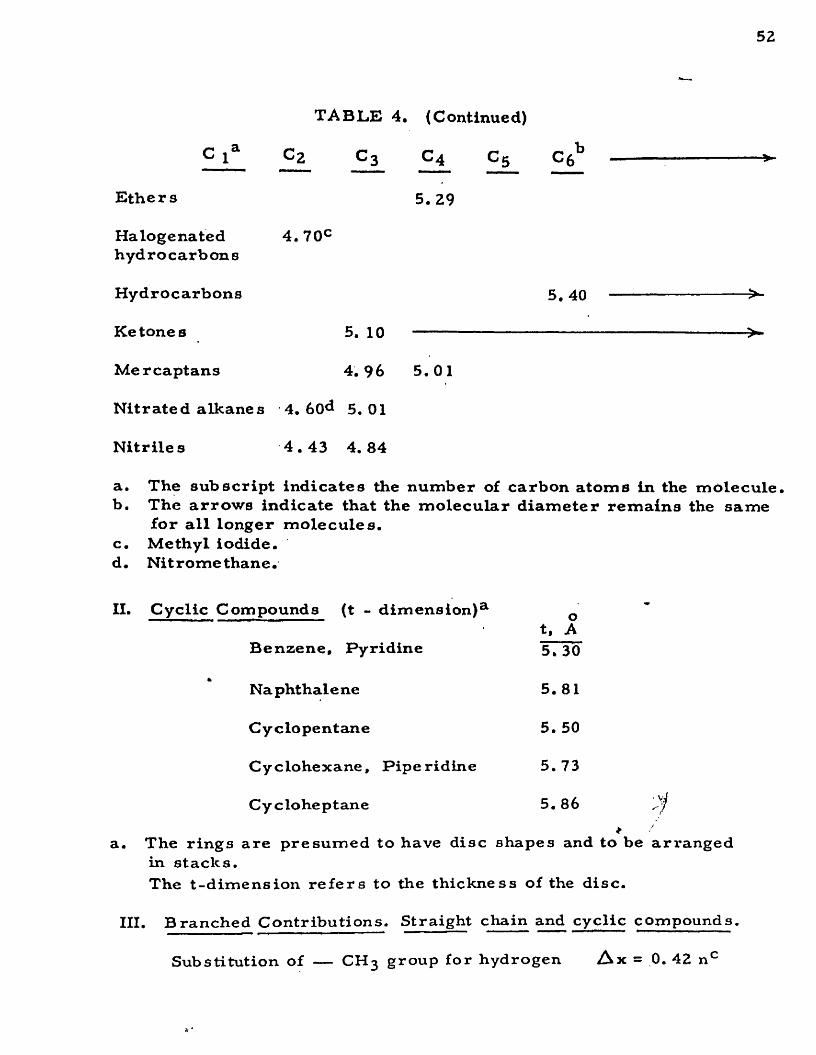
a. The subscript indicates the number of carbon atoms in the moleculeb. The arrows indicate that the molecular diameter remains the same
for all longer molecules.c. Methyl iodide.d. Nitrome thane.
II. Cyclic Compounds (t - dimension)3.
Benzene, Pyridine
ot, A 5. 30
*Naphthalene 5. 81
Cyclopentane 5. 50
Cyclohexane, Piperidine 5. 73
Cyclo heptane 5. 8 6 r* '
a. The rings are presumed to have disc shapes and to be a r in stacks.The t-dimension re fe rs to the thickness of the disc.
III. Branched Contributions. Straight chain and cyclic compounds,
Substitution of — CH3 group for hydrogen A x = 0. 42 nc
53
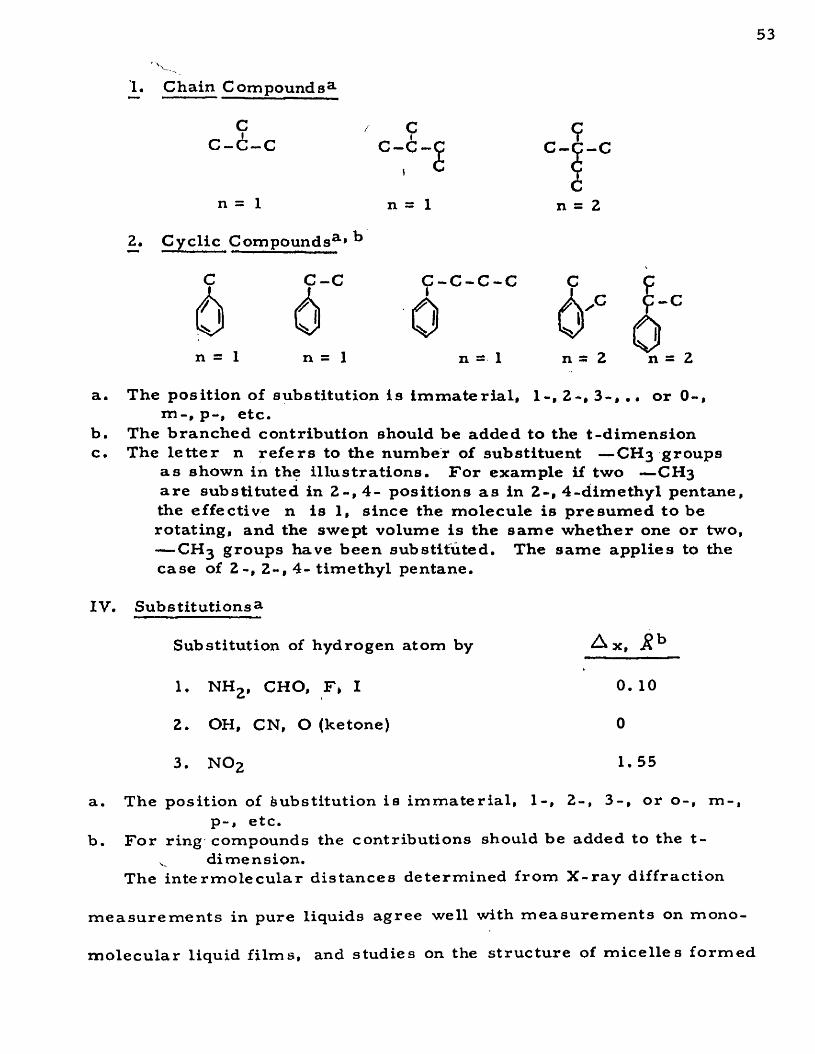
1. Chain Compoundsa
C c cC - C - C C - C - C c - c - c
n = 1 n = 1 n = 2
2_. Cyclic Compounds3'* ^
C C -C C - C - C - C cC - C - C - C c c
6 6’° An = 1 n = l n = 1 n - 2 "n = 2
a. The position of substitution is immateria l, 1-, 2-, 3-, . . or 0-,m p-, etc.
b. The branched contribution should be added to the t-dimensionc. The le t te r n re fe rs to the number of substituent —CH3 groups
as shown in the illustrations. For example if two —CH3 are substituted in 2-, 4- positions as in 2-, 4-dimethyl pentane, the effective n is 1 , since the molecule is presumed to be rotating, and the swept volume is the same whether one or two, ——CH3 groups have been substituted. The same applies to the case of 2-, 2-, 4- timethyl pentane.
IV. Subs titutions a
Substitution of hydrogen atom by ^ x, j?*3
1. n h 2, CHO, F» I 0.10
2. OH, CN, O (ketone) 0
3. N0 2 1.55
a. The position of Substitution is immateria l, 1-, 2-, 3-, or o-, m-,p-, etc.
b. For ring compounds the contributions should be added to the t-dimension.
The in termolecular distances determined from X-ray diffraction
measurements in pure liquids agree well with measurements on mono-
molecular liquid films, and studies on the structure of micelles formed
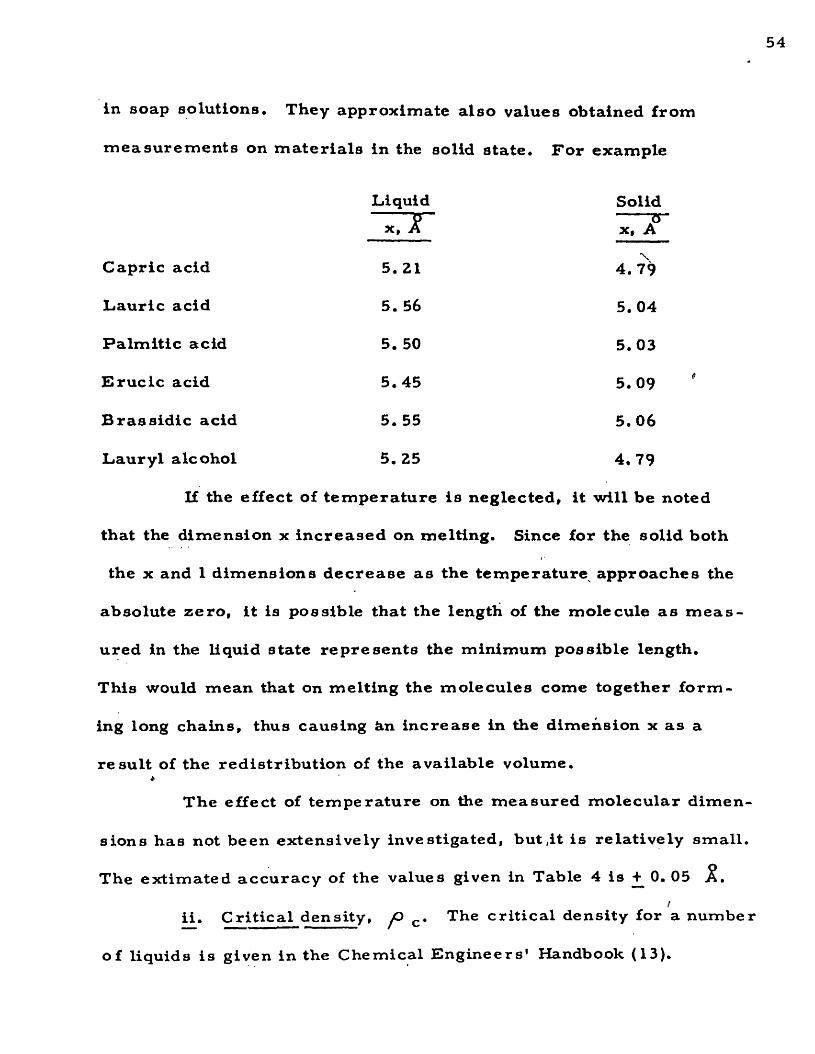
in soap solutions. They approximate also values obtained from
m easurem ents on m ateria ls in the solid state. For example
Liquid
X.Jf
Solid
x, £
Capric acid 5. 21 4. 79
Laurie acid 5. 56 5.04
Palmitic acid 5. 50 5.03
E ruc ic acid 5.45 5. 09
Brass id ic acid 5. 55 5.06
Lauryl alcohol 5. 25 4.79
If the effect of tem perature is neglected* it will be noted
that the dimension x increased on melting. Since for the solid both
the x and 1 dimensions decrease as the temperature approaches the
absolute zero, it is possible that the length of the molecule as m e a s
ured in the liquid state represents the minimum possible length.
This would mean that on melting the molecules come together fo rm
ing long chains, thus causing an increase in the dimension x as a
result of the redistr ibution of the available volume.4
The effect of temperature on the measured molecular dimen
sions has not been extensively investigated, but,it is relatively small
The extimated accuracy of the values given in Table 4 is 0. 05i
ii. Critical density, yO c . The critical density for a numbe
of liquids is given in the Chemical Engineers' Handbook (13).
55
Additional values may be found in the collection of Physico-Chemical
constants (20). For other liquids the method of Generalized Liquid
Densities by Watson (23) is recommended.
iii. Ratio of c r i t ical to minimum molecular volume, vc / vo>
A number of empirical methods (6 , 10, 18, 19) have been proposed
for determining the molecular volume at absolute zero. A method
based on the law of Rectilinear Diameter will be presented here .
According to the law of Rectilinear Diameter, the a r i th
metical average of the densities of a pure unassociated liquid and
its saturated vapor (orthobaric densities) is a linear function of the
temperature . In equation form
- ( P L + / ’ g ) = a - bT ..................... 162
Although not exact, this relation is quite accurate for many
substances and provides a very useful method for calculating the
crit ical density, a quantity not readily measureable.
At the absolute zero equation 16 reduces to
A P o = a .......................................................................... 172 '
At the freezing point the density of the vapor is very small
and may be neglected, so that equation 16 reduces to
1 p t = a - b Tf 18
Q
At the cri t ical temperature the density of the vapor and liq
uid is the same so that equation 16 reduces to
56
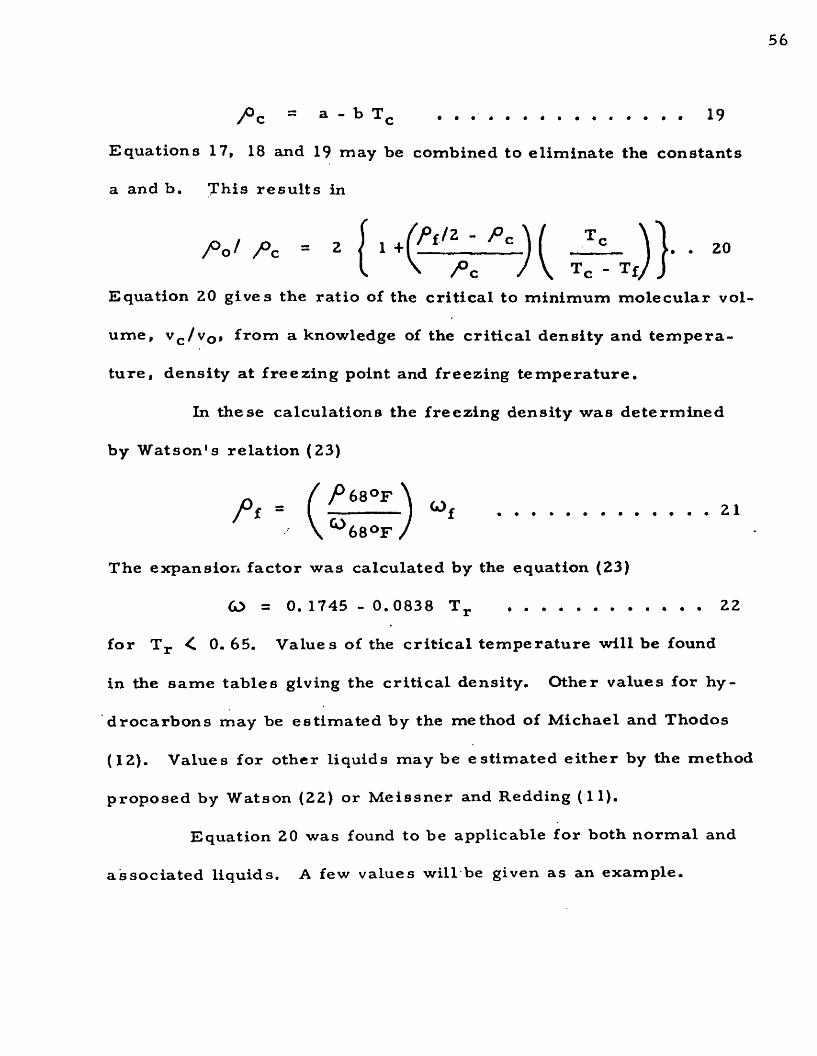
/>c = a “ b Tc 19
Equations 17, 18 and 19 may be combined to eliminate the constants
a and b. This resu lts in
Equation 20 gives the ratio of the cri tical to minimum molecular vol
ume, vc /v0, from a knowledge of the crit ical density and tem pera
ture , density at freezing point and freezing temperature .
In these calculations the freezing density was determined
by Watson's relation (23)
for Tr 0. 65. Values of the cr i t ical temperature will be found
in the same tables giving the crit ical density. Other values for hy
drocarbons may be estimated by the method of Michael and Thodos
(12). Values for other liquids may be estimated either by the method
proposed by Watson (22) or Meissner and Redding (11).
Equation 20 was found to be applicable for both normal and
associated liquids. A few values will be given as an example.
. 20
P 6 8 °F21
The expansion factor was calculated by the equation (23)
Cl> = 0. 1745 - 0.0838 Tr 22
57
Liquid Method of Measurement vc / yo obs. yc / yo calc.(Eq. 20)
n-Pentane Densitya 3. 80 3. 82
Ethyl alcohol Gas Law 4. 02 3.94
Ethyl alcohol Comp re ssibility^ 4. 10 3.94
Ethyl ether Comp re ssibility*5 3. 91 3.89
a. The lowest density measured was 47. 9 lbs/f t^ at 246°R. ^This ¥val- ue was extrapolated to 0°R.
b. The volume at the absolute zero may be regarded as given by the limiting volume of a liquid under infinite p ressure , which can be calculated from the compressibility. In the case of liquids, at 68°F and 11,600 atms. the reduction in volume is about 30%.Hence the density at 0°R is obtained by y^68°F, latm^ 0.70.
NOTATION
A = heat t ransfer area, normal to heat flow, ft^
a = a constant
b = a constant*
Cp = specific heat at constant p ressu re , B tu / lb -°F
d = mean in termolecular distance, center to center, ft.
d = molecular diameter, ft.
k - therm al conductivity, B tu /h r-f t2 -(°F /f t )
L = mean intermole cular distance, surface to surface, ft.
1 = molecular length, ft.
M = molecular weight, lbs.
m = ra tio of crit ical to minimum molecular volume
N = Avogadro* s number, Z.73 x 1 0 ^ molecules/ lb mole
n = effective branching contribution
n = integer representing the order of diffraction
Q = therm al energy, Btu
q = rate of heat flow, Btu /hr
R = gas constant, 1.987 Btu/lb rffble^R
R = additive constant
s = intermole cular distance, R
T = absolute temperature , °R
t = temperature , °F
t = molecular thickness, ring molecules only, ft.
59
Ug = velocity of sound, f t /sec .
V = molar volume at a given temperature, ft^/lb mole
v = molecular volume at a given temperature, ft^/molecule
x = distance along X axis parallel to the direction of heatflow, ft.
x = sum of molecular diameter and mean intermolecuiar distance, d + L, ft.
x = thickness, ft.
y distance along Y axis, parallel to the molecular length,perpendicular to the direction of heat flow, ft.
z = distance along Z axis, perpendicular to the molecularlength, perpendicular to the cf&ection of heat flow, ft.
Greek-Symbols
JD = density, lbs/ft^
v °A = wavelength of incident radiation, A
= scattering angle at maximum scattering intensity, degrees
dt = temperature drop, 0F*
CO = expansion factor
Subsc ripts
a = available
c = cr it ical
f ss freezing point
G = gas or vapor
L = liquid
o = absolute zero
60
p = p ressu re
r a reduced
Conversion factor:
1 A = 3. 28 x 10"10 ft.
1
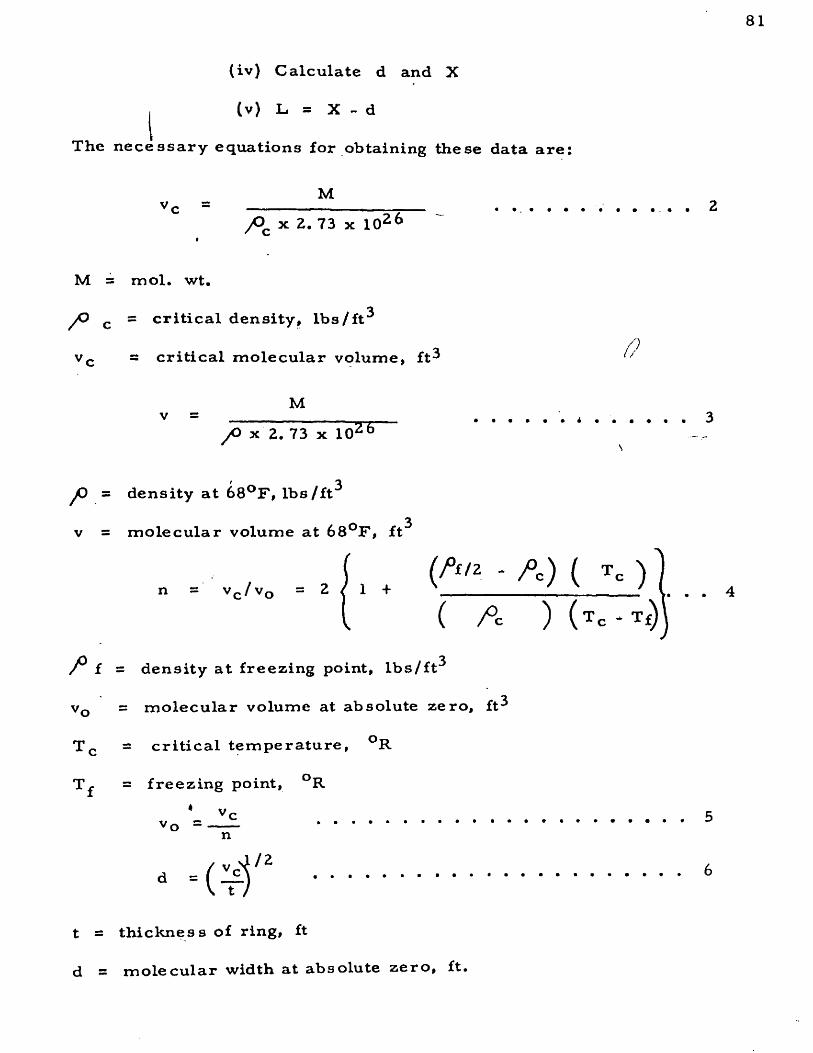
2
3
4
5
6
7
8 ,
9.
1 0 .
1 1 .
1 2 .
13.
14.
15.
SELECTED BIBLIOGRAPHY
Bridgman, P. W. , Am. Acad. Arts and Sci. , 4 % 141 (1923)
Chow, W. M. , arid J. A. Bright, J r . , Chem. Eng. P rogress ,49, 175 (1953)
Compton, A. H. , and S. K. Allison, "X-Rays," 2 nd Ed. , D. Van Nostrand, N. Y. , 1951.
Debye, P . , and H. Menke, Forts , d. Rontgenforschung, 2, 1 (1931)
Freyer , E. B . , J. C. Hubbard, and D. H. Andrews, J. Am. Chem. Soc., 5_1_, 7 59 (1929)
Herz, Z. anorg. Chem., 153, 269 ( 1926)
Hougen, O. A. , and K. M. Watson, "Chemical P rocess Principles, " P a r t II, John Wiley, N. Y. , 1948
Kardos, A., Forschg. Ing. Wes., 5, 14 (1934)
Lagemann, R. T. , D. R. McMillan J r . , and W. E. Woolf, J.Chem. Phys. 17_, 369 (1949)
LeBas, J. Phys. Chem., 46, 380 (1942)
Meissner, H. P . , and E. M. Redding, Ind. Eng. Chem., 34, 521 (19420
Michael, G. V., and G. Thodos, Chem. Eng. P rogress SymposiumSeries, 49, No. 7, 13 1 ( 1953)
P e rry , J. H. , "Chemical Engineer's Handbook," 3rd Ed. , McGraw- Hill, N. Y.» 1950 i
Rao, R. , Current Science, 9, 534 ( 1940); Indian J. Phys. , 14,109 (1940), J. Chem. Phys., 9, 682 (1941)
Sakiadis, B. C ., and J. Coates, A Literature Survey of UltrasonicVelocities in Liquids and Solutions, Bui. No. 46, Eng.E^cp. Station, Louisiana State University, Baton Rouge,L a . , 1954
61
62
16.
17.
18.
19.
2 0 .
2 1 .
2 2 .
23.
24.
Sakiadis, B. C. , and J. Coates, Studies of Thermal Conductivity of Liquids, P a r t I. Paper presented at the December Meeting of A. I. Ch. E, N. Y. , 1954
Stewart, G. W. , and R. M. Morrow, Phys. Rev., 30, 232 (1927)
Sugden, J . Chem. Soc. , 1780, 1786 ( 1927)
Telang, Current Science, 1 1, 461 (1942).
Tim mermans, J. , "Physico-Chemical Constants of Pure Organic Compounds, " E lsev ie r Book Co. , N .Y ., 1950
Tsien, H. S., J. Am. Rocket Soc. , 23, 17, 35 (1953)
Watson, K. M. , Ind. Eng. Chem., 23, 360 (1931)
Watson, K. M. , Ind. Eng. Chem., 35, 398 (1943)
Zernicke, F. , and J. A. Prins , Z. Phys . , 41, 184 (1927)
\
STUDIES OF THERMAL CONDUCTIVITY OF LIQUIDS
PART in.
This pa r t of the se r ie s presents the results of a continuing
study of the thermal conductivity of liquids and associated phenomena.
The experimental apparatus was described in P a r t I, where the r e
sults of tes ts on 53 pure organic liquids* chain type compounds* were
reported. In this part* the study was extended to new type compounds*
in part icu lar to cyclic compounds, aromatics and naphthenes* withs .
side chains.
The data were correla ted with the two methods previously p r o
posed in P a r ts I and II. These methods represent different approaches
to the problem. The method involving the theoretical equation throws4
light on the effect of molecular s tructure on thermal conductivity. The
method involving a correla tion of thermal conductivity as a function of
reduced temperature emphasizes the effect of the functional atom or
group in the molecule.
It was considered important also to investigate the variation
of thermal conductivity with temperature in the regions close to the
boiling and freezing points. The results of the study of the region close
to the freezing point, are direct evidence of a new kind in support of
the relatively recent idea on the existence of a transition temperature
or transition phases in the liquid state.
63
64
Experimental. The thermoconductimetric apparatus used
in this study was described in detail in ear l ie r publications (9* 10),
where the results of a number of tests were also presented* The
experimental procedure and method of calculation remain unchanged.
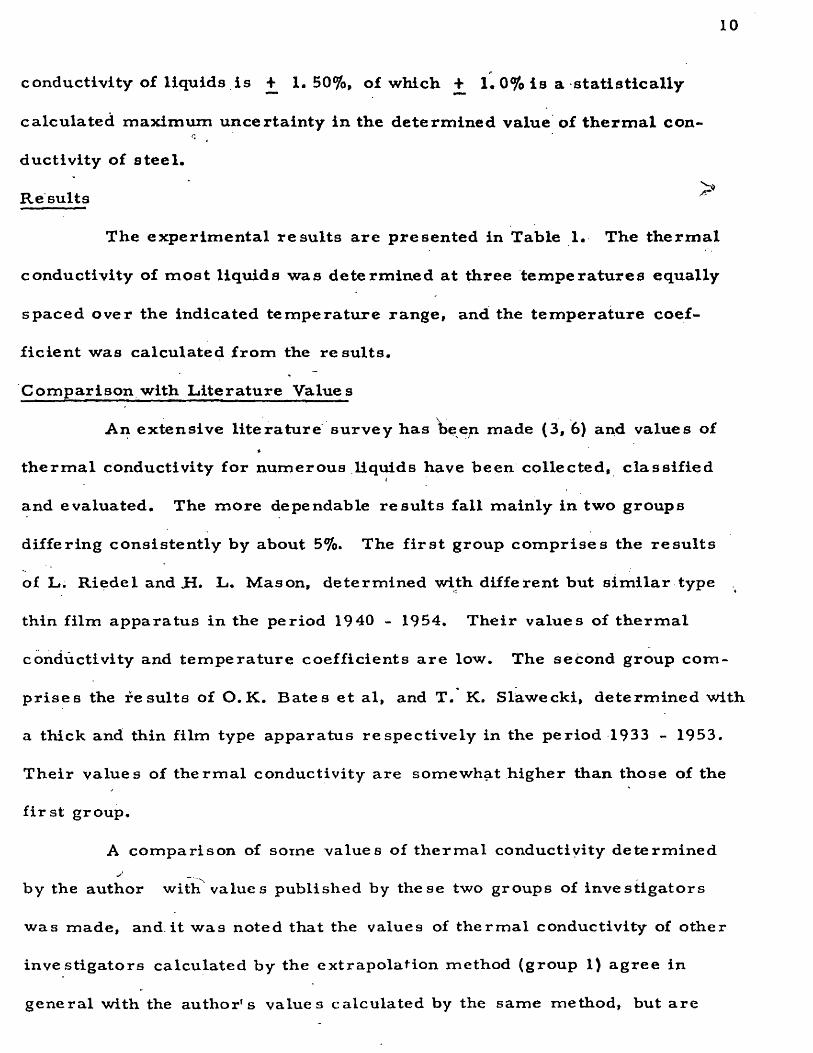
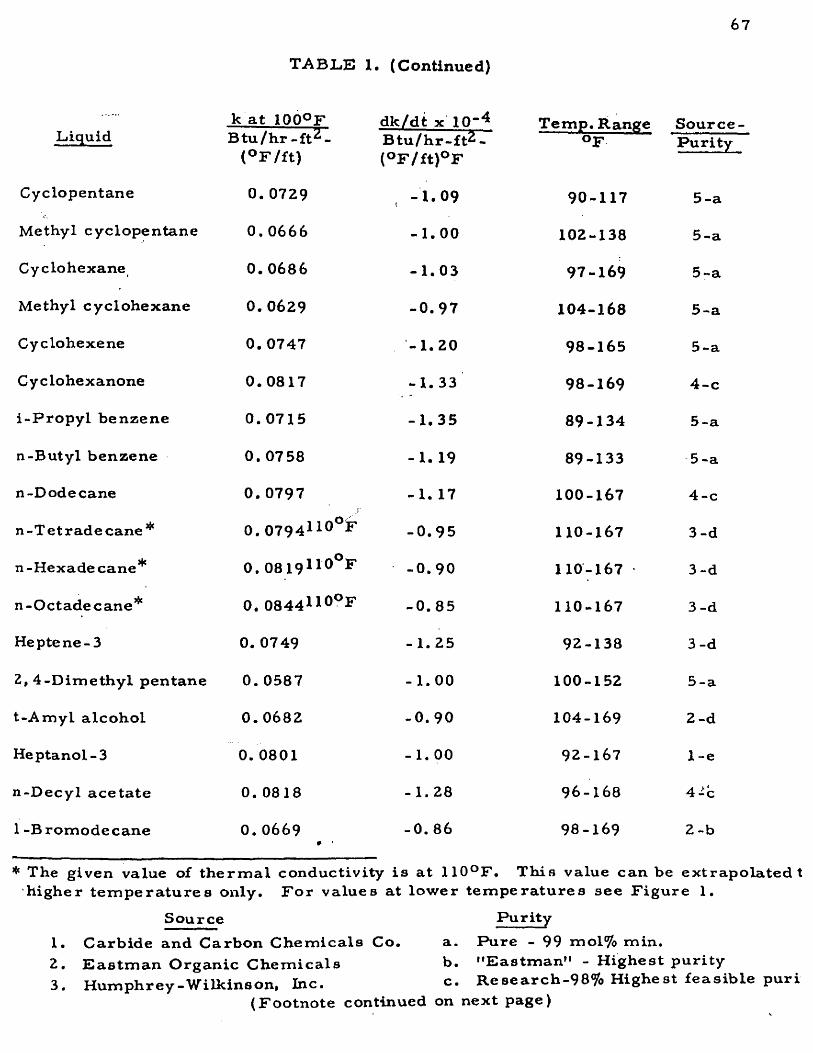
Re suits. The results obtained from the experimental de
te rminations a re presented in Table 1. The purity and sources of
the chemicals are also indicated. The thermal conductivity of most
liquids was determined at three temperatures equally spaced over
the indicated tem perature range, and the temperature coefficient
was calculated from the results .
The experimentally determined maximum e r ro r in the value
of therm al conductivity of liquids is + 1. 0%.
Comparison with Literature Values. An extensive l i te ra
ture survey has been made (7, 8), and values of thermal conductiv
ity for numerous liquids have been collected, classified and evaluated.
Excluding the results of P. W. Bridgman, M. Daniloff and J . F . D .
Smith (7), determined with the same thin film apparatus, which
are high, the more dependable results fall mainly in two groups dif
fering consistently by about 5%. The f irs t group comprises the re -
' suits of L. Riedel and H. L. Mason (7, 8) determined with different
but s im ilar type thin film apparatus. The second group comprises
the resu lts of O. K, Bates and T. K. Slawecki(7, 8), determined
with thick and thin film type apparatus respectively. The reported
resu lts differ in two respects . The value.s of therm al conductivity of
the f i rs t group are low by about 5%. The values of the temperature
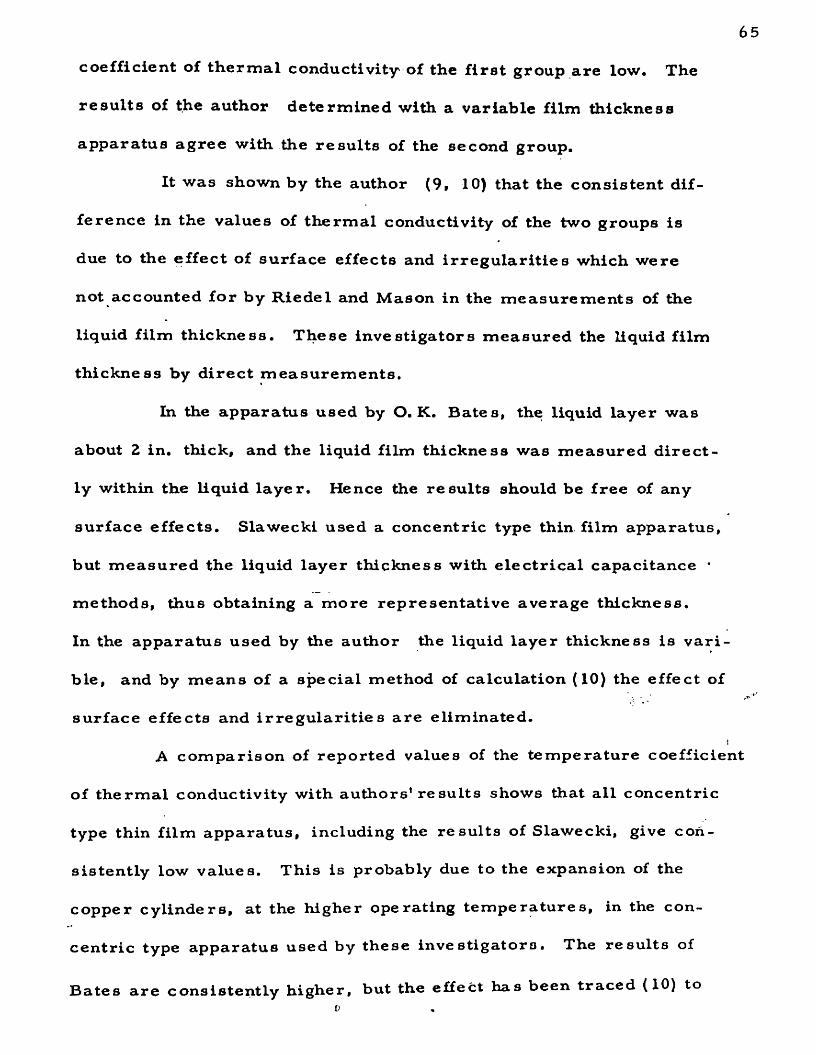
65
coefficient of therm al conductivity' of the f i r s t group are low. The
resu lts of the author determined with a variable film thickness
apparatus agree with the results of the second group.
It was shown by the author (9» 10) that the consistent dif
ference in the values of thermal conductivity of the two groups is
due to the effect of surface effects and ir regu lari t ies which were
not accounted for by Riedel and Mason in the measurements of the
liquid film thickness. These investigators measured the liquid film
thickness by direct measurements .
In the apparatus used by O.K. Dates, the liquid layer was
about 2 in. thick, and the liquid film thickness was measured d i re c t
ly within the liquid layer. Hence the results should be free of any
surface effects. Slawecki used a concentric type thin film apparatus,
but m easured the liquid layer thickness with electrical capacitance ’
methods, thus obtaining a more representative average thickness.
In the apparatus used by the author the liquid layer thickness is vari-
ble, and by means of a special method of calculation (10) the effect of
surface effects and i r regu la r i t ie s are eliminated.!
A comparison of reported values of the temperature coefficient
of thermal conductivity with authors1 re suits shows that all concentric
type thin film apparatus, including the results of Slawecki, give con
sistently low values. This is probably due to the expansion of the
copper cylinders, at the higher operating temperatures, in the con
centric type apparatus used by these investigators. The results of
Dates a re consistently higher, but the effect has been traced (10) tov
66
T A B L E 1.
Observed Values of Thermal Conductivity f
k at 100°F dk/dt x 10 “4 Temp. Range SourceLiquid B tu /h r - f t2 -
* The given value of thermal conductivity is at 110°F. This value can be extrapolated t higher temperatures only. For values at lower temperatures see Figure 1.
Source Purity1. Carbide and Carbon Chemicals Co. a. Pure - 99 mol% min.2. Eastman Organic Chemicals b. '’Eastman" - Highest purity3. Humphrey-Wilkinson, Inc. c. R e search-98% Highest feasible puri
(Footnote continued on next page)
68
the effects of heat t ransfer by radiation ac ross the liquid layer, which
were neglected by Bates.
Discussion of R esu lts . The therm al conductivity of liquids
has so far been observed to vary linearly with temperature . In con
densing apparatus the therm al conductivity of the liquid film at the boil
ing point is required. This is usually estimated by extrapolation of low
temperature data. It is important to check this procedure experimenta l
ly. A s a result, the thermal conductivity of cyclopentane, cyclohexane
and ethyl alcohol was determined at tem peratures close to the boiling
point.
Liquid Highest Observed Boiling Point, °F__________________ Temp. , ° F _ at 1 atm. __
The results show that the thermal conductivity varies linearly
with tem perature up to close to the boiling point.
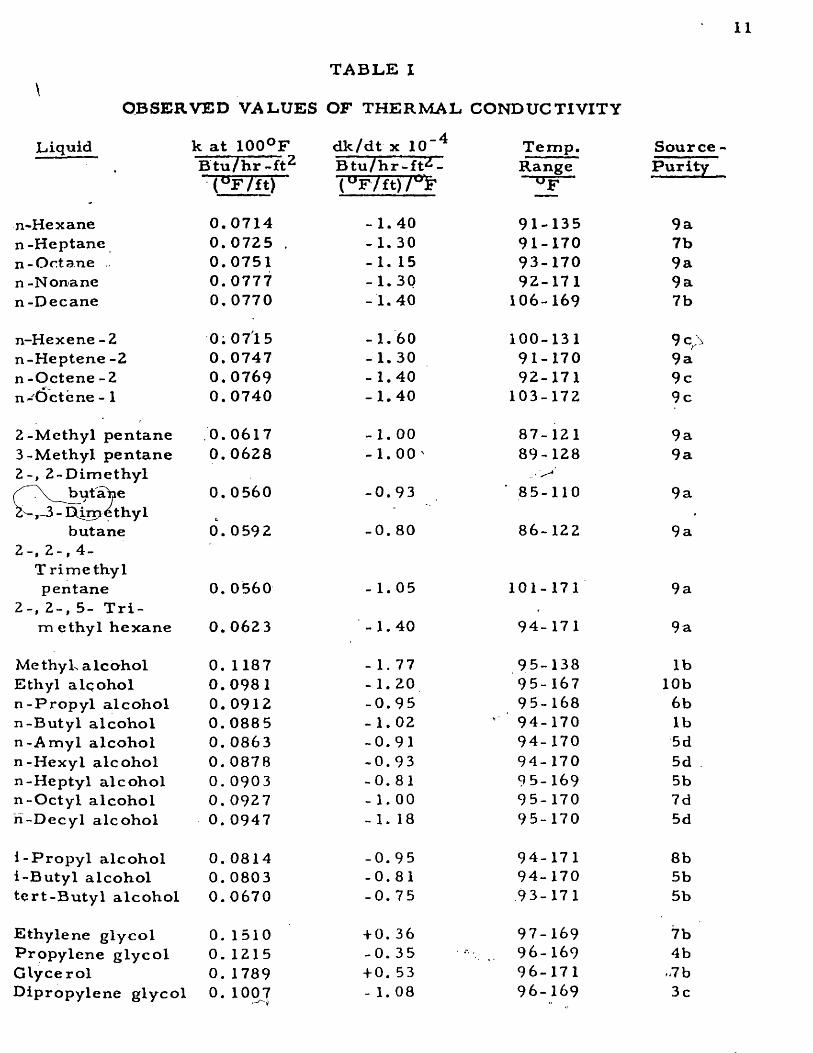
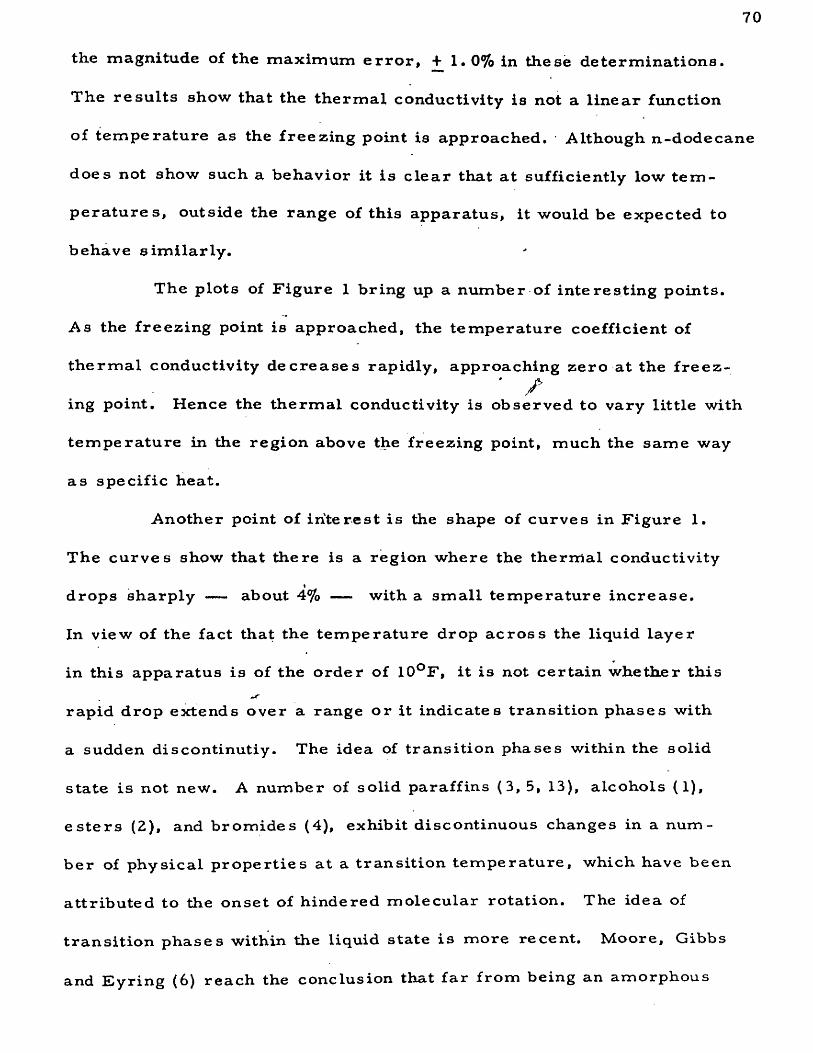
It isfequally important to investigate the region close to the
freezing point. F o r this purpose, the thermal conductivity of n-dodecane,
n-te tradecane, n-hexadecane and n-octadecane was determined at te m p e r
a tures close to the freezing point. n-Octadecane is a solid at room tern-■¥
pera ture . The results are shown in Figure 1. The vertical line indicates
(Continuation of footnote for Table 1)
Source Purity
4. Matheson Coleman and Bell, Inc. d. 95% min.5. Phillips Petroleum Co. e. P ractical
Btu
/hr-
ft
- (°
F/f
t)
69
V*/*
0.090
n-C,0.008
n-C,0.086
0.084n-C.
0,082
0.080Oq
0.078•s
0.076
0.074
0.072
0.070 150140130120 „ IT ,°F
F i g u r e I
160 . 170no10080 90
70
the magnitude of the maximum e r ro r , + 1 . 0 % in these determinations.
The resu lts show that the thermal conductivity is not a linear function
of temperature as the freezing point is approached. Although n-dodecane
does not show such a behavior it is c lear that at sufficiently low te m
p era tu res , outside the range of this apparatus, it would be expected to
behave similarly .
The plots of Figure 1 bring up a number of interesting points.
As the freezing point is approached, the temperature coefficient of
therm al conductivity decreases rapidly, approaching zero at the freez-
ing point. Hence the thermal conductivity is observed to vary little with
temperature in the region above the freezing point, much the same way
as specific heat.
Another point of in te res t is the shape of curves in Figure 1.
The curves show that there is a region where the thermal conductivity
drops sharply — about 4% — with a small temperature increase.
In view of the fact that the temperature drop across the liquid layer
in this apparatus is of the order of 10°F, it is not certain whether this
rapid drop extends over a range or it indicates transition phases with
a sudden discontinutiy. The idea of transition phases within the solid
state is not new. A number of solid paraffins (3, 5, 13), alcohols (1),
e s te rs (2), and bromides (4), exhibit discontinuous changes in a num
ber of physical properties at a transition temperature, which have been
attributed to the onset of hindered molecular rotation. The idea of
transit ion phases within the liquid state is more recent. Moore, Gibbs
and Eyring (6 ) reach the conclusion that far from being an amorphous
71
and random aggregation of molecules, there is not only a substantial
degree of order in liquids, but in many liquids there are several recog
nizable transit ions in addition to the solid-to-liquid and liquid-to-gas
transitions. By considering the molecules in the liquid state arranged
in a way s im ilar to that adopted by the author for the prediction of
therm al conductivity ( 1 1 ), they suggest that plots of a number of physi
cal propert ies as a function of temperature reveals abrupt discontin-^ <l>uities or transit ion tem pera tu res . To confirm these ideas the author
has plotted propert ies for a large number of liquids as suggested by
Moore, Gibbs and Byring. Careful consideration of the results leads
to the conclusion that although there is some evidence for transition
tem peratu res , it is far from being conclusive, and the transition te m
pera ture s a r e difficult to establish. The author believes that any t ra n
sition tem pera tu res present in the liquid state should be related to the
transition tem peratures observed in the solid state. In fact this appears
to be the case. Plots of freezing and transition points as a function of
tem perature for the solid paraffins (3, 5) show that transitions tem p era
tu res appear only for the t o C3 3 paraffins. For paraffins with less
than 25 carbon atoms the transition temperature curve c ro sses the f re e z
ing point curve. Transition tem peratures in the solid state have been
observed also for the f i rs t three m em bers of the paraffin se r ies . It iss *
possible then that for the C 3 to C z S paraffins the transition temperature
exists in the liquid state. The evidence on therm al conductivity p re sen t
ed by the author appears to substantiate this idea. The observed t r a n s i
tion region may then be identified with the onset of molecular rotation
72
above which, the molecules can rotate about their long axis, or are
n rotationally active* ,f Qualitatively this may be visualized as follows:
At a given temperature above the freezing point the molecules have ar
cer ta in capacity to absorb energy for t ransfe r . At the transition t e m
pera ture part of this energy must be retained by the molecules to in
itiate rotation* As a result, the net energy transfer and therm al con
ductivity decrease sharply.
Two other points are worth mentioning, (i) The position of
the OH group in the alcohol molecule seems to play an important role.
The therm al conductivity of Heptanol-3 is much lower than that of
n-Heptyl alcohol, (ii) The position of the functional group in a mole- )
cule, ether, ketone, e s te r , having the same total number of carbon
atoms does not affect the thermal conductivity.
The value of thermal conductivity of Diethylene glycol mono
ethyl ether is much higher than either the monomletHyl Or monobutyl
m em ber. This liquid is specified as low gravity by the supplier, and
the effect is probably due to impurities. Literature data (8 ) confirm
this observation.
C orre la t ions of Thermal Conductivity. Correlations of thermal
conductivity are important for process calculations. Two general
methods of predicting the thermal conductivity as a function of t e m p e r
ature were proposed by the author (10, 11). In this paper the methods
are extended to include the new data.
a. C orre lation Based on a Modified State Orient of the Theory of
Corresponding States. This method is based essentially on a
consideration of corresponding behavior of the same two members of
two different se r ies to the same other two members of their respective
se r ies . The reduced pressure is omitted fr.om the correlation, since
at 1 atm. the effect of differences in reduced pressure on thermal con
ductivity is small.
The therm al conductivity of different homologous ser ies was
corre la ted as a function of reduced temperature with the number of e f
fective carbon atoms as a param eter . The contribution to the thermal
conductivity of a given functional group or atom in the molecule was d e
te rm ined by using the n-aliphatic hydrocarbons as a basis, and taking
the difference between it and the se r ie s in question at a reduced tem p er
ature Tr = 0. 6 . This temperature was selected so as to reduce thef
extrapolation of the experimental data. In this part the determined
contributions to the thermal conductivity include E thers , Ketones, Mono
glycol e thers , Diglycol e thers. T er t ia ry alcohols, Naphthenes and A ro
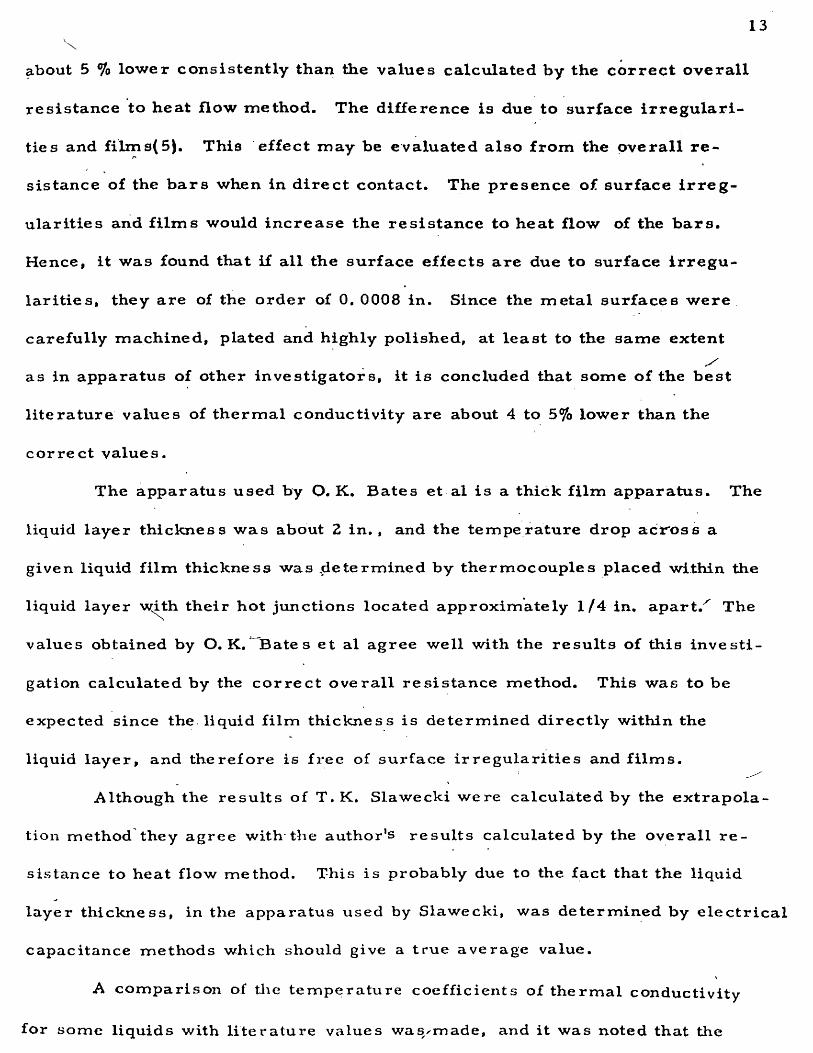
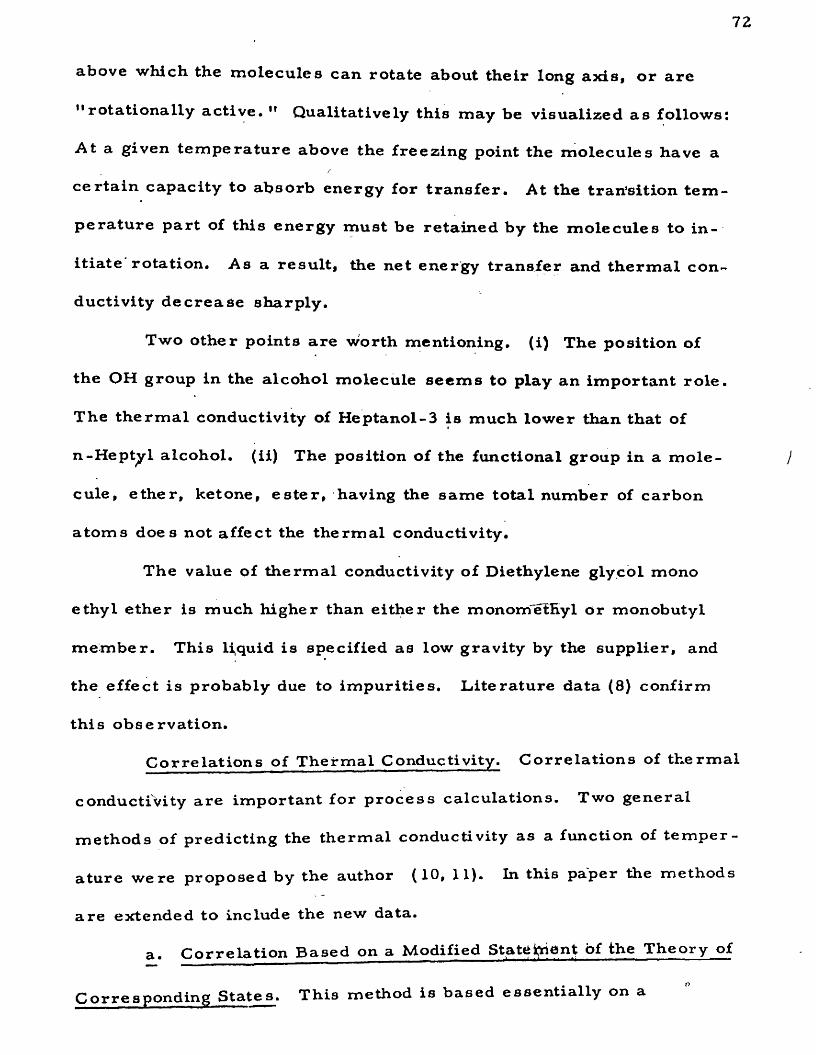
matic hydrocarbons. The results are shown in Table Z. The general
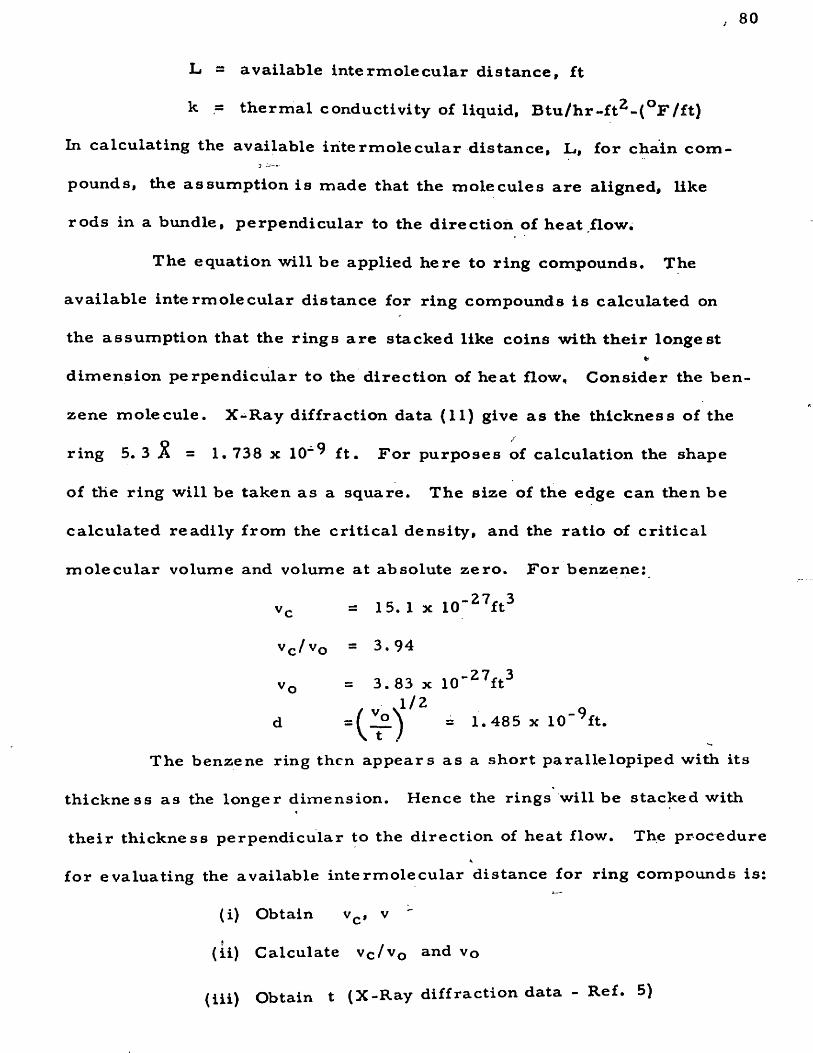
ized chart for n-aliphatfc hydrocarbons is shown in Figure Z. In this
chart, the line marked 1Z-18 should be used only if the molecules are
n rotationally active, M or about 70°F above the freeqing point. The con
vergence points of the different ser ies a re marked by le t ters , but can
be located also from the cri tical density of the ser ies . Although the
c r i t ica l density varies somewhat from member to member, an average
value for two or three m em bers is sufficient to locate the point. In this
way the therm al conductivity for an entire series of liquids, at any tern-
I "
pera tu re , can be estimated from a single known value. This value can
Btu
/hr-
M
-(-F
/fl)
0.1300
Q I 2 0 0 E
QI100 L
O .I O O O L
0 0 9 0 0 L
0 .0 8 0 0 1
0 .0 7 0 0 1
0 .0 6 0 0 t
Q 0 5 0 0 L
C 0 4 0 0 |
Q 0 3 0 0 E
00200 =:
LEGEND
A - Chain Alcohols
B - M ono-.O i-glycol t t h e r s
C * N ilro a lk cn e*
D - C hain H ydrocarbons
E - N a p h th e n e s , Chain E th a rs F - C hain K etonas
G * C hain E s te r s , A rom atic
H y d ro c a rb o n s
H - A lkyl H a lid a s
g./cm.-' 0 2 5
High Poiority 0 3 0
Lo* 030 Warily
035 f -
0 3 0 0 .40 0 5 0 0.60 0 7 0 0 8 0 0 .90 100
F i g u r e 2. T h e r m a l C o n d u c t i v i t y vs. R e d u c e d Te mp er atu re-0
75
be estimated by the previously presented ( 1 1 ) theoretical method.
This method of calculation will be il lustrated by two examples.
Illustration 1 . Calculate the thermal conductivity of i-propyl benzene
at 120°F.
Data. T c = 1145°R k
Basis - Benzene at Tr = 0.6 0. 0800
For contribution of i-propyl group, consider benzenene as ethane, take the difference in k between ethane and n-pentane (or three carbon groups) at Tr = 0. 6 from ^har t . - 0.0156
1 isomerization 0 . 00600.0584
In Figure 2 locate this point at Tr = 0.6 and connect it with the con
vergence point for aromatic hydrocarbons by a straight line. Read
the value of therm al conductivity at T r = 0. 506 (120°FJ.
k = 0.0689 B tu /h r - f tz -(°F/ft)i
The observed value at the same temperature is 0.0688 B tu /hr-f t^-/
(°F / ft).
Illustration 2. Calculate the thermal conductivity of 3-Heptanone at
1 40 °F.
Data. Tc = 1058°R (Estimated from the boiling point)
Effective number of carbon atoms , x = n -2 = 7-2=5
Structural contribution (Table 2) -0. 0041
In Figure 2 locate the reference point for pentane, at T r = 0.6, 0. 0738.
Subtract -0.0041 and locate new point, 0. 0697. Connect the new point
with the convergence point for, ketones by a straight line. Read the
value of thermal conductivity1 at T r = 0. 566 (140 F)
76
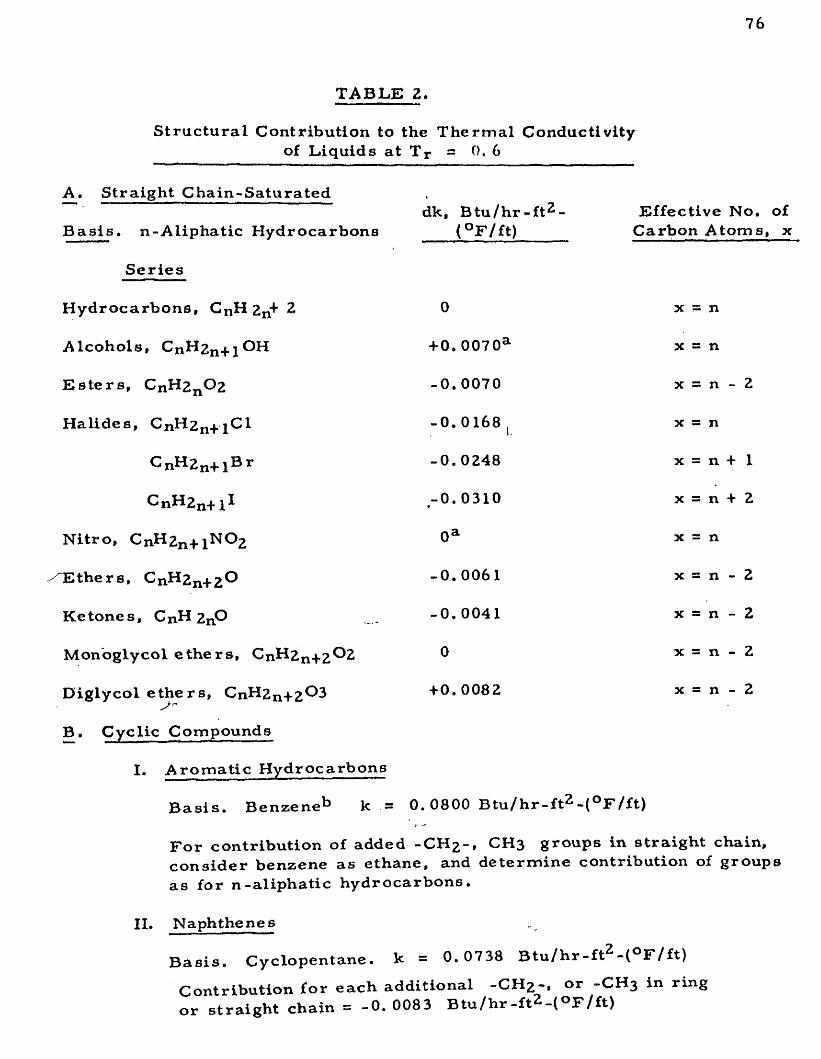
T A B L E 2 .
S tructural Contribution to the Thermal Conductivity of Liquids at Tr = 0. 6
A. Straight Chain-Saturateddk, B tu /h r - f t2- Effective No
Basis . n-Aliphatic Hydrocarbons (°F/ft) Carbon Atom
Series
Hydrocarbons, CnH 2n+ 2 0 x = n
Alcohols, CnH2n^.jOH + 0.007 0a x = n
E s te r s , CnH2nC>2 -0.0070 x = n - 2
Halides, CnH2 n+iCl - 0 . 0 1 6 8 x = n
Cn^2n4-iBr -0.0248 x = n + 1
CnH2 n+iI -0.0310 x = n + 2
Nitro, CnH2n+iN0 2 0 a x = n
^ E th e r s , CnH2 n + 2 0 - 0 . 0 0 6 1 x = n - 2
Ketones, CnH 2nP -0.0041 x = n - 2
Monoglycol e thers , CnH2 n + 2 0 2 0 x = n - 2
Diglycol e thers , CnH2 n+2 ^ 3 +0.0082 x = n - 2
B. Cyclic Compounds
I. Aromatic Hydrocarbons
Basis. Benzene*3 k = 0. 0800 B tu /h r - f t2 -(°F/ft)
For contribution of added -CH2 -, CH3 groups in straight chain, consider benzene as ethane, and determine contribution of groups as for n-aliphatic hydrocarbons.
II. Naphthenes
Basis. Cyclopentane. k = 0. 0738 B tu /h r - f t2 -(°F/f t)
Contribution for each additional -CH2-* or -CH3 in ring or straight chain = -0. 0083 B tu /h r - f t2 -(°F/ft)
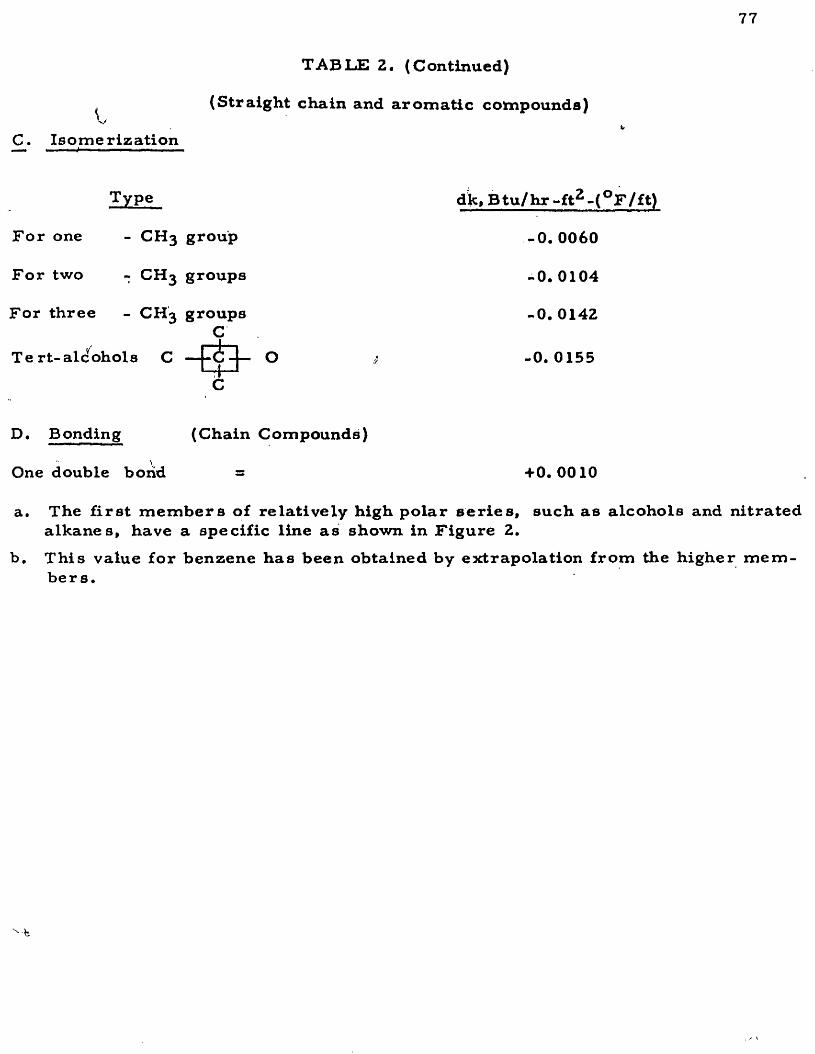
77
C. Isomerization
TABLE 2. (Continued)
(Straight chain and aromatic compounds)
Type
For one - CH3 group
For two - CH3 groups
For three - CH3 groupsC
Te rt- alcohols C t
dk. B t\ i /h r-f t2 -(°F/f t)
- 0 . 0060
-0.0104
-0.0142
-0.0155
D. Bonding
One double bond
(Chain Compounds)
+0 . 0010
a. The f irs t m em bers of relatively high polar se r ies , such as alcohols and nitrated alkanes, have a specific line as shown in Figure 2.
b, This value for benzene has been obtained by extrapolation from the higher m em bers .
78
k = 0.0742 B tu /h r - f t2-(°F/f t)
The observed value at the same temperature is 0.0747 B tu /h r - f t2-
(°F /f t ) .
This method of correla tion was used to predict the thermalr
conductivity of the liquids tested in this investigation. Typical results
are presented in Table 3.
The average deviation of the calculated from the observed/
values of therm al conductivity for a total of 77 liquids (Par ts I and III
of this Series) is 1.3%. The maximum deviation is about + 6.0%.
It will be noted that the method of correla tion was tested both with r e
spect to the therm al conductivity and its temperature coefficient.
^ Correlation Based on Theoretical Equation. An equation,
based on a simplified model of liquid state, for predicting the thermal
conductivity of pure organic liquids and its temperature coefficient has
been derived (P a r t II), and tested on a large number of straight chain
and branched liquids. Methods were also given for predicting the v a r
iables involved where no data are available (11* 12).
The equation is applicable to both normal and associated liquids.
The only assumption involved in its derivation is a particular molecular
a rrangem ent in the liquid. This arrangement is in agreement with
conclusions reached from X-Ray diffraction studies. The equation is
k = Cp UsyO JL . . . 1................................................. 1
where Cp = specific heat at constant p ressu re , B tu / lb -°F
Us = velocity of sound in the liquid,
JO = liquid density, lbs. /ft .
TABLE 3.
Comparison of Some Experimental Values of Thermal Conductivity With Values Calculated by Correlation Based on the Theory of Corresponding States
Liquid Tg,°R TA r kCalc k i a ^obs %Devb Tr k i a ^calc k 0. a *obs %Dev^