Page 1
Studies on Interaction of Polysaccharide-Templated SilverNanoparticles with Bovine Serum Albumin
Jing-Kun Yan • Pan-Fu Cai • Xiao-Qiang Cao •
Ting-Ting Fan • Hai-Le Ma
Received: 26 January 2013 / Accepted: 25 August 2013 / Published online: 4 September 2013
� Springer Science+Business Media New York 2013
Abstract In the present work, the interaction between
bovine serum albumin (BSA) and as-synthesized silver
nanoparticles (Oc-AgNPs) by using 4-acetamido-TEMPO-
oxidized curdlan (Oc), as a reducing and stabilizing agent, was
studied through fluorescence quenching method, ultraviolet
visible spectrum (UV–Vis), and circular dichroism measure-
ment. The results presented clearly indicate that the intrinsic
fluorescence of BSA molecule was effectively quenched after
the interaction with Oc-AgNPs by a static mechanism, which
is further confirmed by UV–Vis analysis. The apparent
binding constant (K), number of binding sites (n), and disso-
ciation equilibrium constant (KD) were calculated to be
7.5 9 105 M-1, 1.03, and 3.0 ± 0.6 lM, respectively. Fur-
thermore, a conformational change of BSA was also observed
when the Oc-AgNPs–BSA interactant formed.
Keywords Curdlan � 4-Acetamido-TEMPO � Silver
nanoparticles � BSA � Interaction
1 Introduction
It is well-known that albumins play an important role in
carrying drugs as well as endogenous and exogenous sub-
stances [1]. Serum albumins are the most abundant proteins
in plasma [2]. As the major soluble protein constituents of
the circulatory system, they have many physiological
functions [3]. Among the serum albumins, bovine serum
albumin (BSA) has a wide range of physiological functions
involving binding, transport and delivery of fatty acids,
porphyrins, bilirubin and steroids, etc. In general, it con-
tains 582 amino acid residues, and two tryptophans at
positions 134 and 212 as well as tyrosine and phenylala-
nine [4]. In view of water-soluble nature and well-char-
acterised structure of BSA, it has been often utilized as
protein model system for the study of interactions [5–7].
Recently, silver nanoparticles (AgNPs) have become the
focus of intensive research owing to their wide range of
applications in areas such as catalysis, optics, antimicro-
bials, and the biomaterial production [8, 9]. One kind of
important applications of AgNPs is used as a biosensor in
chemical and biochemical field for detection of proteins,
DNA sequencing, clinical diagnostics, etc. due to the sur-
face plasmon resonance (SPR) and large effective scatter-
ing cross section of individual silver nanoparticles. Among
them, there are some reports on interaction of BSA and
silver nanoparticles [10–12]. Furthermore, the AgNPs
could adsorb BSA leading to the formation of a protein
‘‘corona’’, and the stabilizing agents such as citric acid and
polyvinylpyrrolidone (PVP) in the preparation of AgNPs
play an important role in the corona formation [13].
Recently, studies on polysaccharides-conjugated Ag
nanoparticles have attracted intense attention for high-yield
and ‘‘green’’ production under relatively mild conditions
[14–17]. However, to the best of our knowledge, the
J.-K. Yan � P.-F. Cai � X.-Q. Cao � T.-T. Fan � H.-L. Ma
School of Food & Biological Engineering, Jiangsu University,
Zhenjiang 212013, China
J.-K. Yan (&) � H.-L. Ma
Physical Processing of Agricultural Products Key Lab of Jiangsu
Province, Zhenjiang 212013, Jiangsu, China
e-mail: [email protected]
J.-K. Yan
Guangdong Province Key Laboratory for Green Processing of
Natural Products and Product Safety, South China University of
Technology, Guangzhou 510640, Guangdong, China
123
J Inorg Organomet Polym (2013) 23:1383–1388
DOI 10.1007/s10904-013-9940-8
Page 2
interaction between BSA and polysaccharide-templated
silver nanoparticles has not yet been reported.
Herein, the major objective of the present study was to
investigate the interaction between BSA and polysaccha-
ride-templated silver nanoparticles by various spectro-
scopic measurements, such as fluorescence spectroscopy,
ultraviolet visible spectrum (UV–Vis), and circular
dichroism (CD). This study is also expected to provide
important insight into the interactions of the physiologi-
cally important protein BSA with silver nanoparticles.
2 Experimental Section
2.1 Materials
Commercial curdlan (DPw 6790; MW 1.1 9 106 kDa) was
obtained from Wako Pure Chemical Corporation (Osaka,
Japan). 4-acetamido-TEMPO-oxidized curdlan (Oc) was
prepared by the reported method [18]. The carboxylate
content and molecular weight (MW) of Oc was 4.87 mmol/g
and 5.7 9 105 kDa, determined by electric conductimetry
titration and size-exclusion chromatography with multi-
angle laser-light scattering (SEC–MALLS), respectively
[19]. Silver nitrate (AgNO3) and bovine serum albumin
(BSA, MW 6.6 9 104 kDa) were purchased from Sigma-
Aldrich Chemical Corporation (St. Louis, MO, USA). Other
chemicals and solvents were of laboratory grade, and used
without further purification.
2.2 Green Synthesis of Silver Nanoparticles
The silver nanoparticles was synthesized by directly
hybriding 1 mL of 10 mM AgNO3 solution in 1 mL of
1 mg/mL Oc aqueous solution at 100 �C for 120 min under
continuous stirring in the dark. The suspension was then
filtered through a filter (0.22 lm, Millipore) and centrifu-
gated at 30,000 rpm for 30 min, followed by redispersion
in acetone and water for removing excess Oc and Ag?. The
silver nanoparticles were then redispersed in water, and
dialyzed (MWCO, 14 kDa) against distilled water for 48 h.
The final solution was freeze-dried to obtained the
polysaccharide-templated silver nanoparticles, coded as
Oc-AgNPs.
2.3 Characterization of Silver Nanoparticles
The UV–Vis spectrum of Oc-AgNPs was recorded from
300 to 600 nm at room temperature using a Varian cary
100 spectrophotometer (Varian Co., USA), and the solution
containing only Oc was used as the blank. Transmission
electron microscopy (TEM, JEM-2100, JEOL Ltd., Japan,
200 kV) was used to characterize the size and morphology
of the as-prepared Oc-AgNPs. The tested sample was
prepared by placing a drop of sample solution (0.5 mg/mL)
on a 300 mesh carbon coated copper grids and then dried at
room temperature for 30 min. A wide-angle XRD instru-
ment (D8-Advance, Bruker Co., Germany) was used to
characterize the critical structure of the AgNPs. XRD
patterns with Cu Ka radiation (k = 0.15406 nm) at 40 kV
and 40 mA were recorded in the region of 2h from 30� to
80� with a step speed of 4�/min. Energy-dispersive X-ray
spectroscopy (EDX, Inca Energy-350, Oxford Co., UK)
attached to scan electron microscopy (SEM, JSM-7100F,
JEOL Ltd., Japan) was used to determine the elemental
composition of the nanoparticles.
2.4 Preparation of Oc-AgNPs and BSA Interactant
To prepare the interactant, the BSA solution (1.0 9 10-5
mol/L) was added to a different concentrations Oc-AgNPs
aqueous solutions, followed by incubation at 25 �C for
24 h. After incubation, the mixtures were stored at 4 �C
before tested.
2.5 Characterization of the Interactant
The UV–Vis spectra of free BSA and Oc-AgNPs-BSA
interactants were recorded in a Varian Cary 100 spectro-
photometer (Varian Co., USA) from 250–500 nm at room
temperature. The absorbance of free BSA and the inter-
actants were recorded at 280 nm. Fluorescence spectra and
fluorescence intensities of free BSA and Oc-AgNPs–BSA
interactants were recorded on a Fluoromax-4 fluorescence
spectrophotometer (HORIBA Jobin–Yvon, France), and
the emission spectra were recorded in the range of 290–
500 nm at an integration time of 1.0 s. The excitation and
emission slit width were both 5.0 nm. The CD spectra of
free BSA and Oc-AgNPs–BSA interactant were recorded
in a range of 200–250 nm on a circular dichroism spec-
trometer (JASCO J-815, Japan) at 25 �C. A relative a-helix
content of BSA molecule was determined as follows [20]:
% a-Helix = � h½ �208 � 4000� �
= 33000 � 4000ð Þ ð1Þ
where [h]208 is the mean residue ellipticity in deg cm2
dmol-1 at 208 nm.
3 Results and Discussion
3.1 Characterization of Oc-AgNPs
Oc was a water-soluble polysaccharide containing car-
boxylate (COO-) groups in C-6 position of curdlan mol-
ecule. The large number of hydroxyl and carboxylic groups
on this biopolymer facilitated the complexation of silver
1384 J Inorg Organomet Polym (2013) 23:1383–1388
123
Page 3
ions. Thus, in the present work, Oc was used as both
reducing and stabilizing agent in preparation of silver
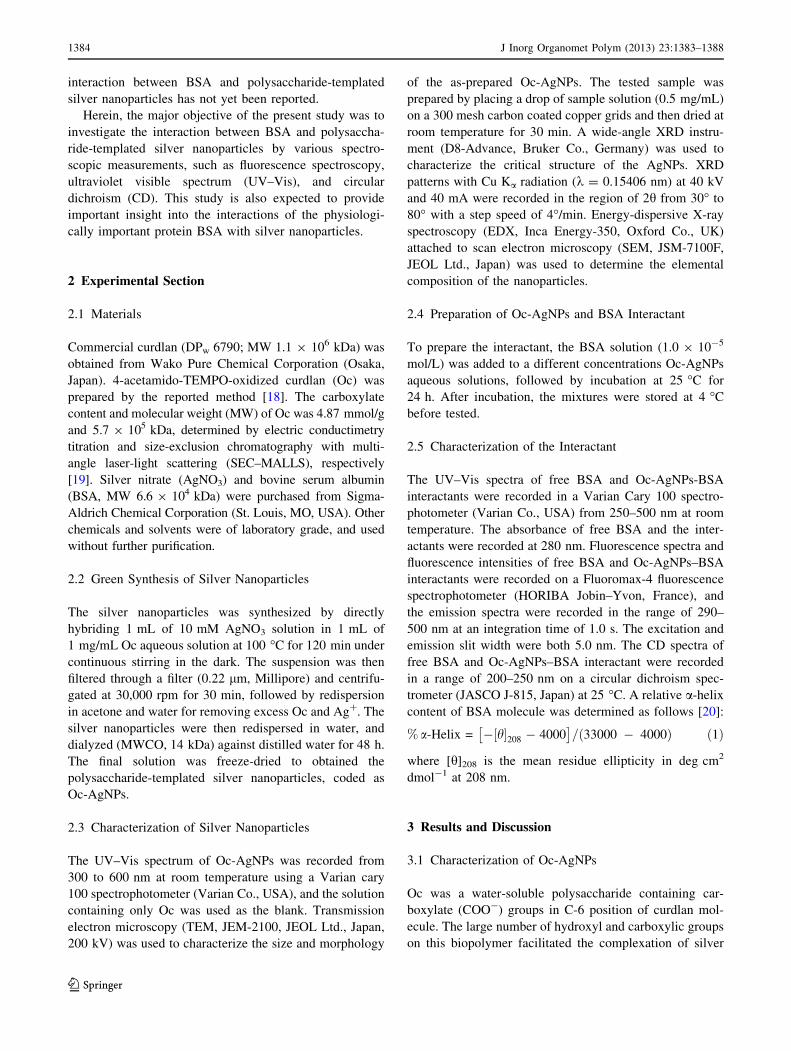
nanoparticles. Figure 1a shows the UV–Vis absorption
spectrum of Oc-AgNPs solution. There was a maximum
absorption peak at *410 nm appeared, which corre-
sponded to the SPR [21], indicating that the formation of
AgNPs. The shape of the plasmon band is symmetrical and
narrow, suggesting that AgNPs are spherical and mono-
disperse [22]. In addition, there are no peaks located
around 335 and 560 nm, indicating the complete absence
of nanoparticle aggregation [23, 24]. Meanwhile, the color
of the Oc-AgNO3 solution changed from colorless to
golden yellow, further indicating the formation of the
AgNPs. Figure 1b shows the typical transmission electron
microscopy (TEM) image of the Oc-AgNPs. The TEM
observation demonstrated that the particles are spherical in
shape and reasonably monodisperse. Nearly all the nano-
particles were well separated and no agglomeration was
noticed, and the mean diameter of the Oc-AgNPs was
calculated to be *15 nm. Figure 1c shows the XRD
spectrum of the Oc-AgNPs. The peaks at approximately
38.3�, 44.4�, 65.0�, 77.8� and 82.1� were attributed to the
(111), (200), (220), (311) and (222) planes of the cubic
structure of Ag [25]. No peaks related to other crystalline
phases were found. Among them, the diffraction peak at
38� was the only highly intense peak. Moreover, the ratio
between the (220) and (111) peaks was much lower than
the standard value (0.1 versus 0.4). These results further
demonstrated that the preferred orientation for the calcined
AgNPs was assigned to the (111) lattice plane. Figure 1d
shows the energy dispersive X-ray analysis (EDX) of the
silver nanoparticles. In the EDX spectrum, there was a
strong and typical optical absorption peak at about 3 keV
was attributed to the SPR of metallic silver nanocrystals
[26], indicating that the silver nanoparticles was formed in
the reaction medium.
3.2 Fluorescence Quenching and Stern–Volmer
Analysis
In this study, the interaction between Oc-AgNPs and BSA
was investigated by using fluorescence quenching method
30 40 50 60 70 80 90
200
400
600
800
(222)
C
Inte
nsity
2Theta (degree)
(111)
(200)
(220) (311)
B
100nm
0 1000 2000 3000 4000 5000 6000
0
200
400
600
800
1,000
Ag Ag
D
C
O
Na Ag
cps/
eV
eV
Ag
A
300 350 400 450 500 550 6000.0
0.1
0.2
0.3
0.4
0.5
0.6
0.7
AB
SWavelength (nm)
Fig. 1 a The UV–Vis
absorption spectrum of the Oc-
AgNPs, and the inset is the
photo of the Oc-AgNPs;
b typical TEM image of the Oc-
AgNPs; c XRD pattern; d EDX
spectrum from SEM
300 350 400 450 500
0.0
2.0x10⁶
4.0x10⁶
6.0x10⁶
8.0x10⁶
Inte
nsity
(a.
u.)
Wavelength (nm)
a
e
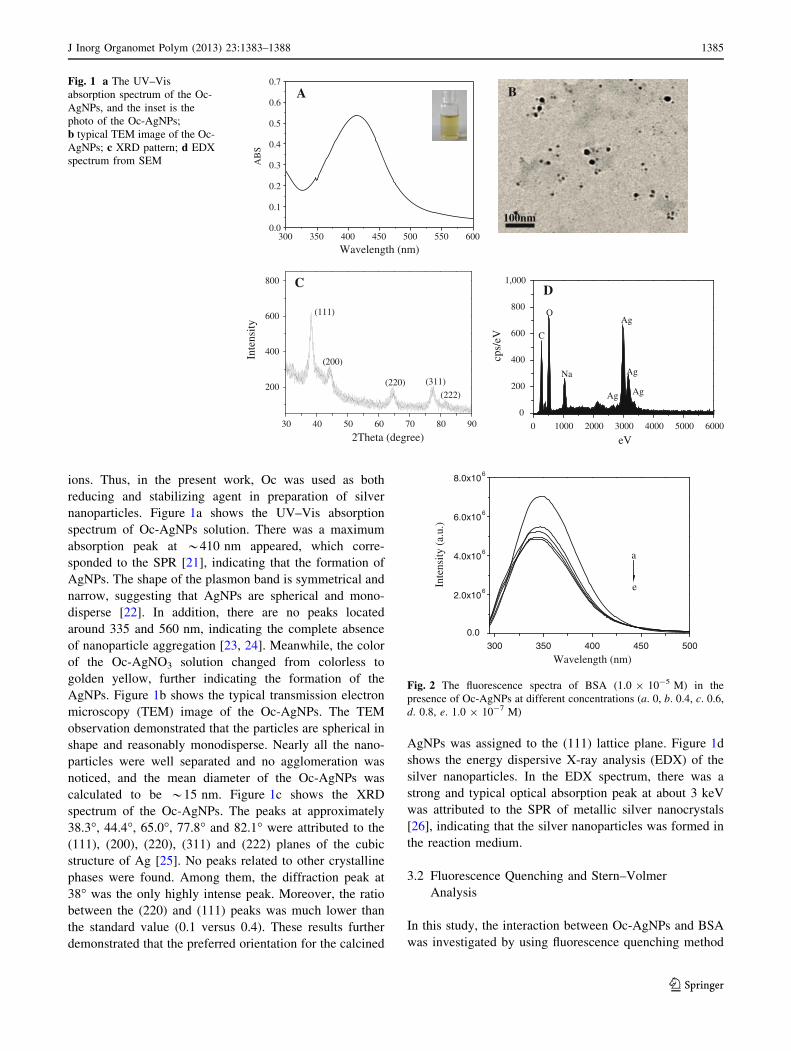
Fig. 2 The fluorescence spectra of BSA (1.0 9 10-5 M) in the
presence of Oc-AgNPs at different concentrations (a. 0, b. 0.4, c. 0.6,
d. 0.8, e. 1.0 9 10-7 M)
J Inorg Organomet Polym (2013) 23:1383–1388 1385
123
Page 4
[27]. Figure 2 shows the fluorescence spectra of BSA in the
presence of different concentrations of Oc-AgNPs. It can
be observed that free BSA and Oc-AgNPs–BSA interac-
tants exhibit maximum peaks at around 347 nm which
corresponding to the presence of tyrosine, tryptophan and
phenylalanine residues in BSA molecule. Moreover, the
fluorescence emission intensity at 347 nm decreased with
the increase of Oc-AgNPs concentration, indicating that the
intrinsic fluorescence of BSA molecule was quenched by
interacting with Oc-AgNPs.
Fluorescence quenching has been widely utilized for
revealing the accessibility of fluorophores in the protein
matrix to quenchers, and it is usually described by the
Stern–Volmer expression [28]:
F0=F ¼ 1þ Ksv Q½ � ¼ 1þ Kqs0 Q½ � ð2Þ
where F0 and F are the fluorescence intensities of BSA in
the absence and presence of quencher, Ksv is Stern–Volmer
constant, Kq is the biomolecular quenching rate constant,
[Q] is the concentration of quencher, and s0 is the average
lifetime of BSA, 10-8 s [29]. Figure 3a shows a linear plot
between F0/F against [Oc-AgNPs] according to Eq. (2).
From the slope, we could calculated the quenching rate
constant (Kq) as 5.0 9 1013 M-1 s-1, which was higher
than that of the maximum collisional quenching constant
(Kq) of various kinds of quenchers to biopolymers
(2.0 9 1010 M-1 s-1) [29]. This showed that the quench-
ing is not dynamic in nature.
For static quenching, the relationship between the fluo-
rescence intensity and the binding constant (K) can be
deduced from the following relation [10]:
log F0 � Fð Þ=F½ � ¼ n log Q½ � þ log K ð3Þ
where K is the binding constant of Oc-AgNPs with BSA,
[Q] is the concentration of Oc-AgNPs, n is the number
of binding sites. Figure 3b showed that the plot of
log[(F0-F)/F] versus log[Oc-AgNPs] according to the
Eq.(3). From the intercept and slope, we obtained the
binding constant ‘‘K’’ as 7.5 9 105 M-1 and binding sites
‘‘n’’ (1.03) for Oc-AgNPs with BSA. The value of ‘‘n’’
obtained from this study indicates that there is one avail-
able surface site between BSA molecule and Oc-AgNPs. It
seems likely that the presence of a hydroxyl group in the
tyrosine residues in the BSA moiety affects the interaction
of BSA with Oc-AgNPs, similar to AgTiO2 as reported by
Kathiravan et al. [10].
3.3 UV–Vis Spectral Study
Figure 4a shows the absorption spectra of BSA in the
presence and absence of Oc-AgNPs solution at different
concentrations. It can be observed that upon increasing the
concentration of Oc-AgNPs the absorption peak at around
280 nm is caused by the p?p* transition of aromatic
amino acid residues of BSA increase, indicating that the
BSA molecule has absorbed on the surface of Oc-AgNPs.
Similar observations have been stated in previous reports
[10, 30]. In addition, regardless of the concentration of Oc-
AgNPs, the absorption peak at *410 nm which was
characteristic for the formation of Ag0 nanoparticles
decreased markedly, further implying that the interaction
of BSA and Oc-AgNPs had been underwent.
In order to quantify the inherent strengths of the BSA/
AgNPs interactions, and the dissociation equilibrium con-
stant KD can be deduced by Eq. (4)
BSAþ Oc-AgNPs � BSA � � �Oc-AgNPs
KD ¼ BSA½ � � Oc-AgNPs½ �= BSA � � �Oc-AgNPs½ �: ð4Þ
The change in intensity of the absorption peak (280 nm)
as a result of the formation of the surface complex were
utilized to obtain KD. According to former report [31], the
KD can be further expressed as Eq. (5):
1= Aobs � A0ð Þ ¼ 1= Ac � A0ð Þ þ KD
� 1= Ac � A0ð Þ Oc-AgNPs½ � ð5Þ
where Aobs is the observed absorbance of the solution
containing different concentrations of Oc-AgNPs at
280 nm; A0 and Ac are the absorbance of free BSA and Oc-
AgNPs–BSA interactants at 280 nm, respectively.
0 2 4 6 8 10
1.0
1.1
1.2
1.3
1.4
1.5
1.6
F0/
F[AgNPs](10-7M)
A
-4.9 -5.0 -5.1 -5.2 -5.3 -5.4 -5.5
-0.7
-0.6
-0.5
-0.4
-0.3
-0.2
log[
(F0-
F)/F
]
Log [Oc-AgNPs]
BFig. 3 a Stern–Volmer plot of
F0/F versus [Oc-AgNPs], b plot
of log [(F0 - F)/F] versus log
[Oc-AgNPs]. The concentration
of BSA was 1.0 9 10-5 M
1386 J Inorg Organomet Polym (2013) 23:1383–1388
123
Page 5
Figure 4b shows the linear relationship between KD�1/
(Aobs - A0) versus reciprocal concentration of Oc-AgNPs
with a slope equal to 1/(Ac-A0) and an intercept equal to
1/(Ac - A0). The value of KD derived from this plot is
3.0 ± 0.6 lM. Generally, the KD value found herein cor-
respond with expectations from literature findings on
comparable protein/NPs system. For example, Treuel et al.
[12] reported a high affinity of BSA to citrate-coated Ag-
NPs system with the lower KD value (5.0 9 10-3 lM), but
the KD value for the BSA/PVP-coated AgNPs system was
1.3 lM. In addition, Rocker et al. [32] investigated the
interactions of human serum albumin (HSA) with polymer-
coated NPs reporting a value of KD * 3.8 ± 1.5 lM from
kinetic studies. These results revealed that the citrate-
coated NPs had a stronger interaction with proteins than
that of polymer-coated NPs. This may be due perhaps to
the different mechanism in the interaction processes.
3.4 CD Spectra Analysis
In general, circular dichroism (CD) spectroscopy is often
applied to estimate the conformation of proteins [20, 33].
In the present work, The CD was utilized for investigating
the conformational change of BSA before and after inter-
action with Oc-AgNPs. In the Oc-AgNPs itself, no CD was
observed under the condition employed. Figure 5 shows
the CD spectra of BSA in the presence of various con-
centrations of Oc-AgNPs in the near ultraviolet. It can be
observed that the main features of free BSA spectrum
occurred at 208 and 222 nm were in line with that reported
before [34, 35]. When the interaction happened, the char-
acteristic peaks at 208 and 222 nm were both decreased
with increasing the concentration of Oc-AgNPs. The heli-
cal content of free BSA is 62.80 %. After the interaction,
however, it decreased from 45.07 to 35.94 % with the
increase of the concentration of Oc-AgNPs. Thus, the data
obtained from CD demonstrated that the higher order
structure of BSA molecule changed upon interaction
with Oc-AgNPs. Similarly, Wang et al. [36] investigated
the interaction between BSA and the self-aggregated
nanoparticles of cholesterol-modified O-carboxymethyl
chitosan (CCMC) by CD measurement, and concluded that
the higher order structure of BSA changed upon interaction
with CCMC self-aggregated nanoparticles.
4 Conclusions
In summary, the interaction between BSA and polysac-
charide-templated silver nanoparticles was investigated
with fluorescence spectrum, UV–Vis, and CD measure-
ments. These results revealed that BSA molecule was able
to absorb on the surface of Oc-AgNPs to form the inter-
actant by static quenching, and values of the binding rate
constant (K) and the dissociation equilibrium constant (KD)
was 7.5 9 105 M-1 and 3.0 ± 0.6 lM, respectively. The
higher order structure of BSA changed when the interac-
tion underwent. In this sense, Oc-AgNPs was hope to be a
novel carrier for the proteins, and the further investigations
are in progress now.
Acknowledgments This work was supported financially by the
China’s Postdoctoral Science Fund Projects (2013M531292), the
Open Project Program of Guangdong Province Key Laboratory for
250 300 350 400 450 5000.0
0.1
0.2
0.3
0.4
AB
SWavelength(nm)
a
f
280
410
A
1 2 3 4 5
8
10
12
14
16
18
20
1/(A
-A0)
1/[Oc-AgNPs] (µM-1)
BFig. 4 A Absorption spetrum
of BSA in the presence of Oc-
AgNPs: a. 1.0, b. 0.8, c. 0.6,
d. 0.4, e. 0.2, and f.
0 9 10-6 M; B the linear
dependence of 1/(A-A0) on the
reciprocal concentration of Oc-
AgNPs
200 210 220 230 240 250-25
-20
-15
-10
-5
0
5
(103 d
eg.c
m2 d
mol
-1)
Wavenumber (nm-1)
a
d
Fig. 5 CD spectra of BSA in the presence of Oc-AgNPs: a. 0, b. 1.0,
c. 2.5, d. 5.0 9 10-6 M
J Inorg Organomet Polym (2013) 23:1383–1388 1387
123
Page 6
Green Processing of Natural Products and Product Safety (201201)
the Priority Academic Program Development (PAPD) of Jiangsu
Higher Education Institutions, School Foundation Financing Project
of Jiangsu University (105DG129), the Open Foundation of Jiangsu
Province Key Laboratory of Physical Processing on Agricultural
Products (JAPP2010-7), Jiangsu UIniversity Undergraduate Innova-
tion Project (2012097) and Jiangsu University Students’ Scientific
Research Project (11A343).
References
1. F. Moreno, M. Cortijo, J.G. Jimenez, Photochem. Photobiol. 70,
695 (1999)
2. D.D. Carter, J.X. Ho, Adv. Protein Chem. 45, 153 (1994)
3. R.E. Olson, D.D. Christ, Ann. Rep. Med. Chem. 31, 327 (1996)
4. L.A. Sklar, B.S. Hudson, R.D. Simoni, Biochemistry 16, 5100
(1977)
5. J. Valanciunaite, S. Bagdonas, G. Streckyte, R. Rotomskis,
Photochem. Photobiol. Sci. 5, 381 (2006)
6. U.K. Hansen, Pharmacol. Rev. 33, 17 (1981)
7. X.M. He, D.C. Carter, Nature 358, 209 (1992)
8. S.K. Batabyal, C. Basu, A.R. Das, G.S. Sanyal, J. Biobased Mater
1, 143 (2007)
9. A.T. Le, P.T. Huy, P.D. Tam, T.Q. Huy, P.D. Cam, A.A. Ku-
drinskiy, Y.A. Krutyakov, Curr. Appl. Phys. 10, 910 (2010)
10. A. Kathiravan, R. Renganathan, S. Anandan, Polyhedron 28, 157
(2009)
11. A. Ravindran, A. Singh, A.M. Raichur, N. Chandrasekaran, A.
Mukherjee, Colloids Surf. B 76, 32 (2010)
12. L. Treuel, M. Malissek, J.S. Gebauer, R. Zellner, Chem. Phys.
Chem. 11, 3093 (2010)
13. R. Podila, R. Chen, P.C. Ke, A.M. Rao, Appl. Phys. Lett. 101,
263701 (2012)
14. J. Cai, S. Kimura, M. Wada, S. Kuga, Biomacromolecules 10, 87
(2008)
15. S. Ifuku, M. Tsuji, M. Morimoto, H. Saimoto, H. Yano, Bio-
macromolecules 10, 2714 (2009)
16. M.J. Laudenslager, J.D. Schiffman, C.L. Schauer, Biomacro-
molecules 9, 2682 (2008)
17. L. Donati, A. Travan, C. Pelillo, T. Scarpa, A. Coslovi, A. Bo-
nifacio, V. Sergo, S. Paoletti, Biomacromolecules 10, 210 (2009)
18. N. Tamura, M. Hitora, T. Saito, A. Isogai, Carbohydr. Polym. 81,
592 (2010)
19. T. Saito, A. Isogai, Biomacromolecules 5, 1983 (2004)
20. N.J. Greenfield, G.D. Fasman, Biochemistry 8, 4108 (1969)
21. T. Huang, X. Xu, J. Mater. Chem. 20, 9867 (2010)
22. E. Hutter, J.H. Fendler, Adv. Mater. 16, 1685 (2004)
23. A.J. Kora, R. Manjusha, J. Arunachalam, Mater. Sci. Eng., C 29,
2104 (2009)
24. Y.M. Mohan, K.M. Raju, K. Sambasivudu, S. Singh, B. Sreedhar,
J. Appl. Polym. Sci. 106, 3375 (2007)
25. S. He, J. Yao, S. Xie, H. Gao, S. Pang, J. Phys. D Appl. Phys. 34,
3425 (2001)
26. G. Magudapatty, P. Gangopaghyayrans, B.K. Panigrahi, K.G.M.
Nair, S. Dhara, Phys. B 299, 142 (2001)
27. M.R. Eftink, C.A. Ghiron, Biochemistry 15, 672 (1976)
28. M.R. Eftink, C.A. Ghiron, Anal. Biochem. 114, 199 (1981)
29. J.R. Lakowicz, G. Weber, Biochemistry 12, 4161 (1973)
30. C. Chen, X. Qi, B. Zhou, J. Photochem. Photobiol. A 109, 155
(1997)
31. H.A. Benesi, J.H. Hildebrand, J. Am. Chem. Soc. 71, 2703 (1949)
32. C. Rocker, M. Potzl, F. Zhang, W.J. Parak, G.U. Nienhaus, Nat.
Nanotechnol. 4, 577 (2009)
33. K. Park, K. Kim, I.C. Kwon, Langmuir 20, 11726 (2004)
34. A.P. Serro, M. Bastos, J.C. Pessoa, B. Saramago, J. Biomed.
Mater. Res. 70 (part A) 70, 420 (2004)
35. W. Norde, C.E. Giacomelli, J. Biotechnol. 79, 259 (2000)
36. Y. Wang, Q. Jiang, L.R. Liu, Q. Zhang, Polymer 48, 4135 (2007)
1388 J Inorg Organomet Polym (2013) 23:1383–1388
123


![eBook Production: A Templated Workflow [2013]](https://static.documents.pub/doc/80x56/5596c5c01a28ab51408b46a5/ebook-production-a-templated-workflow-2013.jpg)


