Page 1
저 시-비 리- 경 지 2.0 한민
는 아래 조건 르는 경 에 한하여 게
l 저 물 복제, 포, 전송, 전시, 공연 송할 수 습니다.
다 과 같 조건 라야 합니다:
l 하는, 저 물 나 포 경 , 저 물에 적 된 허락조건 명확하게 나타내어야 합니다.
l 저 터 허가를 면 러한 조건들 적 되지 않습니다.
저 에 른 리는 내 에 하여 향 지 않습니다.
것 허락규약(Legal Code) 해하 쉽게 약한 것 니다.
Disclaimer
저 시. 하는 원저 를 시하여야 합니다.
비 리. 하는 저 물 리 목적 할 수 없습니다.
경 지. 하는 저 물 개 , 형 또는 가공할 수 없습니다.
Page 2
약학석사학위논문
Studies on rice metabolomics in different
degrees of milling
도정도에 따른 쌀 대사체의 변화 연구
2017 년 8 월
서울대학교 대학원
약학과 약품분석학전공
DONG ZIYUAN
Page 3
Studies on rice metabolomics in different degrees of milling
도정도에 따른 쌀 대사체의 변화 연구
지도교수 박정일
이 논문을 약학석사학위논문으로 제출함
2017 년 8 월
서울대학교 대학원
약학과 약품분석학전공
DONG ZIYUAN
DONG ZIYUAN의 석사학위논문을 인준함
2017 년 8 월
위 원 장 송준명 (인)
부 위 원 장 권성원 (인)
위 원 박정일 (인)
Page 4
i
Abstract
Studies on rice metabolomics in different
degrees of milling
Ziyuan Dong
Department of Pharmacy, Pharmaceutical Analysis
The Graduate School
Seoul National University
Nutrients in rice have been a hot topic in scientific studies for a long time. As an
issue of debate in these studies, a quite amount of studies indicate that brown rice has
greater benefit of nutritional value than white rice. Nevertheless, nutritional
components of rice with remarkable variations between brown rice and white rice
which could verify the proposition proposed above, have not been investigated
comprehensively. In addition, the variation tendency requires to be described not only
according to the two types of rice (brown rice and white rice) but also products of rice
in different degrees of milling (DOM). This assay examined variations of rice
components among different DOM using untargeted metabolomics approach. Rice
processed in DOM values of 0, 5, 7, 9 and 11 were analyzed by high-performance
liquid chromatography-mass spectrometry (HPLC-MS) and gas chromatography-mass
spectrometry (GC-MS). To detect nutritional components of rice which exhibit
significant changes among different DOM, principal component analysis (PCA) and
Page 5
ii
partial least squares-discriminant analysis (PLS-DA) were applied. On account of the
analysis of the results, we found that the contents of sugars and sugar alcohols
decreased with the rise of DOM due to the lack of bran layer. While the contents of
phospholipids had rising tendency with the increase of DOM. In conclusion, in
contrast to the common opinion, our results revealed that the nutritional values of rice
changed in various situations. Rice in different DOM provided the maximum benefits
in different cases. Accordingly, the variation tendency and regularity of rice
components among different DOM had great contribution to the rational adjustment of
rice production and consumption.
Keywords: Rice metabolomics; Degree of milling; Gas chromatography-mass
spectrometry (GC-MS); High-performance liquid chromatography-mass
spectrometry (HPLC-MS); Sugar; Phospholipid.
Student Number: 2015-22390
Page 6
iii
Contents
Abstract ............................................................................................................... i
List of figures ......................................................................................................v
List of tables ...................................................................................................... vi
1. Introduction ..............................................................................................1
2. Experiment ...............................................................................................3
2. 1. Sample collection and pretreatment ..............................................3
2. 2. Chemicals and materials ...............................................................3
2. 2. 1. Chemicals ..........................................................................3
2. 2. 2. Experimental supplies .......................................................4
2. 2. 3. Analytical instruments .......................................................5
2. 3. Sample preparation .......................................................................6
2. 3. 1. GC-MS experimental method ............................................6
2. 3. 2. HPLC-MS experimental method .......................................8
2. 4. Instrumental analysis ..................................................................10
2. 4. 1. GC-MS analysis...............................................................10
2. 4. 2. HPLC-MS analysis ..........................................................12
2. 5. Data processing ...........................................................................14
2. 5. 1. GC-MS data processing ...................................................14
2. 5. 2. HPLC-MS data processing ..............................................15
3. Result and discussion .............................................................................19
3. 1. Data processing results ...............................................................19
3. 1. 1. Data processing results of GC-MS analysis ....................19
3. 1. 2. Data processing results of HPLC-MS analysis ................23
3. 2. Discussion ...................................................................................27
4. Conclusion .............................................................................................31
Page 7
iv
5. References ..............................................................................................32
국문초록 ...................................................................................................34
Page 8
v
List of figures
Figure 1. Flowchart of sample preparation for GC-MS analysis. ............................... 7
Figure 2. Flowchart of sample preparation for HPLC-MS analysis. .......................... 9
Figure 3. The data alignment process of MZmine 2.19. ............................................ 16
Figure 4. The workflow of data processing. ................................................................. 18
Figure 5. PCA score plot of the rice samples with different DOM in GC-MS
analysis................................................................................................................ 21
Figure 6. PLS-DA score plot of the rice samples with different DOM in GC-MS
analysis................................................................................................................ 22
Figure 7. PCA score plot of the rice samples with different DOM in HPLC-MS
analysis................................................................................................................ 24
Figure 8. PLS-DA score plot of the rice samples with different DOM in HPLC-
MS analysis. ....................................................................................................... 25
Figure 9. Box plots of the marker concentrations in GC-MS and HPLC-MS
analysis................................................................................................................ 30
Page 9
vi
List of tables
Table 1. GC-MS analysis conditions. ................................................................ 11
Table 2. HPLC-MS analysis conditions. ........................................................... 13
Table 3. The data alignment parameters of MZmine 2.19. ........................... 17
Table 4. Components with remarkable variations in concentrations. ......... 26
Table 5. The average peak areas of the markers in different DOM. ........... 27
Page 10
1
1. Introduction
Rice has been used as staple food for over half of the world’s population all the time,
especially in Asia, since it is competent to provide enough calories for people
throughout the whole year[1]. Accordingly, a large number of studies have kept on the
componential analysis and quality improvement of rice. Based on the studies
investigated before, all varieties of rice are high in carbohydrates, fibers, vitamins and
minerals as well as proteins[1, 2]. Commonly, there are two types of rice product in rice
consumption, brown rice and white rice. Brown rice is unpolished whole grain rice
that is processed by removing only the hull. After that, the bran layer and germ of
brown rice are peeled off through milling to produce white rice. Thus, white rice is
more commonly used in daily life owing to its excellent appearance, texture and
taste[3]. By contrast, it has been examined that brown rice contains more minerals,
vitamins, and proteins, which are abundant in the bran layer and germ[1, 4]. Coupled
with its low supply and difficulty of storage and transport, brown rice is by far more
expensive than white rice[1]. As stated above, these studies have brought powerful
influences on rice production, consumption and trade. However, variations of
nutritional components between brown rice and white rice have not been investigated
in all directions. For this reason, more detailed and systematical studies on the
nutritional value evaluation of rice in different forms become in urgent need.
The nutritional values of rice in different forms mainly depend on the variation
tendency and regularity of nutritional components. To describe the variation tendency
and regularity comprehensively, rice cannot be simply categorized into two types,
brown rice and white rice. Specifically, as an influential factor of nutritional
components in rice, different degrees of milling (DOM) create numerous intermediate
products of rice. Moreover, these intermediate products show different textures,
Page 11
2
contents of nutritional components and variation characteristics during the milling
process. According to this character of rice, recently, DOM of rice becomes an issue
open to debate. Thus far, studies on the DOM of rice have concentrated only on taste
differences and loss of proteins, vitamins, and minerals in the germ and bran layer of
rice during the milling process[4, 5]. Nevertheless, variations of nutritional components
in endosperm, particularly phospholipids, which have abundant benefits for health[6, 7],
gained few attentions by the public. Therefore, nutritional value evaluations of rice in
different DOM deserve more comprehensive investigations.
Rice metabolomics is a comprehensive analysis technology of metabolites in rice,
which investigates the amounts and variations of rice metabolites through quantitative
and qualitative analysis[8]. In this study, three different cultivars of rice in different
DOM were analyzed by gas chromatography-mass spectrometry (GC-MS) and high-
performance liquid chromatography-mass spectrometry (HPLC-MS) based on
untargeted metabolomics approach. In detail, three different cultivars of rice in DOM
values of 0 (brown rice), 5, 7, 9 and 11 were obtained from Korean local markets.
After aligning metabolomic data acquired before, multivariate statistical analysis
methods were employed to understand the comprehensive variations in the detected
metabolites among various rice samples. More specifically, principal component
analysis (PCA) was applied to depict the dissimilarity among rice in different DOM.
Meanwhile, the nutritional components of rice with remarkable variations among
different DOM were picked out by partial least squares discriminant analysis (PLS-
DA) combined with one-way analysis of variance (ANOVA). Eventually, the variation
tendency and regularity of the nutritional components which have remarkable
variations among different DOM were described by compare of their concentrations.
On the basis of this study, the nutritional value evaluations of rice in different DOM
were optimized. Furthermore, rice production and consumption can be adjusted to
optimum DOM according to certain specific demands.
Page 12
3
2. Experiment
2. 1. Sample collection and pretreatment
Three different cultivars of Korean rice, as representative short/medium grain rice
cultivars which named Choochung, Shindongjin, and Ode, in DOM values of 0, 5, 7, 9,
and 11, were purchased from local markets in Korea. All rice samples were ground to
fine powder and freeze-dried in the dark for two days. Subsequently, all the samples
were stored at -70°C before study to avoid metabolic changes.
2. 2. Chemicals and materials
2. 2. 1. Chemicals
Chemicals used in GC-MS analysis
- Chloroform (J.T. Baker, Phillipsburg, NJ, USA)
- Methanol (J.T. Baker, Phillipsburg, NJ, USA)
- Water (J.T. Baker, Phillipsburg, NJ, USA)
- Methoxyamine hydrochloride (Sigma-Aldrich, St. Louis, MO, USA)
- Pyridine (Sigma-Aldrich, St. Louis, MO, USA)
- N,O-bis (trimethylsilyl) trifluoroacetamide (BSTFA) containing 1%
trimethylchlorosilane (TMCS) (Sigma-Aldrich, St. Louis, MO, USA)
All the reagents are in analytical grade.
Page 13
4
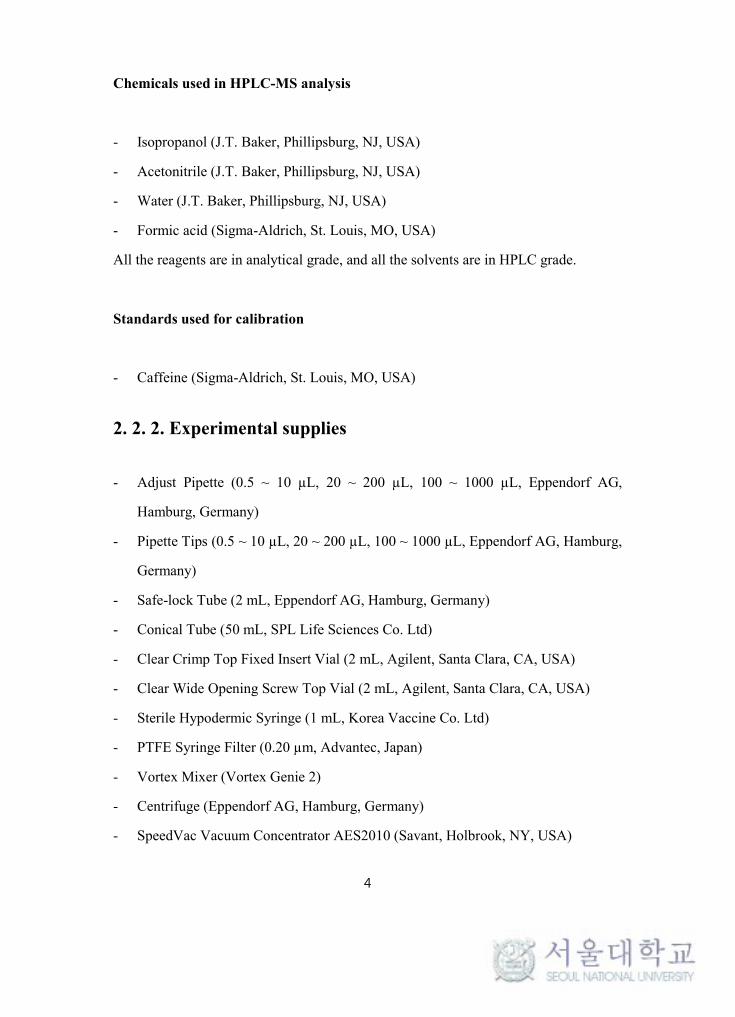
Chemicals used in HPLC-MS analysis
- Isopropanol (J.T. Baker, Phillipsburg, NJ, USA)
- Acetonitrile (J.T. Baker, Phillipsburg, NJ, USA)
- Water (J.T. Baker, Phillipsburg, NJ, USA)
- Formic acid (Sigma-Aldrich, St. Louis, MO, USA)
All the reagents are in analytical grade, and all the solvents are in HPLC grade.
Standards used for calibration
- Caffeine (Sigma-Aldrich, St. Louis, MO, USA)
2. 2. 2. Experimental supplies
- Adjust Pipette (0.5 ~ 10 µL, 20 ~ 200 µL, 100 ~ 1000 µL, Eppendorf AG,
Hamburg, Germany)
- Pipette Tips (0.5 ~ 10 µL, 20 ~ 200 µL, 100 ~ 1000 µL, Eppendorf AG, Hamburg,
Germany)
- Safe-lock Tube (2 mL, Eppendorf AG, Hamburg, Germany)
- Conical Tube (50 mL, SPL Life Sciences Co. Ltd)
- Clear Crimp Top Fixed Insert Vial (2 mL, Agilent, Santa Clara, CA, USA)
- Clear Wide Opening Screw Top Vial (2 mL, Agilent, Santa Clara, CA, USA)
- Sterile Hypodermic Syringe (1 mL, Korea Vaccine Co. Ltd)
- PTFE Syringe Filter (0.20 µm, Advantec, Japan)
- Vortex Mixer (Vortex Genie 2)
- Centrifuge (Eppendorf AG, Hamburg, Germany)
- SpeedVac Vacuum Concentrator AES2010 (Savant, Holbrook, NY, USA)
Page 14
5
- Vacuum Ovens OV-01 (Lab Companion)
- Chemical-free Freeze Dryer (-120°C, Operon)
2. 2. 3. Analytical instruments
- GC-MS OP2010 (Shimadzu, Kyoto, Japan)
DB-5 capillary column (30 m × 0.25 mm, 0.25 µm film thickness)
- HPLC (Agilent) –MS (Q-TOF 6530 MS, Agilent, USA)
Acquity™ UPLC column (1.7 µm; 2.1 mm × 100 mm, BEH C18)
Page 15
6
2. 3. Sample preparation
2. 3. 1. GC-MS experimental method
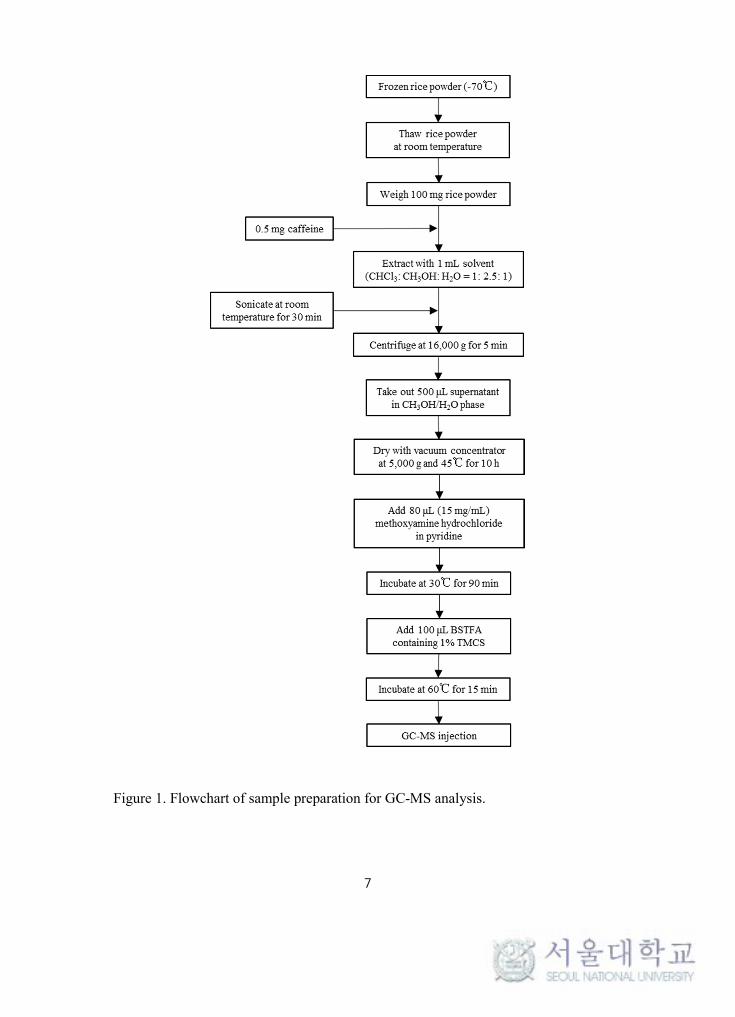
The method of sample extraction and preparation was in accordance with previously
developed study[9], as shown in Figure 1. To be specific, 100 mg of rice powder mixed
with 0.5 mg of caffeine which was employed as the internal standard, were extracted
with 1 mL solvent mixture consisted of chloroform: methanol: water (1:2.5:1, volume
ratio). The extraction was performed using sonication treatment at room temperature
for 30 min. Then, the extract was centrifuged at 16,000 g (g = 9.8 m/s2) for 5 min and
500 µm supernatant of the methanol/water phase was transferred to a 2 mL clear crimp
top fixed insert vial. Therewith, the supernatant extract was dried using a SpeedVac
vacuum concentrator AES2010 at 5,000 g and 45°C for 10 h. After that, the dried
sample was oximated with 80 μL of methoxyamine hydrochloride dissolved in pure
pyridine (15 mg/mL) and incubated at 30°C for 90 min. Therewith, 100 μL of BSTFA
containing 1% TMCS was mixed into sample and then the mixture was kept at 60°C
for 15 min. The vial was covered with a cap and waiting for injection.
Page 16
7
Figure 1. Flowchart of sample preparation for GC-MS analysis.
Page 17
8
2. 3. 2. HPLC-MS experimental method
The optimized extraction method for plant metabolomics, which has been
investigated by previous study, was modified suitably to extract metabolites of rice
samples in this study[10], as shown in Figure 2. In brief, 100 mg of rice powder was
mixed with 1 mg of caffeine as the internal standard to evaluate the reproducibility
and stability of HPLC-MS analysis. The mixture was then extracted with 1 mL of 75%
isopropanol and sonicated at 90°C for 2 h, followed immediately by the centrifugation
at 12,000 g for 5 min. The supernatant was removed from the crude extract and
filtered with a 0.2 µm PTFE filter. The fine extract was collected for injection.
Especially, a randomized sequence was applied in HPLC-MS analysis.
Page 18
9
Figure 2. Flowchart of sample preparation for HPLC-MS analysis.
Page 19
10
2. 4. Instrumental analysis
2. 4. 1. GC-MS analysis
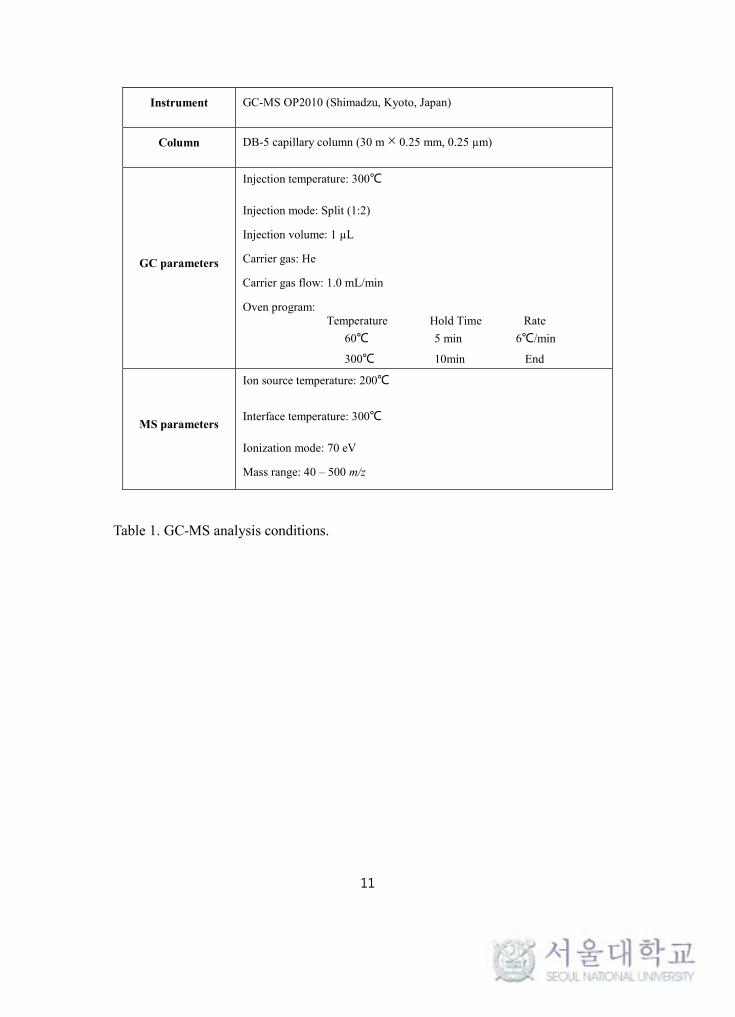
GC-MS analysis was performed by the GCMS-QP2010 system. The
chromatographic separation was accomplished with a DB-5 capillary column. The
analysis conditions are listed in Table 1. The GC oven temperature was firstly held at
60°C for 5 min, then the temperature rose to 300°C at a constant velocity of 6oC/min
and held at the final temperate for 10 min. 1 µL of sample was injected using 1:2 split-
mode at 300°C and helium was used as the carrier gas under a constant flow of 1.0
mL/min. The ion source temperature and the interface temperature were 200°C and
300oC, respectively. The ionization energy was 70 eV in electron impact mode. The
mass spectrometer was operated in scan mode from m/z 40 to 500. The sequence of
the sample in GC-MS analysis was set at random.
Page 20
11
Table 1. GC-MS analysis conditions.
Instrument GC-MS OP2010 (Shimadzu, Kyoto, Japan)
Column DB-5 capillary column (30 m × 0.25 mm, 0.25 µm)
GC parameters
Injection temperature: 300℃
Injection mode: Split (1:2)
Injection volume: 1 µL
Carrier gas: He
Carrier gas flow: 1.0 mL/min
Oven program: Temperature Hold Time Rate
60℃ 5 min 6℃/min
300℃ 10min End
MS parameters
Ion source temperature: 200℃
Interface temperature: 300℃
Ionization mode: 70 eV
Mass range: 40 – 500 m/z
Page 21
12
2. 4. 2. HPLC-MS analysis
HPLC-MS analysis was performed by using an Agilent HPLC system equipped
with an Acquity™ UPLC column (1.7 μm; 2.1 mm × 100 mm, BEH C18) and coupled
to an Agilent Q-ToF 6530 MS. The analysis conditions are listed in Table 2. The
column temperature was maintained at 40°C cooperated with the flow rate of 0.17
mL/min. As a fixed volume of injection, 5 μL of each sample was injected and
separated by the following gradient method with linear changes. Solvent A (water +
0.1% formic acid) and Solvent B (acetonitrile + 0.1% formic acid): 0 min, 100 % A, 0%
B; 5 min, 70 % A, 30% B; 15 min, 30 % A, 70% B; 25 min, 20 % A, 80% B; and 27
min, 0 % A, 100% B. As the equilibration time, 10 min of column equilibration was
executed after each sample injection. Furthermore, the mass spectrometer was
operated in ESI negative ionization mode, with the scan mass range of m/z 50 ~ 1500.
Flow injection of the lock mass standard was applied in each spectrum to ensure the
accuracy of the m/z value.
Page 22
13
Table 2. HPLC-MS analysis conditions.
Instrument HPLC (Agilent)
MS (Q-TOF 6530 MS, Agilent, USA)
Column Acquity™ UPLC column (1.7 µm; 2.1 mm × 100 mm, BEH C18)
LC parameters
Injection volume: 5 μL
Column oven temperature: 40°C
Flow rate: 0.35 mL/min
Gradient condition:
Solvent A (water + 0.1% formic acid)
Solvent B (acetonitrile + 0.1% formic acid)
0 min 100 % A; 5 min 70 % A; 15 min 30 % A; 25 min 20 % A; and 27
min 0 % A
MS parameters
Ionization mode: negative mode
Mass range: 50 - 1500 m/z
Dry gas: 8.0 L/min
Dry temperature: 200°C
Nebulizer pressure : 1.2 bar
Page 23
14
2. 5. Data processing
2. 5. 1. GC-MS data processing
The original data of GC-MS analysis were exported in *.CDF format for
subsequent data processing. As shown in Figure 3, the data alignment was
accomplished using MZmine 2.19 and the detailed processes and algorithms were
listed as follows: the centroid algorithm was employed in Mass detection; the baseline
cut-off algorithm was applied to deconvolution; the RANSAC aligner was used for
data bucketing and finally the gap filler with the same RT and m/z range was used to
fill missing values[11]. The data alignment parameters of MZmine 2.19 are listed in
Table 3. Additionally, the Automated Mass Spectral Deconvolution and Identification
System (AMDIS) was performed to group the fragment ions as well as precursor ions
with mass spectra. Prior to the statistical analysis, the aligned data were processed
using log-transformation and Pareto scaling. The multivariate statistical analysis then
came into effect on the processed data. The univariate and multivariate analyses were
performed regarding the typical workflow and guideline of MetaboAnalyst 3.0[12].
Specifically, PCA and PLS-DA were used as the classification methods for
discrimination. The variable importance in projection (VIP) score and false discovery
rate (FDR) were then applied to select markers. Subsequently, the marker candidates
were found out with NIST08 database. The markers were finally confirmed by the
comparison of mass spectra and chromatographic retention time between standards
and rice samples. The workflow of data processing is shown in Figure 4.
Page 24
15
2. 5. 2. HPLC-MS data processing
The raw data of HPLC-MS analysis were collected in mzData format and then
processed by MZmine version 2.19 (Figure 3)[11]. In detail, the processes and
algorithms used for HPLC-MS were roughly the same as those in GC-MS analysis,
expect the minor modification on certain parameters according to the differences
between the GC-MS and HPLC-MS platforms. The data alignment parameters of
MZmine 2.19 are listed in Table 3. Moreover, the mass spectra of fragment ions as
well as the corresponding precursor ions were collected. Following data aligning, the
data were processed using log-transformation and Pareto scaling before statistical
analysis. The univariate and multivariate analyses were then performed by
MetaboAnalyst 3.0 with the typical workflow and guideline[12]. PCA was employed in
classifying various samples, besides PLS-DA was mainly applied to select the markers
with FDR and VIP score. The markers were identified by their fragmentation pattern
of precursor ions using our internal library and the METLIN metabolite database
(http://metlin.scripps.edu/)[13]. The workflow of data processing is shown in Figure 4.
Page 25
16
Figure 3. The data alignment process of MZmine 2.19.
Page 26
17
Table 3. The data alignment parameters of MZmine 2.19.
GC-MS HPLC-MS
Conversion Noise level: 5 × 10³ Noise level: 5 × 10⁴
Chromatogram construction
Minimum height: 5 × 10³ m/z tolerance: 1 × 10⁻⁴
Minimum height: 5 × 10⁴
m/z tolerance: 3 × 10⁻⁵
Peak recognition Minimum peak height: 1 × 10⁴ Derivative threshold level: 20%
Minimum peak height: 5 × 10⁴
Derivative threshold level: 20%
Peak alignment
m/z tolerance at 1 × 10⁻⁴ Retention time tolerance: 0.05 min RANSAC iterations: 1 × 10⁵
m/z tolerance at 3 × 10⁻⁵ Retention time tolerance: 0.1 min RANSAC iterations: 1 × 10⁵
Peak gap filling m/z tolerance: 2 × 10⁻⁴ m/z tolerance: 1 × 10⁻⁴
Page 27
18
Figure 4. The workflow of data processing.
Page 28
19
3. Result and discussion
3. 1. Data processing results
3. 1. 1. Data processing results of GC-MS analysis
PCA, as a statistical analysis used to show the grouping trends, was applied on the
GC-MS data of three different cultivars of rice in DOM values of 0, 5, 7, 9 and 11. As
shown in Figure 5, the PCA plot depict that rice samples in DOM values of 0, 5 and 7
have a tendency to gather into one group, meanwhile, rice samples in DOM values of
9 and 11 are gathered together as the other group. This appearance illustrate that rice
components have no obvious difference within the same group. Moreover, the
noticeable differences are also revealed by PCA plot between these two groups. To
determine the rice components with remarkable variations among different DOM,
which are used as the markers among DOM, PLS-DA model (Figure 6) was applied
together with one-way ANOVA. More rigorously, the PLS-DA model was evaluated
by the leave-one-out-cross-validation (LOOCV) to test its reliability. According to the
R2 (goodness of fit) value of 0.732 and Q2 (predictive ability) value of 0.676, which
are two parameters used as the results of LOOCV, the discrimination in PLS-DA mode
was relatively good. The variable importance in projection (VIP) score and false
discovery rate (FDR) in ANOVA analysis were applied to pick out the markers, setting
the VIP score greater than 1 and the FDR lower than 0.05 as the criteria of selection.
The marker candidates were identified with the NIST08 database and then confirmed
using standards. Finally, a total of 10 markers were gained by GC-MS analysis,
including sugar group (D-glucose, D-fructose, D-galactose), sugar alcohol group (D-
mannitol, D-arabitol, D-glucitol) and amino acid group (L-proline), as well as
carboxylic acid group (D-malic acid, oxalic acid, D-gluconic acid). All the markers
Page 29
20
were listed in Table 4 and the relatively concentration of the markers in different DOM
are listed in Table 5.
Page 30
21
Figure 5. PCA score plot of the rice samples with different DOM in GC-MS analysis.
Page 31
22
Figure 6. PLS-DA score plot of the rice samples with different DOM in GC-MS
analysis.
Page 32
23
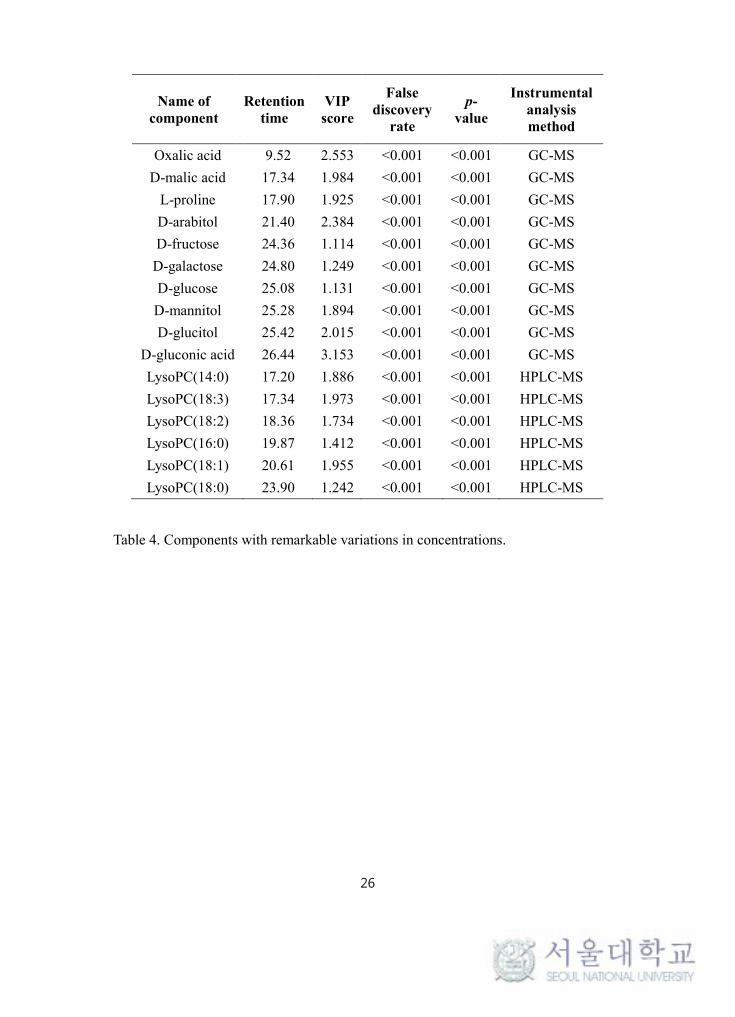
3. 1. 2. Data processing results of HPLC-MS analysis
Similar as GC-MS analysis, PCA was used with the classification of HPLC-MS
data, as shown in Figure 7. In detail, the same grouping tendency with GC-MS
analysis still exists. Additionally, PLS-DA was employed for revealing the significant
discrimination among samples. Subsequently, the evaluation of PLS-DA model
(Figure 8) based on LOOCV showed excellent result with R2 and Q2 values of 0.923
and 0.809, respectively. To obtain significant markers, only those who tallied with the
criteria of VIP score greater than 1 and FDR lower than 0.05 were selected. The
markers were then identified by using the stepwise collision energy MS/MS technique,
which confirmed the fragmentation patterns of markers by virtue of the previous study
in our laboratory[14]. Following the investigation, we found that all the markers belong
to the phospholipids, more specifically, all of them are lysophosphatidylcholines
(LysoPC). In summary, as listed in Table 4, the markers of HPLC-MS analysis are
LysoPC(14:0), LysoPC(16:0), LysoPC(18:3), LysoPC(18:2), LysoPC(18:1), and
LysoPC(18:0). Additionally, the relatively concentration of the markers in different
DOM were shown in Table 5.
Page 33
24
Figure 7. PCA score plot of the rice samples with different DOM in HPLC-MS
analysis.
Page 34
25
Figure 8. PLS-DA score plot of the rice samples with different DOM in HPLC-MS
analysis.
Page 35
26
Table 4. Components with remarkable variations in concentrations.
Name of component
Retention time
VIP score
False discovery
rate
p-value
Instrumental analysis method
Oxalic acid 9.52 2.553 <0.001 <0.001 GC-MS
D-malic acid 17.34 1.984 <0.001 <0.001 GC-MS
L-proline 17.90 1.925 <0.001 <0.001 GC-MS
D-arabitol 21.40 2.384 <0.001 <0.001 GC-MS
D-fructose 24.36 1.114 <0.001 <0.001 GC-MS
D-galactose 24.80 1.249 <0.001 <0.001 GC-MS
D-glucose 25.08 1.131 <0.001 <0.001 GC-MS
D-mannitol 25.28 1.894 <0.001 <0.001 GC-MS
D-glucitol 25.42 2.015 <0.001 <0.001 GC-MS
D-gluconic acid 26.44 3.153 <0.001 <0.001 GC-MS
LysoPC(14:0) 17.20 1.886 <0.001 <0.001 HPLC-MS
LysoPC(18:3) 17.34 1.973 <0.001 <0.001 HPLC-MS
LysoPC(18:2) 18.36 1.734 <0.001 <0.001 HPLC-MS
LysoPC(16:0) 19.87 1.412 <0.001 <0.001 HPLC-MS
LysoPC(18:1) 20.61 1.955 <0.001 <0.001 HPLC-MS
LysoPC(18:0) 23.90 1.242 <0.001 <0.001 HPLC-MS
Page 36
27
Compound Degree of milling
0 5 7 9 11
LysoPC(14:0) 1353127 1335999 1479523* 1514284 1524257
LysoPC(18:3) 1339377 1362138 1421423 1459404 1516321
LysoPC(18:2) 3185210 3220310 3372670 3497788** 3520806
LysoPC(16:0) 19548833 19746170 20031591 20401652 20536362
LysoPC(18:1) 13774596 13566995 14037549 14544688 14640271
LysoPC(18:0) 6553068 6623178 6891746 7212533 7301070
D-mannitol 7722306 6901524 6595264 3527745*** 3635264
D-arabitol 10962352 9953461 8598961 2425263** 2408529
D-glucitol 8425348 7325143 5852523 1236785 1255291
D-malic acid 8705232 7885636 5364724 319862*** 434160*
Oxalic acid 5915263 6652340 8986750 9356730 12649150
D-galactose 2194622 2297618 2476293 1887652* 1611349
D-Fructose 7794619 7879369 9125514 5666615** 4695667
D-glucose 10144437 10706346 10654313 78713710 7419566
L-proline 8313542 8113978 7597150 2874414** 2769371
D-gluconic acid 4955378 4647589 4401043 385521*** 513720*
* p-value < 0.05
** p-value < 0.01
*** p-value < 0.001
Table 5. The average peak areas of the markers in different DOM.
Page 37
28
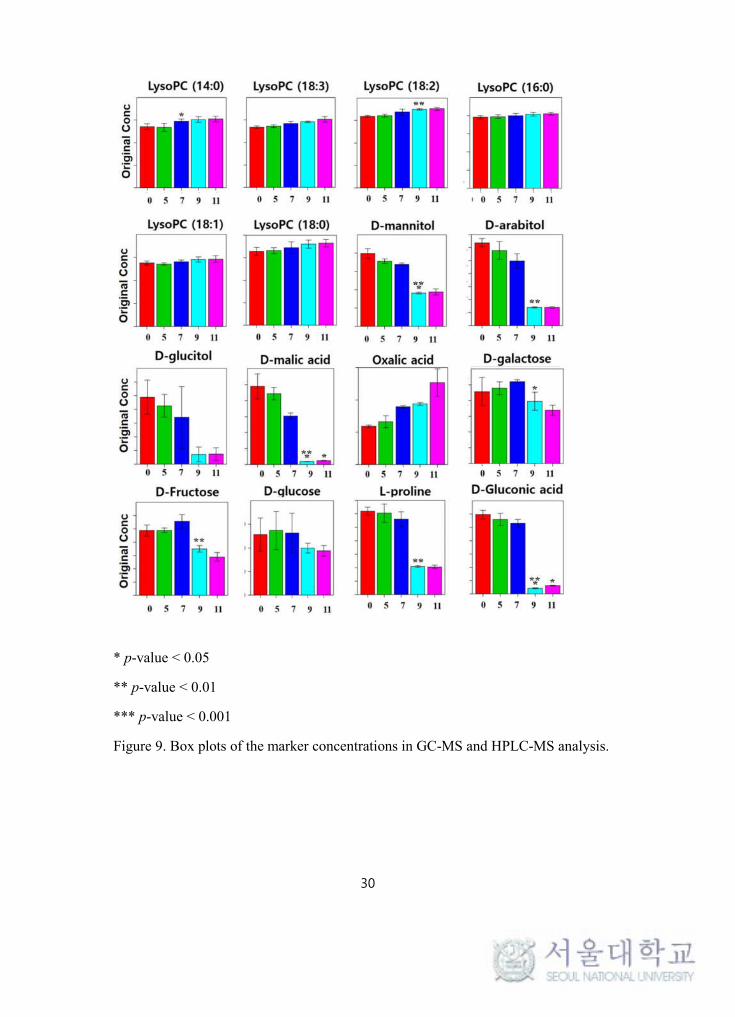
3. 2. Discussion
On the basis of the data processing results of GC-MS and HPLC-MS analysis, the
nutritional components of rice with remarkable variations among different DOM and
their variation tendency and regularity were revealed in this study. To show them
visually, the variation tendency and regularity of markers in GC-MS and HPLC-MS
analysis were depicted by comparing the concentration of markers among DOM via
box plots. As shown in Figure 9, three different cultivars of rice had the same variation
tendency and regularity of markers among DOM. In detail, the concentrations of most
markers in GC-MS analysis, except oxalic acid, decreased nonlinearly with the
increase of DOM. Among the groups of markers, the decrease tendency and regularity
of markers were distinctly different. Specifically, in sugar group, the concentration of
markers remained unchanged or even slightly increased with the increase of DOM
until reaching DOM of 7 and then reduced in DOM of 9 and 11. At the same time, the
concentrations of most markers in sugar alcohol group, amino acid group and
carboxylic acid group decreased gradually from DOM of 0 to 7 while dropped sharply
from DOM of 9. These variation regularities among DOM demonstrated that the
nutritional components are uneven distributed in rice. Additionally, the low milled rice
products (until DOM of 7) are abundant in sugars and sugar alcohols.
On the contrary, the concentrations of markers in HPLC-MS analysis increased
along with DOM increasing, as shown in Figure 9. The markers, which means
phospholipids, maintained at a low concentration state until getting DOM of 7 and had
rising tendency in DOM of 9 and 11. Based on variation regularities stated above, the
previous investigation was verified that phospholipids mostly exist in rice
endosperm[15]. We supposed the reason of increase tendency was that the weight
proportion of phospholipids in rice increase with increasing exposed parts of
Page 38
29
endosperm caused by milling. Additionally, the high milled rice products, especially
rice products in DOM of 11 contains larger proportion of phospholipids.
The benefits of sugar have long been known as the main energy source for the
human body in daily life. In addition, most sugar alcohols can provide calories and
sweet taste without raising plasma glucose. Nevertheless, the long-term excessive
intake of sugars will bring harm to health, such as hyperglycemia and diabetes[16]. On
the other side, the health benefits of phospholipids have also been extensively studied
before. In brief, considerable research infer that phospholipids may contribute to
decreasing cholesterol and cardiovascular risk, improving liver function and producing
the anti-inflammatory and anti-cancer effects on human bodies[6, 7, 17].
Page 39
30
* p-value < 0.05
** p-value < 0.01
*** p-value < 0.001
Figure 9. Box plots of the marker concentrations in GC-MS and HPLC-MS analysis.
Page 40
31
4. Conclusion
In conformity with all the statement in this study, the nutritional value of rice cannot
be simply evaluated on brown rice and white rice. Rice in different DOM have their
own advantages in health. Three different cultivars of Korean rice have common
nutrition features in the same DOM. Specifically, brown rice and the low milled rice
(until DOM of 7) are qualified to provide enormous nutrients and calories with less
risk of raising plasma glucose to the public by reason that they have more complete
structures of rice grain. Particularly, rice products in DOM of 7 have relatively good
texture and taste in the low milled rice. However, the high milled rice, especially rice
in DOM of 11, contains less sugars but great texture and taste as well as more content
of phospholipids which are beneficial to human bodies. So taking these characteristics
of rice into consideration, rice production and consumption are necessary to be
adjusted according to the different nutritional demands. In conclusion, this study
reveals the variation tendency and regularity of nutritional components in rice among
different DOM as well as extends and optimizes the evaluations of rice nutritional
value. In practical production and consumption of rice, this study is helpful to make
rational adjustment to meet a variety of demands. Further investigations would be
carried out on the health benefits inferred in this study.
Page 41
32
5. References
1. Babu, P.D. et al. (2009) Brown rice-beyond the color reviving a lost health food-a review. Magnesium 187 (13.10).
2. Dobermann, A. and Fairhurst, T. (2000) Rice: nutrient disorders & nutrient management, Int.
Rice Res. Inst. 3. Billiris, M. et al. (2012) Rice degree of milling effects on hydration, texture, sensory and
energy characteristics. Part 1. Cooking using excess water. Journal of food engineering 113 (4), 559-568.
4. Lamberts, L. et al. (2007) Effect of milling on colour and nutritional properties of rice. Food
Chemistry 100 (4), 1496-1503. 5. Ha, T.Y. et al. (2006) Changes in nutraceutical lipid components of rice at different degrees
of milling. European Journal of Lipid Science and Technology 108 (3), 175-181. 6. Liu, L. et al. (2013) Phospholipids in rice: significance in grain quality and health benefits: a
review. Food chemistry 139 (1), 1133-1145. 7. Hartmann, P. et al. (2009) Anti-inflammatory effects of phosphatidylcholine in neutrophil
leukocyte-dependent acute arthritis in rats. European journal of pharmacology 622 (1), 58-64.
8. Oikawa, A. et al. (2008) Rice metabolomics. Rice 1 (1), 63-71. 9. Kim, J.K. et al. (2007) Time-course metabolic profiling in Arabidopsis thaliana cell cultures
after salt stress treatment. Journal of Experimental Botany 58 (3), 415-424. 10. De Vos, R.C. et al. (2007) Untargeted large-scale plant metabolomics using liquid
chromatography coupled to mass spectrometry. Nature protocols 2 (4), 778-791. 11. Pluskal, T. et al. (2010) MZmine 2: modular framework for processing, visualizing, and
analyzing mass spectrometry-based molecular profile data. BMC bioinformatics 11 (1), 395. 12. Xia, J. and Wishart, D.S. (2016) Using MetaboAnalyst 3.0 for Comprehensive
Metabolomics Data Analysis. Current Protocols in Bioinformatics, 14.10. 1-14.10. 91. 13. Benton, H.P. et al. (2008) XCMS2: processing tandem mass spectrometry data for
metabolite identification and structural characterization. Analytical chemistry 80 (16), 6382. 14. Lee, S.J. et al. (2014) Senescing human bone-marrow-derived clonal mesenchymal stem
cells have altered lysophospholipid composition and functionality. Journal of proteome research 13 (3), 1438-1449.
15. Morrison, W. (1995) Starch lipids and how they relate to starch granule structure and
functionality. Cereal Foods World 40 (6), 437-446.
Page 42
33
16. Wolever, T.M. et al. (2002) Sugar alcohols and diabetes: a review. Can J Diabetes 26 (4), 356-362.
17. Küllenberg, D. et al. (2012) Health effects of dietary phospholipids. Lipids in health and
disease 11 (1), 3.
Page 43
34
국문초록
쌀 내에 존재하는 영양성분은 그 중요성으로 인해 오랫동안 과학적
분석의 대상으로 여겨져 왔다. 본 연구의 대상이기도 한 현미 및 백미는
영양적으로 상당한 차이를 나타낸다고 알려져 있으며 일반적으로 현미가
백미에 비해 우수한 영양적 가치를 가지고 있다고 알려져 있다. 그럼에도
불구하고 영양적 가치를 증명하는 포괄적이며 과학적인 연구는 여전히
진행되지 않았다. 특히 단순히 현미, 백미의 두가지 쌀의 성분 비교가 아닌
서로 다른 도정도 (degree of milling, DOM)에 따른 성분의 변화가 연구될
필요성이 있다. 본 연구는 액체 크로마토그래피-질량 분석기 (HPLC-MS) 및
가스 크로마토그래피-질량 분석기 (GC-MS) 기반의 대사체학을 응용하여 0,
5, 7, 9, 11 의 서로 다른 도정도를 가진 쌀을 분석, 다양한 도정도에 따른
성분 변화를 추적하였다. 다양한 도정도간에 유의미한 변화를 보이는
성분을 검출하기 위해 주성분 분석 (principal component analysis, PCA) 및
최소 자승 분석 (partial least squares discriminant analysis, PLS-DA)을
이용하였다. 결론적으로 sugar 및 sugar alcohol 성분 함량이 도정도의 증가에
따라 감소하는 것을 확인할 수 있었다. 반면 phospholipid 의 경우에는
도정도의 증가에 따라 성분의 함량이 증가하는 것을 관찰 할 수 있었다.
이러한 결과는 일반적인 통념과 달리 항상 현미가 영양학적으로 백미보다
우수한 것이 아니며 phospholipid 와 같은 특정 성분의 경우 백미에서 더욱
많은 함량을 섭취할 수 있음을 증명하는 것이다. 도정도에 따른 성분
변화를 관찰한 본 연구를 통해 영양학적인 측면에서의 합리적인 쌀 생산
및 소비에 긍정적인 영향을 기대할 수 있다.
Page 44
35
주요어: 쌀 대사체학; 도정도(DOM); 가스 크로마토그래피-질량 분석기 (GC-
MS); 액체 크로마토그래피-질량 분석기 (HPLC-MS); Sugar; phospholipid.
학 번: 2015-22390


![Metabolomics Basics[1]](https://static.documents.pub/doc/80x56/553de2815503466f378b4864/metabolomics-basics1.jpg)


