Studies on the function and regulation of glucose transporters GLUT2 and GLUT4 in teleost fish Estudios sobre la función y regulación de los transportadores de glucosa GLUT2 y GLUT4 en peces teleósteos Rubén Marín Juez ADVERTIMENT. La consulta d’aquesta tesi queda condicionada a l’acceptació de les següents condicions d'ús: La difusió d’aquesta tesi per mitjà del servei TDX (www.tdx.cat) ha estat autoritzada pels titulars dels drets de propietat intel·lectual únicament per a usos privats emmarcats en activitats d’investigació i docència. No s’autoritza la seva reproducció amb finalitats de lucre ni la seva difusió i posada a disposició des d’un lloc aliè al servei TDX. No s’autoritza la presentació del seu contingut en una finestra o marc aliè a TDX (framing). Aquesta reserva de drets afecta tant al resum de presentació de la tesi com als seus continguts. En la utilització o cita de parts de la tesi és obligat indicar el nom de la persona autora. ADVERTENCIA. La consulta de esta tesis queda condicionada a la aceptación de las siguientes condiciones de uso: La difusión de esta tesis por medio del servicio TDR (www.tdx.cat) ha sido autorizada por los titulares de los derechos de propiedad intelectual únicamente para usos privados enmarcados en actividades de investigación y docencia. No se autoriza su reproducción con finalidades de lucro ni su difusión y puesta a disposición desde un sitio ajeno al servicio TDR. No se autoriza la presentación de su contenido en una ventana o marco ajeno a TDR (framing). Esta reserva de derechos afecta tanto al resumen de presentación de la tesis como a sus contenidos. En la utilización o cita de partes de la tesis es obligado indicar el nombre de la persona autora. WARNING. On having consulted this thesis you’re accepting the following use conditions: Spreading this thesis by the TDX (www.tdx.cat) service has been authorized by the titular of the intellectual property rights only for private uses placed in investigation and teaching activities. Reproduction with lucrative aims is not authorized neither its spreading and availability from a site foreign to the TDX service. Introducing its content in a window or frame foreign to the TDX service is not authorized (framing). This rights affect to the presentation summary of the thesis as well as to its contents. In the using or citation of parts of the thesis it’s obliged to indicate the name of the author.
Transcript
Studies on the function and regulation of glucose transporters GLUT2 and GLUT4 in teleost fish
Estudios sobre la función y regulación de los transportadores de glucosa GLUT2 y GLUT4 en peces
teleósteos
Rubén Marín Juez
ADVERTIMENT. La consulta d’aquesta tesi queda condicionada a l’acceptació de les següents condicions d'ús: La difusió d’aquesta tesi per mitjà del servei TDX (www.tdx.cat) ha estat autoritzada pels titulars dels drets de propietat intel·lectual únicament per a usos privats emmarcats en activitats d’investigació i docència. No s’autoritza la seva reproducció amb finalitats de lucre ni la seva difusió i posada a disposició des d’un lloc aliè al servei TDX. No s’autoritza la presentació delseu contingut en una finestra o marc aliè a TDX (framing). Aquesta reserva de drets afecta tant al resum de presentació de la tesi com als seus continguts. En la utilització o cita de parts de la tesi és obligat indicar el nom de la persona autora.
ADVERTENCIA. La consulta de esta tesis queda condicionada a la aceptación de las siguientes condiciones de uso: La difusión de esta tesis por medio del servicio TDR (www.tdx.cat) ha sido autorizada por los titulares de los derechos de propiedad intelectual únicamente para usos privados enmarcados en actividades de investigación y docencia. No se autoriza su reproducción con finalidades de lucro ni su difusión y puesta a disposición desde un sitio ajeno al servicio TDR. No se autoriza la presentación de su contenido en una ventana o marco ajeno a TDR (framing). Esta reserva de derechos afecta tanto al resumen de presentación de la tesis como a sus contenidos. En la utilización o cita de partes de la tesis es obligado indicar el nombre de la persona autora.
WARNING. On having consulted this thesis you’re accepting the following use conditions: Spreading this thesis by the TDX (www.tdx.cat) service has been authorized by the titular of the intellectual property rights only for private uses placed in investigation and teaching activities. Reproduction with lucrative aims is not authorized neither its spreading and availability from a site foreign to the TDX service. Introducing its content in a window or frame foreign to the TDX service isnot authorized (framing). This rights affect to the presentation summary of the thesis as well as to its contents. In the usingor citation of parts of the thesis it’s obliged to indicate the name of the author.
UNIVERSIDAD DE BARCELONA FACULTAD DE BIOLOGÍA
DEPARTAMENTO DE FISIOLOGÍA E INMUNOLOGÍA
Studies on the function and regulation of glucose transporters GLUT2 and GLUT4 in teleost fish
Estudios sobre la función y regulación de los
transportadores de glucosa GLUT2 y GLUT4 en peces teleósteos
Memoria presentada por Rubén Marín Juez
Para optar al grado de Doctor por la Universidad de Barcelona
Tesis realizada bajo la dirección del Dr. Josep Planas Vilarnau del Departamento de Fisiología e Inmunología, Facultad de Biología
Adscrita al Departamento de Fisiología e Inmunología, Facultad de Biología,
Universidad de Barcelona, programa de Acuicultura
Dr Josep Planas Vilarnau Rubén Marín Juez
Barcelona , 6 de Julio 2012 �
“Science is the poetry of reality” Richard Dawkins
Chapter III GLUT2: Establishment of a model to study fish GLUT2 function and regulation in mammalian pancreatic cells........................................................................................ 85
A pesar de que hay muchos nombres que deberían aparecer en esta tesis no me quiero extender en los agradecimientos ya que cada una de esas muchas personas que me han ayudado de alguno modo lo saben. Así que quiero agradecer: En primer lugar al Dr. Josep Planas Vilarnau por haber confiado en mi y haberme dado la oportunidad de empezar en el mundo de la ciencia. Gracias por guiarme en todo momento, ser una fuente inagotable de ideas y de energía, por preocuparse por mi formación y enriquecerme constantemente. A mi madre, Ana, la mejor persona con la que he tenido la suerte de encontrarme. Muestra de superación constante, fuente energía inagotable y ejemplo de cómo se ha de disfrutar cada segundo de la vida. Gracias por haber estado siempre conmigo, apoyarme, animarme y hacer tantos esfuerzos para que esté donde estoy. Ahora y siempre gracias. A mi “tato”, Iván, ejemplo de cómo luchar cada día para comprender un mundo extraño y no dejar de sonreír. Por nunca darse por vencido y por enseñarme lo que realmente importa. A mi abuelo, Joaquín, por estar siempre ahí y no fallarme nunca. Por ser mucho más que un abuelo y enseñarme tanto de la vida. A mi padre, abuel@s y ti@s, por preocuparse y hacer siempre lo que han creído mejor para mí. A Vanesa, todo lo que te tengo que decir intento hacerlo día a día, pero de todos modos gracias por darme tanto por tan poco. A todos los amig@s y compañer@s que a lo largo de este tiempo me han ayudado, gracias por estar ahí, por vuestro apoyo y comprensión. Gracias �
Introduction
Introduction
� �
1. Glucose transporters
Glucose is a central molecule to the metabolism in vertebrates and plays a pivotal
role as fuel and metabolic substrate (Wood and Trayhurn, 2003). Glucose is obtained
mainly in two ways: directly from the diet and derived from glycogen that is mainly stored
in the liver (Yamashita et al., 2001; Wood and Trayhurn, 2003; Postic et al., 2007).
Glucose derived from the diet is transferred from the lumen of the small intestine to the
circulation and subsequently into target cells to be used as an energy source or, when in
excess, to be stored as hepatic glycogen or as triglycerides (Yamashita et al., 2001;
Wood and Trayhurn, 2003; Postic et al., 2007). The transfer of glucose across plasma
membranes is mediated by two different groups of transporters: the Na+-dependent
glucose co-transporters (SGLT, members of a larger family of Na+-dependent
transporters, gene name SLC5A) (Wright, 2001); and by the facilitative Na+-independent
sugar transporters (GLUT family, gene name SLC2A) (Mueckler, 1994; Uldry and
Thorens, 2004).
The GLUT protein family belongs to the Major Facilitator Superfamily (MFS) of
membrane transporters (Pao et al., 1998) being most of them able to catalyze the
facilitative (energy-independent) bidirectional transfer of their substrates across
membranes (Thorens and Mueckler, 2010). GLUTs are proteins composed of
approximately 500 amino acids that possess 12 trans-membrane-spanning alpha
helices and a single N-linked oligosaccharide (Joost and Thorens, 2001; Joost et al.,
2002; Zhao and Keating, 2007; Augustin, 2010). The GLUT protein family members can
be grouped into three different classes based on their sequence similarities (Fig. 1).
Class I is comprised of the classical glucose transporters GLUT1 to GLUT4 and
GLUT14 which is a duplication of GLUT3; class II is comprised of GLUT5, GLUT7,
GLUT9, and GLUT11 and class III is comprised of GLUT6, GLUT8, GLUT10, GLUT12
and GLUT13 (proton driven myoinositol transporter HMIT) (Joost and Thorens, 2001;
Joost et al., 2002; Zhao and Keating, 2007; Augustin, 2010).
Introduction
��
Figure 1. The glucose transporter family members. A, Unrooted radial phylogenetic tree showing the
relationship between the 14 human GLUT protein family members. Adapted from (Augustin, 2010). B,
Summary of GLUT proteins indicating the tissue where each member appears expressed.
Introduction
� �
2. Class I facilitative glucose transporters
The class I of facilitative glucose transporters includes GLUT1 to GLUT4 and
GLUT14, and these transporters have been extensively characterized in terms of
structure, function and tissue distribution (Fig. 1 and 2). GLUT1 is expressed mainly in
2). However, this analysis also demonstrated that this region lacked identifiable TATA
boxes. In this light, we searched for CpG islands which, together with the multiple
predicted SP-1 transcription factor binding sites, are characteristic of the TATA-less
promoters (Anish et al., 2009, Zhu et al., 2008). Using MethPrimer software
(http://www.urogene.org/methprimer/(Li and Dahiya, 2002)) it was determined that the
cloned genomic region of the Fugu GLUT4 gene contains a CpG island of 260 bases,
between -234 and +93 nucleotides, with 163 CG dinucleotides (Fig. 3).
Chapter I
���
Figure 2. Analysis of the 5´ flanking region of the Fugu GLUT4 gene. Sequence of the -1132/+277
Fugu GLUT4 promoter sequence. The three transcriptions start sites are indicated with an asterisk (*).
Positions are given relative to the major transcription start site assigned with the +1 position. The
translation start codon ATG is indicated with capital letters. Putative binding sites for transcription factors
are underlined. Promoter specific reverse GSP nested primer is underlined with an arrow. Blue boxes
highlight the predicted CpG island.
Chapter I
� ��
Figure 3. Prediction of a CpG island (blue area) within the 5´ cloned region of the Fugu GLUT4
gene. Black arrows indicate the positions delimiting the CpG island relative to the +1 TSS.
Next, we examined the conservation profile of the available teleost fish genomic
sequences from databases corresponding to the 1.3 kb genomic DNA upstream to the
GLUT4 gene using zPicture software. Sequence comparison between tetraodon
(Tetraodon nigroviridis) and Fugu showed two major regions, between -786/-334 and -
234/+182 nucleotides, that were highly conserved, with a similarity higher than 70%,
(Fig. 4). A similar conserved sequence profile was observed between stickleback
(Gasterosteus aculeatus) and Fugu, with similarities between 50% and 70% in the
conserved regions (Fig. 4). Despite the lack of significant similarities between the
medaka (Oryzas latipes) and Fugu GLUT4 promoters, comparison between medaka
and stickleback sequences confirmed that the GLUT4 promoters of all species analyzed
contain two conserved areas, one of which surrounds the TSS+1 (Fig.4). Overall, these
results indicate that the regions comprised between -786/-334 and -234/+182
nucleotides contain most of the relevant predicted binding motifs involved in the
regulation of the Fugu GLUT4 gene, as well as the TSS+1.
Identification of the transcriptional regulatory regions of the Fugu GLUT4 gene
To verify the functionality of the cloned Fugu GLUT4 promoter, we first transiently
transfected the luciferase construct containing the 1.3 kb DNA fragment (from now on
denoted as -1132) into L6 cells. In parallel, a similar luciferase construct containing the
rat GLUT4 promoter was transiently transfected as a control for the activity of the cloned
Chapter I
���
Fugu GLUT4 promoter. These experiments indicated that the Fugu GLUT4 promoter
was functional and that its basal activity was significantly higher compared to that of the
mammalian GLUT4 promoter (Fig. 5A).
Figure 4. ECR Browser conservation profile of the 5´ region of the Fugu GLUT4 gene. Sequence
elements of significant length (≥ 100 nucleotides) that present a sequence homology higher than 60% are
highlighted in red and depicted with the dark-red rectangles on the top of the graph. The horizontal axis
represents the position of the nucleotides within the 1314 bp sequence. The vertical axis represents the
percent of identity between the aligned genomes. In the bottom we show a schematic representation of
the -1132 Fugu GLUT4 gene promoter that highlights the most relevant predicted binding sites.
Chapter I
� ��
To further characterize the promoter regions of the Fugu GLUT4 promoter that
are responsible for its basal activity, we generated a set of six luciferase reporter gene
constructs containing consecutive deletions of the Fugu GLUT4 -1132 construct (Fig.
5B) and we transiently transfected them into L6 cells. When compared to the -1132
construct, the -901 and -826 constructs showed significantly higher transcriptional
activity, whereas the -669, -383 and -132 constructs appeared to be similar to the -1132
construct and the +94 construct presented the lowest promoter activity with
transcriptional levels similar to the empty vector (Fig. 5B). Transcriptional levels shown
by both -901 and -826 constructs suggest the presence of a negative regulatory region
upstream, between the -1132 and -826 nucleotides, and a positive regulatory region
within this region, between -901 and -826 nucleotides.
These results demonstrated that the region comprised between -132 and +94
contains essential elements required for the basal activity of the Fugu GLUT4 promoter.
This in consistent with the in silico predictions which identified PPAR-γ, HIF1 SP1/GC-
box and NF1 transcription factors binding sites as well as a CpG island within this region
where the TSS+1 is located. Furthermore, these results strongly suggest that the core
sequence of the basal promoter is localized in the region -132 to +94.
Chapter I
���
Figure 5. Activity of the Fugu GLUT4 promoter in transiently transfected L6 cells. A) Basal activity of
the rat GLUT4 (Rat-GLUT4) and Fugu GLUT4 (Fugu-GLUT4) promoters transiently transfected into L6
muscle cells. Data are normalized to the relative expression of Renilla luciferase activity, setting the
activity of the rat GLUT4 promoter to 1. Data are shown as fold change in activity compared to Rat-
GLUT4 vector and expressed as mean ± S.E. of triplicate independent experiments. * indicates statistical
significant differences (p<0.05). B) Basal activity of Fugu GLUT4 promoter deletion constructs transiently
transfected into L6 muscle cells. Data are normalized to the relative expression of Renilla luciferase
activity, setting the level of the different deletion constructs relative to the -1132 basal activity. Data are
shown as fold change in activity compared to the -1132 promoter and expressed as mean ± S.E. of at
least three independent experiments. Different letters indicate statistical significant differences between
deletion constructs (p<0.05).
Chapter I
� ��
Regulation of the activity of the Fugu GLUT4 promoter by Insulin
In order to study whether insulin exerts a regulatory effect on GLUT4 expression
at the level of transcription, we transiently transfected L6 myoblasts with the rat and
Fugu GLUT4 promoters and stimulated the transfected cells with human recombinant
insulin (100 nM) for 18 h. Insulin treatment decreased the activity of the rat and Fugu
GLUT4 promoters by approximately 50% (Fig. 6), confirming the previously described
effect of insulin on the rat GLUT4 promoter activity in L6 myoblasts and myotubes (Giron
et al., 2008) as well as on the mouse GLUT4 promoter in 3T3-L1 adipocytes (Cooke
and Lane, 1998; Cooke and Lane, 1999).
Figure 6. Activity of the rat and Fugu GLUT4 promoters in transiently transfected L6 cells stimulated with insulin. Rat and Fugu GLUT4 promoters were transiently transfected into L6 muscle
cells and stimulated with human recombinant insulin (100 nM) for 18 hr. Data are normalized to the
relative expression of Renilla luciferase activity, setting the activity of the non-stimulated promoter to 1.
Data are shown as fold changes in activity compared to the non-stimulated promoter and expressed as
mean ± S.E. of at least three independent experiments. * indicates statistical significant differences with
respect to the non-stimulated promoter (p<0.05).
Chapter I
���
We next performed dose-response and time-course experiments in the absence
or presence of insulin at concentrations of 1, 10 and 100 nM during 18 h (Fig. 7) and at
different times (from 0.5 to 18 h) at a concentration of 100 nM (Fig. 8). Insulin appeared
to reduce the activity of the Fugu GLUT4 promoter in a dose- and time-dependent
manner. Specifically, the activity of the Fugu GLUT4 promoter was significantly reduced
with respect to the control at 10 and 100 nM insulin and at 4, 8 and 18 h in the dose-
response and time-course experiments, respectively.
Figure 7. Activity of the Fugu GLUT4 promoter transiently transfected into L6 muscle cells in
response to different insulin concentrations (1, 10 and 100nM) after 18 hours. Data are normalized
to the relative expression of Renilla luciferase activity, setting the activity of the non-stimulated promoter to
1. Data are shown as fold changes in activity compared to the non-stimulated promoter and expressed as
mean ± S.E. of at least three independent experiments. Different letters indicate statistical significant
differences (p<0.05).
To further characterize the regions potentially involved in the regulation of the
activity of the Fugu GLUT4 promoter by insulin, we transiently transfected L6 myoblasts
with the various deletion constructs and incubated the cells (Fig. 9) for 18 h in the
absence or presence of insulin (100 nM). All the six constructs generated showed a
significant reduction in their transcriptional activity in response to insulin.
Chapter I
� ��
Figure 8. Activity of the Fugu GLUT4 promoter transiently transfected into L6 muscle cells at
different time points (0,5, 1, 2, 4, 8 and 18 hours) in the absence or presence of insulin (100nM).
Data are normalized to the relative expression of Renilla luciferase activity, setting the activity of the non-
stimulated constructs to 1. Data are shown as fold changes in activity compared to the non-stimulated
constructs and expressed as mean ± S.E. of at least three independent experiments. * indicates statistical
significant differences with the non stimulated constructs (p<0.05). ** indicates statistical significant
differences with the non stimulated constructs (p<0.01). Different letters indicate statistical significant
differences between the stimulated constructs (p<0.05).
Chapter I
���
Figure 9. Activity of the Fugu GLUT4 promoter deletion constructs transiently transfected into L6 muscle cells in the absence or presence of insulin (100 nM) after 18 hours. Data are normalized to
the relative expression of Renilla luciferase activity, setting the activity of the non-stimulated constructs to
1. Data are shown as fold changes in activity compared to the non-stimulated constructs and expressed
as mean ± S.E. of at least three independent experiments. * indicates statistical significant differences with
the non stimulated constructs (p<0.05).
Regulation of the activity of the Fugu GLUT4 promoter by PPARγγ agonists
To address if PPARγ is involved in the regulation of the GLUT4 gene at the
transcriptional level, we tested the effects of PG-J2, a natural PPARγ ligand. For this
purpose, we stimulated L6 myoblasts that were transiently transfected with the -1132
construct in the absence or presence of PG-J2 (10 μM) for 18 h. Interestingly, treatment
with PG-J2 increased significantly the transcriptional activity of the Fugu GLUT4
promoter (Fig.10). To identify the regions involved in the regulation of the Fugu GLUT4
gene transcription by the PPARγ ligand, we transiently transfected L6 myoblasts with the
-826, -383 and +94 deletion constructs and incubated them in the absence or presence
of PG-J2 (10 μM) for 18 h. The -826 and -383 constructs showed a significant increase
in their transcriptional activity in response to PG-J2 whereas the +94 deletion construct
Chapter I
� ��
did not show any change in response to PG-J2 (Fig. 11). Interestingly, we observed a
relationship between the number of PPARγ binding motifs and the response to PG-J2.
Sequential deletions of the PPARγ binding motifs in the full GLUT4 promoter induced a
progressive reduction of the stimulatory effects of PG-J2, as shown by the significant
reduction of the activity of the -383 construct when compared with that of the -1132
construct (Fig.11).
Figure 10. Activity of the Fugu GLUT4 promoter in response to ligand-induced PPARγγ activation.
The -1132 Fugu GLUT4 promoter construct was transiently transfected into L6 muscle cells and
stimulated with PG-J2 (10 μM) for 18 hr. Data are normalized to the relative expression of Renilla
luciferase activity, setting the activity of the non-stimulated promoter to 1. Data are shown as fold change
in activity compared to the non-stimulated promoter and expressed as mean ± S.E. of at least three
Figure 11. Activity of Fugu GLUT4 promoter deletion constructs transiently transfected into L6
muscle cells in absence and presence of PG-J2 (10 μμM) after 18 hours. Data are normalized to the
relative expression of Renilla luciferase activity, setting the activity of the non-stimulated constructs to 1.
Data are shown as fold changes in activity compared to the non-stimulated constructs and expressed as
mean ± S.E. of at least three independent experiments. * indicates statistical significant differences with
the non stimulated constructs (p<0.05). Different letters indicate statistical significant differences between
the stimulated constructs (p<0.05).
Regulation of the activity of the Fugu GLUT4 promoter by electrical pulse
stimulation
To assess whether contractile activity regulates GLUT4 transcriptional activity, we
induced contractile activity in C2C12 myotubes by electrical pulse stimulation in order to
mimic exercise conditions. C2C12 myotubes transiently transfected with the -1132 Fugu
GLUT4 promoter construct that were stimulated electrically had significantly higher
levels of activity of the Fugu GLUT4 promoter than non-stimulated cells (Fig. 12).
Chapter I
� ��
Figure 12. Activity of the Fugu GLUT4 promoter in response to in vitro contraction induced by electrical pulse stimulation. The -1132 Fugu GLUT4 promoter construct was transiently transfected into
C2C12 muscle cells and electrically stimulated as described in Materials and Methods. Data are
normalized to the relative expression of Renilla luciferase activity, setting the activity of the non-stimulated
promoter to 1. Data are shown as fold change in activity compared to the non-stimulated promoter and
expressed as mean ± S.E. of at least three independent experiments. * indicates statistically significant
differences (p<0.05).
‘
Figure 13. Activity of Fugu GLUT4 promoter deletion constructs transiently transfected into C2C12
muscle cells in the absence or presence of electrical pulse stimulation. Data are normalized to the
relative expression of Renilla luciferase activity, setting the activity of the non-stimulated construct to 1.
Data are shown as fold change in activity compared to the non-stimulated constructs and expressed as
mean ± S.E. of at least three independent experiments. * indicates statistical significant differences with
the non stimulated constructs (p<0.05). Different letters indicate statistical significant differences between
the stimulated constructs (p<0.05).
Chapter I
���
Additionally, in order to characterize regions potentially involved in the regulation
of the Fugu GLUT4 gene transcription by contractile activity, we studied its effects on
C2C12 myotubes transiently transfected with the -826, -383 and +94 deletion constructs.
Interestingly, the activity of the -826 and -383 Fugu GLUT4 deletion constructs was
significantly up-regulated by electrical stimulation, while the +94 deletion construct
showed no changes in its transcriptional activity, confirming it as the deletion construct
that is missing the core promoter sequence (Fig. 13).
4. Discussion
In the present study, we have cloned the first functional GLUT4 promoter in a
non-mammalian species. The 5´-flanking region of the Fugu GLUT4 gene contains 3
TSSs, a conserved cluster of CpG dinucleotides, three SP1 binding motifs and lacks
TATA-box elements. These findings are consistent with previous reports indicating that
the GC-rich promoter regions are typically characterized by the presence of multiple
TSSs, the lack of TATA elements and the presence of multiple SP1 transcription factor
binding sites (Brandeis et al., 1994; Macleod et al., 1994; Zhu et al., 2008; Anish et al.,
2009). Interestingly, this correlates with the structure of the mammalian GLUT4
promoters that present multiple TSSs, lack TATA-box elements, contain binding sites for
several nuclear transcription factors including SP1 and C/EBP and present GC-rich
regions close to the core promoter (Kaestner et al., 1990; Buse et al., 1992; Liu et al.,
1992; Richardson and Pessin, 1993). By comparing the structure of the cloned Fugu
GLUT4 promoter with that of other vertebrate species, we have confirmed that there are
two highly conserved regions that contain most of the binding motifs potentially involved
in the transcriptional regulation of the GLUT4 gene (Fig. 2). Within these regions, the E-
box/MEF2/Klf cassette, located between nucleotides -531 and -478, and the core
promoter appear strongly conserved in all the analyzed species (Fig. 2). Similarly in the
rat, mouse and human GLUT4 promoters there is a highly conserved region containing
this cassette as part of a well-characterized enhancer region (Zorzano et al., 2005). It is
Chapter I
� ��
known that the Klf15 and E-box binding factors exert a synergistic effect on MEF2
(Zorzano et al., 2005), which is an essential binding site for the tissue-specific
expression of GLUT4 in mammals (Liu et al., 1994; Olson and Pessin, 1995; Thai et al.,
1998).
Next, we determined in vitro that the cloned promoter was capable of driving the
expression of the luciferase gene when expressed in the rat muscle cell line L6, thus
demonstrating the functionality of the Fugu GLUT4 promoter. Furthermore, the basal
activity of the Fugu GLUT4 promoter was 2-fold higher than that of the rat GLUT4
promoter. By generating a series of 5´-deletion constructs of the Fugu GLUT4 upstream
regulatory region, we confirmed that the +1 TSS as well as the presumptive core
promoter were indeed located between nucleotides -132 and +93, matching completely
the position of the predicted CpG island (Fig. 3). The -901 and -826 constructs were the
only deletions showing a significant increase in basal activity over that of the -1132
promoter construct. This finding suggests the existence of an enhancer region between
nucleotides -901 and -669. One possible explanation could be the presence of a tandem
of binding sites for Klf15 between nucleotides -665 and -677. In mammals, Klf15
strongly induces GLUT4 transcription by synergizing with MEF2 (Gray et al., 2002).
It is well accepted that the phosphatidylinositol 3-Kinase (PI3K)-dependent
pathway is one of the major mechanisms involved in the trafficking of GLUT4 and is
required for the insulin-dependent increase in the levels of GLUT4 at the cell surface
(Foster et al., 2001). Additionally, insulin has been widely described as an effective
inducer of GLUT4 mRNA and protein expression as well as of GLUT4 translocation in
fish (Capilla et al., 2004; Diaz et al., 2007), as in mammals (Bryant et al., 2002; Ishiki
and Klip, 2005; Larance et al., 2008). Strikingly, the effect of insulin on the regulation of
the transcription of the GLUT4 gene has not been fully characterized to date. Cooke and
Lane observed that insulin caused a repression of GLUT4 transcription that was
mediated by NF1 in adipocytes (Cooke and Lane, 1999). More recently, insulin has
been shown to inhibit GLUT4 transcription in mammalian muscle cells (Giron et al.,
Chapter I
���
2008). In the present study, we have confirmed the insulin-induced repression of the rat
GLUT4 promoter, used as a control for the activity of the Fugu GLUT4 promoter.
Interestingly, we have also observed that the activity of the Fugu GLUT4 promoter is
inhibited by insulin in a dose- and time-dependent manner. In view of the known
stimulatory effects of insulin on GLUT4 mRNA levels in skeletal muscle in fish and
mammalian species, the inhibition of the transcriptional activity of the GLUT4 promoter
is difficult to explain. One possibility is that the regions in the GLUT4 promoter that may
mediate its transcriptional activation may have been located upstream of the cloned
GLUT4 promoters examined (i.e. 1.3 kb for the Fugu gene and 2.3 kb for the rat gene).
Another possibility to try to explain the discrepancy between the effects of insulin on
GLUT4 mRNA levels and GLUT4 promoter activity is that prolonged treatment of L6
muscle cells in the presence of insulin may have induced insulin resistance. However,
the minimal effective insulin concentrations (10 nM) and incubation times with insulin (4
h) that lead to the decrease in the activity of the Fugu GLUT4 promoter are difficult to
reconcile with the idea that insulin may be causing an insulin resistance phenotype in L6
cells. Interestingly, in the case of the Fugu GLUT4 promoter, all the promoter deletions,
including the +94 construct, were repressed by insulin, suggesting that the promoter
region that is downstream of the TSS may contain the necessary elements for mediating
the repression of the GLUT4 gene. Further studies will be needed to identify the
upstream regions responsible for the activation of GLUT4 promoter activity by insulin.
Next, in order to study other mechanisms potentially involved in the regulation of
the Fugu GLUT4 promoter activity, we investigated the in vitro effects of PPARγ
activation and experimentally controlled contraction of mammalian muscle cells
expressing the Fugu GLUT4 promoter construct. Specifically, we stimulated L6 cells
transiently transfected with the -1132 construct with PG-J2, an endogenous PPARγ
agonist, and we also stimulated C2C12 cells transiently transfected with the -1132
construct with electrical pulse stimulation in order to induce contractile activity. Both
stimuli resulted in an increase in the Fugu GLUT4 promoter activity. PPARs are ligand–
activated transcription factors from the nuclear receptor family. Three PPAR isoforms (α,
Chapter I
� ��
β and γ) have been described, and they differ in their tissue distribution and ligand
specificity (Schoonjans et al., 1997). In particular, PPARγ is involved in the regulation of
lipid metabolism and glucose homeostasis (Olefsky and Saltiel, 2000) and is expressed
in adipose and muscle tissue (Fajas et al., 1997). Furthermore, PPARγ has been shown
to repress GLUT4 promoter activity in adipocytes (Armoni et al., 2003), while treatment
with synthetic PPARγ agonist agents called thiazolidinediones (TZD) in obese Zucker
fa/fa rats increased GLUT4 mRNA levels (Hallakou et al., 1997). PG-J2 has been shown
to be the most potent natural ligand of PPARγ (Forman et al., 1995; Kliewer et al., 1995).
Our results confirm that transcription of the GLUT4 gene is significantly activated by PG-
J2, decreasing gradually with the ablation of the PPAR/RXR motifs. This is consistent
with the fact that PPARγ receptors heterodimerize with retinoid X receptor-α (RXR) to
exert their transcriptional activation (Armoni et al., 2003). On the other hand, previous
studies regarding the transcriptional regulation of the GLUT4 gene by PG-J2 are
conflicting. Treatment of explanted aortas with PG-J2 caused an increase in GLUT4
expression (Atkins et al., 2005), while in primary rat adipocytes stimulation with this
endogenous agonist repressed GLUT4 promoter activity (Armoni et al., 2003).
Muscle contraction and chronic contractile activity of skeletal muscle cells have
also been reported to stimulate GLUT4 gene transcription (Slentz et al., 1992; MacLean
et al., 2002; Silva et al., 2005; Lima et al., 2009). In the present study, we have used
electrical pulse stimulation in differentiated C2C12 myotubes to mimic the effects of
exercise in vitro. Interestingly, all the deletion constructs containing the HIF-1 motif
showed a significant increase in the transcriptional activity in response to electrical pulse
stimulation. This result is in agreement with previous data indicating that HIF-1 binding
factor participates in contraction-induced GLUT4 transcriptional activity (Silva et al.,
2005; Lima et al., 2009). Furthermore, this supports the notion that GLUT4 expression is
induced under hypoxic conditions (Royer et al., 2000) and provides a new evidence for
the important role of HIF-1 as an activator of GLUT4 transcription when the partial
tension of oxygen falls in muscle fibers during exercise (Wagner, 2001).
Chapter I
���
In summary, our results indicate that we have cloned the first functional GLUT4
promoter in a non-mammalian species. The Fugu GLUT4 promoter presents most of the
binding sites described as important for the transcriptional regulation of the mammalian
GLUT4 gene. Moreover, being consistent with data available in mammals, the Fugu
GLUT4 promoter is regulated by insulin, PPARγ and contractile activity. Although most
of the mechanisms involved in the transcriptional regulation by these stimuli remain
unclear, this study contributes to the understanding of the complex regulation of the
GLUT4 transcriptional machinery.
Acknowledgements
We are deeply indebted to Dr. Shugo Watabe for the gift of the Fugu muscle sample and
Dr. Rafael Salto for the gift of the rat GLUT4 promoter. This study was funded by grants
AGL2009-07006 and CSD2007-0002 to J.V.P. Rubén Marín-Juez was supported by an
FPI fellowship from the Spanish government.
Chapter II
GLUT2:
Physiological role during early development in
teleost fish
“It is those who know little, and not those who know much, who so positively assert that
this or that problem will never be solved by science”
Charles Darwin
Chapter II
51
1. Introduction
The cellular uptake of glucose represents the main energy source for many
organisms and its entry into cells is facilitated by the family of passive diffusion glucose
transporters (GLUTs). The 14 different members of the GLUT family are integral
membrane proteins that contain 12 membrane-spanning helices with both the amino
and carboxyl termini exposed to the cytosol (Wood and Trayhurn, 2003; Augustin,
2010). Each glucose transporter isoform plays a specific role in glucose metabolism as
determined by its pattern of tissue expression, substrate specificity, transport kinetics,
and regulated expression under different physiological conditions (Uldry and Thorens,
2004). Interestingly, the intestine, pancreas, kidney and liver, which all play key roles in
carbohydrate metabolism, express the facilitative glucose transporter GLUT2 (Thorens
et al., 1988; Fukumoto et al., 1989; Bell et al., 1990; Thorens et al., 1990).
Functionally, GLUT2 is a low-affinity transporter for glucose, fructose, mannose,
and galactose, but it is also a high–affinity transporter for glucosamine (Uldry et al.,
2002). As a class I glucose transporter, GLUT2 is predicted to have the consensus
structure characteristic of GLUTs belonging to this family with the only exception that the
QLS motif in helix 7 is not present (Burant et al., 1991; Baldwin, 1993). This motif is
known to confer substrate specificity and its absence in GLUT2 could explain the high
affinity of this transporter to D-glucose, D-fructose and glucosamine (Burant et al., 1991;
Baldwin, 1993; Uldry et al., 2002).
In mammals, GLUT2 is expressed at a very high level in pancreatic β-cells, being
more abundant in the microvilli than in the basolateral membrane (Orci et al., 1989).
GLUT2 is also expressed in the basolateral and apical membranes of intestinal and
kidney epithelial cells (Thorens et al., 1990; Thorens, 1992; Kellett and Helliwell, 2000;
Marks et al., 2003; Wright et al., 2003) as well as in the sinusoidal plasma membrane
and in endosomal fractions of hepatocytes (Thorens et al., 1990; Thorens, 1992;
Eisenberg et al., 2005). From a physiological point of view, the expression pattern of
Chapter II
52
GLUT2, together with the ability of GLUT2 to transport different types of hexoses at a
wide range of concentrations, ensures fast equilibration of glucose between the
extracellular space and the cell cytosol, displaying bidirectional fluxes in and out of the
cells (Leturque et al., 2005; Thorens and Mueckler, 2010). This mechanism contributes
to a number of different processes, such as intestinal and renal absorption of glucose,
the stimulation of insulin secretion by glucose in β-pancreatic cells, the entry and output
of glucose by the liver and the glucosensing capability of specific brain regions involved
in the regulation of glucose metabolism and food intake (Burcelin et al., 2000; Guillam et
al., 2000; Uldry and Thorens, 2004; Leturque et al., 2005; Marty et al., 2007; Eny et al.,
2008).
Amongst non-mammalian vertebrates, GLUT2 has been to date identified and
studied at the molecular level in avian and fish species (Wang et al., 1994; Krasnov et
al., 2001; Hall et al., 2006; Castillo et al., 2009; Terova et al., 2009). Particularly, studies
in teleost fish have shown that GLUT2 is expressed in the pancreas, liver and
hypothalamus in rainbow trout and Atlantic cod and in brain, heart, liver, kidney, muscle
and intestine in sea bass (Panserat et al., 2001; Hall et al., 2006; Polakof et al., 2007;
Terova et al., 2009) while in adult zebrafish GLUT2 expression was found mainly in
testis, brain, skin, kidney, intestine, liver and muscle (Castillo et al., 2009). Furthermore,
Castillo et al. showed that the sugar transport properties of zebrafish GLUT2 are similar
to what has been observed in mammals (Castillo et al., 2009). These data confirmed the
high degree of functional conservation between fish GLUT2 and its mammalian
homolog.
Regarding the physiological role of GLUT2, little is known to date in fish. It has
been shown that in fish, the expression of GLUT2 in the pancreas and in the hindbrain is
regulated by hormonal and metabolic signals (Polakof et al., 2007) whereas GLUT2
mRNA expression levels in the liver are not affected in fasting/re-feeding conditions
(Panserat et al., 2001; Hall et al., 2006). However, mRNA levels of fish GLUT2 in the
liver are up-regulated in acute and long-term hypoxic conditions (Terova et al., 2009).
Chapter II
53
Furthermore, recent studies have evidenced that GLUT2 expression in zebrafish is also
under nutritional regulation in the intestine (Castillo et al., 2009).
In the present study, we have used the developing zebrafish embryo model to
examine in vivo the physiological role of GLUT2. The ease of genetic manipulation,
rapid development and optical transparency of the zebrafish embryo provides a unique
opportunity to unravel the mechanisms following the perturbation of glucose
homeostasis associated with loss of function of this transporter. Our findings indicate
that the abrogation of zebrafish GLUT2 in vivo results in severe abnormalities in the
development of the brain and particularly in the neural progenitor cells. These alterations
are associated with impaired glucose uptake and a significant increase in cell apoptosis
in the morphant embryos. In addition, knockdown of GLUT2, coinciding with the
observed tissue distribution of this transporter, leads to changes on the patterning of
endoderm-derived tissues at early developmental stages.
2. Materials and methods
Zebrafish maintenance
Wild-type zebrafish of the AB/TL and Casper strains were maintained and staged
as described previously (Kimmel et al., 1995; Westerfield, 2000) in compliance with
Animal Welfare legislation.
Imaging
Embryos were examined with a Leica MZ16 FA fluorescence stereomicroscope
and images were acquired with a DFC420C camera (Leica) and Leica Application Suite
3.8 (LAS) Microscope Software. Pictures were analyzed using ImageJ 1.45 software
(National Institutes of Health, NIH) and the fluorescent signal was measured according
Chapter II
54
to Tucker and Lardelli (Tucker and Lardelli, 2007). TUNEL-positive cells were analyzed
and quantified using Icy 1.2.4.1 bio–imagining software (www.bioimageanalysis.org).
In situ hybridization and immunohistochemistry
In situ hybridization was performed as previously described (Thisse and Thisse,
2008). Antisense probes were generated for zebrafish GLUT2 (Castillo et al., 2009) and
for transferrin, elastase b pre-proinsulin ATOH1b, ATOH1c, PTF1a and NEUROD that
were amplified by PCR and subcloned into pGEM-T Easy vector (Promega). GLUT2
was linearized with SpeI and ATOH1b, ATOH1c, PTF1a and NEUROD were linearized
with SalI and used as template for the generation of riboprobes using the DIG and
Morphant embryos co-injected with rat GLUT2 mRNA recovered the brain structure
similar to control injected embryos (Fig. 7C). At 48 hpf, control and ATG morphant
embryos presented no significant differences in the axonal structure (Fig. 7D, E).
Figure 7. Morphological characterization of longitudinal axon tracts in the hindbrain of GLUT2deficient fish. To study the consequences of GLUT2 abrogation in the hindbrain structure, embryos
injected with control morpholino (Con MO) (A), ATG morpholino (ATG MO) (B) or embryos rescued with
rat GLUT2 mRNA (ATG MO Rescued) (C) at 24 hours post fertilization (hpf) were immunostained using
an antibody against acetylated tubulin. At this stage, morphant embryos showed disorganized axon tracts.
Rescued embryos showed a hindbrain structure similar to control injected embryos. By 48 hpf, embryos
injected with Con MO (D) and ATG MO (E) presented no differences. Lateral longitudinal fascicles (llf);
medial longitudinal fascicles (mlf).
Chapter II
65
Knockdown of GLUT2 influences brain development in zebrafish by affecting the
expression of markers for cerebellar progenitor cells
To assess the effects of GLUT2 abrogation in the hindbrain region we performed
ISH for various proneural genes: PTF1Aa, ATOH1b, ATOH1c and NEUROD (Fig. 8).
The probe for PTF1A marks progenitor cells of GABAergic neurons in the ventricular
zone (VZ) (Kani et al., 2010). ATOHb and ATOHc probes label progenitor cells of
glutamatergic neurons while NEUROD appears expressed in immature and mature
granule cells (Kani et al., 2010). Embryos injected with ATG MO lacked expression of
PTF1a at 24 hpf and at 48 hpf morphant embryos showed an expression pattern similar
to that in control embryos at 24 hpf (Fig. 8A-D). Proneural gene ATOH1b, although
appearing expressed in both control and ATG morphants, denoted severe alterations in
the hindbrain structure at 24 and 48 hpf, with no apparent effects at 72 hpf (Fig. 8E-J).
NEUROD expression in ATG morphants appeared mildly affected at 24 hpf, showing
loss of expression in the anterodorsal/anteroventral line facial placode ganglia (ad/av/f)
(Fig. 8L). At 48 and 72 hpf, embryos showed no significant alteration in NEUROD
expression (Fig. 8M-P). ATOH1c expression was not altered by 72 hpf (Fig. 8Q, R).
Defective glucose uptake in GLUT2-deficient embryos
In order to evaluate the functional impact of inhibiting GLUT2 expression, we
performed glucose uptake experiments using the fluorescently labeled glucose analog,
2-NBDG. Quantitative analysis of the fluorescent signal revealed a significant decrease
in 2-NDBG uptake in the head and body in ATG morphant embryos relative to controls,
keeping most of the glucose inside the yolk (Fig. 9A, B). In contrast, ATG morphants
rescued with the rat GLUT2 mRNA appeared to recover glucose uptake showing similar
levels relative to control embryos in body and yolk and a slight increase in the body (Fig.
9A, B).
Chapter II
66
Figure 8. Expression of proneural genes during cerebellar development in GLUT2 morphants.
Expression of PTF1a (A-D), ATOH1b (E-J), NEUROD (K-P) and ATOH1c (Q,R) in control injected
embryos at 24 hours post fertilization (hpf) (A, E, K), 48 hpf (C, G, M) and 72 hpf (I, O, Q); and in ATG
morphants at 24 hpf (B, F, L), 48 hpf (D, H, N) and 72 hpf (J, P, R). Anterodorsal/anteroventral line facial
placode ganglia (arrowhead).
Chapter II
67
Chapter II
68
Figure 9. Abrogation of GLUT2 results in inhibition of glucose uptake in vivo. (A) Bright field (upper
line), fluorescent (middle line) and overlay (bottom line) pictures of control, ATG morphants and rescued
embryos at 24 hours post fertilization. (B) Measurement of fluorescent signal in embryos injected with 2-
NBDG. Control injected embryos (Con MO) (A, D, G) displayed significant amounts of fluorescent glucose
throughout the embryo; in contrast, ATG morpholino injected embryos (ATG MO) (B, E, H) showed very
minimal fluorescent glucose visible at 60 min after injection. Embryos injected with ATG MO + rat GLUT2
mRNA (ATG MO Rescued) recovered glucose uptake to levels similar to Con MO. * indicates significant
differences compared with the Con MO injected embryos (p<0.05). # indicates significant differences
compared with ATG MO injected embryos (p<0.05).
Loss of GLUT2 leads to an increase in apoptotic cell death
Based on the observed expression of GLUT2 in the hindbrain and on the
consequences of GLUT2 knockdown in this brain region, we hypothesized that loss of
GLUT2 in zebrafish embryos could affect the incidence of programmed cell death.
Examination of cell death at 24 hpf using the vital dye acridine orange showed a
significant increase in cell death in the morphant embryos, mainly localized in the brain
area (Fig. 10B, C). ATG morphants co-injected with rat GLUT2 presented similar levels
of cell death to control morphants (Fig.10D). Quantitative measurement of the
fluorescent signal confirmed a significant 1.6 fold-increase (p<0.05) in cell death in
GLUT2 morphant embryos compared with control embryos, while rescued embryos
showed no significant differences with control morphants (Fig. 10E).
Chapter II
69
Figure 10. Abrogation of GLUT2 enhances programmed cell death. To assay for cell death, embryos
injected with control morpholino (Con MO) (A), ATG morpholino (ATG MO) (B, C) and ATG morpholino +
rat GLUT2 mRNA (ATG MO Rescued) (D) were stained with the vital dye acridine orange. At 24 hours
post fertilization there was an overall increase in programmed cell death primarily localized in the
hindbrain region. Fluorescent signal analysis confirmed a significant increase in programmed cell death in
ATG morphants (E). * indicates significant differences compared with the Con MO injected embryos
To further confirm that the observed increase in cell death in embryos with
abrogated GLUT2 expression corresponded to apoptotic cell death we performed
TUNEL assay, a method that specifically labels fragmented DNA, an established marker
of programmed cell death. A similar pattern of apoptosis was observed using this
technique, with significantly higher apoptotic cells present in GLUT2 morphant than in
control embryos at 24 hfp (Fig. 11).
Chapter II
70
Figure 11. Embryos with GLUT2 expression blocked present a higher incidence of apoptotic cell death. To assay for apoptosis, embryos injected with control morpholino (Con MO) (A), ATG morpholino
(ATG MO) (B) were detected by TUNEL assay, which preferentially stains apoptotic cells. At 24 hpf
GLUT2 morphants showed a significant increase of apoptotic cells (TUNEL-positive cells) (C). * indicates
significant differences compared with the Con MO injected embryos (p<0.01).
Abrogation of GLUT2 causes alteration in left-right asymmetry
We found that GLUT2 morphants showed altered left-right asymmetry of
endoderm-derived organs that express GLUT2, such as liver and pancreas. To better
characterize this effect, we performed ISH using specific probes for transferrin, elastase
b and pre-proinsulin, marker genes for liver, exocrine and endocrine pancreas,
respectively. Interestingly, all of them confirmed that the distribution of these organs was
altered (Fig. 11).
Chapter II
71
To confirm the significance of the effect of GLUT2 abrogation on the distribution
of visceral organs, we analyzed a number of GLUT2 morphant embryos (n ≥ 15) by ISH
using specific probes for transferrin, elastase b and pre-proinsulin (Fig. 12). We
observed that GLUT2 morphants presented alterations in the left-right axis in 69% of the
embryos for liver, 73% for the exocrine pancreas and 55% for the endocrine pancreas
(Fig. 12).
Figure 12. Expression of liver and pancreatic marker genes in GLUT2 morphants. Whole mount in
situ hybridization showing expression of zebrafish transferrin mRNA in liver in control injected embryos
(Con MO) (A) and in ATG morphant embryos (ATG MO) at 72 hours post fertilization (hpf). (B). Left side
view of FISH showing expression of pre-proinsulin in endocrine pancreas (C) and elastase b in exocrine
pancreas (D) in 120 hpf embryos injected with ATG morpholino.
Chapter II
72
Figure 13. The left-right asymmetry of visceral organs was altered in GLUT2 morphants.Percentage of left-right asymmetry of visceral organs altered in embryos injected with ATG morpholino
(ATG MO) compared with control-injected embryos (Con MO). To assess the position of the liver, the
endocrine and the exocrine pancreas we performed ISH using specific probes for transferrin, elastase b
and pre-proinsulin, respectively. The number of embryos showing organs in situs solitus or in situs
inversus positions is indicated inside the bars.
Transcriptomic profiling of GLUT2 morphants
To study the effects of GLUT2 abrogation on gene expression in zebrafish
embryos, we performed a transcriptome analysis of zebrafish embryos injected with the
ATG morpholino and compared them to control embryos. We used a zebrafish
oligonucleotide microarray platform previously validated and described (Stockhammer et
al., 2009; Zakrzewska et al., 2010; van Soest et al., 2011) to compare the gene
expression profile of ATG morphants to that of control embryos.
Microarray analysis was performed setting significance cut-offs at 1 and 1.5-fold
change at p<0.01 and 0.05 (sample t-test), respectively. In both cases, a large number
Chapter II
73
of differentially-expressed genes (DEGs) were obtained; 1025 up-regulated and 887
down-regulated genes by applying the 1.5-fold change and p<0.05 cut-off settings (total
n= 1912) and 726 up-regulated and 679 down-regulated genes by applying the 1-fold
change and p<0.01 cut-off settings (total n= 1405). Next, to better characterize the
annotated DEGs, we performed a GO analysis using DAVID software tools for functional
classification (Table 1). Analysis of GO-Biological process revealed a significant
enrichment in functional categories involved in programmed cellular death (such as anti
apoptosis, apoptosis, cell death and induction to programmed cell death), muscle
development (muscle organ development and muscle tissue development), neural
processes (neuron projection, neurotransmitter metabolic process and visual
perception), immune processes, patterning (pattern specification process and
regionalization) and response to hypoxia/oxygen levels.
Analysis of the microarray results confirmed that transferrin (studied in this
manuscript) and pancreatic and duodenal homeobox 1, marker genes for liver and
endocrine pancreas, respectively, showed altered expression in the GLUT2 MO
embryos (Table 2). Moreover, genes involved in insulin signaling and glucose
metabolism appeared differentially expressed, such as Insulin receptor substrate 2,
insulin-like growth factor binding protein 1, dipeptidyl-peptidase 4, ATPase, Na+/K+
transporting, alpha 1 polypeptide and calcium channel, voltage-dependent gamma
subunit 2 (Table 2). In addition, GLUT2 appeared strongly down-regulated, providing
further confirmation of the effectiveness of the knockdown. Furthermore, morphant
embryos showed reduced expression of the left-right determination factor 2 and
transforming growth factor, beta 1 (Table 2), both involved in the regulation of the
expression of the Nodal pathway components, required for the normal asymmetric
organization of the dorsal diencephalon and endoderm-derived tissues (Bisgrove et al.,
1999; Rodaway et al., 1999; Bisgrove et al., 2000). In addition, the expression of
parvalvumin, a marker gene for GABAergic neurons, was altered in morphant embryos
(Table 2). Several genes involved in apoptotic cell death were also found differentially
expressed, namely, programmed cell death 4, BCL2-associated agonist of cell death
Chapter II
74
and growth arrest and DNA-damage-inducible beta appeared up-regulated and
Figure 1. Insulin secretion by MIN6 cells. MIN6 cells were first incubated in KRBH-BSA for 2 h and then
incubated in KRBH-BSA solution in the absence (Control) or presence of 33.4 mM D-glucose for 2 h (High
Glucose). Data are shown as fold change in insulin secretion compared to the non-stimulated cells. Each
column represents the mean ± S.E. of six measurements derived from 3 independent experiments. *
indicates statistical significant differences with respect to the non-stimulated cells (p<0.05).
Knockdown of endogenous GLUT2 by siRNA
To knockdown GLUT2 in MIN6 cells we tested 4 different commercial candidate
siRNAs (Table 1). MIN6 cells were transfected with individual ON-TARGETplus
duplexes specifically designed for mouse GLUT2. Candidate siRNAs were transfected
at different concentrations (from 75 to 300 nM), observing consistent and significant
reduction of 13% of GLUT2 protein levels only when using the siRNA 4 at a final
concentration of 200 nM (Fig. 2). To assess whether the knockdown of GLUT2 was
exerting an effect on glucose-dependent insulin secretion, we treated MIN6 cells
transfected with siRNA 4 with D-glucose at a concentration of 33.4 mM. MOC control
cells significantly increased insulin secretion in response to glucose; however, siRNA 4-
transfected cells did not secrete insulin in response to glucose (Fig. 3). Therefore, our
data confirmed that the knockdown of GLUT2 was affecting insulin secretion in
transfected MIN6 cells
Chapter III
94
Figure 2. Effects of different candidate GLUT2 siRNAs on GLUT2 protein levels in MIN6 cells.
siRNAs were used at a final concentration of 200 nM and cells were lysed and collected at 48 h post-
transfection. (A) Representative immunoblots of GLUT2 and actin proteins in lysates of MIN6 cells
transfected with the candidate siRNA duplexes. 10 μg of protein were loaded in each lane. (B)
Densitometric analysis of GLUT2/actin ratios from MIN6 cells transfected with the candidate siRNAs. Each
column represents the mean ± S.E. of six measurements derived from 3 independent experiments in the
case of MOC and siRNA 4, and of four measurements derived from two independent experiments in the
case of siRNA1, 2 and 3. * indicates statistical significant differences with respect to the MOC cells
(p<0.05).
Chapter III
95
Figure 3. Insulin secretion by MIN6 cells transfected with siRNA 4. MIN6 cells were transfected with
the siRNA 4 at a final concentration of 200 nM. For stimulation, cells were first incubated for KRBH-BSA
for 2 h and then incubated with KRBH-BSA solution containing 33.4 mM D-glucose for 2 h. Non-stimulated
cells were maintained in KRBH-BSA without D-glucose. KRBH-BSA media were collected at 48 h post-
transfection. Data are shown as fold change of insulin secretion compared to MOC control cells. Each
column represents the mean ± S.E. of six measurements derived from 3 independent experiments. *
indicates statistical significant differences with respect to the MOC cells (p<0.05).
Overexpression assays with rat and zebrafish GLUT2
To determine the functionality of the rat and zebrafish GLUT2 constructs by
overexpressing rat or zebrafish GLUT2, we analyzed the basal secretion of insulin in
MIN6 cells transfected with increasing concentrations of these plasmids (from 2 to 6 μg)
(Fig. 4). For the two constructs, the results obtained suggested a strong reduction in
basal insulin secretion in cells transfected with 4 and 6 μg of the plasmids. In view of
this, and based on previous studies using the rodent construct (Hou et al., 2009), we
chose 2 μg as the dose for subsequent experiments. Next, we aimed to investigate the
glucose-stimulated insulin secretion levels in rat and zebrafish GLUT2-overexpressing
cells. The basal secretion of insulin was similar between control and transfected cells
and glucose also caused a similar increase (although statistically not significant) in
insulin secretion in all three groups (Fig. 5).
Chapter III
96
Figure 4. Insulin secretion by MIN6 cells transfected with different plasmid concentrations. MIN6
cells were transfected with 2, 4 and 6 μg of the two constructs used: rat-myc-GLUT2-GFP (Rat) and
zebrafish-GLUT2-GFP (Zebrafish). KRBH-BSA media were collected at 24 h post-transfection. Data are
shown as fold change of insulin secretion compared to MOC control cells. Each column represents the
mean ± S.E. of two measurements derived from 1 experiment.
Figure 5. Insulin secretion by MIN6 cells overexpressing rat and zebrafish GLUT2. MIN6 cells were
transfected with 2 μg of either construct: rat-myc-GLUT2-GFP (Rat) or zebrafish-GLUT2-GFP (Zebrafish).
For stimulation, cells were first incubated in KRBH-BSA for 2 h and then incubated with KRBH-BSA
containing 33.4 mM D-glucose for 2 h. Non-stimulated cells were maintained in KRBH-BSA without D-
glucose. KRBH-BSA media were collected 24 h post-transfection. Data are shown as fold change of
insulin secretion compared to MOC control cells. Each column represents the mean ± S.E. of two
measurements derived from 1 experiment.
Chapter III
97
Subsequently, to further study the functionality of the overexpressed rat and
zebrafish GLUT2, we examined glucose uptake under basal conditions in MIN6 cells
transfected with the rat and the zebrafish constructs. The results obtained indicated that
cell transfected with the zebrafish GLUT2 showed a significant increase in glucose
uptake (1.5 fold over control). However, MIN6 cells expressing the rat construct,
although showing an upward trend, did not show significant differences in glucose
uptake compared to control cells, probably due to the large variability among
experiments (Fig. 6).
Figure 6. Effects of overexpression of rat and zebrafish GLUT2 on glucose uptake in MIN6 cells.
MIN6 cells were transfected with 2 μg of either construct: rat-myc-GLUT2-GFP (Rat) or zebrafish-GLUT2-
GFP (Zebrafish), and 2-DG glucose uptake was determined at 24 h post transfection. Data are shown as
fold change of glucose uptake compared to control cells. Each column represents the mean ± S.E. of at
least six measurements derived from 3 independent experiments. * indicates statistical significant
differences with respect to the control cells (p<0.05).
4. Discussion
In higher vertebrates, it has been extensively demonstrated that pancreatic β-
cells are responsible for the synthesis and release of insulin granules as a consequence
Chapter III
98
of cellular depolarization through changes in the cellular ATP:ADP ratio (Deeney et al.,
2000; Henquin et al., 2003; Thorens, 2011). In the postprandial state, elevation of
circulating glucose is sensed in β-cells by the GLUT2 facilitative glucose transporter and
the hexokinase isoform glucokinase, leading to the above-mentioned changes in the
membrane and triggering the secretion of insulin (Deeney et al., 2000). Furthermore,
several states of impaired glucose-stimulated insulin secretion result from a decrease in
GLUT2 expression levels. Aging and states of hyperglycemia have been associated with
a decline in GLUT2 expression levels, whereas insulin resistance caused by a high fat
diet results in impaired plasma membrane targeting of GLUT2 (Laybutt et al., 2002;
Reimer and Ahren, 2002; Ohtsubo et al., 2005). The importance of GLUT2 in whole-
body glucose homeostasis has been established in GLUT2 null mice by showing that
they are hyperglycemic and hypoinsulinemic, having lost the glucose sensing capability
necessary for insulin secretion (Guillam et al., 1997; Thorens et al., 2000). Interestingly,
rescue of murine GLUT2 null pancreatic β-cells by re-expressing GLUT2 with
recombinant lentiviral constructs restored the glucose-dependent insulin secretion
(Guillam et al., 2000).
In view of these evidences, in this work we aimed to establish an in vitro system
for investigating the functional properties of zebrafish GLUT2 using the murine β-cell line
MIN6. MIN6 cells show glucose-stimulated insulin secretion similar to that of normal islet
cells (Ishihara et al., 1993). Therefore, MIN6 cells constitute a suitable heterologous
model system in which to examine the properties of zebrafish GLUT2 regarding its
ability to restore the normal physiological characteristics of GLUT2-deficient MIN6 cells.
In order to pursue this objective, we set out to establish the experimental conditions to
express constructs containing zebrafish GLUT2, using rat GLUT2 as a control, in the
murine β-cell line MIN6 lacking the endogenous GLUT2 by siRNA knockdown. Here we
show that we have been able to knock down the endogenous GLUT2 in MIN6 cells,
leading to a loss of glucose-stimulated insulin secretion. In addition, we evidenced that
MIN6 cells expressing the zebrafish GLUT2 construct significantly increased the
transport of glucose.
Chapter III
99
Making use of the MIN6 cell line, we first searched for the proper conditions to
abrogate GLUT2 expression in these cells by using different siRNAs. Thus, we showed
a reduction of GLUT2 protein levels in MIN6 cells transfected with siRNA 4 at a dose of
200 nM. In agreement with this result, we confirmed the loss of the ability to secrete
insulin in response to glucose in knocked down cells. Despite these positive results, it is
clear that a higher reduction of GLUT2 protein levels will be desirable in order to
establish a tractable system. In this light, future experiments combining the different
siRNAs available or designing more effective ones may be required for a more efficient
knock down of endogenous GLUT2 in MIN6 cells.
Next, we performed overexpression experiments in order to establish the
conditions for the subsequent rescue of GLUT2-deficient MIN6 cells. In our experiments,
we observed a dose-dependent inhibitory effect on glucose induced-insulin secretion,
where both constructs, at final concentrations above 2 μg/well, caused a reduction in
insulin secretion, maybe due to a toxic effect. Previous studies reported that successful
transfection of GLUT1, GLUT2 and GLUT4 was performed at the dose of 2 μg/well (Hou
et al., 2009). However, no differences in insulin secretion were observed between cells
expressing the mammalian and fish constructs and control cells. This could be due to
the fact that at 33.4 mM MIN6 cells are almost at the maximum of their responsiveness
(Ishihara et al., 1993).
Interestingly, we found that glucose uptake in cells expressing zebrafish GLUT2
was significantly increased, confirming that this transporter is able to contribute to the
glucose transport in a mammalian pancreatic cell. Furthermore, these results are
consistent with previous data showing that the cloned zebrafish GLUT2 was
successfully expressed, functional and characterized in terms of its sugar transport
properties in Xenopus oocytes (Castillo et al., 2009). On the other hand, cells
expressing rat GLUT2 construct did not show a significantly increase in glucose uptake
but showed higher average values than controls although with a large variability among
experiments. Further work is needed to clearly show that the zebrafish and rat GLUT2
are correctly expressed in MIN6 cells and functional.
Chapter III
100
To summarize, in this work we present the first steps for the establishment of an
in vitro model for the study of the function and regulation of zebrafish GLUT2. Future
experiments will be focused on the search for a more efficient knockdown of
endogenous GLUT2 in MIN6 cells, and the consequent rescue experiments with both rat
and zebrafish constructs. In addition, in vivo and in vitro immunolocalization in rescued
cells will be performed taking the advantage of the GFP protein fused to GLUT2 in the
constructs. Hereby, despite the fact that further optimization of this cell model is needed,
this MIN6-based system will allow us to analyze the functionality of the zebrafish
GLUT2. This will represent a valuable tool for the study of the physiological role of
GLUT2 since there is a high conservation of structure and functional characteristics
between fish and mammals.
Acknowledgements
We are deeply indebted to Dr. Albert Barberà (IDIBAPS, Spain) for the gift of the MIN6
cells and Dr. Jeffrey Pessin (Albert Einstein School of Medicine, NY, USA) for the gift of
the rat GLUT2 construct. We also would like to thank to Pura Marquez-Ruiz for her help
with the glucose uptake experiments and to Dr. Kousik Pramanick for his assistance
with the immunoblots. This study was funded by grants AGL2009-07006 and CSD2007-
0002 to J.V.P. Rubén Marín-Juez was supported by an FPI fellowship from the Spanish
government.
General Discussion
General Discussion
� ���
The aim of this thesis was to study the function and regulation of two of the major
players in the carbohydrate metabolism regulated by insulin, the facilitative glucose
transporters GLUT2 and GLUT4, in teleost fish. In non-mammalian vertebrates, GLUT2
has been poorly characterized to date. It has been shown that in various teleost species
GLUT2 is expressed in the main insulin sensitive tissues (Krasnov et al., 2001; Hall et
al., 2006; Polakof et al., 2007; Castillo et al., 2009; Terova et al., 2009), similar to what
is described in mammals (Joost and Thorens, 2001; Uldry and Thorens, 2004).
However, the functional properties and physiological role of GLUT2 have been poorly
characterized in fish. In view of this, we have characterized GLUT2 in zebrafish as it is
one of the most recognized models for the study of physiology, development and
metabolism (Briggs, 2002; Gerhard, 2003; Schlegel and Stainier, 2007). Regarding
GLUT4, our group has pioneered the research of this transporter in teleost species since
Planas and co-workers characterized the first GLUT4 homolog in a lower vertebrate
(Planas et al., 2000). Despite the fact that more attention has been placed in the study
of this glucose transporter than in GLUT2, information regarding the factors involved in
the regulation of the transcription of the GLUT4 gene have been poorly characterized in
mammals, while no data is available in lower vertebrates. For this purpose, in this study
we have analyzed the regulation of a teleost GLUT4 promoter under stimulus known to
modulate GLUT4 transcription and expression in mammals, such as insulin (Cooke and
Lane, 1998; Cooke and Lane, 1999; Giron et al., 2008), fiber contraction (Slentz et al.,
1992; MacLean et al., 2002; Silva et al., 2005; Lima et al., 2009) and PPARs (Armoni et
al., 2003). Thus, the major findings obtained from these studies according to the
proposed objectives are listed bellow:
To study the transcriptional regulation of the GLUT4 gene in teleost fish by
identifying and characterizing a functional promoter region of the Fugu (Takifugu
rubripes) GLUT4 gene.
In mammals, GLUT4 plays a pivotal rate-limiting role in the insulin-stimulated
glucose uptake in skeletal and cardiac muscle types and in white and brown adipose
tissues (Huang and Czech, 2007). Insulin has been largely studied as the main
General Discussion
����
modulator of this transporter because of its direct implication in pathologies of impaired
glucose uptake and insulin resistance such as type 2 diabetes and obesity (Kusari et al.,
1991; Shepherd and Kahn, 1999; Friedel et al., 2002; Karnieli and Armoni, 2008).
However, GLUT4 is also under the regulation of other factors, namely muscle
contraction, when extra fuel in the form of glucose is required by the cells (Lauritzen and
Schertzer, 2010).
GLUT4 in fish is also regulated by the action of factors related to glucose
metabolism and insulin-stimulated glucose uptake. A number of studies describe how
fish GLUT4 is regulated in muscle and adipose tissues at the levels of RNA expression,
protein synthesis and translocation to the plasma membrane (Capilla et al., 2002;
Capilla et al., 2004; Hall et al., 2006; Diaz et al., 2007; Diaz et al., 2007; Diaz et al.,
2009; Capilla et al., 2010; Polakof et al., 2010; Vraskou et al., 2011). However, there is
no information regarding the mechanisms that govern the regulation of the transcription
of the GLUT4 gene in teleosts. In order to investigate the role of factors exerting a
control on the transcription of the GLUT4 gene, we successfully cloned the GLUT4
promoter in Fugu. The 5´-flanking region of the Fugu GLUT4 gene showed similar
features to that in mammals: i.e. multiple TSSs, no TATA-box elements, GC-rich regions
close to the core promoter and several binding sites for nuclear transcription factors
including SP1 and C/EBP (Kaestner et al., 1990; Buse et al., 1992; Liu et al., 1992;
Richardson and Pessin, 1993). Structurally, comparative analysis between the cloned
promoter sequence and that of other fish promoters revealed a high degree of
conservation among teleost species and clearly evidenced that the Fugu GLUT4
promoter presents two highly conserved regions, one of which contains the E-
box/MEF2/Klf cassette. This cassette is also present in the mammalian GLUT4
promoters (Zorzano et al., 2005), where it plays an important role in the tissue-specific
expression of GLUT4 (Liu et al., 1994; Olson and Pessin, 1995; Thai et al., 1998).
Furthermore, we demonstrated the functionality of the cloned fugu GLUT4
promoter, showing a basal activity 2-fold higher than the rat GLUT4 promoter when
expressed in the mammalian skeletal muscle cell line L6. Additionally, by generating
General Discussion
� ���
several deletion constructs we were able to determine the minimal promoter, with the
core promoter being located between nucleotides -132 and +93.
To describe the transcriptional regulation of the Fugu glut4 gene by insulin, a
PPARγ agonist and contractile stimuli in skeletal muscle cells.
GLUT4 is regulated at different levels by a vast number of factors and, although
GLUT4 has received extensive experimental attention, the mechanisms through which
insulin and other mediators exert their action on GLUT4 are not completely understood
(Thorens and Mueckler, 2010). It is known that physiological states of altered glucose
homeostasis lead to variations in GLUT4 mRNA levels in muscle and adipose tissue.
Specifically, the expression of this transporter in skeletal muscle has been reported to
increase with muscle contraction resulting from physical exercise and to decrease
during states of insulin deficiency, including diabetes type II and obesity (Ren et al.,
1994; Kawanaka et al., 1997; Host et al., 1998; Thorens and Mueckler, 2010).
Therefore, the major focus of this work was to improve our understanding of the
molecular processes regulating glucose homeostasis by unraveling the mechanisms
involved in the regulation the transcription of the GLUT4 gene.
As mentioned above, insulin stimulates GLUT4 expression, protein synthesis and
translocation to the cell surface in mammals (Bryant et al., 2002; Ishiki and Klip, 2005;
Larance et al., 2008) as well as in fish (Capilla et al., 2004; Diaz et al., 2007). However,
the effect exerted by this hormone on GLUT4 at the transcriptional level has been poorly
characterized to date. In this study, we have observed that the activity of the Fugu
GLUT4 promoter is inhibited by insulin in a dose- and time-dependent manner,
consistent with previous evidences in mammals (Cooke and Lane, 1998; Cooke and
Lane, 1999; Giron et al., 2008). Furthermore, all the deletion constructs were repressed
by insulin, suggesting the presence of regulatory elements downstream of the TSS.
These results lead us to hypothesize that perhaps the cloned GLUT4 Fugu promoter
that we studied may have not contained the region(s) necessary for the transcriptional
General Discussion
����
activation of GLUT4 by insulin. In this regard further studies will be needed to identify
those regions.
Next, we investigated the effects of PPARγ activation in L6 murine muscle cells
transfected with the cloned Fugu GLUT4 promoter. PPARs are ligand–activated
transcription factors from the nuclear receptor family (Fajas et al., 2001). Amongst the
three PPAR isoforms (α, β and γ), PPARγ is mainly expressed in the insulin-sensitive
tissues, such as muscle and adipose tissue, and plays an important role in the
regulation of lipid metabolism and glucose homeostasis (Fajas et al., 1997; Olefsky and
Saltiel, 2000). Therefore, we studied the effects of PG-J2, a known endogenous PPARγ
agonist (Forman et al., 1995; Kliewer et al., 1995), as a possible modulator of the
transcription of the Fugu GLUT4 gene. Our results showed that stimulation with PG-J2
significantly stimulated the activity of the Fugu GLUT4 promoter and that this effect was
abolished in the Fugu GLUT4 promoter deletions lacking the PPAR/RXR motifs. This
result is in agreement with the fact that PPARγ receptors regulate transcription by
forming heterodimes with RXR (Armoni et al., 2003).
Finally, we investigated the in vitro effects of experimentally controlled muscle
fiber contraction using C2C12 contractile cells expressing the construct containing the
Fugu GLUT4 promoter. Using this system to mimic the effects of exercise in vitro in
differentiated myotubes we showed an increase in the transcriptional activity of the Fugu
GLUT4 promoter. Our findings also suggest the importance of the binding motif HIF-1
for the transcriptional activation of the Fugu GLUT4 promoter in response to muscle
contraction since all the HIF-1-containing constructs significantly increased their
transcription rate in response to electrical pulse stimulation, consistent with the literature
in mammals (Silva et al., 2005; Lima et al., 2009). Taken together, these results clearly
indicate that muscle contraction may be regulating the transcription of the GLUT4 gene
and suggest the implication of HIF-1 as a modulator of GLUT4 transcription in hypoxic
conditions derived from physical exercise (Wagner, 2001).
General Discussion
� ���
To study the localization of GLUT2 expression in zebrafish embryos throughout
early developmental stages.
GLUT2 is the member of the SLC2 family with the ability to transport the highest
amounts of dietary sugars, mostly glucose, and is expressed in the main tissues
involved in the handling of carbohydrates (i. e. liver, endocrine pancreas, etc.) (Bell et
al., 1990; Thorens and Mueckler, 2010). Due to its low affinity and high capacity, this
glucose transporter is able to handle large fluxes of sugars, equilibrating glycemic levels
in and out the cells. Moreover, GLUT2 is the main glucose transporter expressed in
pancreatic β-cells and mediates the glucose-induced secretion of insulin (Henquin et al.,
2003). Previous studies on GLUT2 in fish indicate that the tissue distribution and
functional properties of this glucose transporter are similar to that in mammals (Castillo
et al., 2009). Nevertheless, relatively little is known regarding the physiological role of
GLUT2 in lower vertebrates. In teleost fish, GLUT2 is known to be under the regulation
of plasma glucose in the hindbrain and pancreas (Polakof et al., 2007) and under the
nutrient availability in the intestine. However, in fasting/re-feeding experiments data are
contradictory to those available in mammals, since GLUT2 expression is not altered in
the liver in rainbow trout and Atlantic cod (Hall et al., 2006) and is inversely regulated in
the zebrafish intestine (Castillo et al., 2009). Apart from these differences in the
nutritional regulation of GLUT2 expression that could be attributed to species-specific
differences in GLUT2 regulation or function, little is know regarding the actual function of
GLUT2 during early development. For this reason, we studied the localization of GLUT2
expression during early development and the effects of abrogation of GLUT2 in the
zebrafish embryo.
The expression pattern of GLUT2 during embryonic development in zebrafish
was studied by ISH, observing transcripts in the liver, pronephric tubules, anterior
intestine, endocrine pancreas and neurons surrounding the hindbrain region. The
expression in the pronephric system and in the brain was detected early in development,
from 24 hpf and onwards. GLUT2 mRNA was first detected in the liver, anterior intestine
and endocrine pancreas at 72 hpf coinciding with the completion of the gut (Wallace and
General Discussion
����
Pack, 2003). Also at this point, the kidney expression of GLUT2 was mainly localized in
the pronephric tubules and the expression in the brain was located mainly in the
hindbrain, both in the corpus cerebelli and medulla oblongata. These results support the
notion of a glucose-sensing region in the zebrafish brain as hypothesized in rainbow
trout (Polakof et al., 2007) and in mammals (Marty et al., 2007).
To summarize, these findings are consistent with the observed distribution in
other teleost fish (Panserat et al., 2001; Hall et al., 2006; Polakof et al., 2007; Castillo et
al., 2009; Terova et al., 2009) and in mammals (Thorens et al., 1988; Fukumoto et al.,
1989; Bell et al., 1990; Thorens et al., 1990) and highlight the importance of GLUT2 for
the development of endoderm-derived tissues and reinforce the idea of the existence of
a glucose-sensing unit in the zebrafish brain.
To evaluate the effects of abrogating zebrafish GLUT2 with antisense morpholinos
on embryonic development and to describe the functional alterations caused by
the GLUT2 knockdown.
A number of studies have resorted to the use of GLUT2-deficient organisms to
analyze the function of this transporter. GLUT2-null mice show early deficient insulin
secretion, presenting a diabetic phenotype, and only survive if are fed with low-sugar
pellets (Guillam et al., 1997). Furthermore, GLUT2 knockout mice present
hyperglycemia and high levels of free fatty acids in plasma, glucosuria and abnormal
feeding behavior (Guillam et al., 1997; Bady et al., 2006). In this line, it has been
recently reported the generation of a GLUT2 sugar detection-deficient (GLUT2-SDD)
transgenic line in mice that displays hypoinsulinemia, altered glucose homeostasis,
delayed development and loss of glucose in the urine (Stolarczyk et al., 2007).
To date, in fish there are no studies using such approaches due to technical
limitations in the generation of germline mutations. Thereby, in our study we have
benefited from the zebrafish model and its advantages for the study of gene function in
vivo. Thus, to study its function during the early developmental stages in zebrafish we
General Discussion
� ���
knocked down GLUT2 using antisense morpholinos. Our results showed that embryos
lacking GLUT2 display a delay of the whole body development with severe alterations in
the midbrain and hindbrain ventricles. We confirmed the structural alteration in the CNS
structure by immunostaining of acetylated tubulin. In addition, using marker genes for
neural progenitor cells, we found that GLUT2 abrogation may be causing the observed
neurodegenerative phenotype as a consequence of alterations in the development of
these cells but by mainly affecting the progenitors of the GABAergic neurons.
Next, by studying the functional alterations triggered by the lack of GLUT2 we
observed that morphant embryos displayed an impairment of glucose uptake in the
whole body but especially in the head region. Interestingly, a similar pattern was found
when assaying cell viability in these embryos, showing a significant increase in apoptotic
cell death, mainly located in the cephalic area. These evidences led us to hypothesize
that insufficient supply of glucose at these critical stages may result in increased
apoptotic cell death. Furthermore, blocking the expression of GLUT2 resulted in
alterations in the asymmetric distribution of some endoderm-derived organs shown to
express this glucose transporter, namely the liver and the endocrine and exocrine
pancreas. Using marker genes for these organs, we were able to determine the
significance of this effect that caused alterations on the asymmetry axis in the liver in
69% of the morphant embryos, in the exocrine pancreas in 73% of the morphant
embryos and in the endocrine pancreas in 55% of the morphant embryos.
Additionally, by studying the transcriptional alterations in these embryos by
microarray analysis, we were able to validate the knockdown of GLUT2 since the mRNA
expression levels of this gene were strongly down-regulated in morphant embryos.
Furthermore, a number of genes involved in apoptotic processes were differentially
expressed in morphant embryos, confirming the observed increase in apoptotic cell
death. Interestingly we also found that the expression of parvalvumin and PDX1
appeared altered. These genes are marker genes for the GABAergic neurons and the
endocrine pancreas, respectively, where they play an important role in their normal
functioning (MacFarlane et al., 1994; Marshak et al., 1996; Hashimoto et al., 2003). We
General Discussion
����
also observed that LEFTY2 and TGFβ1 resulted differentially expressed in morphant
embryos as a consequence of the knockdown of GLUT2. Since both genes are
important modulators of the Nodal pathway and are required for the normal asymmetric
organization of the dorsal diencephalon and endoderm derived tissues (Bisgrove et al.,
1999; Rodaway et al., 1999; Bisgrove et al., 2000), these evidences support the
observed alterations in the morphant patterning.
To study the functionality of zebrafish GLUT2 using a mammalian in vitro model
and to investigate its ability to rescue GLUT2-knocked down pancreatic cells.
In mammals, GLUT2 expression in the liver, intestine, kidney and endocrine
pancreas is regulated by the variations in blood carbohydrate levels produced by fasting
and re-feeding states (Thorens, 1996). Particularly, in pancreatic β-cells, a rise in
circulating glucose results in an increase in glucose uptake mediated by GLUT2, leading
to the depolarization of the plasma membrane that the secretion of insulin granules
(Deeney et al., 2000; Henquin et al., 2003; Thorens, 2011). The use of transgenic
models has been helpful in the study of the physiological role of GLUT2 and its
implication in the glucose-stimulated insulin secretion in mammals. Hence, GLUT2 null
and SDD transgenic mice appeared to be hyperglycemic and hypoinsulinemic, having
lost the glucose-sensing capability necessary for insulin secretion (Guillam et al., 1997;
Thorens et al., 2000; Stolarczyk et al., 2007). Interestingly, Guillam et al. showed that re-
expression of GLUT2 was able to restore the insulin secretion induced by glucose
(Guillam et al., 2000), further demonstrating the importance of this glucose transporter in
glucose metabolism.
Thus, we set out to establish an in vitro system using the mammalian β-cell line
MIN6 (Miyazaki et al., 1990) in order to further study the physiological function of
zebrafish GLUT2. Our results showed that we were able to knockdown endogenous
GLUT2 leading to a loss of glucose-stimulated insulin secretion in MIN6 cells.
Furthermore, we successfully established the conditions for the expression of zebrafish
GLUT2 in MIN6 and observed a significantly increase in the basal glucose uptake in the
General Discussion
� ���
pancreatic cells. In addition, preliminary results point to a possible increase in the
glucose uptake in cells expressing the rat GLUT2 construct.
Therefore, these results constitute the first step on the establishment of a
promising in vitro system with which future experiments rescuing the GLUT2 knocked
down MIN6 cells with exogenous (zebrafish) GLUT2 will help us better understand the
functional properties of zebrafish GLUT2. Moreover, taking advantage of the GFP
proteins fused to the transfected constructs, we will be able to study the trafficking
properties of zebrafish GLUT2.
Conclusions
Conclusions
� ���
1. We have cloned and characterized the first functional GLUT4 promoter in a non-
mammalian species. From a structural point of view, this promoter sequence is
highly conserved amongst teleost fish and presents the majority of the binding
motifs known to be important for the regulation of GLUT4.
2. The Fugu GLUT4 promoter is regulated by insulin, PPARγ and electrical pulse
stimulation in mammalian skeletal muscle cells. Stimulation with insulin resulted
in a significant reduction of the activity of Fugu GLUT4 promoter. However,
GLUT4 promoter activity was increased by PPARγ activation and experimentally
controlled contraction.
3- In zebrafish embryos at 24 hpf and 48 hpf, GLUT2 mRNA is detected in the brain
and proneprhic ducts. By 72 and 120 hpf, an overall increase of GLUT2
expression is observed in intestine, liver, pancreas, pronephric tubules and
hindbrain region.
4- Knockdown of zebrafish GLUT2 in vivo causes severe abnormalities in brain
organogenesis, resulting in defective formation of the mid-brain/hindbrain
boundary and hindbrain, as well as a delay in whole body development.
5- GLUT2 in zebrafish embryos plays a pivotal role during the development of
neuronal progenitor cells, especially for the generation of the GABAergic
neurons. This suggests the existence of a glucose-sensing region in the zebrafish
hindbrain in which these neurons may be involved in the regulation of glucose
homeostasis.
Conclusions
����
6- GLUT2 deficient embryos showed impaired glucose uptake, a generalized
increase in apoptotic cell death primarily localized in the head region and
alterations in the distribution of endoderm-derived tissues. Therefore, these
evidences suggest that the defective coordination between glucose uptake and
the demand for carbohydrates during early embryonic stages could be affecting
the development of GLUT2-expressing organs and cell viability.
7- Knockdown of endogenous GLUT2 in MIN6 cells led to a loss of glucose-
dependent insulin secretion and overexpression of zebrafish GLUT2 in wild type
MIN6 resulted in a significant increase in glucose uptake. These evidences
confirmed that MIN6 cells are suitable for the study of the functional role of
zebrafish GLUT2 in pancreatic β-cells.
Resumen del trabajo
Resumen del trabajo
� ���
Introducción
1. Transportadores de glucosa
La glucosa es una molécula esencial para el metabolismo de los vertebrados, y
desempeña un papel fundamental como combustible y sustrato metabólico (Wood and
Trayhurn, 2003). La glucosa se obtiene principalmente de dos maneras: directamente
de la dieta y la derivada del glucógeno, que se almacena principalmente en el hígado
(Yamashita et al., 2001; Wood and Trayhurn, 2003; Postic et al., 2007). La que es
obtenida de la dieta es transferida desde el lumen del intestino delgado a la circulación,
y posteriormente dentro de las células objetivo para ser usada como una fuente de
energía o, cuando se encuentra en exceso, para ser almacenada como glicógeno
hepático o como triglicéridos (Yamashita et al., 2001; Wood and Trayhurn, 2003; Postic
et al., 2007). El paso de la glucosa a través de la membrana plasmática esta mediado
por dos grupos diferentes de transportadores: los co-transportadores de glucosa Na+-
dependientes (SGLT, miembros de la extensa familia de transportadores Na+-
dependientes, genes de denominados SLC5A) (Wright, 2001); y por los transportadores
facilitados de azúcares Na+-independientes (la familia de los GLUT, genes
denominados SLC2A) (Mueckler, 1994; Uldry and Thorens, 2004).
La familia de los GLUT pertenece a la principal superfamilia de transportadores
facilitados de membrana (MFS) (Pao et al., 1998), siendo la mayor parte de ellos
capaces de catalizar la transferencia bidireccional facilitada a través de las membranas
plasmáticas (Thorens and Mueckler, 2010). Los GLUTs son proteínas compuestas
aproximadamente de 500 aminoácidos que tienen 12 hélices alfa transmembrana y un
único N-oligosacárido unido (Joost and Thorens, 2001; Joost et al., 2002; Zhao and
Keating, 2007; Augustin, 2010). Los miembros de la familia de los GLUTs pueden ser
agrupados en tres clases en función de la similaridad de sus secuencias (Fig. 1). La
clase I esta compuesta por los transportadores de glucosa comprendidos entre GLUT1
y GLUT4 y el GLUT14, el cual es una duplicación de GLUT3; la clase II esta compuesta
por GLUT5, GLUT7, GLUT9, y GLUT11 y la clase III la integran GLUT6, GLUT8,
Resumen del trabajo
����
GLUT10, GLUT12 y GLUT13 (transportador de mio-inositol acoplado a protones, HMIT)
(Joost and Thorens, 2001; Joost et al., 2002; Zhao and Keating, 2007; Augustin, 2010).
Figura 1. Los miembros de la familia de transportadores de glucosa. A, Árbol filogenético radial
enseñando la relación entre los 14 GLUTs humanos. Adaptado de (Augustin, 2010). B, Esquema de las
proteínas GLUT indicando el tejido donde cada miembro aparece expresado.
Resumen del trabajo
� ���
2. Transportadores facilitados de glucosa Clase I
La clase I de transportadores facilitados de glucosa incluye de GLUT1 a GLUT4
y GLUT14, y han sido extensamente caracterizados en términos de estructura, función
y distribución tisular (Fig. 1 y 2). GLUT1 se expresa principalmente en la placenta,
cerebro (incluyendo la barrera hemato-cerebral), riñón, colon, ojo, músculo esquelético,
sistema nervioso periférico y eritrocitos (Joost et al., 2002; Pereira and Lancha, 2004;
Zhao and Keating, 2007). GLUT1 juega un papel relevante proporcionando glucosa a
las células del sistema nervioso central (Thorens and Mueckler, 2010). GLUT2 se
expresa principalmente en células β pancreáticas, donde participa en el mecanismo
gluco-sensor, el hígado, intestino, los riñones y en el cerebro (Thorens et al., 1988;
Guillam et al., 2000; Joost and Thorens, 2001; Panserat et al., 2001). GLUT2 se
expresa en la membrana baso-lateral de los hepatocitos, de los enterocitos y en los
túbulos renales proximales permitiendo el transporte bidireccional de glucosa controlado
hormonalmente (Thorens et al., 1990; Thorens, 1992; Wright et al., 2003) y se ha visto
que es capaz de translocarse a la membrana apical desde el citosol en enterocitos y en
los túbulos renales proximales (Kellett and Helliwell, 2000; Marks et al., 2003). GLUT3
tiene una elevada afinidad por la glucosa y esto concuerda con su presencia en tejidos
donde la demanda de glucosa como combustible es considerable, principalmente en el
cerebro, los testículos y la placenta (Shepherd et al., 1992; Haber et al., 1993; McCall et
al., 1994).
El transportador de glucosa sensible a insulina GLUT4, junto con GLUT1, es el
transportador de glucosa más intensamente estudiado. Se encuentra expresado en
corazón, músculo esquelético y tejido adiposo (Zorzano et al., 1997; Thai et al., 1998;
Khayat et al., 2002; Abel, 2004; Watson et al., 2004; Valverde et al., 2005), donde es
responsable de paliar el aumento de los niveles de glucosa plasmáticos en la fase
postpandrial (Huang and Czech, 2007). La insulina actúa estimulando la translocación
de vesículas contenedoras de GLUT4 almacenadas intracelularmente hacia la
membrana plasmática, resultando en un incremento inmediato del transporte de
glucosa (Bryant et al., 2002). Varios modelos de estudio animal y humano para la
Resumen del trabajo
����
investigación de estados de resistencia a insulina, como la obesidad y la diabetes tipo
II, presentan una disrupción en el mecanismo de regulación de GLUT4, lo que sugiere
el posible papel clave que juega GLUT4 en patologías de resistencia a la insulina
(Huang and Czech, 2007). Por último, GLUT14 se encuentra específicamente
expresado en testículo (Wu and Freeze, 2002) y presenta un elevado grado de similitud
con GLUT3 (95% a nivel nucleotídico) lo cual, junto a su localización cromosómica,
llevó a Wu y colaboradores a proponer que GLUT14 es una duplicación génica de
GLUT3 (Wu and Freeze, 2002). Sin embargo, hasta la fecha el papel concreto que
desempeña GLUT14 en el metabolismo de la glucosa es desconocido.
Figura 2. Modelo esquemático de los miembros de la clase I. El diagrama muestra las 12 hélices alfa
transmembrana, con el lugar de glicosilación localizado en el primer bucle extracelular y los extremos
amino- y carboxilo-terminales situados intracelularmente. Adaptado de (Bryant et al., 2002).
3. GLUT2 (SLC2A2)
GLUT2 fue clonado por primera vez en 1988 a partir de librerías de ADNc de
hígado y riñón humano, por Thorens et al. (Thorens et al., 1988). En primer lugar se
encontró expresión de GLUT2 en páncreas, hígado, intestino y riñón (Augustin, 2010;
Thorens and Mueckler, 2010) y estudios posteriores revelaron expresión también en el
cerebro (Leloup et al., 1994; Li et al., 2003). GLUT2 es un transportador de glucosa de
baja afinidad y alta capacidad con la Km muy elevada (17 mM) (Johnson et al., 1990), la
Resumen del trabajo
� ���
mayor entre los miembros conocidos de la familia de los GLUTs (Johnson et al., 1990).
Como transportador de glucosa de clase I, se ha predicho que GLUT2 tiene la
estructura consenso característica de esta clase (Fig. 2) con la única excepción de que
el motivo QLS en la hélice 7 no está presente (Burant et al., 1991; Baldwin, 1993). Este
motivo es conocido por conferir la especificidad al substrato, y su ausencia podría
explicar la elevada afinidad por la D-glucosa, D-fructosa y glucosamina (Burant et al.,
1991; Baldwin, 1993; Uldry et al., 2002).
En mamíferos, GLUT2 se expresa en un alto grado en células β pancreáticas,
siendo más abundante en las microvellosidades que en la membrana baso-lateral (Orci
et al., 1989). GLUT2 se ha encontrado también internalizado en los endosomas
tempranos y lisosomas de células β pancreáticas en dos líneas de ratones
genéticamente modificados, afectando su capacidad de glicosilación, bloqueando la N-
acetilglucosamin transferasa GnT-4a (Ohtsubo et al., 2005); o induciendo la apoptosis
en células β pancreáticas activando la caspasa 8 (Wang et al., 2008). GLUT2 también
se expresa en las membranas baso-lateral y apical de células epiteliales del intestino y
los riñones (Thorens et al., 1990; Thorens, 1992; Kellett and Helliwell, 2000; Marks et
al., 2003; Wright et al., 2003), así como en la membrana plasmática sinusoide y en
fracciones endosomales de los hepatocitos (Thorens et al., 1990; Thorens, 1992;
Eisenberg et al., 2005).
Desde el punto de vista fisiológico, el patrón de expresión de GLUT2, junto con
su capacidad de transportar diferentes tipos de hexosas dentro de un amplio rango de
concentraciones, asegura un rápido equilibrado de glucosa entre los espacios intra- y
extracelulares, permitiendo de este modo flujos bidireccionales desde dentro y fuera de
las células (Leturque et al., 2005; Thorens and Mueckler, 2010). Este mecanismo
contribuye a un elevado número de procesos (Fig. 3), como la absorción intestinal y
renal de glucosa, la estimulación de la secreción de insulina por las células β
pancreáticas, la entrada y salida de glucosa del hígado y la capacidad gluco-sensora de
regiones específicas del cerebro involucradas en la regulación del metabolismo de la
Resumen del trabajo
����
glucosa y de la toma de alimentos (Burcelin et al., 2000; Guillam et al., 2000; Uldry and
Thorens, 2004; Leturque et al., 2005; Marty et al., 2007; Eny et al., 2008).
Concretamente, en células β pancreáticas, la expresión de GLUT2 en la
superficie celular es la responsable de la toma de glucosa que desencadenará la
secreción de insulina inducida por glucosa (Ohtsubo et al., 2005). Esto provoca la
despolarización de la membrana plasmática por el cierre de los canales de K+ ATP
dependientes y el influjo de Ca2+, llevando a la exocitosis de gránulos de insulina
(Henquin et al., 2003). En células β pancreáticas, GLUT2 equilibra la glucosa extra- e
intracelular proporcionando un suministro de glucosa sin restricciones, siendo la
glucokinasa el paso limitante (Matschinsky, 2002). A pesar de esto , se ha descrito que
en células β pancreáticas generadas con diferentes isoformas de GLUTs, solo GLUT2
permite la producción normal de insulina en respuesta a la estimulación por glucosa
(Hughes et al., 1993).
En enterocitos, esta bien establecido que GLUT2 transloca a la membrana apical
desde vesículas localizadas en el citosol tras comidas ricas en azucares (Gouyon et al.,
2003; Kellett and Brot-Laroche, 2005). En respuesta al incremento de los niveles
plasmáticos de azucares, la insulina es secretada por las células β pancreáticas,
haciendo que GLUT2 se internalice (Tobin et al., 2008). De este modo, la capacidad
para transportar azúcares es regulada por GLUT2, ajustándose en función de la
concentración luminal de los niveles de glucosa (Kellett et al., 2008). De modo similar
ocurre en las células del túbulo proximal del riñón de ratas tratados con
estreptozotocina, donde GLUT2 es translocado a la membrana de borde en cepillo en
respuesta a la glucosa y es internalizado tras el ayuno (Marks et al., 2003).
Curiosamente, GLUT2 también se internalizar en el hígado. En los hepatocitos
GLUT2 se expresa en la membrana sinusoide (Thorens et al., 1990), siendo sometido a
internalización dependiente de insulina en fracciones endosomales (Eisenberg et al.,
2005). De esta manera, este mecanismo podría ser relevante mediando el efecto
inhibidor de la insulina sobre la producción hepática de glucosa (Girard, 2006).
Resumen del trabajo
� ���
Respecto a la expresión de GLUT2 en el cerebro, se sabe poco sobre su función
fisiológica. Estudios previos muestran que GLUT2 se encuentra en el cerebelo, el
núcleo cerebral, núcleo hipotalámico, neuronas, células de la glía y astrocitos (Leloup et
al., 1994; Nualart et al., 1999; Arluison et al., 2004; Arluison et al., 2004; Kang et al.,
2004; Roncero et al., 2004; Marty et al., 2005). GLUT2 está implicado en la detección
de la hipoglicemia en células de la glía (Marty et al., 2005) y también podría estarlo en
la respuesta de contra-regulación mediada por las unidades sensibles a glucosa
dependientes de GLUT2 de los astrocitos y neuronas (Marty et al., 2005). Estas
evidencias apoyan la idea de que GLUT2 juega un papel central en la regulación de la
ingesta, tal y como sugieren varios estudios donde se muestra una conducta alimentaria
anormal bloqueando GLUT2 intra-cerebro-ventricularmente en ratas (Wan et al., 1998)
o en ratones carentes de GLUT2 (Bady et al., 2006).
En vertebrados nos mamíferos GLUT2 ha sido caracterizado en aves y peces
(Wang et al., 1994; Krasnov et al., 2001; Hall et al., 2006; Castillo et al., 2009; Terova et
al., 2009). En particular, estudios en peces teleósteos muestran que GLUT2 se expresa
en páncreas, hígado, rombencéfalo e hipotálamo en trucha arco iris (Oncorhynchus
mykiss) en hígado, intestino y riñón en bacalao Atlántico (Gadus morhua) y en cerebro,
corazón, hígado, riñón, músculo e intestino en lubina (Dicentrarchus labrax) (Panserat
et al., 2001; Hall et al., 2006; Polakof et al., 2007; Terova et al., 2009); mientras que en
pez cebra (Danio rerio) adulto GLUT2 se encuentra expresado en un elevado número
de tejidos (Fig. 4) (Castillo et al., 2009). La afinidad del GLUT2 de pez cebra por la 2-
deoxiglucosa (2-DG) es 11 mM, similar a la constante de mamíferos (Castillo et al.,
2009). Además, el GLUT2 de pez cebra también es capaz de transportar manosa,
fructosa y galactosa, así como L- glucosa pero con menor afinidad, tal y como se ha
visto en mamíferos (Cheeseman, 2002). Estas propiedades indican un elevado grado
de conservación funcional entre el GLUT2 de peces y de mamíferos, apoyando la idea
de que GLUT2 es un transportador de glucosa de baja afinidad y alta capacidad (Uldry
and Thorens, 2004).
Resumen del trabajo
����
Figura 3. Papel fisiológico de GLUT2 en diferentes órganos. A, Transporte de hexosas en
hepatocitos. GLUT2 es el mediador de la captación de glucosa bajo condiciones de alimentación en
hepatocitos donde la glucosa se metaboliza por glicólisis o es incorporada a glicógeno. B, Las células β
pancreáticas secretan insulina en respuesta a aumentos de la glucosa en sangre. GLUT2 interviene en la
captación de glucosa en las células β pancreáticas provocando la secreción de insulina. C, Absorción
transepitelial de glucosa en el intestino. GLUT2 es translocado a la membrana apical epitelial para facilitar
la captación de glucosa, dicha translocación es revertida por la acción de la insulina. D, Reabsorción
transepitelial de glucosa en el riñón. La reabsorción de la glucosa mediada por GLUT2 se da en la
membrana baso-lateral. Adaptado de (Augustin, 2010).
Resumen del trabajo
� ���
Respecto al papel fisiológico de GLUT2 en peces, se sabe poco hasta la fecha.
Se ha visto que en teleósteos la expresión de GLUT2 en el páncreas y en el
rombencéfalo es regulada por señales hormonales y metabólicas (Polakof et al., 2007),
mientras que los niveles de ARNm de GLUT2 en el hígado no están afectados en
condiciones de ayuno y realimentación (Panserat et al., 2001; Hall et al., 2006; Castillo
et al., 2009). Además, los niveles de ARNm del GLUT2 de peces en el hígado esta
sobre-regulado en condiciones de hipoxia aguda y crónica (Terova et al., 2009).
Asimismo, estudios recientes han demostrado que la expresión de GLUT2 en pez cebra
se encuentra bajo regulación nutricional en el intestino (Castillo et al., 2009).
En vista de esto, resulta evidente que son necesarios más estudios para
entender el papel fisiológico de GLUT2 y los mecanismos involucrados en su
regulación. Los vertebrados inferiores han sido ampliamente reconocidos como una
herramienta valiosa en la investigación metabólica (Schlegel and Stainier, 2007).
Además, existe una conservación remarcable en lo que se refiere a estructura y
propiedades funcionales de GLUT2 entre peces y mamíferos. En este aspecto, estudios
futuros sobre el papel fisiológico de GLUT2 usando una especie modelo, como el pez
cebra, nos proporcionara una valiosa contribución para poder desentramar los
complejos mecanismos involucrados en la homeostasis de la glucosa.
Resumen del trabajo
����
Figura 4. Patrón de expresión tisular de GLUT2 en pez cebra adulto. GLUT2 se expresa en una
amplia variedad de tejidos en pez cebra adulto, pero especialmente en riñón, hígado, cerebro, testículo,
músculo, intestino y piel. Adaptado de (Castillo et al., 2009).
4. GLUT4 (SLC2A4)
GLUT4 fue descrito por primera vez por James et al. en 1988 estudiando el
metabolismo de la glucosa en tejidos regulados por insulina (James et al., 1988).
Pronto, tras este descubrimiento varios grupos clonaron GLUT4 en humano (Fukumoto
et al., 1989), rata (Birnbaum, 1989; Charron et al., 1989) y ratón (Kaestner et al., 1989).
Desde su descubrimiento, GLUT4 ha recibido, junto con GLUT1, más atención científica
que cualquier otra proteína transportadora de membrana. Estructuralmente, GLUT4
sigue el modelo predicho para los transportadores de clase I (Fig. 2). Además presenta
una gran afinidad por la glucosa, con una Km de ≈5 mM (Huang and Czech, 2007), y
también es capaz de transportar manosa, galactosa, ácido dehidroascórbico y
glucosamina (Keller et al., 1989; Burant and Bell, 1992; Rumsey et al., 2000; Uldry et
al., 2002).
Resumen del trabajo
� ���
En mamíferos, GLUT4 esta principalmente expresado en músculo cardiaco y
esquelético, tejido adiposo marrón y blanco, y en cerebro (Mueckler, 1994; Rayner et
al., 1994; Huang and Czech, 2007). GLUT4 juega un papel relevante en la homeostasis
de la glucosa en todo el cuerpo, mediando la captación de glucosa regulada por insulina
(Shepherd and Kahn, 1999; Saltiel and Pessin, 2002). La disrupción de la expresión de
GLUT4 ha sido extensamente asociada con patologías con la captación de glucosa
afectada y de resistencia a insulina como la diabetes tipo II y la obesidad (Kusari et al.,
1991; Shepherd and Kahn, 1999; Friedel et al., 2002; Karnieli and Armoni, 2008).
El gen de GLUT4 se encuentra regulado por mecanismos complejos, ya que esta
sujeto tanto a regulación tisular específica como hormonal (Knight et al., 2003). Así, la
expresión de GLUT4 está alterada en músculo cardiaco y esquelético en el
hipotiroidismo perinatal (Castello et al., 1994; Ramos et al., 2001). Está deficiencia
puede ser revertida al tratarla con triyodotironina (T3), la cual incrementa los niveles de
ARNm de GLUT4 en el músculo cardiaco (Castello et al., 1994). Así mismo,
administraciones de T3 a largo plazo en ratas adultas, estimulan la expresión de GLUT4
en músculo esquelético (Casla et al., 1990; Weinstein et al., 1994). La actividad
contráctil y la inervación también regulan la expresión de GLUT4 en músculo
esquelético. Varios estudios evidencian que la expresión de GLUT4 se induce durante
el tiempo de inervación del músculo esquelético (Castello et al., 1993) y es reprimida en
respuesta a la denervación muscular (Block et al., 1991; Coderre et al., 1992; Castello
et al., 1993). La contracción muscular aumenta la expresión de GLUT4 en músculo
esquelético. Diversos estudios demuestran que la expresión de GLUT4 se induce al
estimular eléctricamente la contracción muscular in vivo e in vitro (Etgen et al., 1993;
Hofmann and Pette, 1994; Kong et al., 1994) así como tras entrenamiento físico en
humanos (Houmard et al., 1991; Dela et al., 1993) y ratas (Ploug et al., 1990).
Resumen del trabajo
����
Figura 5. Representación esquemática del mecanismo de regulación de GLUT4. A, Principales vías
de señalización involucradas en la translocación de GLUT4. B, Vías de tráfico de GLUT4. Adaptado de
(Augustin, 2010).
La circulación de GLUT4 es regulada a nivel de su exocitosis, fusión, endocitosis
tránsito inter-endosomal. En músculo y tejido adiposo está principalmente regulado por
contracción muscular e insulina (Zorzano et al., 2005; Watson and Pessin, 2006;
Resumen del trabajo
� ���
Augustin, 2010; Lauritzen and Schertzer, 2010), permitiendo la entrada de glucosa en el
interior de las células estimulando la translocación de GLUT4 (Fig. 5B) (Augustin,
2010). La insulina regula el tráfico de GLUT4 vía fosfatidilinositol 3 kinasa (PI3K) o el
complejo Cbl-CAP-APS (Fig. 5A) (Ishiki and Klip, 2005) mientras que la contracción
muscular regula la translocación de GLUT4 vía la proteín kinasa activada por AMP
(AMPK) (Fig. 5A) (Pereira and Lancha, 2004; Zorzano et al., 2005). En ausencia de
insulina, el GLUT4 fusionado a la membrana plasmática es endocitado por medio de la
vía endosomal temprana y es ubicado en el compartimento de vesículas de
almacenamiento de GLUT4 (GSV) (también denominado compartimento especializado
sensible a insulina) estando involucrada la red trans-Golgi (TNG) (Dugani and Klip,
2005; Ishiki and Klip, 2005; Larance et al., 2008). GLUT4 se almacena mediante
procesos estáticos o dinámicos, de donde, en respuesta a estímulos, se translocará a la
membrana plasmática (Fig. 5B) (Dugani and Klip, 2005; Ishiki and Klip, 2005; Larance
et al., 2008).
Figura 6. Distribución de GLUT4 en miotubos primarios de trucha marrón. A, Imagen de campo
claro de los miotubos de trucha marrón. B, Imagen fluorescente enseñando la inmunolocalización del
GLUT4 endógeno de trucha marrón. Adaptado de (Diaz et al., 2007).
En vertebrados no mamíferos, GLUT4 fue caracterizado por primera vez por
Planas y colaboradores en músculo rojo de trucha marrón (Salmo trutta) (Planas et al.,
Resumen del trabajo
����
2000) y, hasta hoy, ha sido también clonado en otras especies de teleósteos (Capilla et
al., 2004; Hall et al., 2006). En trucha marrón, GLUT4 se encuentra altamente
expresado en músculo rojo (Fig. 6) y blanco, tejido adiposo, riñón y agallas, y más
moderadamente en intestino y corazón (Planas et al., 2000). En otras especies de
salmónidos, GLUT4 se encuentra también expresado en tejidos sensibles a la insulina
como en músculo blanco y rojo de trucha arco iris (Capilla et al., 2002; Diaz et al., 2007;
Diaz et al., 2009) y en tejido adiposo de salmón Coho (Oncorhynchus kisutch) (Capilla
et al., 2004).
Respecto a las características funcionales, como se ha descrito en mamíferos, el
GLUT4 del salmón Coho es capaz de transportar glucosa, manosa y galactosa y,
curiosamente es capaz de transportar fructosa a elevadas concentraciones (Capilla et
al., 2004). Así mismo, el valor de Km del GLUT4 del salmón Coho para la glucosa es
≈7.6, mayor que en mamíferos (Capilla et al., 2004). Análisis cinéticos adicionales de
transporte de 3-O-metilglucosa medidos bajo condiciones de intercambio de equilibrio,
mostraron un valor de Km de 14.4 mM del GLUT4 del salmón Coho (Capilla et al., 2004),
de nuevo mayores que los valores mostrados en ratas (Keller et al., 1989; Nishimura et
al., 1993). Estas evidencias apoyan la idea de que los GLUTs de peces tiene una
menor afinidad por la glucosa que los de vertebrados superiores (Capilla et al., 2004)
siendo consistente con la reducida capacidad de los peces de utilizar la carga de
glucosa comparado con mamíferos (Moon, 2001).
Además, la expresión de GLUT4 en el tejido muscular de peces es regulada por
la acción de factores relacionados con el metabolismo de los carbohidratos y de la
homeostasis de la glucosa. Los niveles de ARNm de GLUT4 aumentan en respuesta a
la administración de insulina en el músculo rojo de trucha marrón (Capilla et al., 2002) y
de trucha arco iris (Polakof et al., 2010), y también en mioblastos y miotubos
diferenciados in vitro (Diaz et al., 2009). En el mismo estudio, Díaz et al. demostraron
que el factor de crecimiento insulínico I (IGF-I), estimula la expresión de GLUT4 en
cultivos primarios de células de trucha arco iris (Diaz et al., 2009), siendo consistente
con datos anteriores en mamíferos (Bilan et al., 1992). En bacalao Atlántico, la
Resumen del trabajo
� ���
expresión de GLUT4 aumenta en músculo blanco en ayuno y en el corazón se ve
reducida, mientras que los niveles de ARNm retornan a niveles pre-ayuno con la
realimentación (Hall et al., 2006). Recientemente, un estudio de nuestro grupo ha
mostrado que el 5-aminoimidiazol-4-carboximida ribonucleósido (AICAR) y la
metformina, activadores de AMPK, aumentan la expresión de GLUT4 en miotubos de
trucha marrón (Magnoni et al., 2012).
Así mismo, de la misma manera que con el ARNm, los niveles de proteína de
GLUT4 de trucha marrón en músculo rojo, disminuyen significativamente tras el ayuno y
aumentan tras la administración de insulina (Diaz et al., 2007). También, en cultivos
primarios de células de músculo esquelético de trucha marrón, Díaz et al. demostraron
que la translocación de GLUT4 a la membrana plasmática es estimulada en respuesta a
insulina (Fig. 7A), resultando en un aumento de la captación de glucosa en dichas
células (Fig. 7B) (Diaz et al., 2007). Estas evidencias se encuentran en concordancia
con datos previos en células satélite musculares de trucha arco iris (Castillo et al.,
2004). Además, estudios usando la línea celular estable L6 expresando GLUT4
marcado con el epítopo myc también han demostrado que el factor de necrosis tumoral
alfa (TNFα) y los activadores de AMPK, AICAR y metformina, estimulan
significativamente la translocación a la membrana plasmática de GLUT4 en trucha
marrón (Vraskou et al., 2011; Magnoni et al., 2012). Estos mismos estudios también
mostraron que la estimulación con TNFα y los activadores de AMPK estimulan la
captación de glucosa en células de músculo esquelético de trucha (Vraskou et al., 2011;
Magnoni et al., 2012).
En lo que se refiere a la regulación de GLUT4 en tejido adiposo en peces, Capilla
et al. fueron capaces de determinar que el GLUT4 de trucha marrón y de salmón Coho
se transloca a la membrana plasmática en respuesta a la insulina expresándolo en
adipocitos 3T3-L1 (Capilla et al., 2004; Capilla et al., 2010). Además, en el mismo
estudio los autores confirman que, como ocurre en mamíferos, la captación de glucosa
aumenta en oocitos de Xenopus que expresaban el homologo de GLUT4 de salmón, al
ser estimulados con insulina (Capilla et al., 2004). Estos mismos resultados concuerdan
Resumen del trabajo
����
con la evidencia de que la insulina aumenta significativamente la captación de glucosa
en tejido adiposo de trucha (Capilla et al., 2004).
Figura 7. Efectos de la insulina en células musculares de trucha marrón. A, El GLUT4 endógeno de
trucha marrón aumenta en membrana plasmática en respuesta a la administración de insulina. B, La
captación de glucosa aumenta significativamente en las células estimuladas con insulina. Adaptado de
(Diaz et al., 2007).
A pesar de estos estudios previos, se sabe poco respecto a los complejos
mecanismos que tienen lugar en la regulación y acción de los GLUTs, así como de su
papel fisiológico en el metabolismo de peces teleósteos. Concretamente, el modo en
que la insulina, una de las principales moléculas implicada en el metabolismo glucídico
en mamíferos, regula el metabolismo de la glucosa ha sido poco caracterizado en
vertebrados inferiores hasta la fecha.
Resumen del trabajo
� ���
En vista de la necesidad de aportar más datos para ayudar a descifrar este
complejo mecanismo, el objetivo de esta tesis es estudiar los principales
transportadores de glucosa involucrados en metabolismo de la glucosa mediado por
insulina, GLUT2 y GLUT4. En este aspecto, hemos estudiado, por primera vez, los
factores que gobiernan la expresión génica de GLUT4 en un vertebrado inferior,
caracterizando los elementos clave de la maquinaria transcripcional en peces usando el
pez globo (Tetraodon nigroviridis) como especie modelo. Del mismo modo, hemos
investigado el papel fisiológico en el metabolismo de la glucosa en embriones de pez
cebra así como su importancia durante las fases tempranas del desarrollo. Además,
nos hemos propuesto establecer un nuevo sistema in vitro para el estudio de la función
del GLUT2 de pez cebra usando MIN6-B1, una línea estable de células pancreáticas de
ratón.
Resumen del trabajo
����
Resúmenes de los capítulos
Capítulo 1 El transportador de glucosa 4 (GLUT4) juega un papel clave en la captación de
glucosa y el metabolismo de los tejidos diana de la insulina. Este transportador ha sido
ampliamente estudiado en muchas especies en términos de función, expresión y
translocación, pero los estudios sobre la regulación transcripcional se han limitado a
ratas, ratones y humanos.
En este estudio se ha clonado y caracterizado un promotor funcional del gen
GLUT4 en el Fugu (Takifugu rubripes), siendo este el primer promotor no mamífero de
GLUT4 que se ha descrito hasta la fecha. Análisis in silico del promotor nos ha
permitido identificar potenciales sitios de unión tales como SP1, C/EBP, MEF2, KLF,
SREBP-1c y cajas GC, así como una isla CpG, pero no se identifico ninguna caja
TATA. El análisis in vitro reveló tres sitios de inicio de transcripción, donde el principal
se encontraría 307 pb aguas arriba del codón ATG. También analizando constructos
deleccionados se determinó que el núcleo promotor se encuentra entre los nucleótidos -
132 / +93. Mediante la transfección de dichas delecciones 5’ hemos podido confirmar
que la transcripción del promotor de GLUT4 de Fugu está regulado por la insulina, PG-
J2 y estimulación eléctrica. Además, estos experimentos sugieren la implicación de los
motivos, como PPAR/RXR y HIF-1a en la regulación por PPARγ y la actividad contráctil,
siendo consistente con la literatura de mamíferos. Estos datos confirman que el
promotor de GLUT4 de Fugu es un promotor funcional del gen GLUT4 con estructura
similar a las descritas en los mamíferos. Además nuestros datos demuestran que este
promotor está regulado por mecanismos implicados en la regulación de la expresión de
GLUT4 en mamíferos.
Resumen del trabajo
� ���
Capítulo 2
De entre los 14 miembros de la familia de los transportadores facilitados de
glucosa (GLUTs), se ha demostrado en mamíferos que GLUT2 se expresa en una gran
variedad de diferentes tejidos, predominantemente en el cerebro, hígado, páncreas,
intestino delgado, y el riñón. Además, GLUT2 juega un papel importante en diferentes
procesos tales como la absorción intestinal y renal de la glucosa, la estimulación de la
secreción de insulina por la glucosa en las células beta del páncreas, la entrada y la
salida de la glucosa por el hígado, y la capacidad glucosensora de las regiones
específicas del cerebro implicadas en la regulación del metabolismo de la glucosa y la
ingesta de alimentos. A pesar de la información disponible en vertebrados superiores,
poco se sabe sobre el papel fisiológico de GLUT2 en vertebrados no mamíferos.
De este modo, en base a los resultados previos de nuestro grupo, hemos llevado
a cabo estudios para localizar la expresión de GLUT2 y estudiar el papel fisiológico de
GLUT2 in vivo en un organismo modelo como el pez cebra (Danio rerio). En este
sentido, hemos localizado la expresión de GLUT2 en el pez cebra durante el desarrollo
temprano por hibridación in situ (ISH). Para una mejor comprensión de su función in
vivo, hemos bloqueado la expresión del GLUT2 de pez cebra mediante la inyección de
dos morfolinos diferentes por separado. El primero de ellos inhibiendo el sitio de inicio
de traducción (ATG MO) y el segundo diseñado para interferir con la unión entre los
exones 5 y 6 (splice MO), que codifican para el dominio de transmembrana 6 (TM6),
descrito como importante para la actividad de transporte de glucosa de GLUT2 en los
mamíferos.
Nuestros resultados indican que GLUT2 en pez cebra se expresa en el hígado,
los túbulos pronéfricos, intestino anterior, páncreas endocrino y las neuronas de la
región del cerebelo. Por otra parte, la inactivación de GLUT2 in vivo resulta en graves
anomalías en la organogénesis del cerebro y afecta a la formación del sistema
digestivo, provocando cambios en el eje de asimetría. Curiosamente, los embriones
carentes de GLUT2 mostraron alteraciones en absorción de glucosa y una disminución
Resumen del trabajo
����
de la viabilidad celular asociada con aumento significativo en la apoptosis en todo el
embrión pero principalmente en la región cefálica. En conjunto, estos resultados
establecen la relevancia de GLUT2 en el desarrollo de los órganos principales
implicados en el metabolismo de la glucosa posiblemente debido a una baja
disponibilidad de carbohidratos, derivando en un incremento de la muerte celular por
apoptosis.
Resumen del trabajo
� ���
Capítulo 3
La insulina juega un papel fundamental la regulación de la homeostasis de la
glucosa en los vertebrados superiores, donde la captación de glucosa supone el paso
inicial en la secreción de insulina estimulada por glucosa por las células β pancreáticas.
En los mamíferos, GLUT2 ha sido descrito como el transportador de glucosa más
importante expresado en las células β pancreáticas.
En peces teleosteos se sabe poco respecto al papel que juega GLUT2 en la
homeostasis de la glucosa y la acción de la insulina. Es por esto que en este trabajo
nos proponemos establecer un sistema in vitro usando la línea estable de células β
pancreáticas MIN6. Dicha línea deriva de células de insulinoma un ratón transgénico, y
presenta secreción de insulina dependiente de glucosa asemejándose a células β
pancreáticas normales. En este trabajo, mediante el uso de ARNs cortos de
interferencia (siRNAs) específicamente diseñados contra GLUT2, hemos bloqueado la
síntesis proteica del transportador de glucosa endógeno de las células MIN6. A
continuación, se analizaron las consecuencias funcionales derivadas del bloqueo de la
expresión de GLUT2. Para ello se realizaron mediciones de los niveles de insulina
secretada por MIN6 GLUT2-deficientes estimuladas con glucosa, confirmando que
dichas células perdían su capacidad de secretar insulina en respuesta a glucosa. Por
último, hemos realizado ensayos de sobreexpresión mediante la transfección de
vectores de expresión que contenían la secuencia codificante completa de los GLUT2
de rata y de pez cebra fusionados a la proteína fluorescente EGFP. Así, observamos
que las células MIN6 transfectadas con el GLUT2 de pez cebra mostraban un aumento
significativo de la capacidad de transportar glucosa. En resumen, en este estudio se
han aportado pruebas que indican que las células MIN6 son adecuadas para el estudio
del papel funcional del GLUT2 de pez cebra en las células β pancreáticas. Sin embargo,
las condiciones experimentales han de ser optimizadas en trabajos futuros, con el fin de
proporcionar pruebas sólidas sobre la funcionalidad del GLUT2 de pez cebra en la
secrección de insulina gluco-dependiente.
Resumen del trabajo
����
Discusión El objetivo de esta tesis fue estudiar la función y regulación de dos de los
principales implicados en el metabolismo glucídico regulado por la insulina, los
transportadores de glucosa GLUT2 y GLUT4, en los peces teleósteos. En vertebrados
no mamíferos, GLUT2 ha sido poco caracterizado hasta la fecha. Se ha demostrado en
varias especies de teleósteos que GLUT2 se expresa en los principales tejidos
sensibles a la insulina (Krasnov et al., 2001; Hall et al., 2006; Polakof et al., 2007;
Castillo et al., 2009; Terova et al., 2009), similar a lo que se describe en los mamíferos
(Joost and Thorens, 2001; Uldry and Thorens, 2004). Sin embargo, las propiedades
funcionales y el papel fisiológico de GLUT2 apenas ha sido descrito en peces. En vista
de ello, se ha caracterizado GLUT2 en el pez cebra, ya que dicha especie es uno de los
modelos más reconocidas para el estudio de la fisiología, el desarrollo y el metabolismo
(Briggs, 2002; Gerhard, 2003, Schlegel and Stainier, 2007). En cuanto a GLUT4,
nuestro grupo ha sido pionero en la investigación de este transportador en peces
teleosteos desde que Planas et al. caracterizaron el primer homologo de GLUT4 en
vertebrados inferiores (Planas et al., 2000). A pesar de que se ha estudiado más este
transportador de glucosa que GLUT2, la información sobre los factores que intervienen
en la regulación de la transcripción del gen GLUT4 han sido escasamente
caracterizados en mamíferos, mientras que no hay datos disponibles en los vertebrados
inferiores . Para ello, en este estudio hemos analizado la regulación de un promotor de
GLUT4 de teleósteos bajo la acción de estímulos con conocida capacidad para modular
la transcripción y la expresión de GLUT4 en los mamíferos, como la insulina (Cooke
and Lane, 1998; Cooke and Lane, 1999; Girón et al., 2008), la contracción de fibras
musculares (Slentz et al., 1992; MacLean et al., 2002; Silva et al., 2005; Lima et al.,
2009) y PPARs (Armoni et al., 2003). Así, los principales resultados obtenidos a partir
de los estudios realizados de acuerdo con los objetivos propuestos se enumeran a
continuación:
Resumen del trabajo
� ���
Estudiar la regulación del gen GLUT4 en los peces teleósteos mediante la
identificación y caracterización de una región promotora funcional del gen GLUT4
de Fugu (Takifugu rubripes) y la determinación de las regiones principales
importantes para la actividad del promotor
En los mamíferos, GLUT4 juega un papel fundamental regulando la captación de
glucosa estimulada por insulina en músculo esquelético y cardíaco y tejido adiposo
blanco y marrón (Huang and Czech, 2007). La insulina se ha estudiado ampliamente
como el principal modulador de este transportador debido a su implicación directa en
patologías con captación de la glucosa alterada y resistencia a la insulina como la
diabetes tipo 2 y obesidad (Kusari et al., 1991; Shepherd and Kahn, 1999; Friedel et al.,
2002, Karnieli and Armoni, 2008). Sin embargo, GLUT4 también está bajo la regulación
u otros factores, ente ellos la contracción muscular, ya que se genera una demanda de
glucosa como suministro de energía para las células (Lauritzen and Schertzer, 2010).
También GLUT4 en los peces está regulado por la acción de factores
relacionados con el metabolismo de la glucosa y la captación de glucosa estimulada por
insulina. Varios estudios describen cómo en los peces se regula GLUT4 en el tejido
muscular y adiposo a nivel de expresión de ARN, síntesis de proteínas y translocación a
la membrana plasmática (Capilla et al., 2002; Capilla et al., 2004; Hall et al., 2006, Díaz
et al., 2007; Díaz et al., 2007; Díaz et al., 2009; Capilla et al., 2010; Polakof et al., 2010;
Vraskou et al., 2011). Sin embargo, no hay información respecto a los mecanismos
involucrados en la regulación de la transcripción del gen GLUT4 en teleósteos. Con el
fin de investigar el papel que juegan los distintos factores que ejercen un control sobre
la transcripción del gen GLUT4, se clonó con éxito el promotor de GLUT4 en Fugu. La
región 5’-flanqueante del gen de GLUT4 de Fugu mostró características similares a la
de mamíferos, como TSS múltiples, ausencia de cajas TATA, regiones ricas en GC
cercanas al núcleo del promotor y varios sitios de unión para factores nucleares de
transcripción como SP1 y C/EBP (Kaestner et al., 1990; Buse et al., 1992; Liu et al.,
1992; Richardson and Pessin, 1993). Estructuralmente, el análisis comparativo entre la
secuencia del promotor clonado con promotores de otras especies de peces revelaron
Resumen del trabajo
����
un alto grado de conservación entre dichas especies y que en Fugu el promotor de
GLUT4 presenta dos regiones muy conservadas, una de las cuales contiene el casete
E-box/MEF2/Klf. Este casete también esta presente en los promotores de mamíferos
GLUT4 (Zorzano et al., 2005), donde desempeña un papel importante en la expresión
específica de GLUT4 en los tejidos (Liu et al., 1994; Olson and Pessin, 1995; Thai et al.,
1998).
Además, se confirmó la funcionalidad del promotor clonado el cual, a su vez,
mostró una actividad basal 2-veces mayor que el promotror de GLUT4 de rata.
Adicionalmente, mediante la generación de varios constructos conteniendo delecciones
del promotor se pudo determinar el promotor mínimo funcional, localizando el núcleo
promotor entre los nucleótidos -132 y +93.
Describir los efectos ejercidos en la regulación transcripcional de GLUT4 de Fugu
por el agonista de PPARγ, insulina y la contracción en células de músculo
esquelético
GLUT4 está regulado a diferentes niveles por un gran numero de factores y, a
pesar de la amplia atención experimental que ha recibido, los mecanismos mediante los
cuales insulina y otros mediadores ejercen su acción sobre GLUT4 se desconocen
(Thorens and Mueckler, 2010). Se sabe que en estados fisiológicos donde la
homeostasis de la glucosa se encuentra alterada dan lugar a variaciones en los niveles
de ARNm de GLUT4 en el músculo y tejido adiposo. En concreto, se ha descrito que la
expresión de este transportador en músculo esquelético aumenta con la contracción
muscular provocada por el ejercicio físico y se ve reducida en estados de deficiencia de
insulina, incluyendo diabetes tipo II y obesidad. Por lo tanto, el principal objetivo de este
trabajo ha sido mejorar nuestra comprensión de los procesos moleculares que regulan
la homeostasis de la glucosa por desentrañar los mecanismos que intervienen en la
regulación de la transcripción del gen GLUT4.
Como se mencionó antes, la insulina estimula la expresión de GLUT4, la síntesis
Resumen del trabajo
� ���
de proteínas y su translocación a la superficie celular en los mamíferos (Bryant et al.,
2002; Ishiki and Klip, 2005; Larance et al., 2008) y en peces (Capilla et al., 2004 ; Díaz
et al., 2007). Sin embargo, el efecto ejercido por esta hormona sobre GLUT4 a nivel
transcripcional ha sido poco caracterizado hasta la fecha. En este estudio, hemos
observado que la actividad del promotor de GLUT4 de Fugu es inhibida por la insulina
de forma dosis y tiempo dependiente, siendo consistentes con las evidencias anteriores
en mamíferos (Cooke and Lane, 1998; Cooke and Lane, 1999; Girón et al., 2008). Más
aún, todas los constructos conteniendo delecciones fueron reprimidos por la insulina, lo
que sugiere la presencia de elementos reguladores aguas abajo del TSS. Estos
resultados nos llevan a la hipótesis de que tal vez el promotor de Fugu clonado carece
de la región (s) necesaria(s) para la activación transcripcional de GLUT4 por la insulina.
En este sentido más estudios serán necesarios para identificar tales regiones.
A continuación, se investigaron los efectos de la activación por PPARγ en células
L6 musculares de ratón transfectadas con el promotor clonado de GLUT4 de Fugu. Los
PPARs son factores de transcripción activados mediante ligando de la familia de
receptores nucleares (Fajas et al, 2001). Entre las tres isoformas de PPAR (α, β y γ),
PPARγ se expresa principalmente en los tejidos sensibles a la insulina, como el
músculo y el tejido adiposo, jugando un papel importante en el metabolismo lipídico y la
regulación de la homeostasis de la glucosa (Fajas et al., 1997; Olefsky and Saltiel,
2000). Por lo tanto, se estudiaron los efectos de la PG-J2, un conocido agonista
endógeno de PPARγ (Forman et al., 1995, Kliewer et al., 1995), como un modulador de
la transcripción del gen GLUT4 de Fugu. Nuestros resultados mostraron que la
estimulación con PG-J2 estimuló significativamente la actividad del promotor de GLUT4
de Fugu y que este efecto desapareció en las delecciones del promotor de GLUT4 de
Fugu carentes de los motivos PPAR/RXR. Este resultado concuerda con el hecho de
que los receptores PPARγ regulan la transcripción heterodimerizando con RXR (Armoni
et al., 2003).
Por último, se investigaron in vitro los efectos de la contracción muscular usando
la línea de células musculares C2C12 expresando el promotor de GLUT4 de Fugu. El
Resumen del trabajo
����
uso de este sistema para imitar los efectos del ejercicio en miotubos diferenciados in
vitro, mostró un alto incremento en la actividad transcripcional del promotor de GLUT4
de Fugu. Nuestros resultados también sugieren la importancia del motivo de unión de
HIF-1 para la activación transcripcional del promotor, en respuesta a la contracción
muscular ya que todas las delecciones que contenían el motivo de HIF-1 aumentaron
significativamente su tasa de transcripción en respuesta a la estimulación con impulsos
eléctricos, de acuerdo con la literatura en los mamíferos (Silva et al., 2005; Lima et al.,
2009). En conjunto, los resultados indican claramente que la contracción muscular
estaría regulando la transcripción del gen GLUT4 y sugieren la implicación de HIF-1
como un modulador de la transcripción de GLUT4 en condiciones hipóxicas derivadas
del ejercicio físico (Wagner, 2001).
Estudiar la localización de la expresión de GLUT2 en embriones de pez cebra
(Danio rerio) a lo largo de las primeras etapas de desarrollo
GLUT2 es el miembro de la familia SLC2 con la capacidad de transportar la
mayor cantidad de azúcares de la dieta, sobre todo glucosa, y se expresa en los
principales tejidos (hígado, intestino, páncreas endocrino, etc.) que intervienen en la
manipulación de los hidratos de carbono (Bell et al., 1990; Thorens and Mueckler,
2010). Debido a su baja afinidad y alta capacidad, este transportador de glucosa
permite manejar grandes flujos de azúcares, equilibrando los niveles de glúcidos dentro
y fuera de las células. Además, GLUT2 es el principal transportador de glucosa
expresado en las células β pancreáticas, mediando la secreción de insulina inducida por
glucosa (Henquin et al., 2003). Los estudios previos sobre el GLUT2 de peces, indican
que la distribución de tejidos y las propiedades funcionales de este transportador de
glucosa son similares a las de los mamíferos (Castillo et al., 2009). Sin embargo, se
sabe poco acerca de la función fisiológica de GLUT2 en los vertebrados inferiores. En
los peces teleósteos, se sabe que GLUT2 esta regulado por niveles de glucosa
plasmática en el cerebro posterior y el páncreas (Polakof et al., 2007) y por la
disponibilad de nutrientes en el intestino. Sin embargo, en condiciones de ayuno/re-
alimentación los datos de los experimentos son contradictorios a los disponibles en
Resumen del trabajo
� ���
mamíferos, ya que la expresión de GLUT2 no se altera en el hígado de la trucha arco
iris ni del bacalao del Atlántico (Panserat et al., 2001; Hall et al., 2006), mientras que en
el pez cebra se encuentra inversamente regulado en el intestino (Castillo et al., 2009).
Aparte de las diferencias en la regulación nutricional de la expresión de GLUT2 que se
podrían atribuir a las diferencias entre especies, se sabe muy poco respecto a la
función de GLUT2 durante el desarrollo temprano. Por esta razón, se estudió la
localización de la expresión de GLUT2 durante las primeras fases del desarrollo y los
efectos del bloqueo de GLUT2 en los embriones de pez cebra.
El patrón de expresión de GLUT2 durante el desarrollo embrionario del pez cebra
se ha estudiado por ISH, observando transcritos en el hígado, los túbulos pronéfricos,
intestino anterior, páncreas endocrino y las neuronas que rodean la región del cerebro
posterior. La expresión en el sistema pronéfrico y en el cerebro se detectó temprano en
el desarrollo, a partir del 24 hpf. El ARNm de GLUT2 se detectó por primera vez en el
hígado, páncreas endocrino e intestino anterior a 72 hpf, coincidiendo con la finalización
de la formación del aparato digestivo (Wallace and Pack, 2003). También en este punto,
la expresión renal de GLUT2 se localiza principalmente en los túbulos pronéfricos y la
expresión en el cerebro se localizó principalmente en el cerebro posterior, tanto en el
cerebelo y como en el bulbo raquídeo. Estos resultados apoyan la idea de la existencia
de una región sensible a la glucosa en el cerebro de pez cebra, tal y como se hipotetizó
en trucha arco iris (Polakof et al., 2007) y en mamíferos (Marty et al., 2007).
En resumen, estas evidencias concuerdan con la distribución observada en otros
peces teleósteos (Panserat et al., 2001; Hall et al., 2006; Polakof et al., 2007; Castillo et
al., 2009; Terova et al., 2009 ), y en los mamíferos (Thorens et al., 1988; Fukumoto et
al., 1989; Bell et al., 1990; Thorens et al., 1990), y sugiere la importancia de GLUT2
para el desarrollo de los tejidos derivados del endodermo y refuerza la hipótesis de la
existencia de una unidad de detección de glucosa en el cerebro de pez cebra.
Resumen del trabajo
����
Evaluar los efectos del knockdown de GLUT2 en pez cebra con morfolinos
antisentido en el desarrollo embrionario y describir las alteraciones funcionales
causadas por la reducción de GLUT2
Varios estudios han recurrido al uso de organismos GLUT2-deficientes para
analizar la función de este transportador. Ratones GLUT2-nulos muestran secreción
deficiente de insulina, presentando un fenotipo diabético, sobreviviendo solo al ser
alimentados con pellets de bajo contenido en azúcar (Guillam et al., 1997). Además,
ratones knockout para GLUT2 presentan hiperglucemia, niveles altos de ácidos grasos
libres en plasma, glucosuria y comportamiento anormal en la alimentación (Guillam et
al., 1997; Bady et al., 2006). En esta línea, recientemente se ha informado de la
generación de una línea de ratones transgénicos con detección deficiente de azúcar por
GLUT2 (GLUT2-SDD) que muestran hipoinsulinemia, la homeostasis de la glucosa
alterada, retraso en el desarrollo y la pérdida de glucosa en la orina (Stolarczyk et al.,
2007 ).
Hasta la fecha, no existen estudios en los peces utilizando tales aproximaciones,
debido a limitaciones técnicas. De esta manera, en nuestro estudio nos hemos
beneficiado del modelo de pez cebra y sus ventajas para el estudio de la función génica
in vivo. Así, para estudiar la función durante las primeras etapas del desarrollo del pez
cebra se bloqueo GLUT2 utilizando morfolinos antisentido. Nuestros resultados
mostraron que los embriones que carecen de GLUT2 presentan un retraso en el
desarrollo de todo el cuerpo con alteraciones severas del cerebro medio y los
ventrículos cerebrales posteriores. Se confirmó la alteración estructural del sistema
nervioso central por inmunolocalización de la tubulina acetilada. Además, mediante el
uso de genes marcadores de células progenitoras neurales, se encontró que la
abrogación de GLUT2 puede ser la causa de este fenotipo neurodegenerativo como
consecuencia de alteraciones en el desarrollo de dichas células pero principalmente
afectando a las progenitoras de las neuronas GABAérgicas.
A continuación, mediante el estudio de las alteraciones funcionales provocadas
Resumen del trabajo
� ���
por la falta de GLUT2 se observó un deterioro de la captación de glucosa en el cuerpo,
pero especialmente en la región de la cabeza. Curiosamente, un patrón similar se
encontró analizando la viabilidad celular en estos embriones, que mostraron un
aumento significativo de la muerte celular por apoptosis, principalmente en la zona
cefálica. Estas evidencias nos llevaron a hipotetizar que la disponibilidad insuficiente de
glucosa en los momentos críticos del desarrollo puede resultar en un aumento de la
muerte celular por apoptosis. Además, el bloqueo de la expresión de GLUT2 resultó en
alteraciones en la distribución asimétrica de algunos órganos derivados del endodermo
que expresaban el transportador de glucosa, es decir, el hígado y páncreas endocrino y
exocrino. Usando genes marcadores para determinar la importancia de este efecto se
observaron alteraciones en el eje de la asimetría en el 69% de los casos para el hígado,
el 73% para el páncreas exocrino y en el 55% de los casos para el páncreas endocrino.
Además, estudiando las alteraciones transcripcionales de estos embriones
mediante análisis por microarray, validamos el knockdown de GLUT2 ya que se
encontraba altamente infra-regulado en embriones morphant. Adicionalmente, un
número elevado de genes involucrados en los procesos apoptóticos fueron expresadas
diferencialmente en los embriones GLUT2-deficientes, confirmando el incremento
observado en apoptosis. También curiosamente, se encontró que la expresión de
parvalvumina y PDX1 estaba alterada. Estos genes se expresan en las neuronas
GABAérgicas y el páncreas endocrino, respectivamente, donde juegan un papel
importante en su funcionamiento (MacFarlane et al., 1994; Marshak et al., 1996;
Hashimoto et al., 2003). También se observó que LEFTY2 y TGFβ1 resultaron
diferencialmente expresados en morphants como una consecuencia de la disminución
de GLUT2. Dado que los dos genes son importantes moduladores de la vía Nodal y son
necesarios para la organización asimétrica normal del diencéfalo dorsal y los tejidos
derivados del endodermo (Bisgrove et al., 1999; Rodaway et al., 1999; Bisgrove et al.,
2000), estas evidencias apoyan las alteraciones observadas en la distribución de
órganos que expresan GLUT2.
Resumen del trabajo
����
Estudiar la funcionalidad del GLUT2 de pez cebra usando un modelo in vitro de
mamíferos e investigar su capacidad para rescatar las células pancreáticas
GLUT2-deficientes
En los mamíferos, la expresión de GLUT2 en el hígado, intestino, riñón y
páncreas endocrino está regulada por las variaciones en los niveles de hidratos de
carbono producidas por re-alimentación y los estados de ayuno (Thorens, 1996). En
particular, en las células β pancreáticas un aumento de los niveles de glucosa circulante
resulta en un aumento de la captación mediada por GLUT2 que conduce a la
despolarización de la membrana plasmática y la activación de la secreción de gránulos
de la insulina (Deeney et al., 2000; Henquin et al., 2003; Thorens., 2011). El uso de
modelos transgénicos es de gran utilidad en el estudio del papel fisiológico de GLUT2 y
su implicación en la secreción de insulina estimulada por glucosa en los mamíferos. Es
por esto que, los ratones transgénicos GLUT2-nulos y SDD eran hiperglucémicos e
hipoinsulinémicos, habiendo perdido la capacidad de detección de la glucosa necesaria
para la secreción de insulina (Guillam et al., 1997; Thorens et al., 2000; Stolarczyk et
al., 2007). Curiosamente, Guillam et al. mostraron que mediante la re-expresión de
GLUT2 se recuperaba la secreción de insulina inducida por glucosa (Guillam et al.,
2000) demostrando una vez más la importancia de este transportador en el
metabolismo de la glucosa.
De modo que nos propusimos establecer un sistema in vitro mediante el uso de
línea celular de células β de mamífero MIN6 (Miyazaki et al., 1990) con el fin de estudiar
las funciones fisiológicas del GLUT2 de pez cebra. Nuestros resultados muestran que
hemos sido capaces de bloquear el GLUT2 endógeno conduciendo a una pérdida de la
secreción de insulina estimulada por glucosa en las células MIN6. Adicionalmente, se
establecieron con éxito las condiciones para la expresión del GLUT2 de pez cebra en
MIN6, que fue capaz de aumentar significativamente la absorción basal de glucosa en
las células pancreáticas. Además, los resultados preliminares apuntan a un posible
aumento en la captación de glucosa en las células que expresan el constructo de
GLUT2 de rata.
Resumen del trabajo
� ���
Por lo tanto, los resultados de esta tesis constituyen el primer paso en el
establecimiento de un sistema con un futuro prometedor con el que, próximos
experimentos rescatando células con el GLUT2 bloqueado con otros GLUT2 exógenos
nos ayudara a entender mejor las propiedades funcionales de este transportador en
peces. Además, gracias a las proteínas GFP de los constructos transfectados
podremos estudiar las características del tráfico del GLUT2 de pez cebra.
Resumen del trabajo
����
Conclusiones 1. Hemos clonado y caracterizado el primer promotor funcional de GLUT4 en una
especie no mamífera. Desde el punto de vista estructural la secuencia de este
promotor está altamente conservada entre los peces teleósteos y presenta la
mayoría de los sitios de unión conocidos como importantes para la regulación de
GLUT4.
2. El promotor de GLUT4 de Fugu está regulado por insulina, PPARγ y estimulación
por pulso eléctrico en células de músculo esquelético de mamífero. La
estimulación con insulina provocó una reducción significativa de la actividad del
promotor de GLUT4 de Fugu. Sin embargo, la actividad del promotor de GLUT4
aumentó en respuesta a la activación por PPARγ y contracción controlada
experimentalmente.
3- En embriones de pez cebra a 24 y 48 hpf el ARNm de GLUT2 se detecta en el
cerebro y en los conductos pronéfricos. A 72 y 120 hpf se observó un aumento
generalizado de la expresión de GLUT2 observándose intestino, hígado,
páncreas, túbulos pronéfricos y rombencéfalo.
4- El knockdown del GLUT2 de pez cebra causa anomalías severas en la
organogénesis del cerebro, resultando en la formación defectuosa de la unión
mesencéfalo–rombencéfalo y del rombencéfalo, así como un retraso
generalizado del desarrollo corporal.
5- GLUT2 en embriones de pez cebra juega un papel clave durante el desarrollo de
células progenitoras neuronales, especialmente en la generación de neuronas
GABAérgicas. Esto sugiere la existencia de una región glucosensora en el
rombencéfalo del pez cebra en el cual estas neuronas estarían involucradas en
la regulación de la homeostasis de la glucosa..
Resumen del trabajo
� ���
6- Los embriones deficientes en GLUT2 mostraron afectada la captación de
glucosa, un aumento generalizado de muerte celular por apoptosis
especialmente localizado en la región cefálica y alteraciones en la distribución de
los órganos derivados del endodermo. Así mismo, estas evidencias sugieren que
la coordinación defectuosa entre la captación de la glucosa y la demanda de
hidratos de carbono durante las etapas tempranas del desarrollo embrionario
podrían afectar al desarrollo de los órganos que expresan GLUT2 y a la
viabilidad celular.
7- El knockdown del GLUT2 endógeno en células MIN6 lleva a una pérdida de la
secreción de insulina glucodependiente, y la sobreexpresión del GLUT2 de pez
cebra en células MIN6 resultó en un aumento significativo de la captación de
glucosa. Estas evidencias confirman que las células MIN6 son válidas para el
estudio del papel funcional del GLUT2 de pez cebra en células β pancreáticas.
Bibliography
Bibliography
� ���
Abel, E. D. (2004). "Glucose transport in the heart." Frontiers in Bioscience 9: 201-215.
Al-Khalili, L., A. V. Chibalin, K. Kannisto, B. B. Zhang, J. Permert, G. D. Holman, E. Ehrenborg, V. D. Ding, J. R. Zierath and A. Krook (2003). "Insulin action in
cultured human skeletal muscle cells during differentiation: assessment of cell
surface GLUT4 and GLUT1 content." Cellular and Molecular Life Sciences 60(5):
991-998.
Al-Khalili, L., M. Forsgren, K. Kannisto, J. R. Zierath, F. Lonnqvist and A. Krook (2005). "Enhanced insulin-stimulated glycogen synthesis in response to insulin,
metformin or rosiglitazone is associated with increased mRNA expression of
GLUT4 and peroxisomal proliferator activator receptor gamma co-activator 1."
Diabetologia 48(6): 1173-1179.
Alder, J., N. K. Cho and M. E. Hatten (1996). "Embryonic precursor cells from the
rhombic lip are specified to a cerebellar granule neuron identity." Neuron 17(3):
389-399.
Alexander, J. and D. Y. Stainier (1999). "A molecular pathway leading to endoderm
formation in zebrafish." Current Biology 9(20): 1147-1157.
Anish, R., M. B. Hossain, R. H. Jacobson and S. Takada (2009). "Characterization of
transcription from TATA-less promoters: identification of a new core promoter
element XCPE2 and analysis of factor requirements." PLoS ONE 4(4): e5103.
Arluison, M., M. Quignon, P. Nguyen, B. Thorens, C. Leloup and L. Penicaud (2004). "Distribution and anatomical localization of the glucose transporter 2
(GLUT2) in the adult rat brain an immunohistochemical study." Journal of
Chemical Neuroanatomy 28(3): 117-136.
Arluison, M., M. Quignon, B. Thorens, C. Leloup and L. Penicaud (2004). "Immunocytochemical localization of the glucose transporter 2 (GLUT2) in the
adult rat brain. II. Electron microscopic study." Journal of Chemical
Neuroanatomy 28(3): 137-146.
Armoni, M., N. Kritz, C. Harel, F. Bar-Yoseph, H. Chen, M. J. Quon and E. Karnieli (2003). "Peroxisome proliferator-activated receptor-gamma represses GLUT4
promoter activity in primary adipocytes, and rosiglitazone alleviates this effect."
Journal of Biological Chemistry 278(33): 30614-30623.
Bibliography
����
Atkins, K. B., C. A. Northcott, S. W. Watts and F. C. Brosius (2005). "Effects of
PPAR-gamma ligands on vascular smooth muscle marker expression in
hypertensive and normal arteries." American Journal of Physiology - Heart and
Circulatory Physiology 288(1): H235-243.
Augustin, R. (2010). "The protein family of glucose transport facilitators: It's not only
about glucose after all." IUBMB life 62(5): 315-333.
Bady, I., N. Marty, M. Dallaporta, M. Emery, J. Gyger, D. Tarussio, M. Foretz and B. Thorens (2006). "Evidence from glut2-null mice that glucose is a critical
physiological regulator of feeding." Diabetes 55(4): 988-995.
Bae, Y. K., S. Kani, T. Shimizu, K. Tanabe, H. Nojima, Y. Kimura, S. Higashijima and M. Hibi (2009). "Anatomy of zebrafish cerebellum and screen for mutations
affecting its development." Developmental Biology 330(2): 406-426.
Baldwin, S. A. (1993). "Mammalian passive glucose transporters: members of an
ubiquitous family of active and passive transport proteins." Biochimica et
Biophysica Acta 1154(1): 17-49.
Bell, G. I., T. Kayano, J. B. Buse, C. F. Burant, J. Takeda, D. Lin, H. Fukumoto and S. Seino (1990). "Molecular biology of mammalian glucose transporters."
Diabetes Care 13(3): 198-208.
Bergeron, R., R. R. Russell, 3rd, L. H. Young, J. M. Ren, M. Marcucci, A. Lee and G. I. Shulman (1999). "Effect of AMPK activation on muscle glucose metabolism in
conscious rats." American Journal of Physiology 276(5 Pt 1): E938-944.
Biemar, F., F. Argenton, R. Schmidtke, S. Epperlein, B. Peers and W. Driever (2001). "Pancreas development in zebrafish: early dispersed appearance of
endocrine hormone expressing cells and their convergence to form the definitive
islet." Developmental Biology 230(2): 189-203.
Bilan, P. J., Y. Mitsumoto, T. Ramlal and A. Klip (1992). "Acute and long-term effects
of insulin-like growth factor I on glucose transporters in muscle cells.
Translocation and biosynthesis." FEBS Letters 298(2-3): 285-290.
Birnbaum, M. J. (1989). "Identification of a novel gene encoding an insulin-responsive
Burant, C. F. and G. I. Bell (1992). "Mammalian facilitative glucose transporters:
evidence for similar substrate recognition sites in functionally monomeric
proteins." Biochemistry 31(42): 10414-10420.
Burant, C. F., W. I. Sivitz, H. Fukumoto, T. Kayano, S. Nagamatsu, S. Seino, J. E. Pessin and G. I. Bell (1991). "Mammalian glucose transporters: structure and
molecular regulation." Recent Progress in Hormone Research 47: 349-387;
discussion 387-348.
Burcelin, R., W. Dolci and B. Thorens (2000). "Glucose sensing by the hepatoportal
sensor is GLUT2-dependent: in vivo analysis in GLUT2-null mice." Diabetes
49(10): 1643-1648.
Bibliography
����
Buse, J. B., K. Yasuda, T. P. Lay, T. S. Seo, A. L. Olson, J. E. Pessin, J. H. Karam,
S. Seino and G. I. Bell (1992). "Human GLUT4/muscle-fat glucose-transporter
gene. Characterization and genetic variation." Diabetes 41(11): 1436-1445.
Capilla, E., M. Diaz, A. Albalat, I. Navarro, J. E. Pessin, K. Keller and J. V. Planas (2004). "Functional characterization of an insulin-responsive glucose transporter
(GLUT4) from fish adipose tissue." American Journal of Physiology -
Endocrinology and Metabolism 287(2): E348-357.
Capilla, E., M. Diaz, J. Gutierrez and J. V. Planas (2002). "Physiological regulation of
the expression of a GLUT4 homolog in fish skeletal muscle." American Journal of
Physiology - Endocrinology and Metabolism 283(1): E44-49.
Capilla, E., M. Diaz, J. C. Hou, J. V. Planas and J. E. Pessin (2010). "High basal cell
surface levels of fish GLUT4 are related to reduced sensitivity of insulin-induced
translocation toward GGA and AS160 inhibition in adipocytes." American Journal
of Physiology - Endocrinology and Metabolism 298(2): E329-336.
Casla, A., A. Rovira, J. A. Wells and G. L. Dohm (1990). "Increased glucose
transporter (GLUT4) protein expression in hyperthyroidism." Biochemical and
Biophysical Research Communications 171(1): 182-188.
Castello, A., J. Cadefau, R. Cusso, X. Testar, J. E. Hesketh, M. Palacin and A. Zorzano (1993). "GLUT-4 and GLUT-1 glucose transporter expression is
differentially regulated by contractile activity in skeletal muscle." Journal of
Biological Chemistry 268(20): 14998-15003.
Castello, A., J. C. Rodriguez-Manzaneque, M. Camps, A. Perez-Castillo, X. Testar, M. Palacin, A. Santos and A. Zorzano (1994). "Perinatal hypothyroidism impairs
the normal transition of GLUT4 and GLUT1 glucose transporters from fetal to
neonatal levels in heart and brown adipose tissue. Evidence for tissue-specific
regulation of GLUT4 expression by thyroid hormone." Journal of Biological
Chemistry 269(8): 5905-5912.
Castillo, J., M. Codina, M. L. Martinez, I. Navarro and J. Gutierrez (2004). "Metabolic
and mitogenic effects of IGF-I and insulin on muscle cells of rainbow trout."
American Journal of Physiology - Regulatory, Integrative and Comparative
Physiology 286(5): R935-941.
Bibliography
� ���
Castillo, J., D. Crespo, E. Capilla, M. Diaz, F. Chauvigne, J. Cerda and J. V. Planas
(2009). "Evolutionary structural and functional conservation of an ortholog of the
GLUT2 glucose transporter gene (SLC2A2) in zebrafish." American Journal of
Physiology - Regulatory, Integrative and Comparative Physiology 297(5): R1570-
1581.
Charron, M. J., F. C. Brosius, 3rd, S. L. Alper and H. F. Lodish (1989). "A glucose
transport protein expressed predominately in insulin-responsive tissues."
Proceedings of the National Academy of Sciences of the United States of
America 86(8): 2535-2539.
Cheeseman, C. I. (2002). "Intestinal hexose absorption: transcellular or paracellular
fluxes." Journal of Physiology 544(Pt 2): 336.
Coderre, L., M. M. Monfar, K. S. Chen, S. J. Heydrick, T. G. Kurowski, N. B. Ruderman and P. F. Pilch (1992). "Alteration in the expression of GLUT-1 and
GLUT-4 protein and messenger RNA levels in denervated rat muscles."
Endocrinology 131(4): 1821-1825.
Cooke, D. W. and M. D. Lane (1998). "A sequence element in the GLUT4 gene that
mediates repression by insulin." Journal of Biological Chemistry 273(11): 6210-
6217.
Cooke, D. W. and M. D. Lane (1999). "The transcription factor nuclear factor I mediates
repression of the GLUT4 promoter by insulin." Journal of Biological Chemistry
274(18): 12917-12924.
Cusin, I., J. Terrettaz, F. Rohner-Jeanrenaud, N. Zarjevski, F. Assimacopoulos-Jeannet and B. Jeanrenaud (1990). "Hyperinsulinemia increases the amount of
GLUT4 mRNA in white adipose tissue and decreases that of muscles: a clue for
increased fat depot and insulin resistance." Endocrinology 127(6): 3246-3248.
Deeney, J. T., M. Prentki and B. E. Corkey (2000). "Metabolic control of beta-cell
function." Seminars in Cell & Developmental Biology 11(4): 267-275.
Dela, F., A. Handberg, K. J. Mikines, J. Vinten and H. Galbo (1993). "GLUT 4 and
insulin receptor binding and kinase activity in trained human muscle." Journal of
Physiology 469: 615-624.
Bibliography
����
Denovan-Wright, E. M., M. Pierce, M. K. Sharma and J. M. Wright (2000). "cDNA
sequence and tissue-specific expression of a basic liver-type fatty acid binding
protein in adult zebrafish (Danio rerio)." Biochimica et Biophysica Acta 1492(1):
227-232.
Diaz, M., C. N. Antonescu, E. Capilla, A. Klip and J. V. Planas (2007). "Fish glucose
transporter (GLUT)-4 differs from rat GLUT4 in its traffic characteristics but can
translocate to the cell surface in response to insulin in skeletal muscle cells."
Endocrinology 148(11): 5248-5257.
Diaz, M., E. Capilla and J. V. Planas (2007). "Physiological regulation of glucose
transporter (GLUT4) protein content in brown trout (Salmo trutta) skeletal
muscle." Journal of Experimental Biology 210(Pt 13): 2346-2351.
Diaz, M., Y. Vraskou, J. Gutierrez and J. V. Planas (2009). "Expression of rainbow
trout glucose transporters GLUT1 and GLUT4 during in vitro muscle cell
differentiation and regulation by insulin and IGF-I." American Journal of
Physiology - Regulatory, Integrative and Comparative Physiology 296(3): R794-
800.
Drummond, I. A., A. Majumdar, H. Hentschel, M. Elger, L. Solnica-Krezel, A. F.
Schier, S. C. Neuhauss, D. L. Stemple, F. Zwartkruis, Z. Rangini, W. Driever and M. C. Fishman (1998). "Early development of the zebrafish pronephros and
analysis of mutations affecting pronephric function." Development 125(23): 4655-
4667.
Duclos, M. J., B. Chevalier, Y. Le Marchand-Brustel, J. F. Tanti, C. Goddard and J. Simon (1993). "Insulin-like growth factor-I-stimulated glucose transport in
myotubes derived from chicken muscle satellite cells." Journal of Endocrinology
137(3): 465-472.
Dugani, C. B. and A. Klip (2005). "Glucose transporter 4: cycling, compartments and
controversies." EMBO reports 6(12): 1137-1142.
During, M. J., P. Leone, K. E. Davis, D. Kerr and R. S. Sherwin (1995). "Glucose
modulates rat substantia nigra GABA release in vivo via ATP-sensitive potassium
channels." Journal of Clinical Investigation 95(5): 2403-2408.
Bibliography
� ���
Eisenberg, M. L., A. V. Maker, L. A. Slezak, J. D. Nathan, K. C. Sritharan, B. P. Jena,
J. P. Geibel and D. K. Andersen (2005). "Insulin receptor (IR) and glucose
transporter 2 (GLUT2) proteins form a complex on the rat hepatocyte membrane."
Cellular Physiology and Biochemistry 15(1-4): 51-58.
Eny, K. M., T. M. Wolever, B. Fontaine-Bisson and A. El-Sohemy (2008). "Genetic
variant in the glucose transporter type 2 is associated with higher intakes of
sugars in two distinct populations." Physiological Genomics 33(3): 355-360.
Etgen, G. J., Jr., R. P. Farrar and J. L. Ivy (1993). "Effect of chronic electrical
stimulation on GLUT-4 protein content in fast-twitch muscle." American Journal of
Physiology 264(4 Pt 2): R816-819.
Fajas, L., D. Auboeuf, E. Raspe, K. Schoonjans, A. M. Lefebvre, R. Saladin, J. Najib, M. Laville, J. C. Fruchart, S. Deeb, A. Vidal-Puig, J. Flier, M. R. Briggs, B. Staels, H. Vidal and J. Auwerx (1997). "The organization, promoter analysis,
and expression of the human PPARgamma gene." Journal of Biological
Chemistry 272(30): 18779-18789.
Fajas, L., M. B. Debril and J. Auwerx (2001). "Peroxisome proliferator-activated
receptor-gamma: from adipogenesis to carcinogenesis." Journal of Molecular
Endocrinology 27(1): 1-9.
Feldman, B., M. A. Gates, E. S. Egan, S. T. Dougan, G. Rennebeck, H. I. Sirotkin, A. F. Schier and W. S. Talbot (1998). "Zebrafish organizer development and germ-
Foster, L. J., D. Li, V. K. Randhawa and A. Klip (2001). "Insulin accelerates inter-
endosomal GLUT4 traffic via phosphatidylinositol 3-kinase and protein kinase B."
Journal of Biological Chemistry 276(47): 44212-44221.
Friedel, S., B. Antwerpen, A. Hoch, C. Vogel, W. Grassl, F. Geller, J. Hebebrand and A. Hinney (2002). "Glucose transporter 4 gene: association studies
pertaining to alleles of two polymorphisms in extremely obese children and
adolescents and in normal and underweight controls." Annals of the New York
Academy of Sciences 967: 554-557.
Fukumoto, H., T. Kayano, J. B. Buse, Y. Edwards, P. F. Pilch, G. I. Bell and S.
Seino (1989). "Cloning and characterization of the major insulin-responsive
glucose transporter expressed in human skeletal muscle and other insulin-
responsive tissues." Journal of Biological Chemistry 264(14): 7776-7779.
Fukumoto, H., S. Seino, H. Imura, Y. Seino, R. L. Eddy, Y. Fukushima, M. G. Byers,
T. B. Shows and G. I. Bell (1988). "Sequence, tissue distribution, and
chromosomal localization of mRNA encoding a human glucose transporter-like
protein." Proceedings of the National Academy of Sciences of the United States
of America 85(15): 5434-5438.
Gerhard, G. S. (2003). "Comparative aspects of zebrafish (Danio rerio) as a model for
Gerrits, P. M., A. L. Olson and J. E. Pessin (1993). "Regulation of the GLUT4/muscle-
fat glucose transporter mRNA in adipose tissue of insulin-deficient diabetic rats."
Journal of Biological Chemistry 268(1): 640-644.
Girard, J. (2006). "Insulin's effect on the liver: "direct or indirect?" continues to be the
question." Journal of Clinical Investigation 116(2): 302-304.
Giron, M. D., N. Sevillano, A. M. Vargas, J. Dominguez, J. J. Guinovart and R. Salto (2008). "The glucose-lowering agent sodium tungstate increases the levels and
translocation of GLUT4 in L6 myotubes through a mechanism associated with
ERK1/2 and MEF2D." Diabetologia 51(7): 1285-1295.
Gittes, G. K. and W. J. Rutter (1992). "Onset of cell-specific gene expression in the
developing mouse pancreas." Proceedings of the National Academy of Sciences
of the United States of America 89(3): 1128-1132.
Bibliography
� ���
Gouyon, F., L. Caillaud, V. Carriere, C. Klein, V. Dalet, D. Citadelle, G. L. Kellett, B.
Thorens, A. Leturque and E. Brot-Laroche (2003). "Simple-sugar meals target
GLUT2 at enterocyte apical membranes to improve sugar absorption: a study in
GLUT2-null mice." Journal of Physiology 552(Pt 3): 823-832.
Grabe, N. (2002). "AliBaba2: Context specific identification of transcription factor binding
sites." In Silico Biology 2(1): S1-S15.
Gray, S., M. W. Feinberg, S. Hull, C. T. Kuo, M. Watanabe, S. Sen-Banerjee, A. DePina, R. Haspel and M. K. Jain (2002). "The Kruppel-like factor KLF15
regulates the insulin-sensitive glucose transporter GLUT4." Journal of Biological
Chemistry 277(37): 34322-34328.
Guillam, M. T., P. Dupraz and B. Thorens (2000). "Glucose uptake, utilization, and
signaling in GLUT2-null islets." Diabetes 49(9): 1485-1491.
Guillam, M. T., E. Hummler, E. Schaerer, J. I. Yeh, M. J. Birnbaum, F. Beermann, A.
Schmidt, N. Deriaz and B. Thorens (1997). "Early diabetes and abnormal
postnatal pancreatic islet development in mice lacking Glut-2." Nature Genetics
17(3): 327-330.
Haber, R. S., S. P. Weinstein, E. O'Boyle and S. Morgello (1993). "Tissue distribution
of the human GLUT3 glucose transporter." Endocrinology 132(6): 2538-2543.
Habold, C., C. Foltzer-Jourdainne, Y. Le Maho, J. H. Lignot and H. Oudart (2005). "Intestinal gluconeogenesis and glucose transport according to body fuel
availability in rats." Journal of Physiology 566(Pt 2): 575-586.
Hall, J. R., T. J. MacCormack, C. A. Barry and W. R. Driedzic (2004). "Sequence and
expression of a constitutive, facilitated glucose transporter (GLUT1) in Atlantic
cod Gadus morhua." Journal of Experimental Biology 207(Pt 26): 4697-4706.
Hall, J. R., C. E. Short and W. R. Driedzic (2006). "Sequence of Atlantic cod (Gadus
morhua) GLUT4, GLUT2 and GPDH: Developmental stage expression, tissue
expression and relationship to starvation-induced changes in blood glucose."
Journal of Experimental Biology 209(Pt 22): 4490-4502.
Hallakou, S., L. Doare, F. Foufelle, M. Kergoat, M. Guerre-Millo, M. F. Berthault, I. Dugail, J. Morin, J. Auwerx and P. Ferre (1997). "Pioglitazone induces in vivo
Bibliography
����
adipocyte differentiation in the obese Zucker fa/fa rat." Diabetes 46(9): 1393-
1399.
Hashimoto, T., D. W. Volk, S. M. Eggan, K. Mirnics, J. N. Pierri, Z. Sun, A. R. Sampson and D. A. Lewis (2003). "Gene expression deficits in a subclass of
GABA neurons in the prefrontal cortex of subjects with schizophrenia." Journal of
Neuroscience 23(15): 6315-6326.
Hayashi, T., M. F. Hirshman, E. J. Kurth, W. W. Winder and L. J. Goodyear (1998). "Evidence for 5' AMP-activated protein kinase mediation of the effect of muscle
contraction on glucose transport." Diabetes 47(8): 1369-1373.
Henquin, J. C., M. A. Ravier, M. Nenquin, J. C. Jonas and P. Gilon (2003). "Hierarchy of the beta-cell signals controlling insulin secretion." European Journal
of Clinical Investigation 33(9): 742-750.
Hofmann, S. and D. Pette (1994). "Low-frequency stimulation of rat fast-twitch muscle
enhances the expression of hexokinase II and both the translocation and
expression of glucose transporter 4 (GLUT-4)." FEBS Journal 219(1-2): 307-315.
Hoshino, M. (2006). "Molecular machinery governing GABAergic neuron specification in
the cerebellum." Cerebellum 5(3): 193-198.
Hoshino, M., S. Nakamura, K. Mori, T. Kawauchi, M. Terao, Y. V. Nishimura, A. Fukuda, T. Fuse, N. Matsuo, M. Sone, M. Watanabe, H. Bito, T. Terashima, C. V. Wright, Y. Kawaguchi, K. Nakao and Y. Nabeshima (2005). "Ptf1a, a bHLH
transcriptional gene, defines GABAergic neuronal fates in cerebellum." Neuron
47(2): 201-213.
Host, H. H., P. A. Hansen, L. A. Nolte, M. M. Chen and J. O. Holloszy (1998). "Rapid
reversal of adaptive increases in muscle GLUT-4 and glucose transport capacity
after training cessation." Journal of Applied Physiology 84(3): 798-802.
Hou, J. C., D. Williams, J. Vicogne and J. E. Pessin (2009). "The glucose transporter
2 undergoes plasma membrane endocytosis and lysosomal degradation in a
Houmard, J. A., P. C. Egan, P. D. Neufer, J. E. Friedman, W. S. Wheeler, R. G. Israel and G. L. Dohm (1991). "Elevated skeletal muscle glucose transporter levels in
Bibliography
� ���
exercise-trained middle-aged men." American Journal of Physiology 261(4 Pt 1):
E437-443.
Huang, D. W., B. T. Sherman and R. A. Lempicki (2008). "Systematic and integrative
analysis of large gene lists using DAVID bioinformatics resources." Nature
Protocols 4(1): 44-57.
Huang, S. and M. P. Czech (2007). "The GLUT4 glucose transporter." Cell metabolism
5(4): 237-252.
Hughes, S. D., C. Quaade, J. H. Johnson, S. Ferber and C. B. Newgard (1993). "Transfection of AtT-20ins cells with GLUT-2 but not GLUT-1 confers glucose-
stimulated insulin secretion. Relationship to glucose metabolism." Journal of
Biological Chemistry 268(20): 15205-15212.
Illsley, N. P. (2000). "Glucose transporters in the human placenta." Placenta 21(1): 14-
22.
Ishihara, H., T. Asano, K. Tsukuda, H. Katagiri, K. Inukai, M. Anai, M. Kikuchi, Y. Yazaki, J. I. Miyazaki and Y. Oka (1993). "Pancreatic beta cell line MIN6 exhibits
characteristics of glucose metabolism and glucose-stimulated insulin secretion
similar to those of normal islets." Diabetologia 36(11): 1139-1145.
Ishiki, M. and A. Klip (2005). "Minireview: recent developments in the regulation of
glucose transporter-4 traffic: new signals, locations, and partners." Endocrinology
146(12): 5071-5078.
James, D. E., R. Brown, J. Navarro and P. F. Pilch (1988). "Insulin-regulatable tissues
express a unique insulin-sensitive glucose transport protein." Nature 333(6169):
183-185.
Jensen, P. J., J. D. Gitlin and M. O. Carayannopoulos (2006). "GLUT1 deficiency
links nutrient availability and apoptosis during embryonic development." Journal
of Biological Chemistry 281(19): 13382-13387.
Johnson, J. H., C. B. Newgard, J. L. Milburn, H. F. Lodish and B. Thorens (1990). "The high Km glucose transporter of islets of Langerhans is functionally similar to
the low affinity transporter of liver and has an identical primary sequence."
Journal of Biological Chemistry 265(12): 6548-6551.
Bibliography
����
Joost, H. G., G. I. Bell, J. D. Best, M. J. Birnbaum, M. J. Charron, Y. T. Chen, H.
Doege, D. E. James, H. F. Lodish, K. H. Moley, J. F. Moley, M. Mueckler, S. Rogers, A. Schurmann, S. Seino and B. Thorens (2002). "Nomenclature of the
GLUT/SLC2A family of sugar/polyol transport facilitators." American Journal of
Physiology - Endocrinology and Metabolism 282(4): E974-976.
Joost, H. G. and B. Thorens (2001). "The extended GLUT-family of sugar/polyol
transport facilitators: nomenclature, sequence characteristics, and potential
function of its novel members (review)." Molecular Membrane Biology 18(4): 247-
256.
Kaestner, K. H., R. J. Christy and M. D. Lane (1990). "Mouse insulin-responsive
glucose transporter gene: characterization of the gene and trans-activation by the
CCAAT/enhancer binding protein." Proceedings of the National Academy of
Sciences of the United States of America 87(1): 251-255.
Kaestner, K. H., R. J. Christy, J. C. McLenithan, L. T. Braiterman, P. Cornelius, P. H. Pekala and M. D. Lane (1989). "Sequence, tissue distribution, and differential
expression of mRNA for a putative insulin-responsive glucose transporter in
mouse 3T3-L1 adipocytes." Proceedings of the National Academy of Sciences of
the United States of America 86(9): 3150-3154.
Kahn, B. B. (1996). "Lilly lecture 1995. Glucose transport: pivotal step in insulin action."
Diabetes 45(11): 1644-1654.
Kajimura, S., K. Aida and C. Duan (2005). "Insulin-like growth factor-binding protein-1
(IGFBP-1) mediates hypoxia-induced embryonic growth and developmental
retardation." Proceedings of the National Academy of Sciences of the United
States of America 102(4): 1240-1245.
Kang, L., V. H. Routh, E. V. Kuzhikandathil, L. D. Gaspers and B. E. Levin (2004). "Physiological and molecular characteristics of rat hypothalamic ventromedial
Kani, S., Y. K. Bae, T. Shimizu, K. Tanabe, C. Satou, M. J. Parsons, E. Scott, S. Higashijima and M. Hibi (2010). "Proneural gene-linked neurogenesis in
Khayat, Z. A., N. Patel and A. Klip (2002). "Exercise- and insulin-stimulated muscle
glucose transport: distinct mechanisms of regulation." Canadian journal of applied
physiology 27(2): 129-151.
Kimmel, C. B., W. W. Ballard, S. R. Kimmel, B. Ullmann and T. F. Schilling (1995). "Stages of embryonic development of the zebrafish." Developmental Dynamics
203(3): 253-310.
Kliewer, S. A., J. M. Lenhard, T. M. Willson, I. Patel, D. C. Morris and J. M. Lehmann (1995). "A prostaglandin J2 metabolite binds peroxisome proliferator-
activated receptor gamma and promotes adipocyte differentiation." Cell 83(5):
813-819.
Knight, J. B., C. A. Eyster, B. A. Griesel and A. L. Olson (2003). "Regulation of the
human GLUT4 gene promoter: interaction between a transcriptional activator and
Bibliography
����
myocyte enhancer factor 2A." Proceedings of the National Academy of Sciences
of the United States of America 100(25): 14725-14730.
Koivisto, U. M., H. Martinez-Valdez, P. J. Bilan, E. Burdett, T. Ramlal and A. Klip (1991). "Differential regulation of the GLUT-1 and GLUT-4 glucose transport
systems by glucose and insulin in L6 muscle cells in culture." Journal of Biological
Chemistry 266(4): 2615-2621.
Kong, X., J. Manchester, S. Salmons and J. C. Lawrence, Jr. (1994). "Glucose
transporters in single skeletal muscle fibers. Relationship to hexokinase and
regulation by contractile activity." Journal of Biological Chemistry 269(17): 12963-
12967.
Krasnov, A., H. Teerijoki and H. Molsa (2001). "Rainbow trout (Onchorhynchus
mykiss) hepatic glucose transporter." Biochimica et Biophysica Acta 1520(2):
174-178.
Kurth-Kraczek, E. J., M. F. Hirshman, L. J. Goodyear and W. W. Winder (1999). "5'
AMP-activated protein kinase activation causes GLUT4 translocation in skeletal
muscle." Diabetes 48(8): 1667-1671.
Kusari, J., U. S. Verma, J. B. Buse, R. R. Henry and J. M. Olefsky (1991). "Analysis
of the gene sequences of the insulin receptor and the insulin-sensitive glucose
transporter (GLUT-4) in patients with common-type non-insulin-dependent
diabetes mellitus." Journal of Clinical Investigation 88(4): 1323-1330.
Larance, M., G. Ramm and D. E. James (2008). "The GLUT4 code." Molecular
Endocrinology 22(2): 226-233.
Lauritzen, H. P. and J. D. Schertzer (2010). "Measuring GLUT4 translocation in mature
muscle fibers." American journal of physiology. Endocrinology and Metabolism
299(2): E169-179.
Laybutt, D. R., A. Sharma, D. C. Sgroi, J. Gaudet, S. Bonner-Weir and G. C. Weir
(2002). "Genetic regulation of metabolic pathways in beta-cells disrupted by
hyperglycemia." Journal of Biological Chemistry 277(13): 10912-10921.
Leloup, C., M. Arluison, N. Lepetit, N. Cartier, P. Marfaing-Jallat, P. Ferre and L. Penicaud (1994). "Glucose transporter 2 (GLUT 2): expression in specific brain
nuclei." Brain Research 638(1-2): 221-226.
Bibliography
� ���
Leturque, A., E. Brot-Laroche, M. Le Gall, E. Stolarczyk and V. Tobin (2005). "The
role of GLUT2 in dietary sugar handling." Journal of Physiology and Biochemistry
61(4): 529-537.
Levin, B. E. (2000). "Glucose-regulated dopamine release from substantia nigra
neurons." Brain Research 874(2): 158-164.
Li, B., X. Xi, D. S. Roane, D. H. Ryan and R. J. Martin (2003). "Distribution of
peptide-1 receptor and neuropeptide Y messenger RNAs in rat brain by
quantitative real time RT-PCR." Molecular brain research 113(1-2): 139-142.
Li, L.-C. and R. Dahiya (2002). "MethPrimer: designing primers for methylation PCRs."
Bioinformatics 18(11): 1427-1431.
Lima, G. A., G. F. Anhe, G. Giannocco, M. T. Nunes, M. L. Correa-Giannella and U. F. Machado (2009). "Contractile activity per se induces transcriptional activation
of SLC2A4 gene in soleus muscle: involvement of MEF2D, HIF-1a, and TRalpha
transcriptional factors." American Journal of Physiology - Endocrinology and
Metabolism 296(1): E132-138.
Liu, M. L., A. L. Olson, N. P. Edgington, W. S. Moye-Rowley and J. E. Pessin (1994).
"Myocyte enhancer factor 2 (MEF2) binding site is essential for C2C12 myotube-
specific expression of the rat GLUT4/muscle-adipose facilitative glucose
transporter gene." Journal of Biological Chemistry 269(45): 28514-28521.
Liu, M. L., A. L. Olson, W. S. Moye-Rowley, J. B. Buse, G. I. Bell and J. E. Pessin
(1992). "Expression and regulation of the human GLUT4/muscle-fat facilitative
glucose transporter gene in transgenic mice." Journal of Biological Chemistry
267(17): 11673-11676.
Lowery, L. A. and H. Sive (2005). "Initial formation of zebrafish brain ventricles occurs
independently of circulation and requires the nagie oko and snakehead/atp1a1a.1
gene products." Development 132(9): 2057-2067.
MacFarlane, W. M., M. L. Read, M. Gilligan, I. Bujalska and K. Docherty (1994). "Glucose modulates the binding activity of the beta-cell transcription factor IUF1
in a phosphorylation-dependent manner." Biochemical Journal 303 ( Pt 2): 625-
631.
Bibliography
����
MacLean, P. S., D. Zheng, J. P. Jones, A. L. Olson and G. L. Dohm (2002).
"Exercise-induced transcription of the muscle glucose transporter (GLUT 4)
gene." Biochemical and Biophysical Research Communications 292(2): 409-414.
Macleod, D., J. Charlton, J. Mullins and A. P. Bird (1994). "Sp1 sites in the mouse
aprt gene promoter are required to prevent methylation of the CpG island." Genes
& Development 8(19): 2282-2292.
Magnoni, L. J., Y. Vraskou, A. P. Palstra and J. V. Planas (2012). "AMP-activated
protein kinase plays an important evolutionary conserved role in the regulation of
glucose metabolism in fish skeletal muscle cells." PLoS ONE 7(2): e31219.
Marks, J., N. J. Carvou, E. S. Debnam, S. K. Srai and R. J. Unwin (2003). "Diabetes
increases facilitative glucose uptake and GLUT2 expression at the rat proximal
tubule brush border membrane." Journal of Physiology 553(Pt 1): 137-145.
Marotta, M., R. Bragos and A. M. Gomez-Foix (2004). "Design and performance of an
electrical stimulator for long-term contraction of cultured muscle cells."
Biotechniques 36(1): 68-73.
Marshak, S., H. Totary, E. Cerasi and D. Melloul (1996). "Purification of the beta-cell
glucose-sensitive factor that transactivates the insulin gene differentially in normal
and transformed islet cells." Proceedings of the National Academy of Sciences of
the United States of America 93(26): 15057-15062.
Marty, N., M. Dallaporta, M. Foretz, M. Emery, D. Tarussio, I. Bady, C. Binnert, F. Beermann and B. Thorens (2005). "Regulation of glucagon secretion by glucose
transporter type 2 (glut2) and astrocyte-dependent glucose sensors." Journal of
Clinical Investigation 115(12): 3545-3553.
Marty, N., M. Dallaporta and B. Thorens (2007). "Brain glucose sensing,
counterregulation, and energy homeostasis." Physiology 22: 241-251.
Matschinsky, F. M. (2002). "Regulation of pancreatic beta-cell glucokinase: from basics
to therapeutics." Diabetes 51 Suppl 3: S394-404.
McCall, A. L., A. M. Van Bueren, M. Moholt-Siebert, N. J. Cherry and W. R. Woodward (1994). "Immunohistochemical localization of the neuron-specific
glucose transporter (GLUT3) to neuropil in adult rat brain." Brain Research 659(1-
2): 292-297.
Bibliography
� ���
Merrill, G. F., E. J. Kurth, D. G. Hardie and W. W. Winder (1997). "AICA riboside
increases AMP-activated protein kinase, fatty acid oxidation, and glucose uptake
in rat muscle." American Journal of Physiology 273(6 Pt 1): E1107-1112.
Miyata, T., T. Maeda and J. E. Lee (1999). "NeuroD is required for differentiation of the
granule cells in the cerebellum and hippocampus." Genes & Development 13(13):
1647-1652.
Miyazaki, J., K. Araki, E. Yamato, H. Ikegami, T. Asano, Y. Shibasaki, Y. Oka and K. Yamamura (1990). "Establishment of a pancreatic beta cell line that retains
glucose-inducible insulin secretion: special reference to expression of glucose
Mueckler, M. (1994). "Facilitative glucose transporters." FEBS Journal 219(3): 713-725.
Neufer, P. D., J. O. Carey and G. L. Dohm (1993). "Transcriptional regulation of the
gene for glucose transporter GLUT4 in skeletal muscle. Effects of diabetes and
fasting." Journal of Biological Chemistry 268(19): 13824-13829.
Nishimura, H., F. V. Pallardo, G. A. Seidner, S. Vannucci, I. A. Simpson and M. J. Birnbaum (1993). "Kinetics of GLUT1 and GLUT4 glucose transporters
expressed in Xenopus oocytes." Journal of Biological Chemistry 268(12): 8514-
8520.
Nualart, F., A. Godoy and K. Reinicke (1999). "Expression of the hexose transporters
GLUT1 and GLUT2 during the early development of the human brain." Brain
Research 824(1): 97-104.
Bibliography
����
Ober, E. A., H. A. Field and D. Y. Stainier (2003). "From endoderm formation to liver
and pancreas development in zebrafish." Mechanisms of Development 120(1): 5-
18.
Ohtsubo, K., S. Takamatsu, M. T. Minowa, A. Yoshida, M. Takeuchi and J. D. Marth (2005). "Dietary and genetic control of glucose transporter 2 glycosylation
promotes insulin secretion in suppressing diabetes." Cell 123(7): 1307-1321.
Olefsky, J. M. and A. R. Saltiel (2000). "PPAR gamma and the treatment of insulin
resistance." Trends in Endocrinology and Metabolism 11(9): 362-368.
Olson, A. L. and J. E. Pessin (1995). "Transcriptional regulation of the human GLUT4
gene promoter in diabetic transgenic mice." Journal of Biological Chemistry
270(40): 23491-23495.
Orci, L., B. Thorens, M. Ravazzola and H. F. Lodish (1989). "Localization of the
pancreatic beta cell glucose transporter to specific plasma membrane domains."
Science 245(4915): 295-297.
Ovcharenko, I., G. G. Loots, R. C. Hardison, W. Miller and L. Stubbs (2004). "zPicture: Dynamic alignment and visualization tool for analyzing conservation
profiles." Genome Research 14(3): 472-477.
Panserat, S., E. Plagnes-Juan and S. Kaushik (2001). "Nutritional regulation and
tissue specificity of gene expression for proteins involved in hepatic glucose
metabolism in rainbow trout (Oncorhynchus mykiss)." Journal of Experimental
Biology 204(Pt 13): 2351-2360.
Pao, S. S., I. T. Paulsen and M. H. Saier, Jr. (1998). "Major facilitator superfamily."
Microbiology and Molecular Biology Reviews 62(1): 1-34.
Pereira, L. O. and A. H. Lancha, Jr. (2004). "Effect of insulin and contraction up on
glucose transport in skeletal muscle." Progress in Biophysics and Molecular
Biology 84(1): 1-27.
Petersen, S., M. Bahr and J. Eckel (1995). "Insulin-dependent regulation of Glut4 gene
expression in ventricular cardiomyocytes: evidence for a direct effect on Glut4
transcription." Biochemical and Biophysical Research Communications 213(2):
533-540.
Bibliography
� ���
Planas, J. V., E. Capilla and J. Gutierrez (2000). "Molecular identification of a glucose
transporter from fish muscle." FEBS letters 481(3): 266-270.
Ploug, T., B. M. Stallknecht, O. Pedersen, B. B. Kahn, T. Ohkuwa, J. Vinten and H. Galbo (1990). "Effect of endurance training on glucose transport capacity and
glucose transporter expression in rat skeletal muscle." American Journal of
Physiology 259(6 Pt 1): E778-786.
Polakof, S., J. M. Miguez, T. W. Moon and J. L. Soengas (2007). "Evidence for the
presence of a glucosensor in hypothalamus, hindbrain, and Brockmann bodies of
rainbow trout." American Journal of Physiology - Regulatory, Integrative and
Comparative Physiology 292(4): R1657-1666.
Polakof, S., S. Skiba-Cassy, G. Choubert and S. Panserat (2010). "Insulin-induced
hypoglycaemia is co-ordinately regulated by liver and muscle during acute and
chronic insulin stimulation in rainbow trout (Oncorhynchus mykiss)." Journal of
Experimental Biology 213(Pt 9): 1443-1452.
Postic, C., R. Dentin, P. D. Denechaud and J. Girard (2007). "ChREBP, a
transcriptional regulator of glucose and lipid metabolism." Annual Review of
Nutrition 27: 179-192.
Postic, C., A. Leturque, F. Rencurel, R. L. Printz, C. Forest, D. K. Granner and J. Girard (1993). "The effects of hyperinsulinemia and hyperglycemia on GLUT4
and hexokinase II mRNA and protein in rat skeletal muscle and adipose tissue."
Diabetes 42(6): 922-929.
Quandt, K., K. Frech, H. Karas, E. Wingender and T. Werner (1995). "Matlnd and
Matlnspector: new fast and versatile tools for detection of consensus matches in
nucleotide sequence data." Nucleic Acids Research 23(23): 4878-4884.
Ramos, S., L. Goya, C. Alvarez, M. A. Martin, M. Agote, F. Escriva and A. M. Pascual-Leone (2001). "Different role of insulin in GLUT-1 and -4 regulation in
heart and skeletal muscle during perinatal hypothyroidism." American Journal of
Physiology - Endocrinology and Metabolism 281(5): E1073-1081.
Rayner, D. V., M. E. Thomas and P. Trayhurn (1994). "Glucose transporters (GLUTs
1-4) and their mRNAs in regions of the rat brain: insulin-sensitive transporter
Bibliography
����
expression in the cerebellum." Canadian Journal of Physiology and
Pharmacology 72(5): 476-479.
Reimer, M. K. and B. Ahren (2002). "Altered beta-cell distribution of pdx-1 and GLUT-2
after a short-term challenge with a high-fat diet in C57BL/6J mice." Diabetes 51
Suppl 1: S138-143.
Ren, J. M., C. F. Semenkovich, E. A. Gulve, J. Gao and J. O. Holloszy (1994). "Exercise induces rapid increases in GLUT4 expression, glucose transport
capacity, and insulin-stimulated glycogen storage in muscle." Journal of Biological
Chemistry 269(20): 14396-14401.
Richardson, J. M. and J. E. Pessin (1993). "Identification of a skeletal muscle-specific
regulatory domain in the rat GLUT4/muscle-fat gene." Journal of Biological
Chemistry 268(28): 21021-21027.
Rodaway, A., H. Takeda, S. Koshida, J. Broadbent, B. Price, J. C. Smith, R. Patient
and N. Holder (1999). "Induction of the mesendoderm in the zebrafish germ ring
by yolk cell-derived TGF-beta family signals and discrimination of mesoderm and
endoderm by FGF." Development 126(14): 3067-3078.
Roe, J. A., A. S. Baba, J. M. Harper and P. J. Buttery (1995). "Effects of growth
factors and gut regulatory peptides on nutrient uptake in ovine muscle cell
cultures." Comparative Biochemistry and Physiology - Part A: Molecular &
Integrative Physiology 110(2): 107-114. Roncero, I., E. Alvarez, J. A. Chowen, C. Sanz, A. Rabano, P. Vazquez and E.
Blazquez (2004). "Expression of glucose transporter isoform GLUT-2 and
glucokinase genes in human brain." Journal of Neurochemistry 88(5): 1203-1210.
Royer, C., J. Lachuer, G. Crouzoulon, J. Roux, J. Peyronnet, J. Mamet, J. Pequignot and Y. Dalmaz (2000). "Effects of gestational hypoxia on mRNA
levels of Glut3 and Glut4 transporters, hypoxia inducible factor-1 and thyroid
hormone receptors in developing rat brain." Brain Research 856(1-2): 119-128.
Rumsey, S. C., R. Daruwala, H. Al-Hasani, M. J. Zarnowski, I. A. Simpson and M. Levine (2000). "Dehydroascorbic acid transport by GLUT4 in Xenopus oocytes
and isolated rat adipocytes." The Journal of Biological Chemistry 275(36): 28246-
28253.
Bibliography
� ���
Saltiel, A. R. and J. E. Pessin (2002). "Insulin signaling pathways in time and space."
Trends in Cell Biology 12(2): 65-71.
Sanno, H., C. M. Lamy, L. Shields, J. Y. Chatton and B. Thorens (2011). "Molecular
and functional characterization of GLUT2-expressing glucose responsive neurons
in the nucleus od tractus solitarious". In "Glucose Transporters, Signaling and
Diabetes" FASEB Conference. Snomass Village, Colorado, August, 2011.
Sarabia, V., L. Lam, E. Burdett, L. A. Leiter and A. Klip (1992). "Glucose transport in
human skeletal muscle cells in culture. Stimulation by insulin and metformin."
Journal of Clinical Investigation 90(4): 1386-1395.
Scheepers, A., H. G. Joost and A. Schurmann (2004). "The glucose transporter
families SGLT and GLUT: molecular basis of normal and aberrant function."
Journal of Parenteral and Enteral Nutrition 28(5): 364-371.
Schlegel, A. and D. Y. Stainier (2007). "Lessons from "lower" organisms: what worms,
flies, and zebrafish can teach us about human energy metabolism." PLoS
Genetics 3(11): e199.
Schoonjans, K., G. Martin, B. Staels and J. Auwerx (1997). "Peroxisome proliferator-
activated receptors, orphans with ligands and functions." Current Opinion in
Lipidology 8(3): 159-166.
Scorrano, L. and S. J. Korsmeyer (2003). "Mechanisms of cytochrome c release by
proapoptotic BCL-2 family members." Biochemical and Biophysical Research
Communications 304(3): 437-444.
Shepherd, P. R., G. W. Gould, C. A. Colville, S. C. McCoid, E. M. Gibbs and B. B. Kahn (1992). "Distribution of GLUT3 glucose transporter protein in human
tissues." Biochemical and Biophysical Research Communications 188(1): 149-
154.
Shepherd, P. R. and B. B. Kahn (1999). "Glucose transporters and insulin action--
implications for insulin resistance and diabetes mellitus." New England Journal of
Medicine 341(4): 248-257.
Silva, J. L., G. Giannocco, D. T. Furuya, G. A. Lima, P. A. Moraes, S. Nachef, S. Bordin, L. R. Britto, M. T. Nunes and U. F. Machado (2005). "NF-kappaB,
MEF2A, MEF2D and HIF1-a involvement on insulin- and contraction-induced
Bibliography
����
regulation of GLUT4 gene expression in soleus muscle." Molecular and Cellular
Endocrinology 240(1-2): 82-93.
Slentz, C. A., E. A. Gulve, K. J. Rodnick, E. J. Henriksen, J. H. Youn and J. O. Holloszy (1992). "Glucose transporters and maximal transport are increased in
endurance-trained rat soleus." Journal of applied physiology 73(2): 486-492.
Stockhammer, O. W., A. Zakrzewska, Z. Hegedus, H. P. Spaink and A. H. Meijer (2009). "Transcriptome profiling and functional analyses of the zebrafish
embryonic innate immune response to Salmonella infection." Journal of
Immunology 182(9): 5641-5653.
Stolarczyk, E., M. Le Gall, P. Even, A. Houllier, P. Serradas, E. Brot-Laroche and A. Leturque (2007). "Loss of sugar detection by GLUT2 affects glucose
homeostasis in mice." PLoS ONE 2(12): e1288.
Teerijoki, H., A. Krasnov, T. I. Pitkanen and H. Molsa (2000). "Cloning and
characterization of glucose transporter in teleost fish rainbow trout
(Oncorhynchus mykiss)." Biochimica et Biophysica Acta 1494(3): 290-294.
Teerijoki, H., A. Krasnov, T. I. Pitkanen and H. Molsa (2001). "Monosaccharide
uptake in common carp (Cyprinus carpio) EPC cells is mediated by a facilitative
glucose carrier." Comparative Biochemistry and Physiology - Part B: Biochemistry
& Molecular Biology 128(3): 483-491.
Terova, G., S. Rimoldi, F. Brambilla, R. Gornati, G. Bernardini and M. Saroglia (2009). "In vivo regulation of GLUT2 mRNA in sea bass (Dicentrarchus labrax) in
response to acute and chronic hypoxia." Comparative Biochemistry and
Physiology - Part B: Biochemistry & Molecular Biology 152(4): 306-316.
Thai, M. V., S. Guruswamy, K. T. Cao, J. E. Pessin and A. L. Olson (1998). "Myocyte
enhancer factor 2 (MEF2)-binding site is required for GLUT4 gene expression in
transgenic mice. Regulation of MEF2 DNA binding activity in insulin-deficient
diabetes." Journal of Biological Chemistry 273(23): 14285-14292.
Thisse, C. and B. Thisse (1999). "Antivin, a novel and divergent member of the
TGFbeta superfamily, negatively regulates mesoderm induction." Development
126(2): 229-240.
Bibliography
� ���
Thisse, C. and B. Thisse (2008). "High-resolution in situ hybridization to whole-mount
zebrafish embryos." Nature Protocols 3(1): 59-69.
Thorens, B. (1992). "Molecular and cellular physiology of GLUT-2, a high-Km facilitated
diffusion glucose transporter." International Review of Cytology 137: 209-238.
Thorens, B. (1996). "Glucose transporters in the regulation of intestinal, renal, and liver
glucose fluxes." American Journal of Physiology 270(4 Pt 1): G541-553.
Thorens, B. (2011). "Of fat, beta cells, and diabetes." Cell Metabolism 14(4): 439-440.
Thorens, B., Z. Q. Cheng, D. Brown and H. F. Lodish (1990). "Liver glucose
transporter: a basolateral protein in hepatocytes and intestine and kidney cells."
American Journal of Physiology 259(6 Pt 1): C279-285.
Thorens, B., M. T. Guillam, F. Beermann, R. Burcelin and M. Jaquet (2000). "Transgenic reexpression of GLUT1 or GLUT2 in pancreatic beta cells rescues
GLUT2-null mice from early death and restores normal glucose-stimulated insulin
secretion." Journal of Biological Chemistry 275(31): 23751-23758.
Thorens, B. and M. Mueckler (2010). "Glucose transporters in the 21st Century."
American Journal of Physiology - Endocrinology and Metabolism 298(2): E141-
145.
Thorens, B., H. K. Sarkar, H. R. Kaback and H. F. Lodish (1988). "Cloning and
functional expression in bacteria of a novel glucose transporter present in liver,
intestine, kidney, and beta-pancreatic islet cells." Cell 55(2): 281-290.
Tiso, N., E. Moro and F. Argenton (2009). "Zebrafish pancreas development."
Molecular and Cellular Endocrinology 312(1-2): 24-30.
Tobin, V., M. Le Gall, X. Fioramonti, E. Stolarczyk, A. G. Blazquez, C. Klein, M. Prigent, P. Serradas, M. H. Cuif, C. Magnan, A. Leturque and E. Brot-Laroche (2008). "Insulin internalizes GLUT2 in the enterocytes of healthy but not
insulin-resistant mice." Diabetes 57(3): 555-562.
Tucker, B. and M. Lardelli (2007). "A rapid apoptosis assay measuring relative acridine
orange fluorescence in zebrafish embryos." Zebrafish 4(2): 113-116.
Uldry, M., M. Ibberson, M. Hosokawa and B. Thorens (2002). "GLUT2 is a high
Valera, A., G. Solanes, J. Fernandez-Alvarez, A. Pujol, J. Ferrer, G. Asins, R.
Gomis and F. Bosch (1994). "Expression of GLUT-2 antisense RNA in beta cells
of transgenic mice leads to diabetes." Journal of Biological Chemistry 269(46):
28543-28546.
Valverde, A. M., M. Benito and M. Lorenzo (2005). "The brown adipose cell: a model
for understanding the molecular mechanisms of insulin resistance." Acta
Physiologica Scandinavica 183(1): 59-73.
Valverde, A. M., P. Navarro, T. Teruel, R. Conejo, M. Benito and M. Lorenzo (1999). "Insulin and insulin-like growth factor I up-regulate GLUT4 gene expression in
fetal brown adipocytes, in a phosphoinositide 3-kinase-dependent manner."
Biochemical Journal 337 ( Pt 3): 397-405.
van Soest, J. J., O. W. Stockhammer, A. Ordas, G. V. Bloemberg, H. P. Spaink and A. H. Meijer (2011). "Comparison of static immersion and intravenous injection
systems for exposure of zebrafish embryos to the natural pathogen Edwardsiella
tarda." BMC Immunology 12: 58.
Vraskou, Y., N. Roher, M. Diaz, C. N. Antonescu, S. A. MacKenzie and J. V. Planas (2011). "Direct involvement of tumor necrosis factor-α in the regulation of
glucose uptake in rainbow trout muscle cells." American Journal of Physiology -
Regulatory, Integrative and Comparative physiology 300(3): R716-723.
Wagner, P. D. (2001). "Skeletal muscle angiogenesis. A possible role for hypoxia."
Advances in Experimental Medicine and Biology 502: 21-38.
Wallace, K. N., S. Akhter, E. M. Smith, K. Lorent and M. Pack (2005). "Intestinal
growth and differentiation in zebrafish." Mechanisms of Development 122(2): 157-
173.
Wallace, K. N. and M. Pack (2003). "Unique and conserved aspects of gut
development in zebrafish." Developmental Biology 255(1): 12-29.
Bibliography
� ���
Wan, H. Z., M. G. Hulsey and R. J. Martin (1998). "Intracerebroventricular
administration of antisense oligodeoxynucleotide against GLUT2 glucose
transporter mRNA reduces food intake, body weight change and glucoprivic
feeding response in rats." Journal of Nutrition 128(2): 287-291.
Wang, M. Y., M. Y. Tsai and C. Wang (1994). "Identification of chicken liver glucose
transporter." Archives of Biochemistry and Biophysics 310(1): 172-179.
Wang, Z. V., J. Mu, T. D. Schraw, L. Gautron, J. K. Elmquist, B. B. Zhang, M. Brownlee and P. E. Scherer (2008). "PANIC-ATTAC: a mouse model for
inducible and reversible beta-cell ablation." Diabetes 57(8): 2137-2148.
Watson, R. T., M. Kanzaki and J. E. Pessin (2004). "Regulated membrane trafficking
of the insulin-responsive glucose transporter 4 in adipocytes." Endocrine Reviews
25(2): 177-204.
Watson, R. T. and J. E. Pessin (2006). "Bridging the GAP between insulin signaling
and GLUT4 translocation." Trends in Biochemical Sciences 31(4): 215-222.
Weinstein, S. P., E. O'Boyle and R. S. Haber (1994). "Thyroid hormone increases
basal and insulin-stimulated glucose transport in skeletal muscle. The role of
Westerfield, M. (2000). The zebrafish book : a guide for the laboratory use of zebrafish
(Danio rerio). Eugene, OR, M. Westerfield.
Whelan, J. A., N. B. Russell and M. A. Whelan (2003). "A method for the absolute
quantification of cDNA using real-time PCR." Journal of Immunological Methods
278(1-2): 261-269.
Wood, I. S. and P. Trayhurn (2003). "Glucose transporters (GLUT and SGLT):
expanded families of sugar transport proteins." British Journal of Nutrition 89(1):
3-9.
Wright, E. M. (2001). "Renal Na(+)-glucose cotransporters." American Journal of
Physiology. Renal physiology 280(1): F10-18.
Wright, E. M., M. G. Martin and E. Turk (2003). "Intestinal absorption in health and
disease sugars." Best Practice & Research: Clinical Gastroenterology 17(6): 943-
956.
Bibliography
����
Wu, X. and H. H. Freeze (2002). "GLUT14, a duplicon of GLUT3, is specifically
expressed in testis as alternative splice forms." Genomics 80(6): 553-557.
Yamashita, H., M. Takenoshita, M. Sakurai, R. K. Bruick, W. J. Henzel, W. Shillinglaw, D. Arnot and K. Uyeda (2001). "A glucose-responsive transcription
factor that regulates carbohydrate metabolism in the liver." Proceedings of the
National Academy of Sciences of the United States of America 98(16): 9116-
9121.
Yee, N. S., S. Yusuff and M. Pack (2001). "Zebrafish pdx1 morphant displays defects in
pancreas development and digestive organ chirality, and potentially identifies a
Zakrzewska, A., C. Cui, O. W. Stockhammer, E. L. Benard, H. P. Spaink and A. H. Meijer (2010). "Macrophage-specific gene functions in Spi1-directed innate
immunity." Blood 116(3): e1-11.
Zhao, F. Q. and A. F. Keating (2007). "Functional properties and genomics of glucose
transporters." Current Genomics 8(2): 113-128.
Zhu, J., F. He, S. Hu and J. Yu (2008). "On the nature of human housekeeping genes."
Trends in Genetics: 24(10): 481-484.
Zhu, W., D. Czyzyk, S. A. Paranjape, L. Zhou, A. Horblitt, G. Szabo, M. R. Seashore, R. S. Sherwin and O. Chan (2010). "Glucose prevents the fall in ventromedial
hypothalamic GABA that is required for full activation of glucose
counterregulatory responses during hypoglycemia." American Journal of
Physiology - Endocrinology and Metabolism 298(5): E971-977.
Zorzano, A., M. Palacin and A. Guma (2005). "Mechanisms regulating GLUT4 glucose
transporter expression and glucose transport in skeletal muscle." Acta
Physiologica Scandinavica 183(1): 43-58.
Zorzano, A., L. Sevilla, E. Tomas, A. Guma, M. Palacin and Y. Fischer (1997).
"GLUT4 trafficking in cardiac and skeletal muscle: isolation and characterization
of distinct intracellular GLUT4-containing vesicle populations." Biochemical


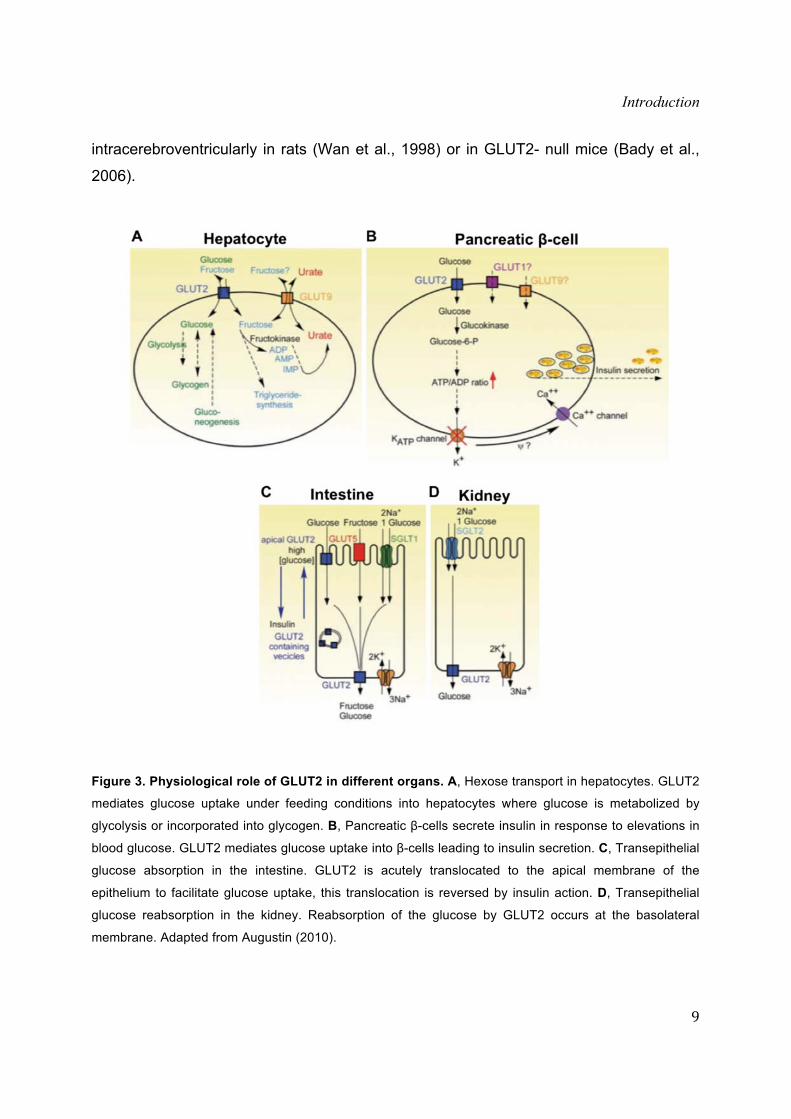


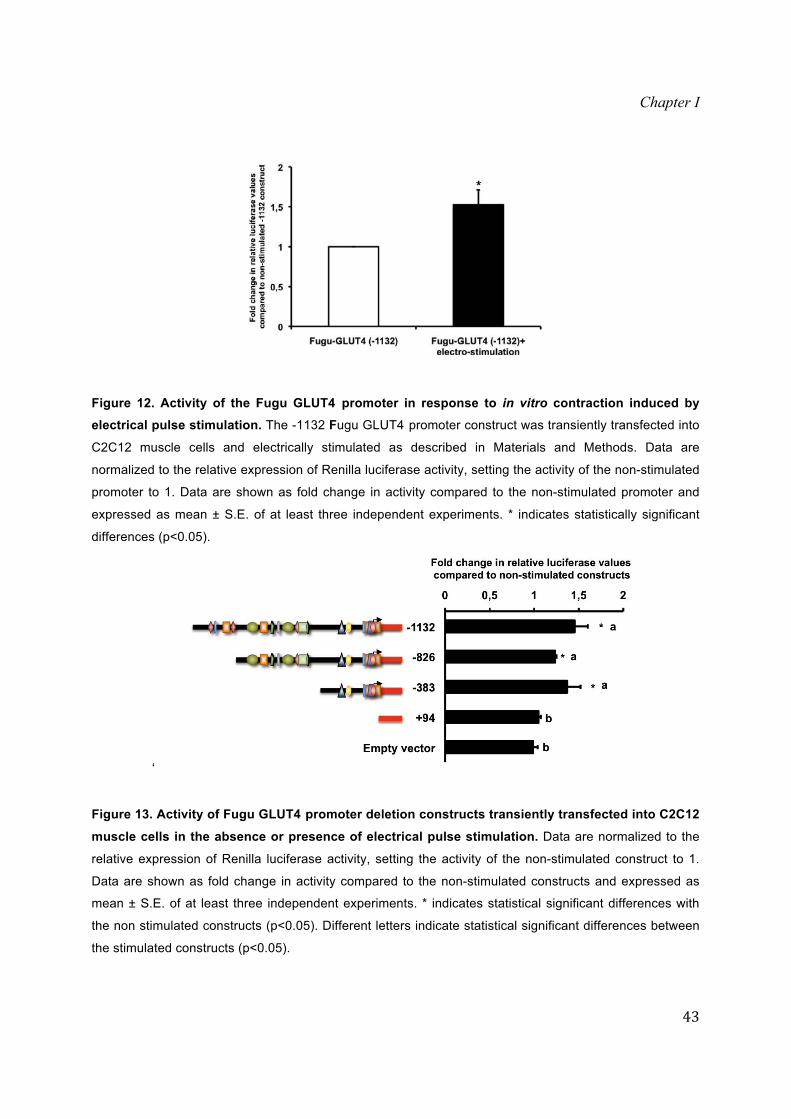


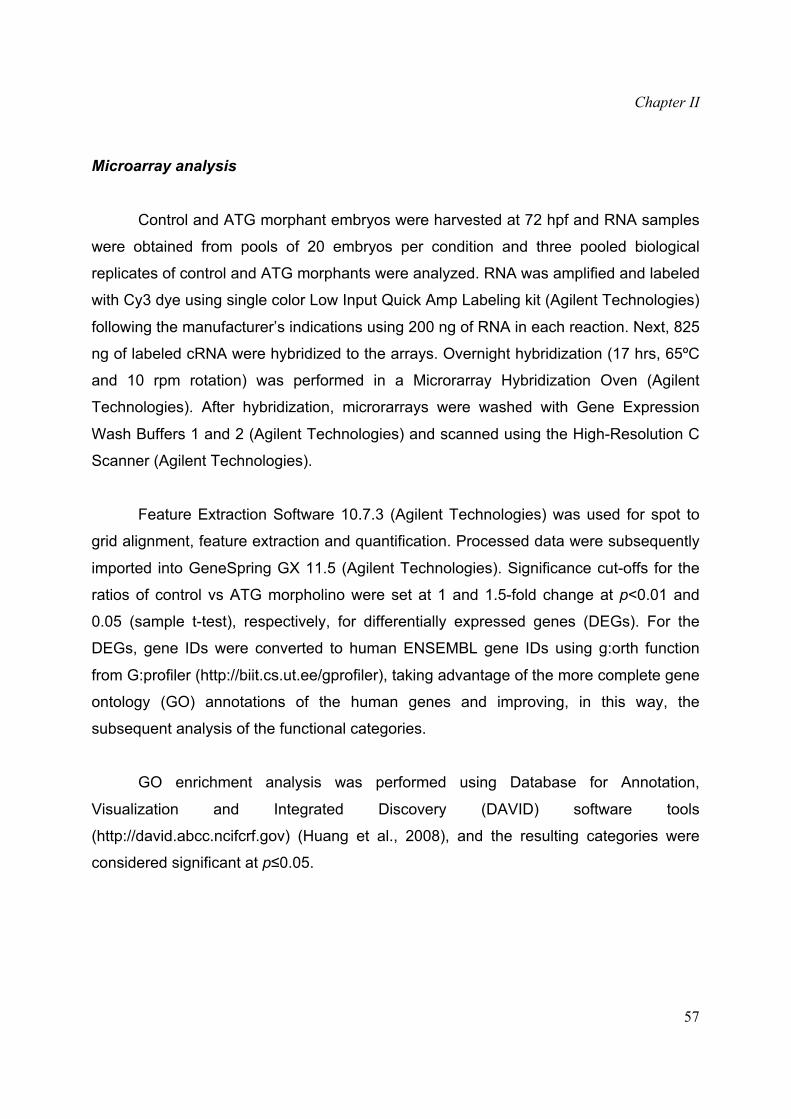


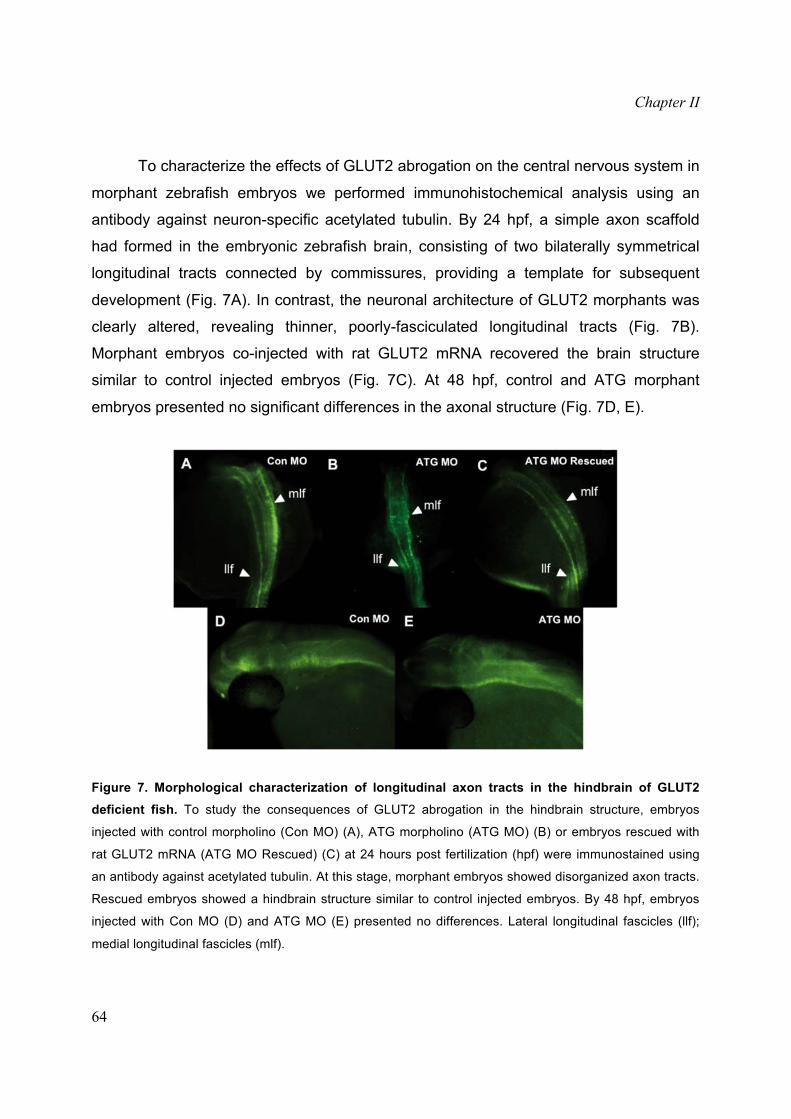


![Ions channels/transporters and chloroplast regulation · transporters/pumps and secondary transporters (according to the Transport Classification system [1]). Channels transport](https://static.documents.pub/doc/80x56/601623c1d6936b1074546c48/ions-channelstransporters-and-chloroplast-transporterspumps-and-secondary-transporters.jpg)


