Studies on the Phenotypes of Mycobacterium tuberculosis in Sputum Abdulwahab Binjomah Thesis submitted to The University of Leicester for the Degree of Doctor of Philosophy December 2013 Department of Infection, Immunity and Inflammation College of Medicine, Biological Sciences and Psychology University of Leicester University Road, Leicester, LE1 7
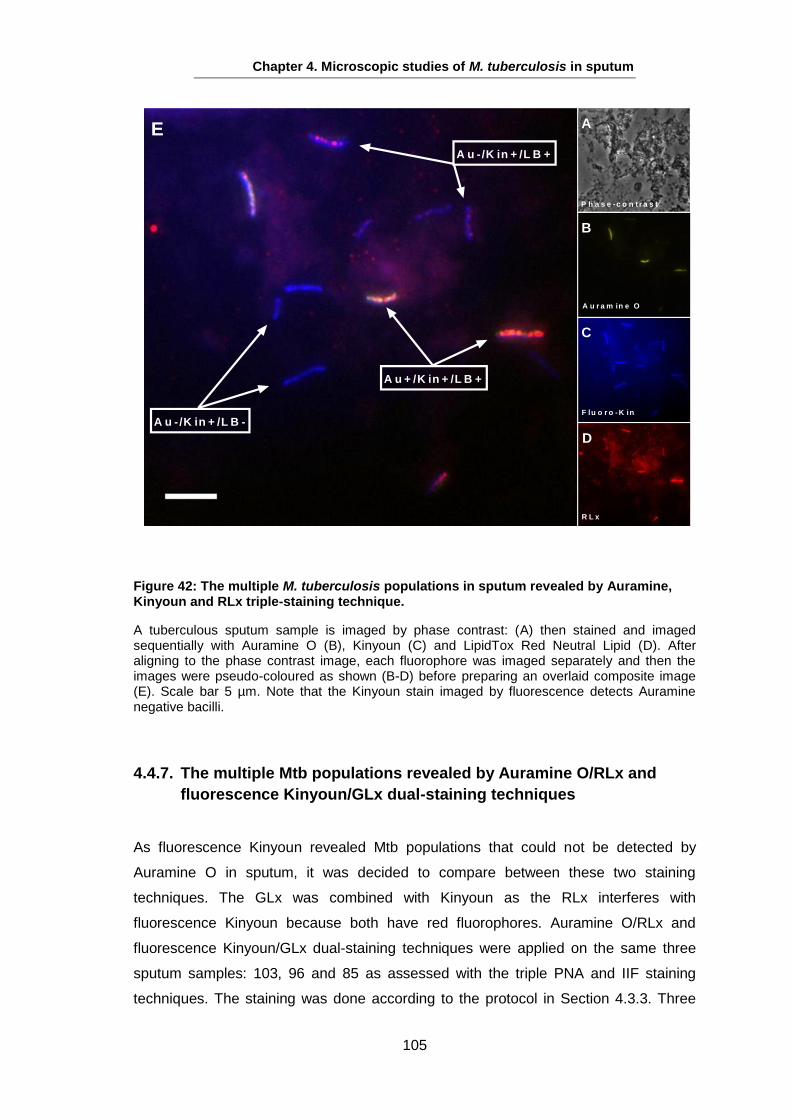
Transcript
Studies on the Phenotypes of
Mycobacterium tuberculosis
in Sputum
Abdulwahab Binjomah
Thesis submitted to The University of Leicester for the
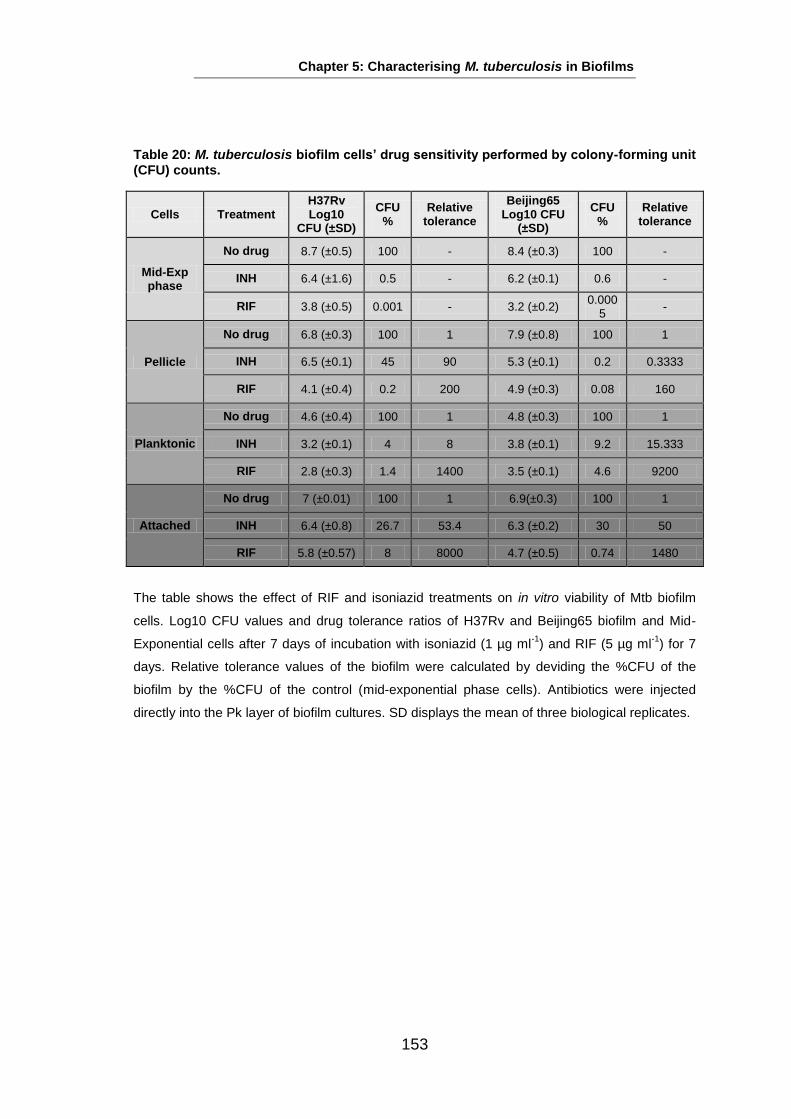
Degree of Doctor of Philosophy
December 2013
Department of Infection, Immunity and Inflammation College of Medicine, Biological Sciences and
Psychology University of Leicester
University Road, Leicester, LE1 7
i
Abstract
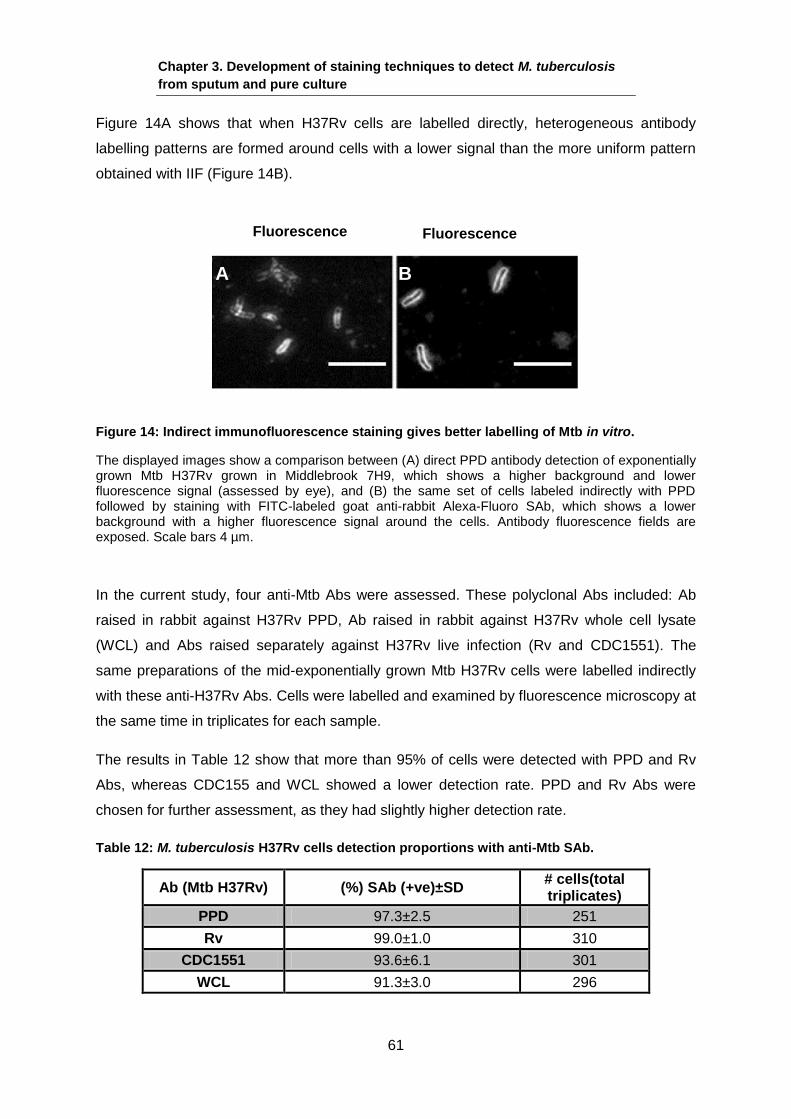
Transcriptional, cytological and culture-based analyses of Mycobacterium
tuberculosis (Mtb) in sputum have revealed multiple traits indicating the presence of a
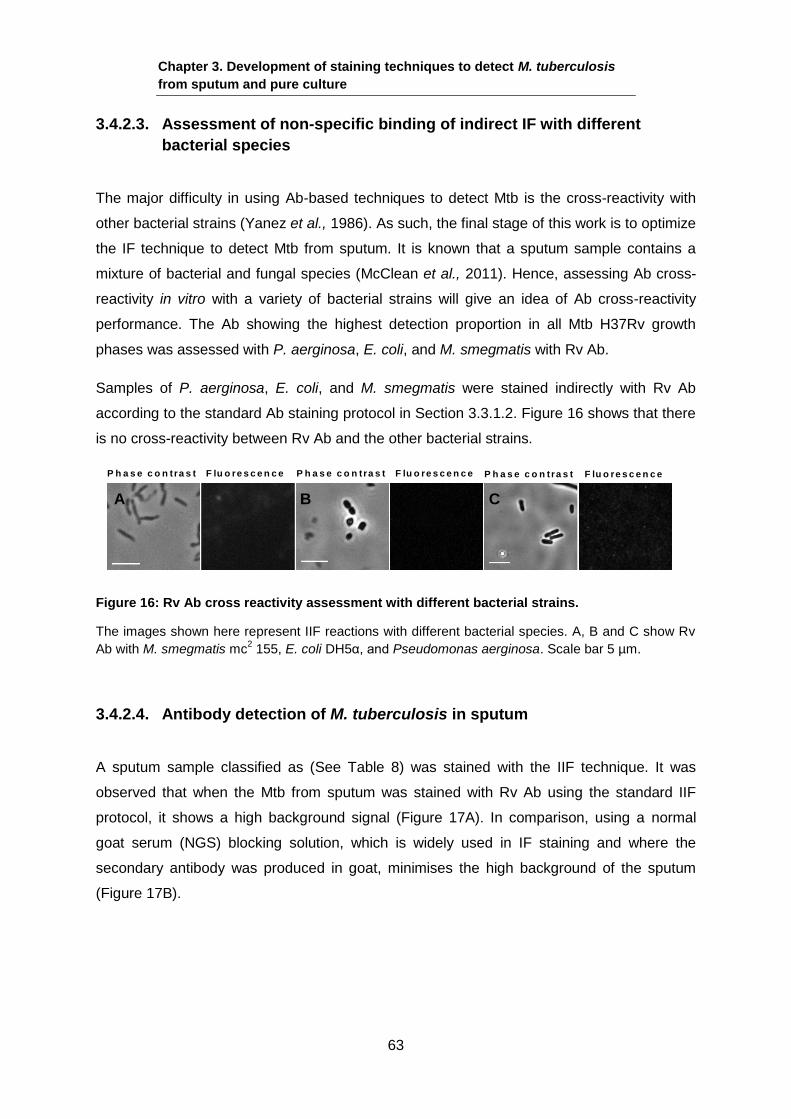
persister-like or dormant mycobacterial population. Between patients, variable
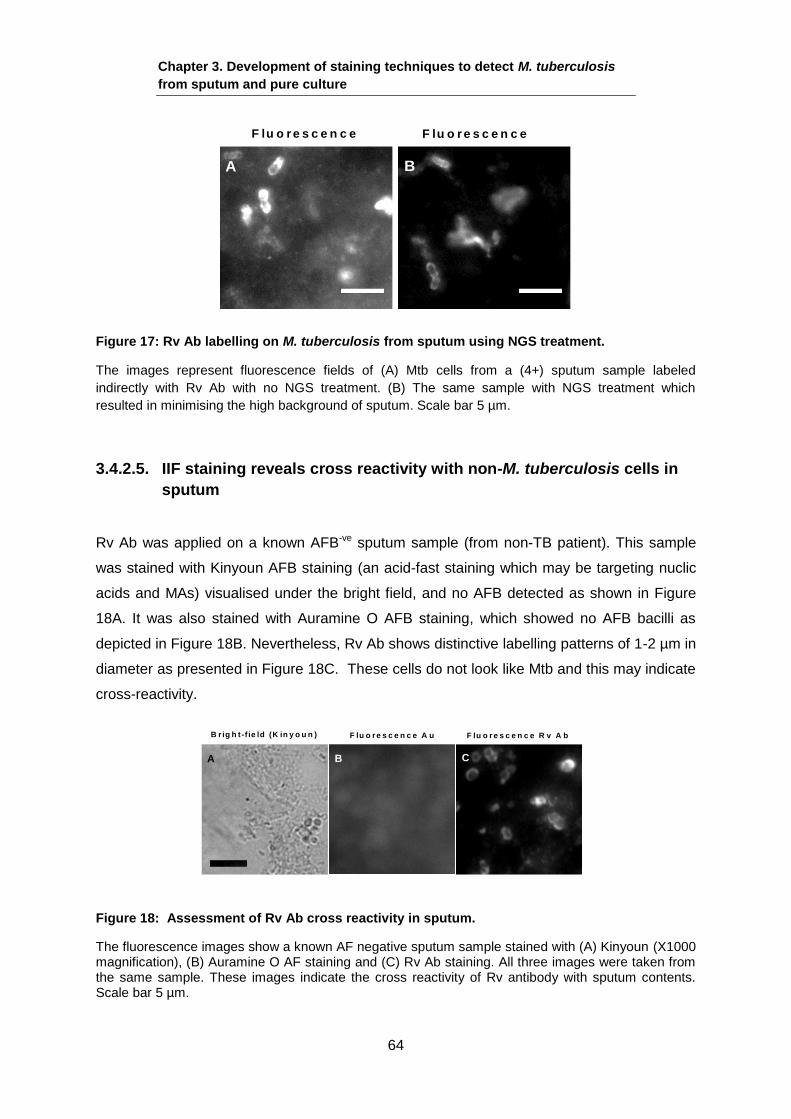
proportions of bacilli in sputum appear to be slow or non-growing, contain lipid bodies
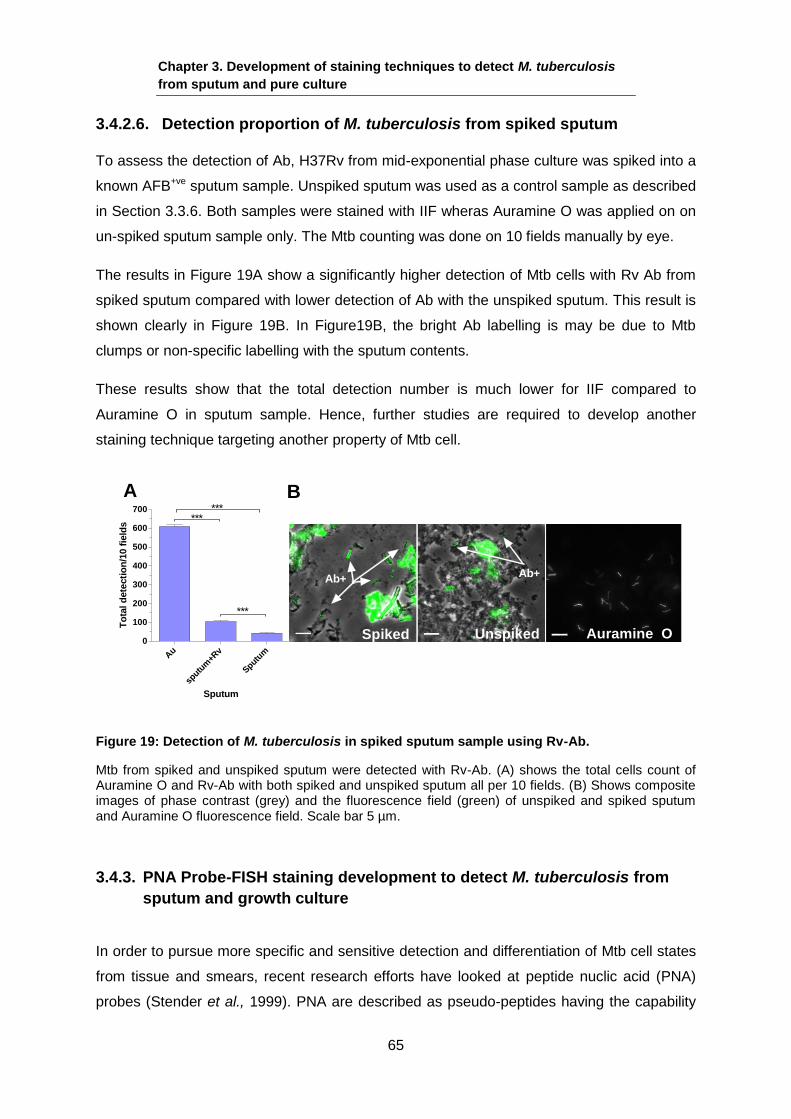
(LBs) and depend on exogenous Resuscitation promoting factors for growth. More
recently by using Auramine O/Nile-red staining the presence of non-acid-fast (NAF)
Mtb-like bacilli containing abundant LBs has been noted. Based on these findings, Mtb
in sputum may present in multiple populations and express distinctive transmission
adapted phenotypes. Identifying these phenotypes and replicating them in in vitro
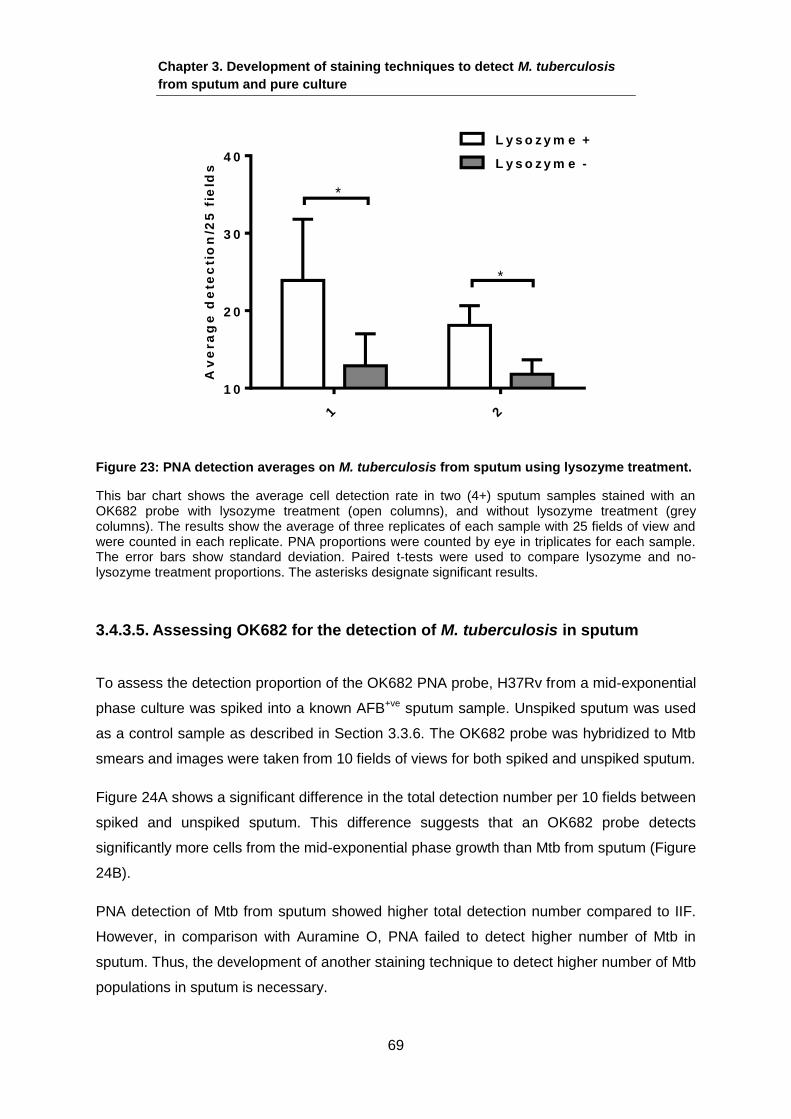
settings may lead to important new understanding of Mtb in vivo.
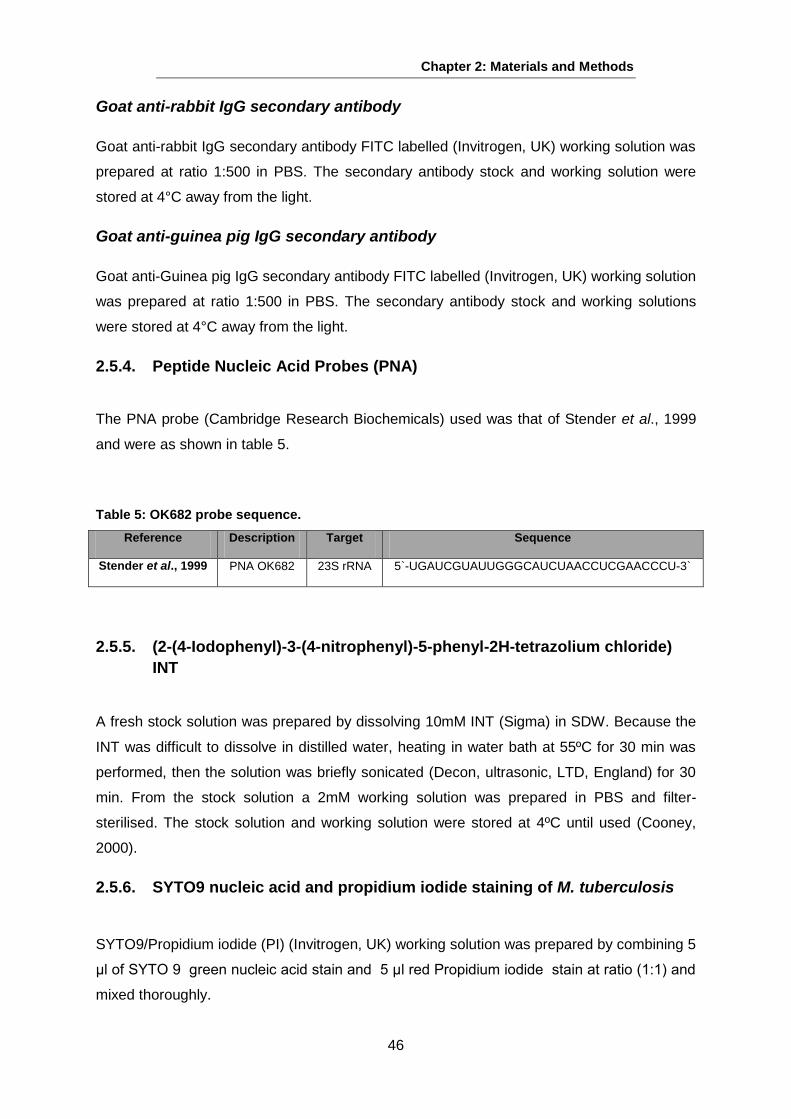
To study the suspected NAF Mtb cells in sputum, immunofluorescence (IF), peptide
nucleic acid (PNA) probe and fluorescence Kinyoun methods were developed and
studied. The IF and PNA methods detected only minor components of sputum and
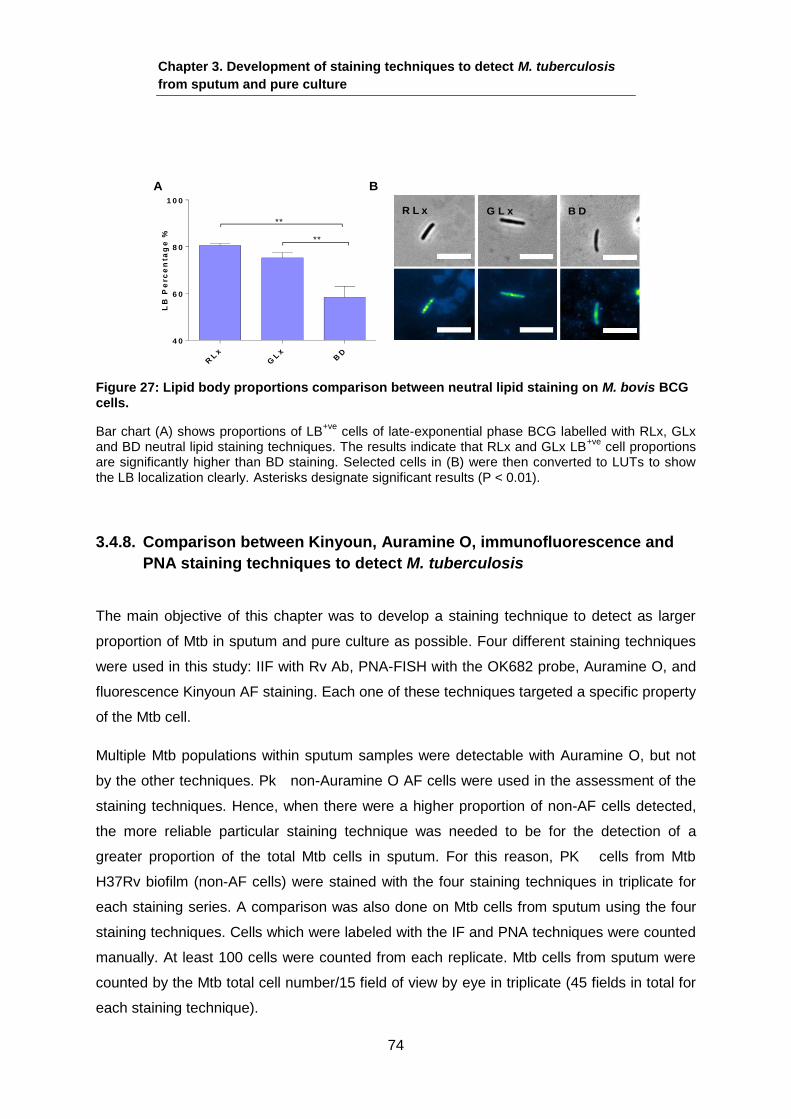
variable proportions of in vitro grown cells. Various conditions such as freeze thawing,
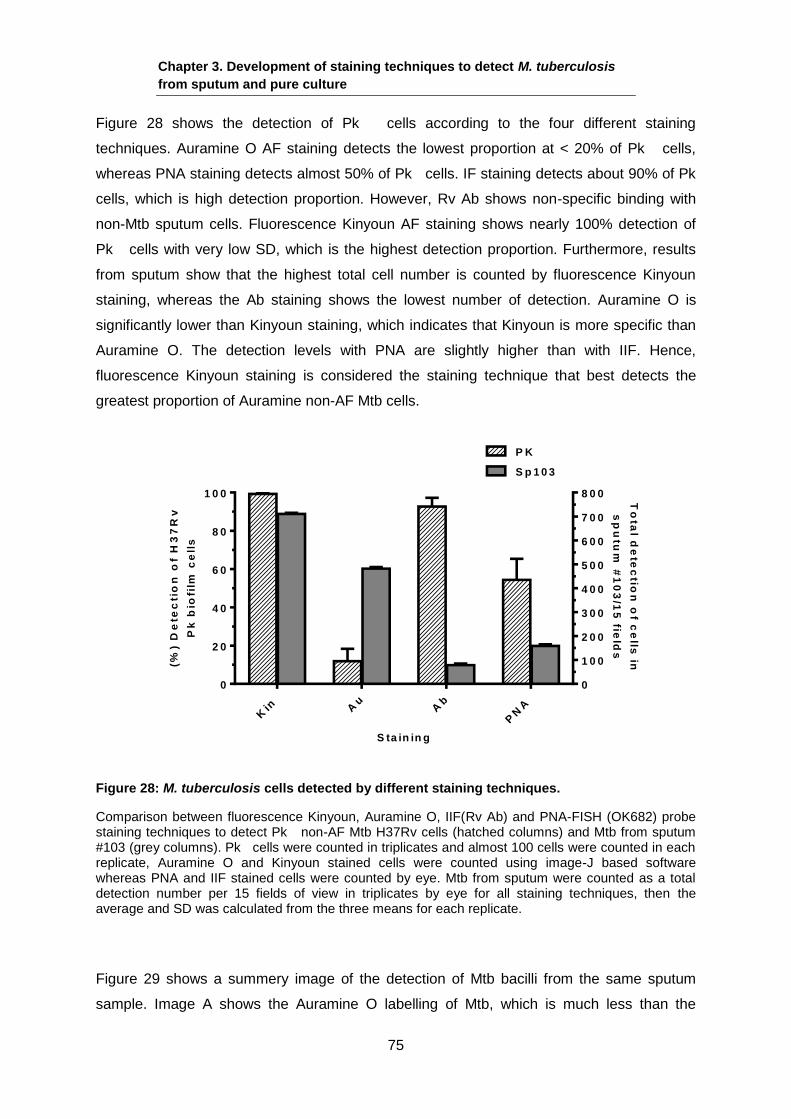
growth phase and biofilm cultures were shown to alter Auramine NAF proportions. In
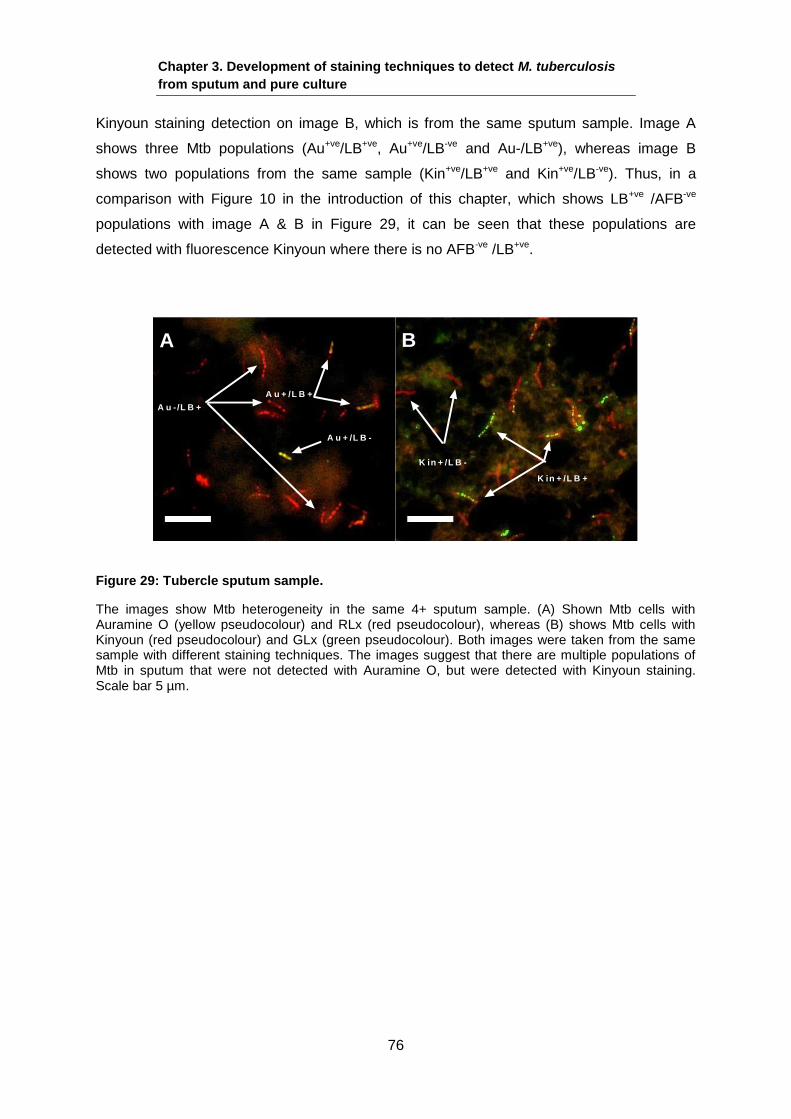
contrast the fluorescence Kinyoun method labelled the majority of Mtb cells in the
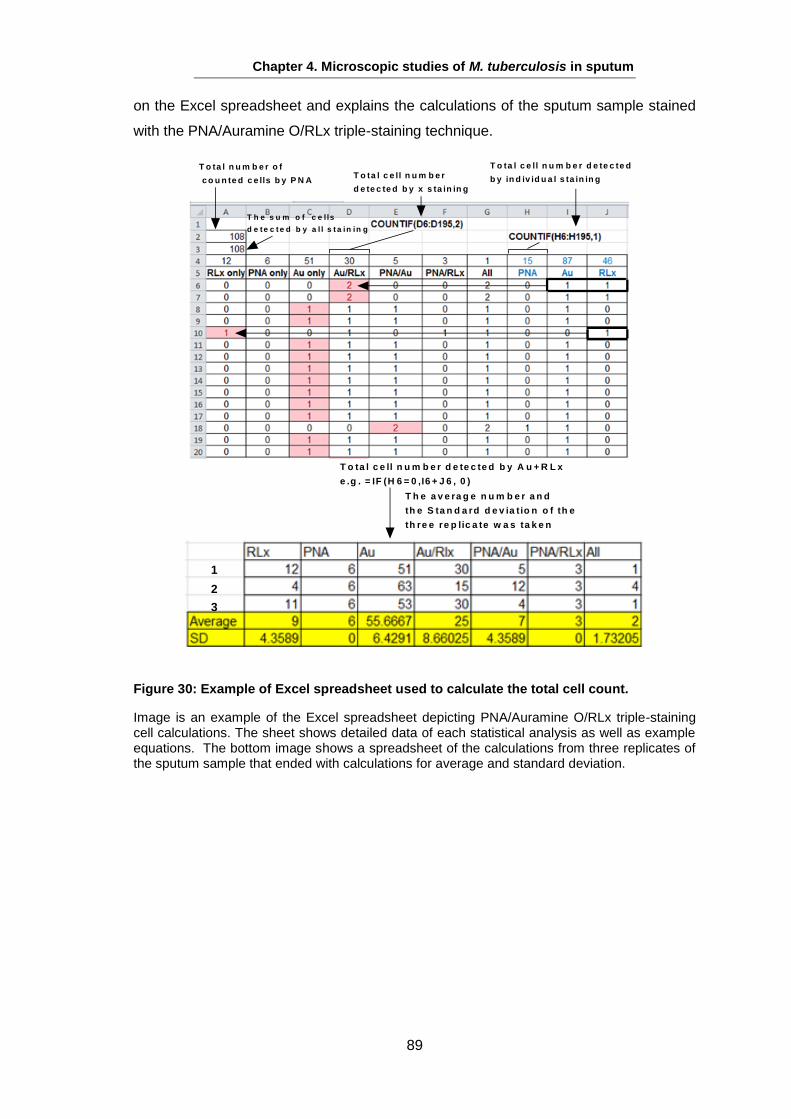
preparations studied and provides a promising method for future studies when
combined with a suitable LB stain.
The capacity of biofilm cultures to replicate the Mtb bacillary populations in sputum
was studied. Three phases of biofilm cultures (pellicle, planktonic and attached layers)
were studied for gene expression, cytological, growth, antibiotic tolerance and 3H-uracil
labelling properties comparable to the Mtb phenotypes seen in sputum. The three
layers replicated to differing degrees the sputum phenotypes including LB and NAF
content, and modest Rpf-dependancy. Attached and planktonic cells gave well
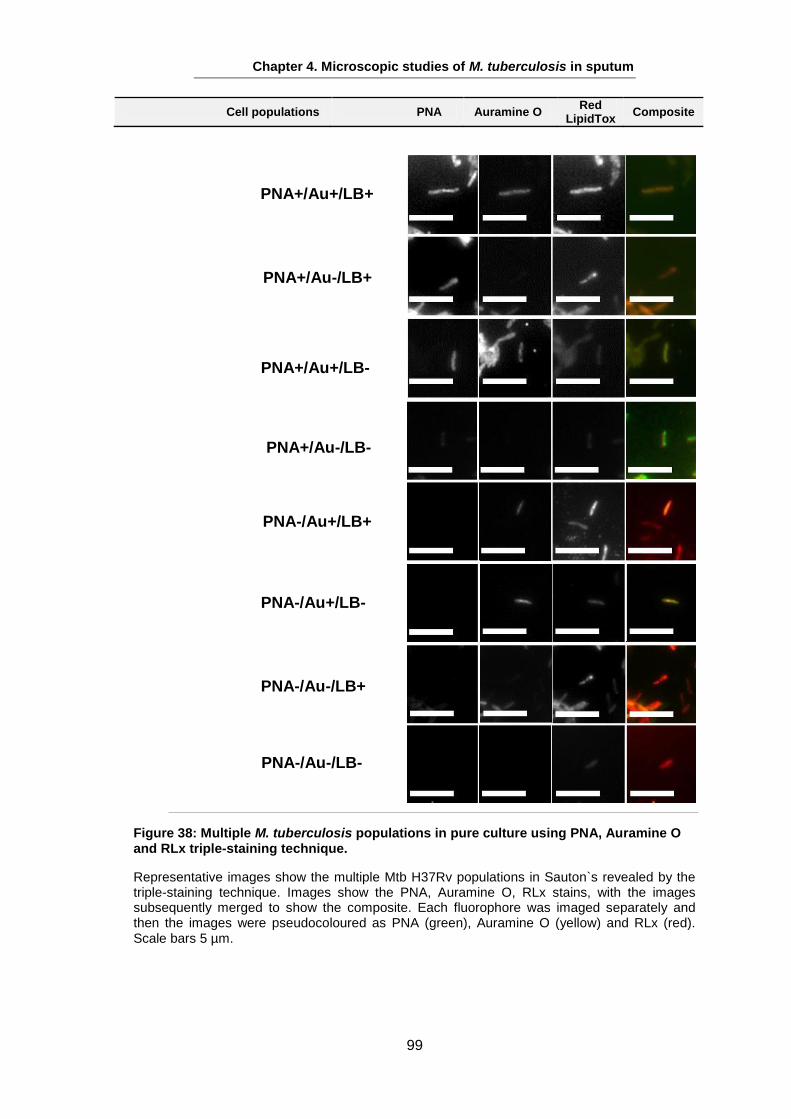
correlated transcriptional patterns. Overall, it appears plausible that biofilm grown cells
in patient’s lungs could contribute to the populations seen in sputum.
ii
Acknowledgment
I am extremely grateful for the support I have received from my parents past years and
always. First and foremost, I would like to acknowledge my supervisor Professor Mike
Barer for his immeasurable great effort, encouragement and support. Thank you for
your patient guidance, sincere advice and the very useful critiques throughout the
years of study. This PhD was funded by the Saudi Ministry of Health, to whom I am
very grateful.
Many thanks are owed to Dr Natalie Garton for her help and knowledge throughout my
PhD and proofreading my thesis. To Dr Galina Mukamolova and Dr Obolbek Turapov
for their guidance and support in the Rpf knowledge and work. I am also grateful to
Professor Peter Andrew and Dr. Helen O`Hare who assisted on my progress review
panel, for providing me with useful feedbacks which have been valuable to my project.
I would like to thank Dr Su-Min Lee for his help in the RNA work, Dr Andrew Bell for his
valuable assistance in microscopy, Gosia for her assistance in Cat 3 work; and
members of labs 136 and 213 for support, ideas and friendship, and to the department
support staff.
The biggest thanks go to my family who supported and motivated me during my
group comprises Mtb, M. africanum, M. canetti, M. bovis, M. caprae, M. pinnipedii and
M. microti (Comas & Gagneux, 2009).
Members of MtbC are straight or curved rods occurring singly or in clumps. The size of
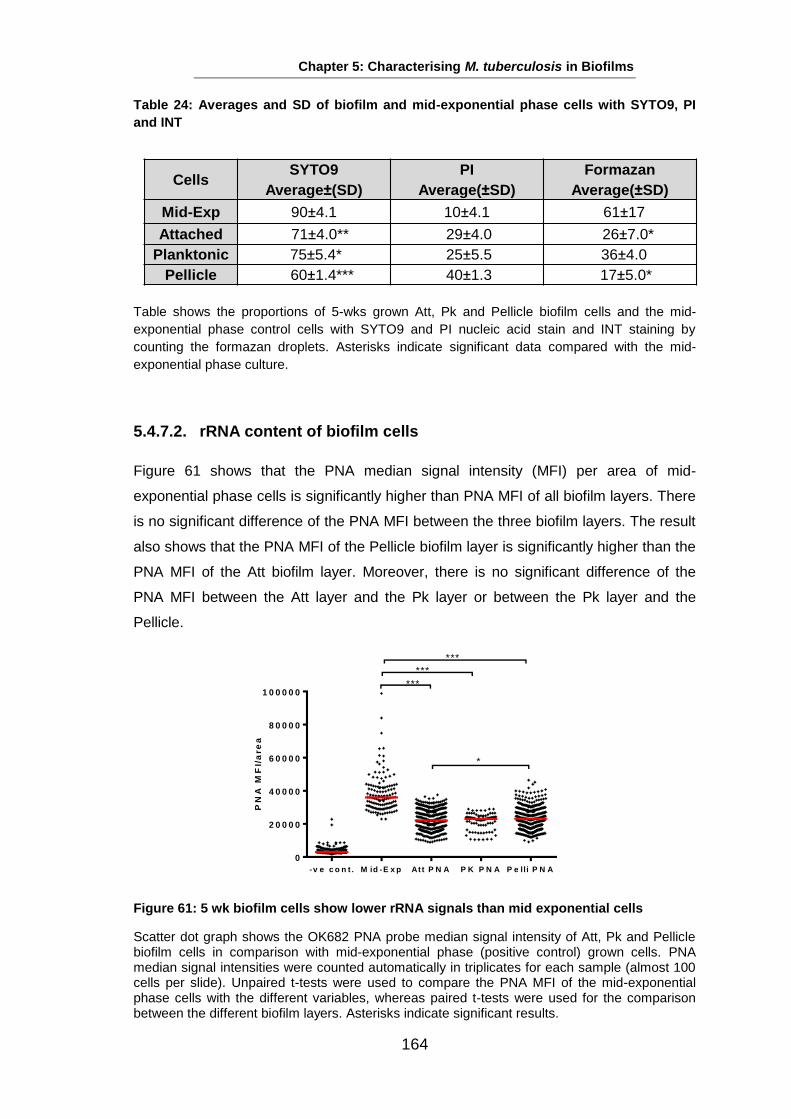
MtbC ranges from 0.3-0.6 x 1-4µm. They are strongly acid-fast (AF) under optimal
growth conditions (37°C, pH 6.4-7.0) and have a generation time of ~24h. In liquid
medium, growth tends to be in serpentine cords, with bacteria showing a parallel
orientation. On solid media, Mtb is characterised by formation into rough, raised and
thick colonies, with a nodular or wrinkled surface with irregular margins. These
colonies may become pigmented with white, buff or yellow colouration (Wayne and
Kubica, 1986).
1.2.2. Mycobacterium tuberculosis
The characteristic features of Mtb comprise its slow growing, acid-fastness, dormancy,
complex cell envelope, intracellular pathogenicity and genetic heterogeneity. The
replication time of Mtb is almost 24h in synthetic medium or infected animal models. All
of these features contribute to the chronic nature of the disease and elongate the
treatment period (Cole et al., 1998).
The Mtb H37Rv (laboratory strain) genome consists of 4.4 x 10⁶ bp and contains about
4,000 genes (Cole et al., 1998). Further, more than 200 Mtb genes are annotated as
encoding enzymes for fatty acids (FAs) metabolism, amounting to 6% of the total.
Interestingly, among these genes about 100 are predicted to function in the β-oxidation
of FAs, whereas in E.coli, there are only 50 enzymes involved in FA metabolism
(Smith, 2005). This large number of genes involved in FA metabolism may be due to
the ability of Mtb to grow in host`s tissue where FAs suggested to be the major carbon
source (Smith, 2005). Lipid and FA metabolisms are discussed in Section 1.3.
Chapter 1: Introduction
4
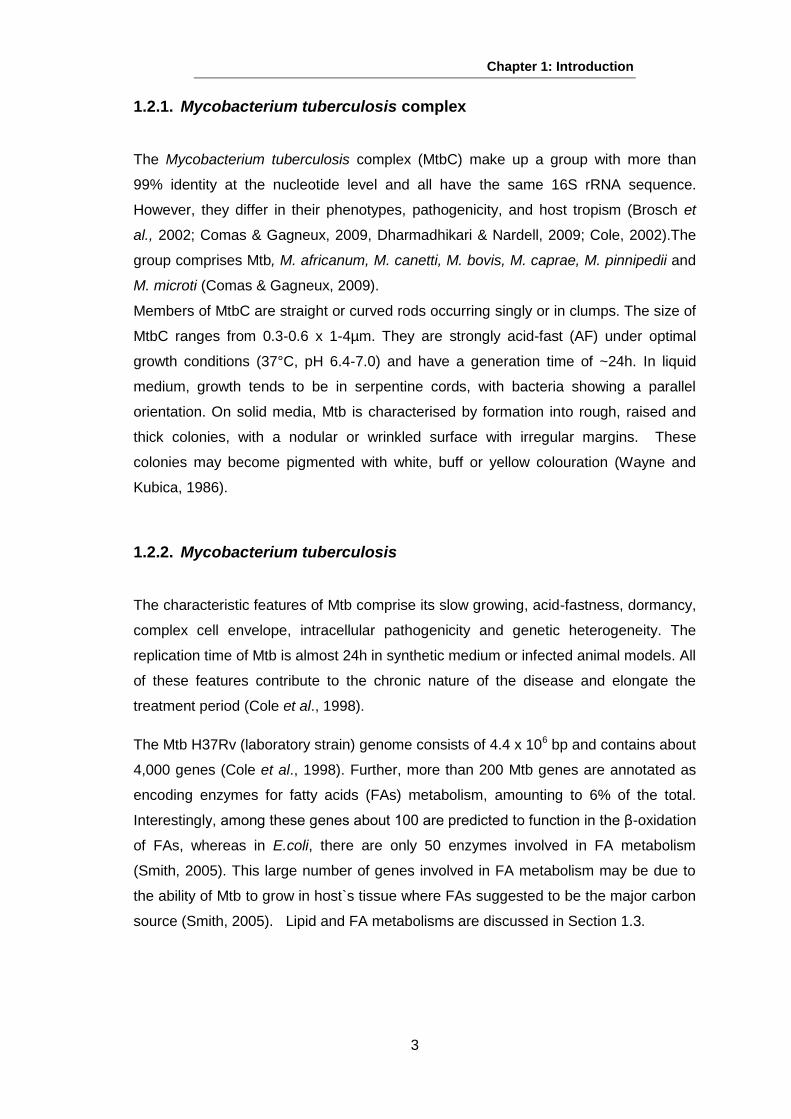
1.2.3. The mycobacterial cell envelope
Mycobacteria have a unique cell envelope structure that differs significantly from most
other bacterial species and shares some characteristics with both Gram-positive and
negative bacteria. It consists of three major layers: a plasma membrane, a complex of
PG and arabinogalactan (AG) covalently linked to MA and a polysaccharide rich
capsule (Crick et al., 2001). This complex forms the mycobacterium cell envelope core
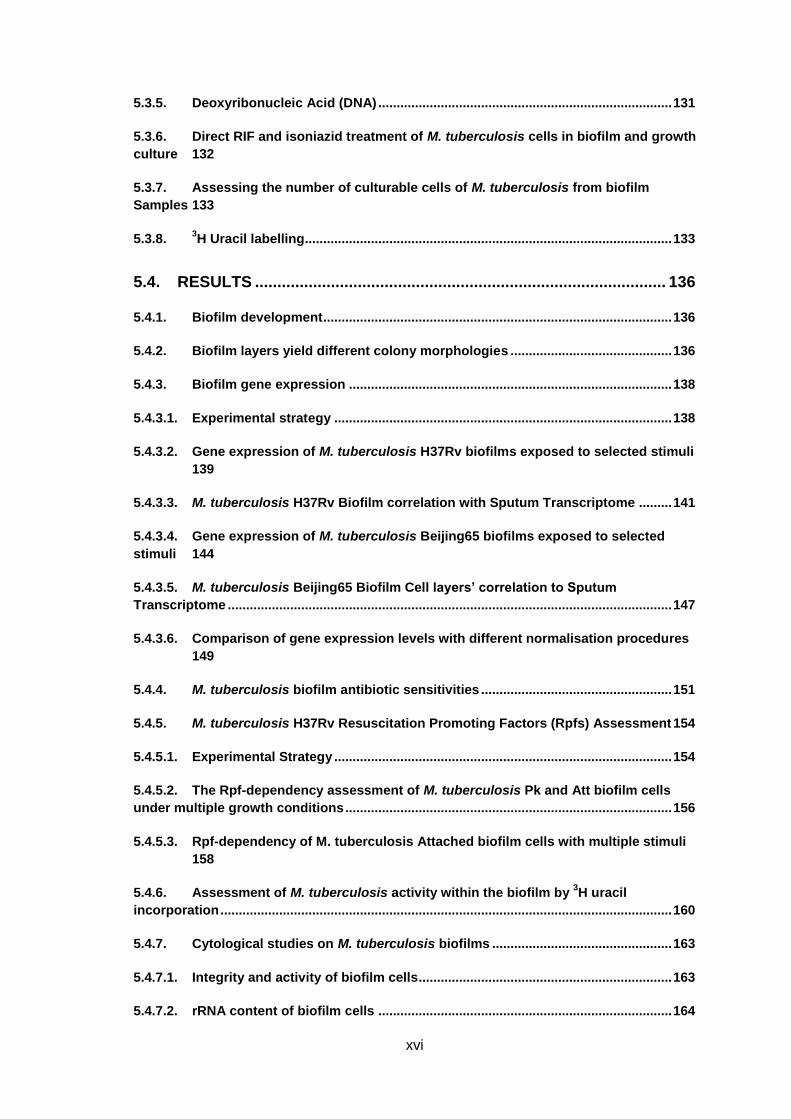
and is known as the mycolyl AG-PG (mAGP) complex (Brennan, 2003). Figure 1
shows the mycobacterial cell envelope components.
Capsule
Mycolic Acid Layer
Peptidoglycan
Arabinogalactan
Inner Membrane
8-1
0n
m
4n
m
Figure 1: The mycobacterial cell envelope.
The mycobacterial cell wall consists of a large cell wall complex which comprises three major and different covalently linked constructions: arabinogalactan (blue), peptidoglycan (grey) and mycolic acid (green). The outer layer is the capsule (brown), which contains polysaccharides such as glucan and arabinomannan. This 3D schematic diagram is modified from (Abdallah et al., 2007).
In more detail, the outer lipid layer consists of two major components, proteins and
free lipids which are non-covalently linked with the MA layer with long and short chain
fatty acids complementing the long and short chains of MAs (Hett & Rubin, 2008). The
cell envelope also contains glycoplipids (lipoarabinomannan (LAM), lipomannan, and
1990). Therefore, the low permeability of the Mtb cell wall gives it the ability to be
sensitive only to aminoglycosides, such as streptomycin and rifamycins among
antibiotics, and to fluoroquinolones among general chemotherapeutic agents.
Furthermore, it is difficult to prevent the transmission of Mtb in the general environment
because mycobacteria are comparatively resistant to alkali, drying, and many chemical
disinfectants (Brennan & Nikaido, 1995). Because MAs are acid labile, it has been
shown that prior treatment with acid may permeabilise the bacterial cell wall, which
allows the fluorescently labelled oligonucleotide probes to access the cell wall
(McNaughton et al., 1994).
MAs are present as tetramycolylpentaarabinofuranosyl clusters on the site of arabinan
of mycolylarabinogalactan. MAs also occur inside the outer layer in the form of cord-
factor which is the trehalose dimycolate (TDM) and trehalose monomycolate (TMM)
(Chatterjee, 1997). Cord-factor is significant as a toxic lipid (Hunter et al., 2006) that is
associated with Mtb cells growing in cord-like forms in vitro (Takayama et al., 2005).
Slow growing mycobacteria such as Mtb are able to modify their MAs by
cycloproponation, whilst fast-growing mycobacteria such as M. smegmatis do not
(Chatterjee, 1997).
Chapter 1: Introduction
6
MAs give the mycobacterial species unique characteristics including resistance to
chemical injury and dehydration, low access to hydrophilic chemotherapies and
virulence (Dubnau et al., 2000, Glickman et al., 2000, Glickman & Jacobs, 2001). They
also give the mycobacterial species their AF characteristic (Bhatt et al., 2007), which
will be discussed in detail in Section 1.4. MAs also play an important role in
mycobacterial biofilm formation (Ojha et al., 2005, Ojha et al., 2008, Sambandan et al.,
2013), which may help Mtb to persist within the host (Daffe & Draper, 1998, Bhatt et
al., 2007). Additionally, enzymes that are involved in mycolate biosynthesis are
considered as an ideal target for anti-mycobacterial therapies (Bhatt et al., 2007).
1.3. Lipid bodies in mycobacteria
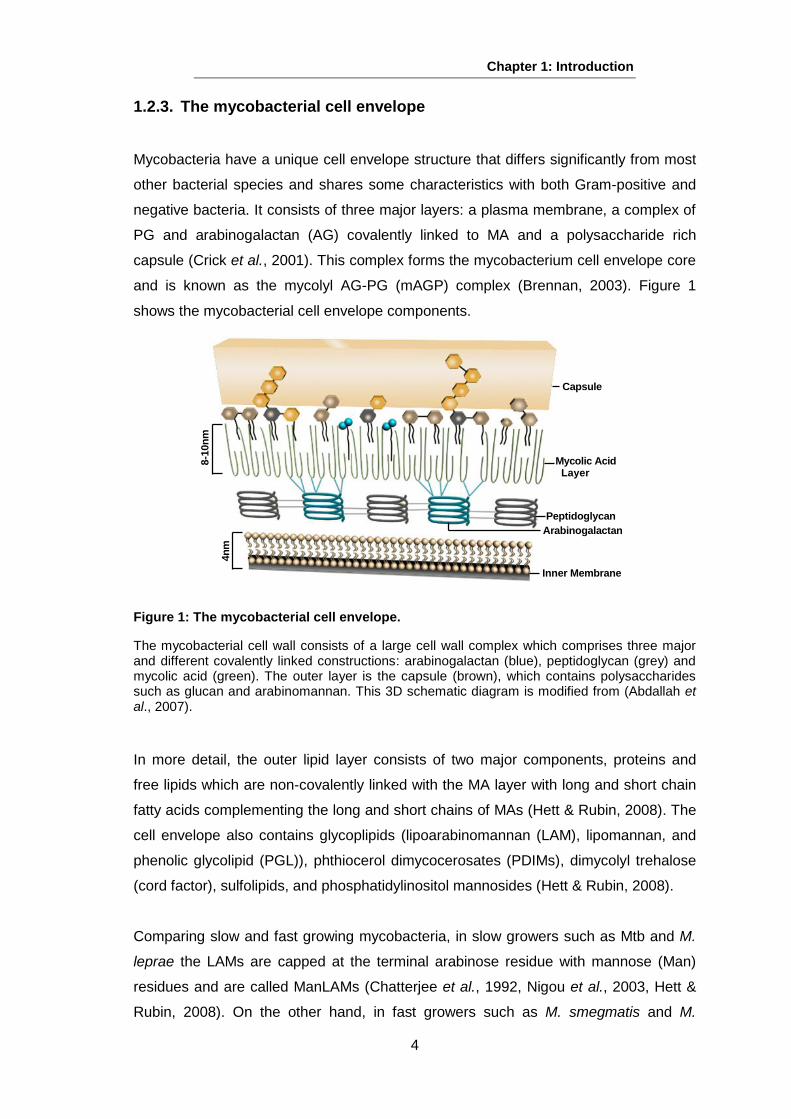
Lipid bodies (LBs) in mycobacteria were first observed by using Sudan black to stain
the lipid droplets in a study done by Burdon, (1946). LBs are intracellular, spherical,
neutral lipid-filled inclusions containing triacylglycerol (TAG) and wax ester (WE). They
were recently recognised in AFB in sputum from a TB patient in Gambia (Garton et al.,
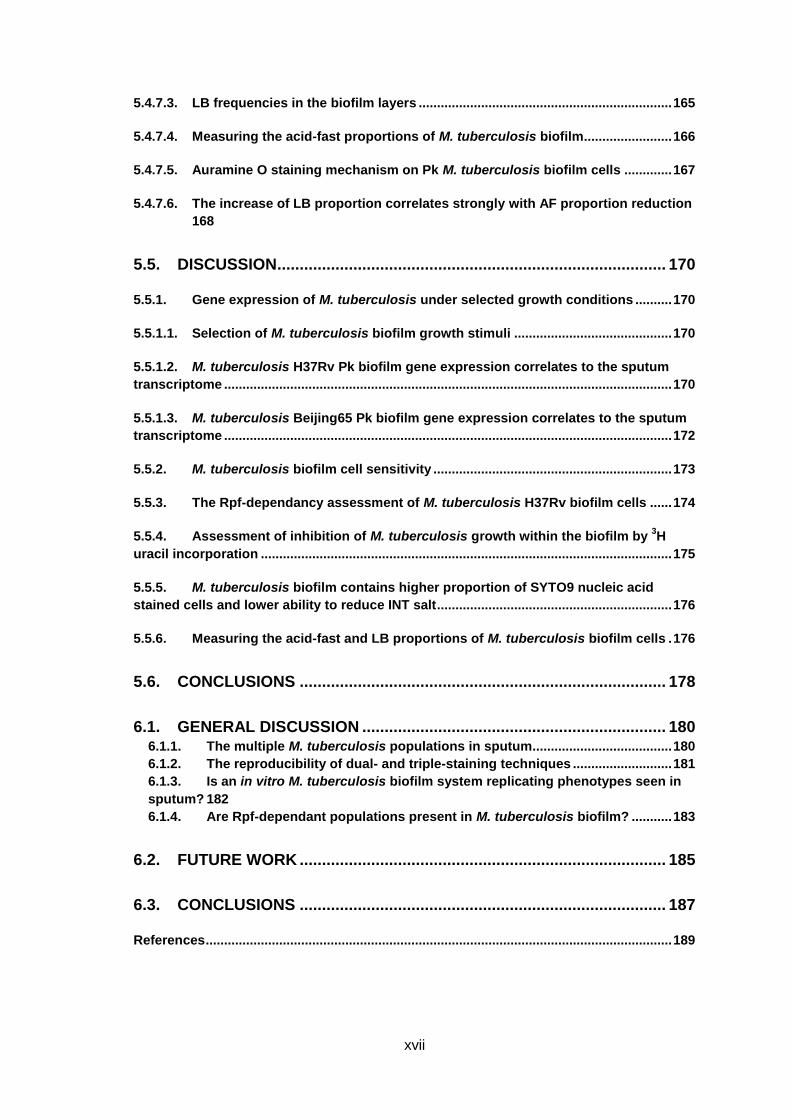
2002). Garton et al., (2008) showed that LB positive Mtb in differing proportions are a
universal feature in tuberculous sputum. Figure 2 shows the LB appearance in AFB+ve
sputum sample.
L B+ v e
L B- v e
BA
Figure 2: Lipid bodies in tubercle sputum sample.
This figure shows images from a 4+ smear-positive sputum sample of (A) Auramine O stained Mtb bacilli from a sputum sample and (B) the same cells stained with LipidTox Red Neutral Lipid stain (RLx). Arrows represent the different LB populations in the same sputum sample as they vary in having LB, as well as in the number of lipid droplets. Scale bar is 2 µm.
The lipid contents on the mycobacterial cell wall cause an important burden on cell
synthesis. There are about 250 identified genes in Mtb implemented in FA metabolism
Chapter 1: Introduction
7
compared with 50 genes in E. coli (Cole et al., 1998). The mycobacterial cell wall,
phospholipids and acylglycerols are derived from the long chain FA (LCFA). Although
the cell is actively growing, great amounts of LCFAs are necessary to synthesise new
cell wall components; nevertheless, exogenous FA sources, whereas beneficial are
also potentially bactericidal, because of their detergent like activities (Kondo and
Kanai, 1972). In contrast, additional LCFA is concentrated into TAG and LB synthesis
under conditions of stress, which leads to intervals of slow growth. This TAG can be
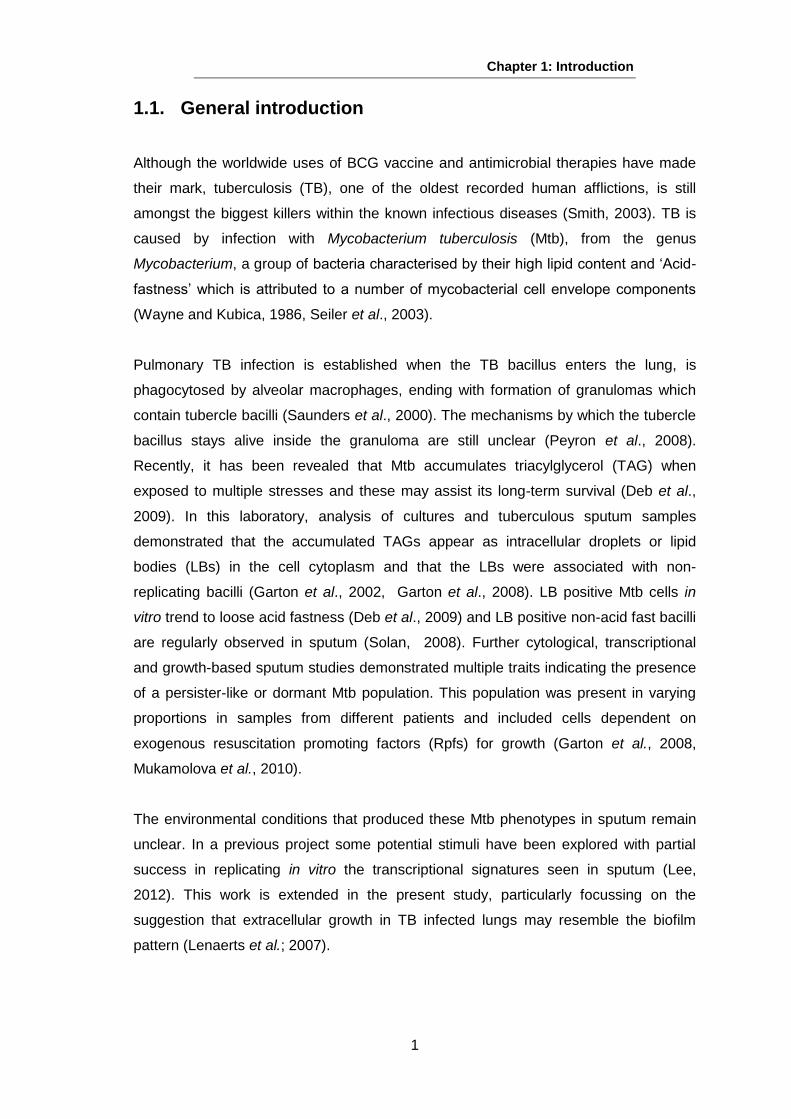
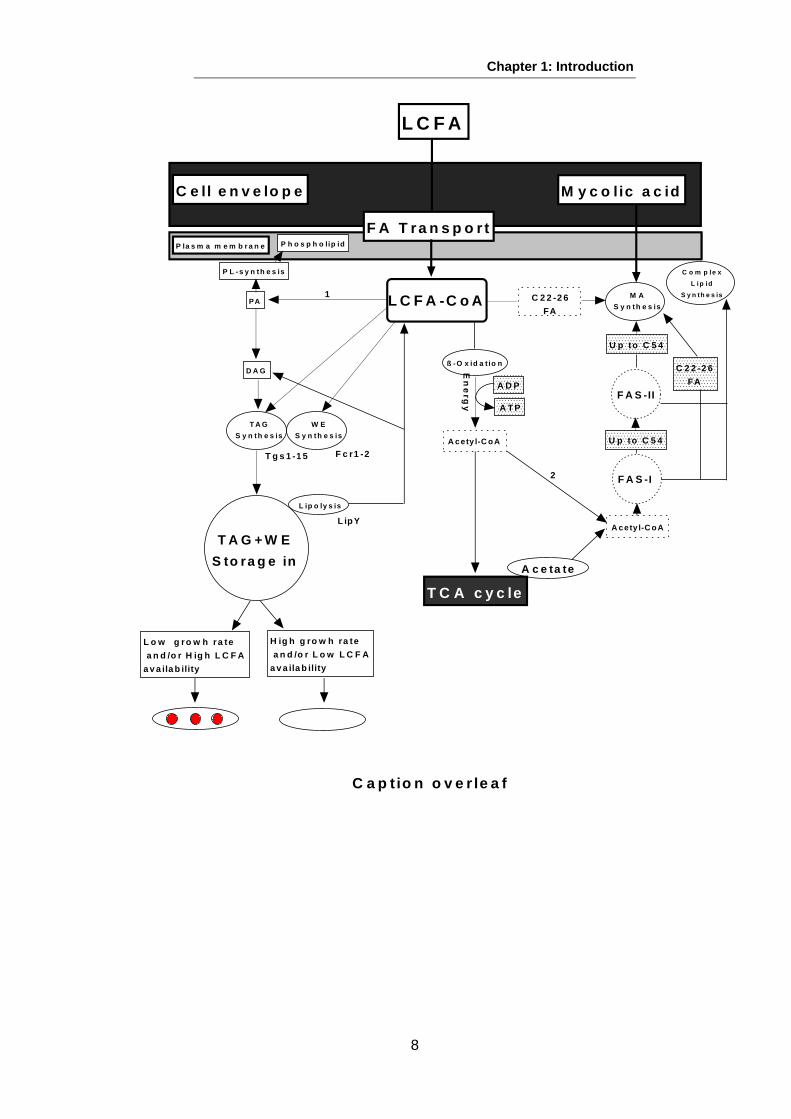
hydrolysed back to LCFA to refill cell reserves (Russell, 2011). Figure 3 shows the
principle Mtb lipid biosynthetic and catabolic pathways relevant to the present study.
Chapter 1: Introduction
8
M y c o lic a c idC e ll e n v e lo p e
P la s m a m e m b r a n e
L C F A
F A T ra n s p o r tP h o s p h o lip id
L C F A -C o A
P L -s y n th e s is
PA
D A G
T A G
S y n th e s is
T A G + W E
S to ra g e in
C 2 2 -2 6
FA
M A
S y n th e s is
ß -O x id a t io n
A cety l-C o A
A D P
A T P
W E
S y n th e s is
L ip o ly s is
L ipY
T g s 1 -1 5 F c r1 -2
U p to C 5 4
F A S -II
F A S -I
U p to C 5 4
A cety l-C oA
T C A c y c le
A c e ta te
C 2 2 -2 6
FA
C o m p le x
L ip id
S y n th e s is1
2
En
erg
y
H ig h g ro w h ra te
a n d /o r L o w L C F A
a v a ila b ility
L o w g ro w h ra te
a n d /o r H ig h L C F A
a v a ila b ility
C a p t io n o v e r le a f
Chapter 1: Introduction
9
Figure 3: Schematic diagram of the interaction among lipid metabolism pathways and fatality of LCFA in M. tuberculosis
This figure shows that long chain fatty acid (LCFA) may be transported into the mycobacterial cell by the action of FA transport proteins or alternatively synthesised by fatty acid synthase I (FAS-I);both are coenzyme A (CoA) dependent. Complex lipids such as TDMs, TMMs and PDIMs, phospholipids in addition to MA, are produced from LCFA. The action of lipases leads to release of LCFA from stored in triacylglycerols (TAGs) or wax esters (WEs). Due to degradation of LCFA via β-oxidation, acetyl-CoA is generated and generates ATP via the tricarboxylic (TCA) cycle. Acetyl-CoA can also be used for elongation of FA. There are additional enzymes implicated in this process such as Tgs1-15, Fcr1-2 and LipY. However, Tgs1-15 have either WE synthase or diacylglycerol acyltransferase activity. Rv0308 is a putative phosphatidate phosphatase membrane-bound protein that yields diacylglycerol (DAG) from phosphatidic acid (PA); 1, PA is synthesised through two cycles of sequential concentration of FA-CoA to glycerol-3-phosphate to produce 1 acyl-glycerol-3-phosphate followed by 1,2 diacyl-glycerol-3-phosphate (PA). PA is used to create complex PLs; 2, LCFA-CoA cannot be directly combined into MA precursors in fatty acid synthase II (FAS-II) as a only FA carried by AcpM can be synthesised by FAS-II. Transformation from CoA to AcpM is done by mtFabH, which forms the link between FAS-I and FAS-II. It is suggested that LBs are formed according to an environmental equilibrium of available LCFA and cell growth conditions. When the cell is actively growing, LCFA flux is also active as a result of cell wall lipid and phospholipid turnover. On the other hand, when the cell is growing slowly or stressed the syntheses of cell wall lipids and phospholipids are repressed and LCFA can be transported into TAG synthesis for storage. (Figure modified from (Sherratt, 2008, Lee, 2012).
The FAS-I system of Mtb is encoded by fab (Rv2524c) whose substrates are a FA.
The FAS-I domain of Mtb is organised in this order: acyltransferase, enoyl reductase,
The majority of TB cases present as pulmonary disease, resulting from reactivation of
latent TB infection, reinfection, or initial development from a primary infection see 1.5.4
(Lin and Flynn, 2010). However, any organ can be involved as extra-pulmonary
disease as TB can display varied disease expression (Hopewell and Jamser, 2005).
Symptoms of pulmonary TB begin with a persisting cough as a common symptom,
which might not be productive early on, but as the disease develops and results in
inflammation and necrosis of the lung tissue, mucoid or purulent sputum is frequently
coughed up (Hopewell and Gamser, 2005). Expectoration of blood-stained sputum
(haemoptysis) may be present with pulmonary TB, but does not necessarily indicate
active TB; haemoptysis may be a consequence of ruptured blood vessels in an old
cavity and other bacterial or fungal infections (Hopewell and Gamser, 2005). Chest
pain and dyspnea may also occur as a result of spontaneous pneumothorax. TB may
also end up with respiratory failure in advanced disease stages (Huseby and Hudson,
1979, Murray et al., 1978).
1.5.2. Treatment of tuberculosis
Streptomycin (SM) was introduced as a first TB drug, however, monotherapy with this
drug led to resistance and treatment failure in many cases. In 1952, Isoniazid (INH)
provided the first modern anti-TB therapy (Mitchison, 2005). The use of INH
monotherapy then provoked a search for other anti-TB therapies that could be used in
combination in order to prevent INH resistance. In 1961, pyrazinamide (PZA) was
introduced followed by ethambutol (EMB) and rifampicin (RIF) in 1967. INH, RIF, EMB
and PZA are used today as the first-line TB drug regimen (Mitchison, 2005, Alcala et
al., 2003). All four drugs are given for the first 2 months and INH and RIF continued for
the remaining months of the six month standard treatment. This extended treatment
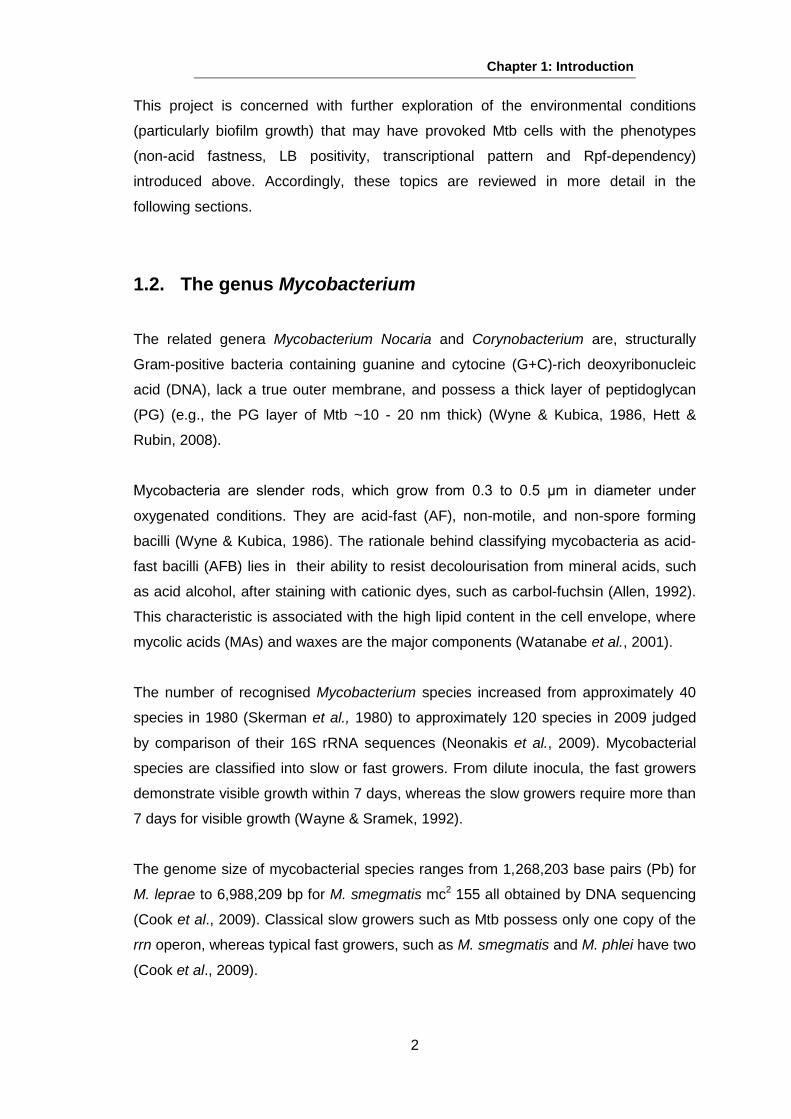
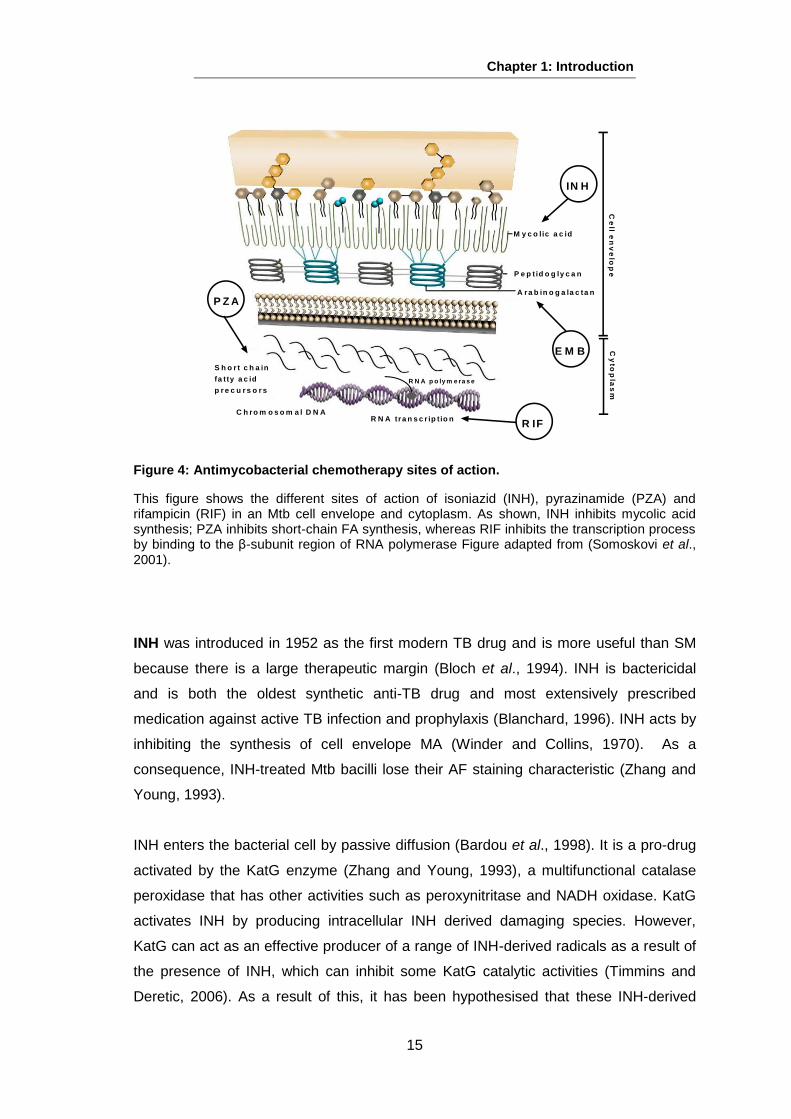
poses major problems for patient compliance. The target of each drug is shown in
Figure 4. Only INH and RIF have been used in this study.
Chapter 1: Introduction
15
M y c o lic a c id
P e p t id o g ly c a n
A ra b in o g a la c ta n
Ce
ll en
ve
lop
eC
yto
pla
sm
IN H
S h o r t c h a in
fa tty a c id
p r e c u r s o r s
P Z A
C h ro m o s o m a l D N A
R N A p o ly m e ra s e
R N A tra n s c r ip t io nR IF
E M B
Figure 4: Antimycobacterial chemotherapy sites of action.
This figure shows the different sites of action of isoniazid (INH), pyrazinamide (PZA) and rifampicin (RIF) in an Mtb cell envelope and cytoplasm. As shown, INH inhibits mycolic acid synthesis; PZA inhibits short-chain FA synthesis, whereas RIF inhibits the transcription process by binding to the β-subunit region of RNA polymerase Figure adapted from (Somoskovi et al., 2001).
INH was introduced in 1952 as the first modern TB drug and is more useful than SM
because there is a large therapeutic margin (Bloch et al., 1994). INH is bactericidal
and is both the oldest synthetic anti-TB drug and most extensively prescribed
medication against active TB infection and prophylaxis (Blanchard, 1996). INH acts by
inhibiting the synthesis of cell envelope MA (Winder and Collins, 1970). As a
consequence, INH-treated Mtb bacilli lose their AF staining characteristic (Zhang and
Young, 1993).
INH enters the bacterial cell by passive diffusion (Bardou et al., 1998). It is a pro-drug
activated by the KatG enzyme (Zhang and Young, 1993), a multifunctional catalase
peroxidase that has other activities such as peroxynitritase and NADH oxidase. KatG
activates INH by producing intracellular INH derived damaging species. However,
KatG can act as an effective producer of a range of INH-derived radicals as a result of
the presence of INH, which can inhibit some KatG catalytic activities (Timmins and
Deretic, 2006). As a result of this, it has been hypothesised that these INH-derived
Chapter 1: Introduction
16
damaging species (oxygen and carbon centred free radicals) are directly important in
mycobacterial cell lethality (Shoeb et al., 1985) because INH damages a range of
mycobacterial cell components, mainly the lipids, by inhibiting cell-wall lipid synthesis
(Timmins and Deretic, 2006).
RIF is a fermentation product extracted from Nocardia mediterranei as a semisynthetic
derivative of rifamycins (Sensi et al., 1959). Since the discovery of RIF in 1967
(Mitchison, 2005), it has been a valuable antibacterial chemotherapy effective at low
concentrations against mycobacteria and Gram-positive species (Wehrli, 1983). RIF
provides an early bactericidal effect on metabolically active Mtb. In addition, it displays
late sterilizing action on semi-dormant bacteria with low metabolic activity. The
introduction of RIF and PZA shortened TB treatment from 1 year to 6 months.
Monoresistance with INH is quite common and uncommon for RIF resistance, which
usually occurs with INH resistance. Hence, RIF resistance is used as a marker for
MDR TB (Somoskovi et al., 2001).
RIF was first shown to inhibit the RNA polymerase of E. coli (Hartmann et al., 1967).
More than 96% of RIF resistance (Ramaswamy and Musser, 1998) relates to
mutations in a well-defined, 81 base-pair central region of the gene that encodes the β-
subunit of the RNA polymerase (Telenti et al., 1993).
The need for long-term treatment of TB is not due to conventional drug resistance but
is generally associated with physiological states of bacteria that play a major role in
drug tolerance (McKinney, 2000). It has been proposed that there are four Mtb
populations during infection with distinct physiological states. These states are: fast
growing bacilli, slow growing bacilli, dormant or non-replicating persistent (NRP), and
bacilli tolerant to the acidic environment (Mitchison, 1979). Although INH is effective
against slow growing bacilli, fast growing bacilli can be killed effectively by INH within
the first two wks (McKinney, 2000, Zhang and Amzel, 2002). The remaining
populations can be eliminated by RIF, and PZA has been thought to also kill bacteria
in an acidic environment and in NRP (McKinney, 2000).
The challenge of TB patient compliance has been addressed by the World Health
Organisation (WHO) with the introduction of a Directly Observed Therapy – Short
Course (DOTS) treatment program. A DOTS program establishes a treatment course
for each TB patient that is supervised by a health or social worker (McKinney, 2000).
DOTs program are expensive and difficult to apply, and as a result only 1 of 5 TB
Chapter 1: Introduction
17
patients is treated this way. DOTS is extremely effective in treating TB cases with high
cure results (McKinney, 2000, Zhang and Amzel, 2002).
1.5.3. Transmission of tuberculosis
TB is spread through airborne droplet nuclei of sizes about 1 – 5 µm in diameter that
contain Mtb bacilli when an individual with pulmonary or laryngeal TB coughs,
sneezes, sings or even talks (Leung, 1999). An individual with active pulmonary TB
who coughs up frequently is able to introduce thousands of these droplets into the air.
A study conducted by Fennelly et al, (2004) using a cough aerosol sampling system
showed that aerosol particles from TB patients can reach 7 or more µm in diameter.
These particles containing Mtb bacilli settle very slowly and can remain airborne from
minutes to several hr after coughing (Beggs et al., 2003, Frieden et al., 2003). Thus,
TB is transmitted most easily in overcrowded and poorly ventilated residences that
typically reflect low-income level accommodation (Beggs et al., 2003).
When infectious droplet nuclei are inhaled, they may lodge in the alveoli (Frieden et
al., 2003) where they meet the initial defence, alveolar macrophages. The level of
infectiousness varies between TB patients. There are many factors that may control
the probability for the transmission of TB and the establishment of infection, these
include: host immune status, the force of the cough and properties of the bacillus such
as virulence factors and bacterial load (Ahmad, 2011, Dharmadhikari and Nardell,
2009). Variation in TB infectiousness has been measured by subjecting Guinea pigs to
the air generated from a TB hospital ward. Guinea pigs are used in these type of
studies because they are extremely vulnerable to low numbers of bacilli (a single
infectious droplet can cause an infection) (Riley, 1961). Results of this study revealed
that 4% of infected patients in a particular ward were responsible for developing the TB
in 73% of the Guinea pigs (Sultan et al., 1960).
Another risk factor that increases the probability of transmitting infection is prolonged
and close contact to a TB patient, hence, co-habiting family members are more likely
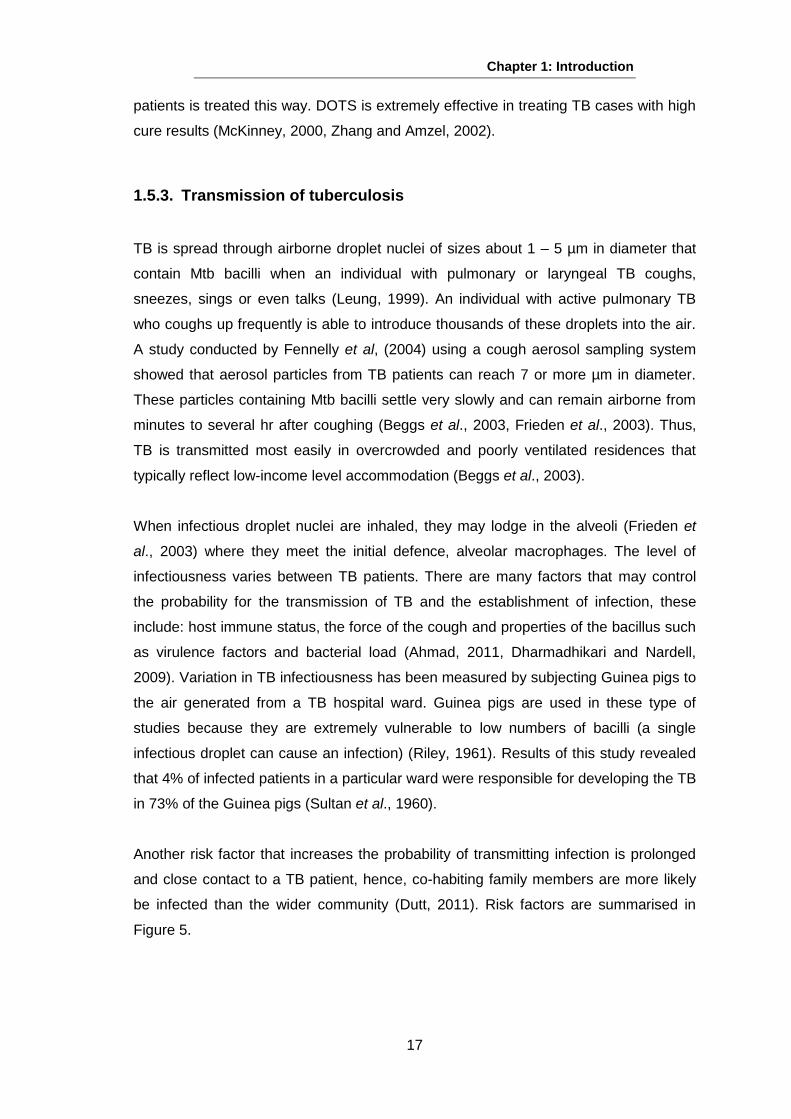
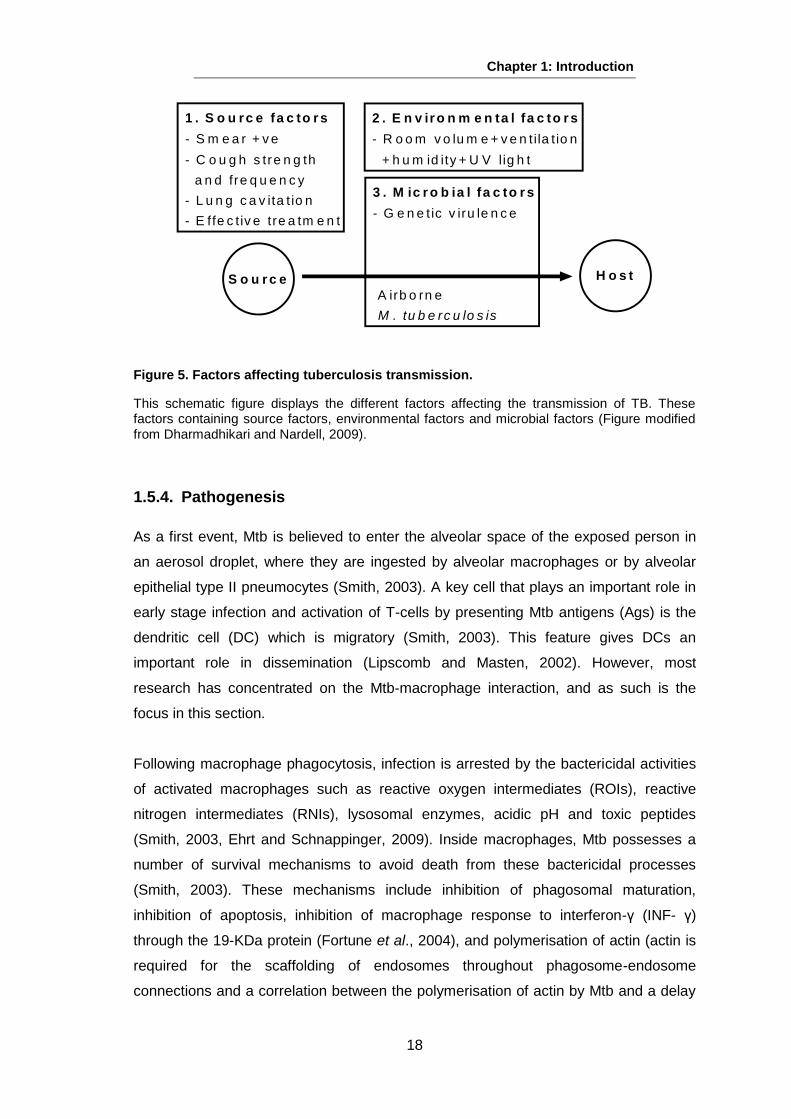
be infected than the wider community (Dutt, 2011). Risk factors are summarised in
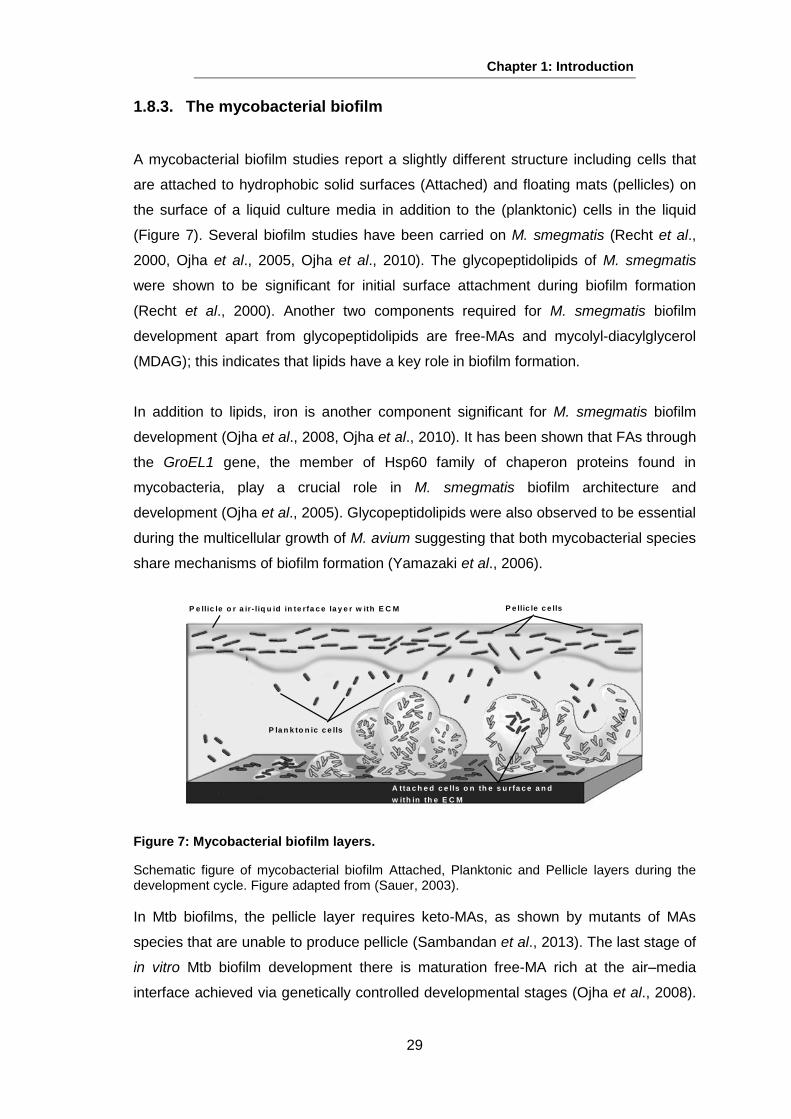
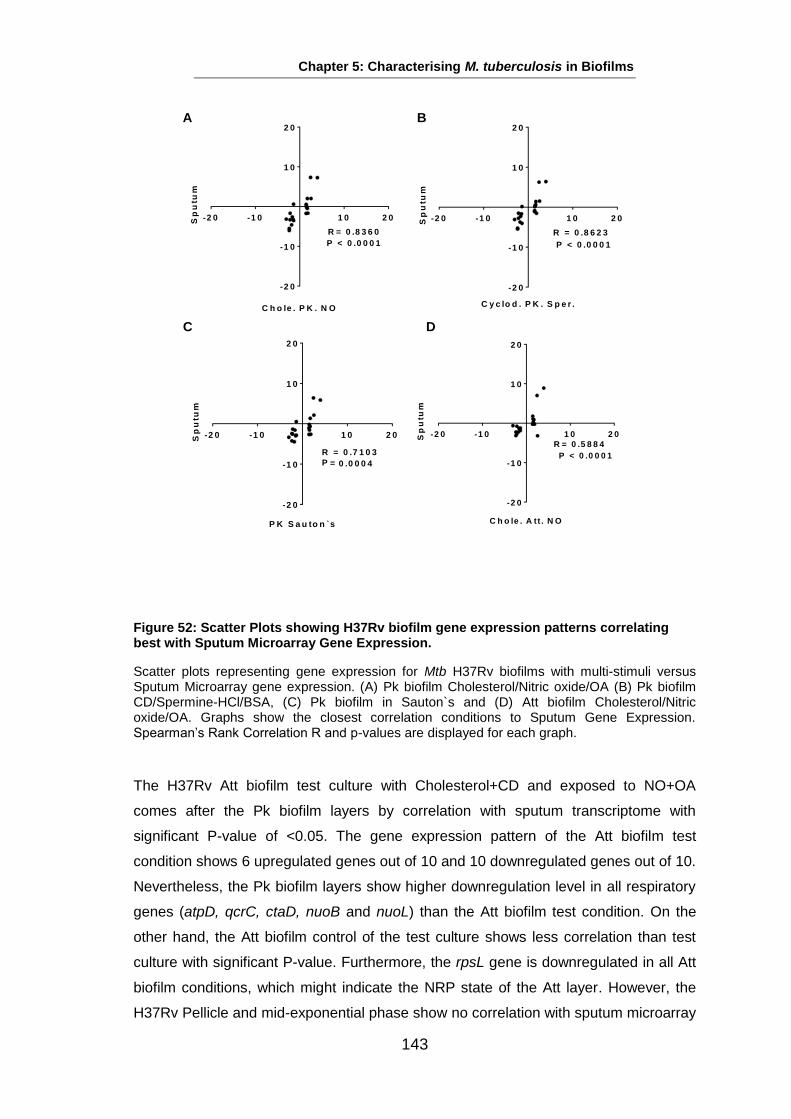
This schematic figure displays the different factors affecting the transmission of TB. These factors containing source factors, environmental factors and microbial factors (Figure modified from Dharmadhikari and Nardell, 2009).
1.5.4. Pathogenesis
As a first event, Mtb is believed to enter the alveolar space of the exposed person in
an aerosol droplet, where they are ingested by alveolar macrophages or by alveolar
epithelial type II pneumocytes (Smith, 2003). A key cell that plays an important role in
early stage infection and activation of T-cells by presenting Mtb antigens (Ags) is the
dendritic cell (DC) which is migratory (Smith, 2003). This feature gives DCs an
important role in dissemination (Lipscomb and Masten, 2002). However, most
research has concentrated on the Mtb-macrophage interaction, and as such is the
focus in this section.
Following macrophage phagocytosis, infection is arrested by the bactericidal activities
of activated macrophages such as reactive oxygen intermediates (ROIs), reactive
nitrogen intermediates (RNIs), lysosomal enzymes, acidic pH and toxic peptides
(Smith, 2003, Ehrt and Schnappinger, 2009). Inside macrophages, Mtb possesses a
number of survival mechanisms to avoid death from these bactericidal processes
(Smith, 2003). These mechanisms include inhibition of phagosomal maturation,
inhibition of apoptosis, inhibition of macrophage response to interferon-γ (INF- γ)
through the 19-KDa protein (Fortune et al., 2004), and polymerisation of actin (actin is
required for the scaffolding of endosomes throughout phagosome-endosome
connections and a correlation between the polymerisation of actin by Mtb and a delay
Chapter 1: Introduction
19
in phagosomal maturation) (Hestvik et al., 2005). Following the primary infection of the
macrophage in a naïve host`s lung, in the absence of an immune response, Mtb
undertakes a period of rapid growth. Once the host`s immune system gains
awareness, infected macrophages pass through the lymphatic system to the hilar
lymph nodes (Honer zu Bentrup and Russell, 2001, Frieden et al., 2003). The
macrophage plays an important role as a primary host cell in TB infection, by
supporting a significant environment for bacterial multiplication and distribution, and as
a possible niche for persistent infection (Cosma et al., 2003).
The state of TB disease during the course of infection reflects the interaction between
the host and microbial factors (Hopewell and Gamser, 2005). The possibility of
developing active disease becomes higher when the immune system cannot
effectively contain the replication and proliferation of tubercle bacilli, such as in
children under five-years-old and in immunocompromised adults, such as those with
HIV (Frieden et al., 2003).
Cell-mediated immunity in most individuals develops after infection of 2-8 wks (Frieden
et al., 2003). In vitro studies in measuring the response of murine and human
macrophages to Mtb infection reveal that cells produce a strong proinflammatory
response via the activity of Toll-like receptor (TLR) agonists, which are rich on the
surface of the bacteria (Russell, 2007). The growth of Mtb in alveolar macrophages
leads to stimulation of this proinflammatory response via the release of Tumour
Necrosis Factor-α (TNF-α) and chemokines, attracting mononuclear cells such as
monocytes, lymphocytes and neutrophils, from blood vessels towards the site of
infection (Cosma et al., 2003, Russell, 2007, Smith, 2003). Natural killer (NK) T cells
are first recruited by chemokines to the site of infection, following by recruitment of
CD4+ T cells, CD8+ T cells and γδ T cells and B cells (Russell, 2007). Granule-
mediated lysis of Mtb-infected macrophages is achieved mostly by CD8+ T cells and
NK T cells expressing perforin and granulysin proteins (Stenger et al., 1998, Gansert
et al., 2003). Granulysin protein level is decreased in children after therapy which
suggests that granulysin can be used as a marker of disease activity in childhood TB
(Di Liberto et al., 2007). However, CD4+ T cells produce interleukin-2 (IL-2) and TNF-α
which are important to control the infection and also produce IFN-γ to activate
macrophages. IFN-γ controls and amplifies the cellular enrolment of both cytokines
and chemokines which are released from CD4+ and CD8+ T cells (Russell, 2007). All
these immune cells are building blocks for the classic lesions of TB, the granuloma
(Russell, 2007).
Chapter 1: Introduction
20
1.5.5. Granuloma formation
The granuloma is considered a hallmark of TB (Silva Miranda et al., 2007). It can be
defined as a central, compact collection of inflammatory cells in which mononuclear
cells predominate (Zumla and James, 1996), and where the infection can be controlled
and limited from dissemination by the immune system (Russell, 2007). However
granulomas could be beneficial for Mtb by providing the bacilli with a niche in which it
can stay alive, modulating the immune response to allow its persistence without lysis
over long periods of time.
Granulomas consist of foamy macrophages which are highly lipid-laden and other
mononuclear phagocytes surrounding the core infected macrophages (Russell, 2007,
Gonzalez-Juarrero et al., 2001, Silva Miranda et al., 2007). These macrophages are
surrounded by a layer of lymphocytes forming a fibrous layer of collagen and other
extracellular matrices, which outline the structure from normal lung tissue (Honer zu
Bentrup and Russell, 2001, Russell, 2007).
The Mtb granuloma is characterised by the formation of central caseation (Zumla and
James, 1998). In advanced stages, the granuloma forms a fibrous sheath and the
number of blood vessels that go to the structure diminishes. The central zone or the
caseation involves a cheese-like semi solid-structure that is rich in lipids and proteins
from live bacteria as well as dead cells placed in a hypoxic environment (Honer zu
Bentrup and Russell, 2001, Russell, 2007). Necrotic granulomas are produced by a
cellular necrotic section in the centre of the granuloma with a rim of lymphocytes of the
T- and B cell forms surrounded by epithelioid macrophages (Flynn et al., 2011, Huynh
et al., 2011). Bacteria in the centre of the necrotic granuloma are believed to use the
cheese-like matter as a source of nutrients (Wayne and Sohaskey, 2001). Within this
environment, hypoxia is one of the conditions that are speculated to shift Mtb bacilli to
a NRP state (Wayne and Hayes, 1996). The formation and maturation of tuberculous
pulmonary granuloma is shown in Figure 6.
Although Mtb is thought to be in the centre of the necrotic lesion, several studies
speculated that a substantial portion of bacteria or bacterial antigens were associated
with macrophages in the peripheral leukocytic infiltrate (Russell, 2007). These
bacteria, which were found to be in the peripheral macrophages, express highly
upregulated icl1 (isocitrate lyase-1) (McKinney et al., 2000). It was assumed through
Chapter 1: Introduction
21
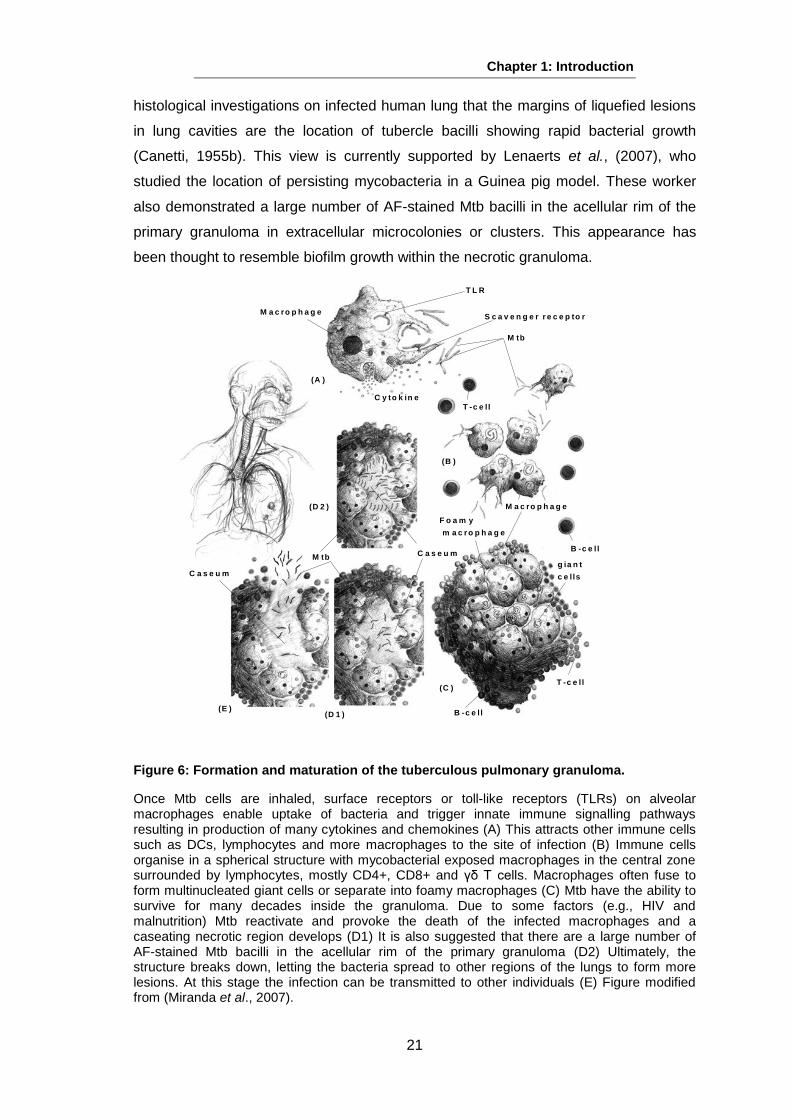
histological investigations on infected human lung that the margins of liquefied lesions
in lung cavities are the location of tubercle bacilli showing rapid bacterial growth
(Canetti, 1955b). This view is currently supported by Lenaerts et al., (2007), who
studied the location of persisting mycobacteria in a Guinea pig model. These worker
also demonstrated a large number of AF-stained Mtb bacilli in the acellular rim of the
primary granuloma in extracellular microcolonies or clusters. This appearance has
been thought to resemble biofilm growth within the necrotic granuloma.
T L R
S c a v e n g e r r e c e p to r
M tb
C y to k in e
(A )
T -c e l l
B -c e l l
M a c ro p h a g e
F o a m y
m a c r o p h a g e
B -c e l l
T -c e l l
g ia n t
c e l ls
(B )
(C )
(D 1 )(E )
C a s e u m
M a c ro p h a g e
M tb
(D 2 )
C a s e u m
Figure 6: Formation and maturation of the tuberculous pulmonary granuloma.
Once Mtb cells are inhaled, surface receptors or toll-like receptors (TLRs) on alveolar macrophages enable uptake of bacteria and trigger innate immune signalling pathways resulting in production of many cytokines and chemokines (A) This attracts other immune cells such as DCs, lymphocytes and more macrophages to the site of infection (B) Immune cells organise in a spherical structure with mycobacterial exposed macrophages in the central zone surrounded by lymphocytes, mostly CD4+, CD8+ and γδ T cells. Macrophages often fuse to form multinucleated giant cells or separate into foamy macrophages (C) Mtb have the ability to survive for many decades inside the granuloma. Due to some factors (e.g., HIV and malnutrition) Mtb reactivate and provoke the death of the infected macrophages and a caseating necrotic region develops (D1) It is also suggested that there are a large number of AF-stained Mtb bacilli in the acellular rim of the primary granuloma (D2) Ultimately, the structure breaks down, letting the bacteria spread to other regions of the lungs to form more lesions. At this stage the infection can be transmitted to other individuals (E) Figure modified from (Miranda et al., 2007).
Chapter 1: Introduction
22
1.5.6. Latent infection
After infection is established there are no symptoms in most individuals. This is termed
latent infection and may reflect Mtb dormancy (no multiplication) or suppression by the
immune system and this condition may last a few months, decades or be lifelong
(Tufariello et al., 2003, Wayne and Sohaskey, 2001). Latency is associated with a
positive tuberculin skin test (Boshoff and Barry, 2005).
Individuals with latent TB have a 2 to 25% chance of developing active disease
(Parrish et al., 1998). Latency refers to the clinical disease condition, whereas
dormancy refers to the condition of the surviving Mtb bacilli in infected host. Bacterial
dormancy is defined as ‘a reversible state of low metabolic activity in a level that
maintains viability’ (Kaprelyants and Kell, 1993). It is widely believed that Mtb bacilli
maintain a dormant or “Non-Replicating Persistent (NRP) state during latency, as a
result of the inhibitory growth conditions in the macrophage and granuloma (Boshoff
and Barry, 2005, Parrish et al., 1998, Wayne and Sohaskey, 2001).
1.5.7. Gene expression NRP M. tuberculosis
As noted above (1.1) a study on Mtb transcription in sputum (see 1.7) led to the
recognition of a pattern similar to that observed in NRP bacilli (Garton et al, 2008).
One of the regulons that may play an important role in Mtb survival during latency is
the “Dormancy Survival Regulator” or DosR regulon (Wayne and Sohaskey, 2001,
Leistikow et al., 2010). The DosR regulon provides genetic programming upregulated
by environments that inhibit aerobic respiration and as limit bacillary replication
(Leistikow et al., 2010). There appears to be a strong association between oxygen
tension and the formation and maintenance of latency (Wayne and Sohaskey, 2001).
According to this link between oxygen depletion and latency Sherman et al., (2001)
identified 48-genes that were shown to be induced in H37Rv with response to 0.2%
oxygen for 2h in a culture flask. During this study, within the 48-upregulated genes, an
obvious operon that contains the putative two-component response regulator pair
Rv3133c/Rv3132c was identified. The deletion of a Rv3133c regulator resulted in a
repressed expression of the α-crystallin hypoxic response gene, whereas deletion of
the Rv3132c sensor kinase, resulted in no particular phenotype being detected
(Sherman et al., 2001). In addition to the DosR, there is a two-component regulatory
Chapter 1: Introduction
23
system that essentially contains two sensor histidine kinases, where DosS acts as a
redox sensor and DosT acts as a hypoxia sensor (Kumar et al., 2007).
The 48-genes shown to be induced during hypoxia have been associated with
dormancy. Muttucumaru et al., (2004) examined H37Rv NRP gene expression using
the model devised by Wayne and colleagues and showed that 36 out of 49 predicted
members of the DosR regulon were induced in the resultant NRP state. Another study
done by Voskuil et al., (2004) using the same model, demonstrated that 42 predicted
members of the DosR regulon were induced during NRP state whereas 27 DosR
predicted members of the DosR regulon were also induced in a stationary phase
culture. Other studies on this topic showed that 35 DosR regulon genes were
upregulated in a stable state chemostat culture under low oxygen tension (Bacon et
al., 2004). In a static culture that was allowed to settle for 30 minutes, there were 31
DosR regulon genes up regulated (Kendall et al., 2004). All these studies support
hypoxia as a major factor in DosR regulon induction.
Another factor that stimulates the DosR regulon in Mtb is a non-lethal nitric oxide (NO)
concentration that reversibly reduces respiration and growth and as a result induces
the dormancy program (Voskuil et al., 2003). Exposure to a bacteriostatic
concentration of NO on Mtb in vitro reveals transcriptional changes such as
upregulation of about a 20-gene set regulated by the DosR/DosS/DosT system (Shi et
al., 2005). The DosR regulon was shown to be induced at a high level when the Mtb
H37Rv strain exposed to 1 mM of s-nitrosoglutathione (GNSO, a NO releasing agent),
5% ethanol and to a lesser extent 10 mM hydrogen monoxide (H2O2), but not heat and
cold shock conditions (Kendall et al., 2004). Another study using a DosR mutated Mtb
strain revealed that deletion of DosR resulted in a loss of Mtb cell culturability in solid
culture and that growth could be recovered in liquid culture. Furthermore, the DosR
mutant showned 10,000-fold defect in an anaerobic dormancy survival condition. This
finding indicates DosR as significant in the continuation of growth from a hypoxic or
NO repressed non-respiring state (Leistikow et al., 2010). In addition to the in vitro
studies, in vivo work was done by Parish et al., (2003) showing that DosR mutants in
mice infection became more virulent than wild type. In contrast, DosR in Guinea pig
was shown to be essential for infection and formation of granuloma, whereas
disruption of DosR attenuates Mtb (Malhotra et al., 2004). However, it should be taken
into account that there is a difference between the mouse and Guinea pig models; in
mice there is no caseous necrotic centre (Rhoades et al., 1997).
Chapter 1: Introduction
24
Late-stage persistence in a murine model has revealed that a FA enzyme, isocitrate
lyase-1 icl1, originaly recognised under NRP conditions by Wayne and Sohaskey
(2001), is essential at this stage (McKinney et al., 2000). The Icl1 gene of Mtb was
shown to be upregulated in THP-1 macrophage infection (Schnappinger et al., 2003).
This enzyme is a significant component of the glyoxylate cycle that permits Mtb to
achieve a source of energy from FAs broken down to acetyl coenzyme A. The icl1
enzyme is also essential for Mtb pathogenesis and intracellular survival in mice
infection (Munoz-Elias and McKinney, 2005). Furthermore, in vivo studies on mice
confirmed that deletion of icl1 resulted in almost a ten-fold decline in Mtb titres in lungs
during the chronic phase of infection (Ehrt and Schnappinger, 2009). Although there is
noted upregulation of icl1 gene during dormancy, it is not part of the DosR regulon.
Hence, DosR regulon does not control all genes required for NRP Mtb (Zhang et al.,
2012).
1.6. Resuscitation Promoting Factors
Sputum contains MTB cells that depend on Resuscitation Promoting Factors (Rpfs) to
grow (mukamolova 2010). Rpfs are muralytic enzymes that induce the culturability of
dormant or non-culturable bacteria (Kana and Mizrahi, 2010). Mukamolova and
colleagues (1998) were the first to identify and characterise the single Rpf in
Micrococcus luteus as a ~16 KDa secreted protein that, when added to extended
stationary phase cells incapable of growth in liquid or solid media, rendered them
culturable in a most propbable number (MPN) liquid culture assay. Homologues of the
M. luteus protein are found in many Gram positive organisms (actinobacteria and
firmicutes) and, in particular mycobacteria including Mtb (Kana and Mizrahi, 2010;
Gupta and Srivastava, 2012). Rpf proteins are known to be PG-glycosidases, but the
mechanism of action and role of Rpf in mediating reactivation is still unknown.
Five Rpf proteins in Mtb (Rpf A-E) were shown to be expressed and to have
resucitationg activity on M. luteus (Mukamolova et al., 2002). Dormant Mtb cells
produced in some in vitro systems require an exogenous source of Rpf to grow
(Sheelva et al., 2002).The Rpf gene homologues in Mtb (Rv0867c (rpfA), Rv1009
(rpfB), Rv1884c (rpfC), Rv2389c (rpfD), and Rv2450c (rpfE)) were shown to stimulate
growth of Mtb and M. bovis BCG from stationary-phase cultures (Mukamolova et al.,
2002). Tufariello et al., (2006) have shown that the deletion of rpfB gene from the Mtb
chromosome led to a delayed resuscitation in a murine mouse infection model, but the
growth and persistence of Mtb in mice were not affected. Another study done by Kana
Chapter 1: Introduction
25
et al., (2008) demonstrated that combinations of single and combined deletion mutants
of the five Rpf proteins results in reduced Mtb recovery from dormancy. Individual Rpf-
like genes are unnecessary for Mtb growth in vitro as the Rpf mutants showed no
significant growth curve difference than wild type, but Rpf deletion led to small colony
phenotype (Tufariello et al., 2004). Through comparison between exponential-phase
and stationary-phase Mtb cells, expression of the Rpf-like genes is found to be growth
phase-dependent (Tufariello et al., 2004).
Because Rpf proteins are expressed by active cells, the mycobacterial NRP-like
population in TB needs actively dividing cells to be able to be resuscitated (Kana et al.,
2008, Mukamolova et al., 2010). In smear-positive sputum samples, it was observed
that between 80 to 99.9% of Mtb cells present are Rpf-dependant (Mukamolova et al.,
2010). Rpf-dependant populations may signify the population of dormant cells in a
patient.
1.7. Sputum transcriptome
Expectoration or production of sputum is a major feature of pulmonary TB. The
medical definition of production or expectoration is `spitting out or coughing material
produced in the respiratory tract (Farzan, 1990). Sputum expectorated from pulmonary
TB patients contains Mtb populations expressing different properties that may be
connected with transmission (Garton et al., 2008). The physiology of Mtb in sputum
has been largely unknown but the transcriptional pattern determined in this study
revealed expression of 182 genes to be significantly upregulated and 334 genes were
significantly downregulated when compared with log-phase aerobic growth (Garton et
al., 2008). Further, when Mtb cells were exposed to the Wayne model of dormancy,
they accumulated LBs at a similar level to those present in sputum, thus the sputum
transcriptome was compared to two NRP stages (NRP1: hypoxic condition for 70 h
and NRP2: hypoxic condition for 200 h) (Garton et al., 2008).
This comparison between sputum transcriptome and the two NRP stages showed that
in vitro grown cells do not match with the transcriptional signature from sputum.
However, there were number of similarities in the regulated genes between sputum,
slow growth, NRP2 and those identified in murine macrophage infection
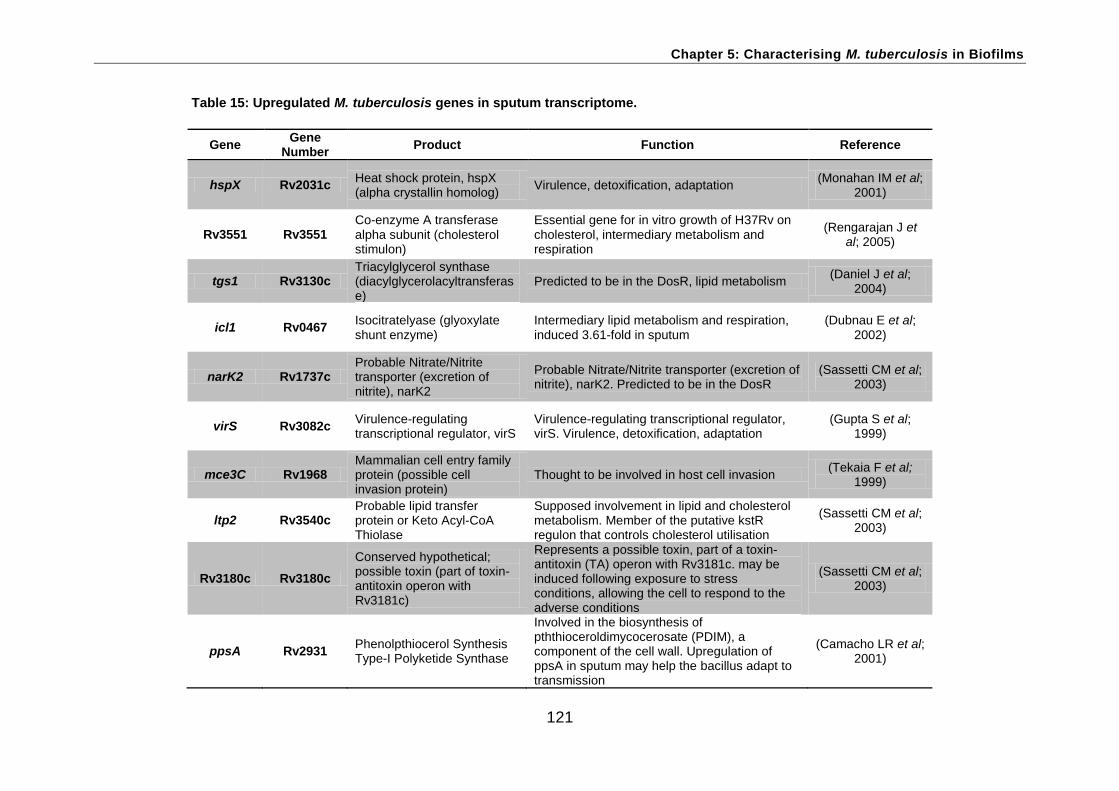
(Schnappinger et al., 2003). Further analysis revealed that 11 out of 48 DosR regulon
genes were identified to be induced greater than 2.5-fold in sputum including hspX,
Chapter 1: Introduction
26
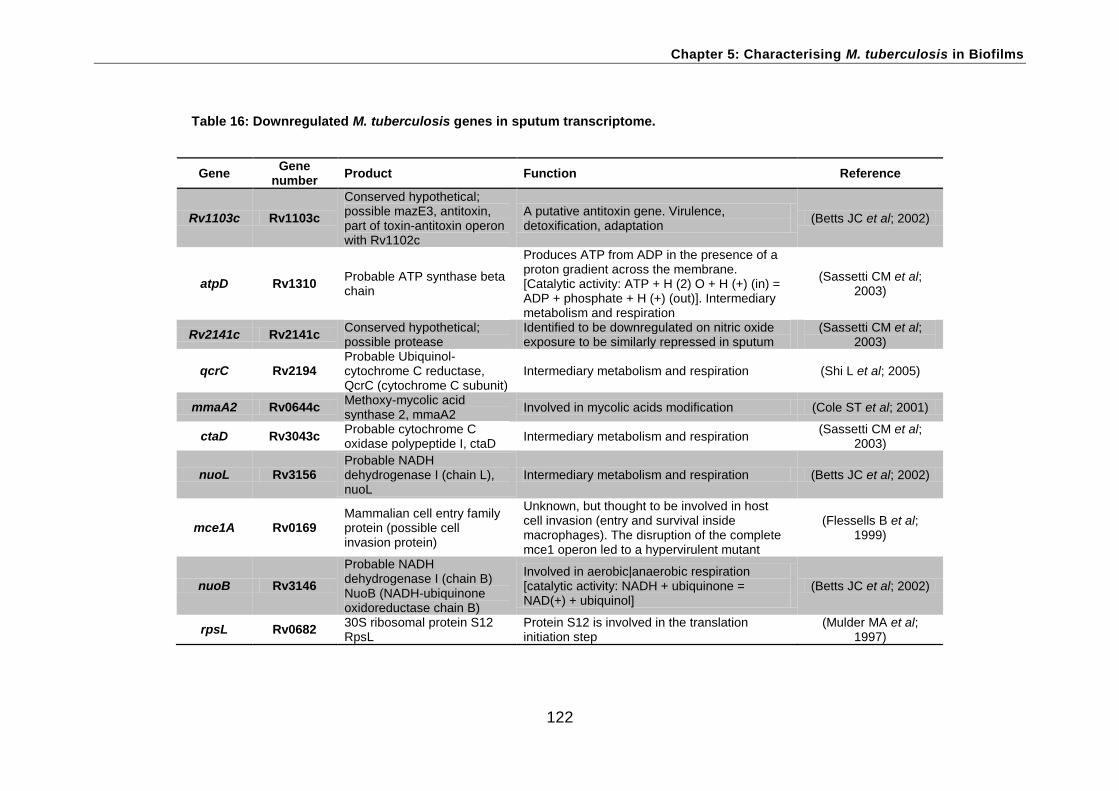
tgs1 and narK2. In addition the icl1 was upregulated greater than 3.5-fold. Moreover,
sputum downregulated genes also suggested presence of NRP Mtb bacilli and
included repression of genes essential for aerobic respiration, ATP synthesis and
ribosomal proteins.
Three genes involved in cholesterol utilisation were shown to be upregulated in
sputum; all three genes are from the putative kstR regulon and induced greater than
2.5-fold upregulation. In Mtb, the kstR regulon involves 74 genes including mce4 and
igr, which control the expression of genes used for the utilisation of various lipids
including cholesterol as energy sources (Kendall et al., 2007, Kendall et al., 2010).
There are around 64 genes in Mtb that may be involved in cholesterol utilisation. All
these genes were significantly induced in sputum in comparison with log-phase
aerobic growth.
All 21 genes identified as involved in aerobic respiration in Mtb were repressed in both
sputum and NRP2 compared with log-phase aerobic growth. Of these genes, atpA
Oleic acid is a supplement for mycobacterial growth (Winn et al., 2006). OADC supplement
was prepared as per ADC supplement above, with the addition of 8.63 ml of Oleic Acid
solution (1% w/v) in 0.2 M NaOH prewarmed to 50˚C). The OADC solution was filter
sterilised through a 0.2μm filter.
Tween 80
Tween 80 is used to minimise clumping of the mycobacteria species during growth in liquid
culture. Tween 80 was prepared by dissolving 10g of stock solution in distilled water to a
final volume of 100 ml and final concentration of 10% (w/v). The solution was sterilised by
filtration through a 0.2 µl filter unit and stored at 4°C.
Oleic acid in BSA
The oleic acid solution was prepared by dissolving 100μl of oleic acid (Sigma-Aldrich) in
100ml 5% (w/v) bovine serum albumin fraction V (BSA), to give a stock concentration of
3.35mM. The solution was sonicated for 1 hr to allow the oleic acid to emulsify before being
filter sterilised through 0.2μm filter. The solution was stored at 4°C. The solution was melted
at 50°C prior to use.
Sauton`s Broth
Potassium dihydrogen orthophosphate 0.5g
Magnesium sulphate 0.5g
L-Asparagine 4.0g
Glycerol 75.0g
Ferric ammonium citrate 50.0mg
Citric acid 2.0g
1% (w/v) zinc sulphate 0.1ml
Tween 80 0.5g
The solution was made up to final volume of 1 litre and the pH was adjusted to 7.0 with
NaOH. The solution was autoclaved at 15lbs in-2 pressure (121°C) for 20 min and stored in
room temperature away from direct light.
Chapter 2: Materials and Methods
36
Luria-Bertani (LB) agar
Bacto-tryptone 4 g
Bacto-yeast extract 2 g
NaCl 2 g
Agar-powder 1.5% (w/v)
The solution was made up to 400 ml with distilled water and the pH was adjusted to 7.4. LB agar was autoclaved at 121°C for 15 min.
Phosphate-buffered Saline (PBS)
Phosphate-buffered saline (PBS) was prepared by dissolving one PBS tablet (Sigma-Aldrich,
cat no: P3813) in 200ml double-distilled water to give a solution with final concentration of
0.01M phosphate buffer, 0.002M potassium chloride and 0.137M sodium chloride at pH7.4.
The solution was autoclaved at 15lbs in-2 pressure (121°C) for 20 min.
10% (w/v) glycerol solution
Glycerol (10g) was made up to 100ml in distilled water and sterilised by autoclaving at
121°C for 15 min then stored at 4°C.
1% (w/v) BSA solution
This solution was prepared by dissolving 1 g of BSA fraction V in PBS to a final volume of
100 ml and final concentration of 1% (w/v). The solution was filter sterilised through 0.2 µl
filter and stored at 4°C. This solution was used to block un-specific binding of primary and
secondary antibodies during immunofluorescence technique.
10% (v/v) normal goat serum in BSA
This solution was prepared by dissolving 1 g BSA fraction V and 10 ml of normal goat serum
(Invitrogen, USA) in PBS to a final volume of 100 ml to reach the final concentration of 10%
(v/v) normal goat serum in 1% (w/v) BSA in PBS. The solution was filter sterilised through
0.2 µl filter and stored at 4°C. This solution was used for block nonspecific binding of primary
and secondary antibodies during sputum labelling.
Chapter 2: Materials and Methods
37
N-acetyl-L-cysteine (NALC)
NALC solution was used to digest and decontaminate sputum samples. NALC solution was
prepared by combining the following reagents:
Trisodium citrate 50 ml 50mM
NaOH 50 ml 4% (w/v)
NALC 0.5 g 0.5% (w/v)
Phosphate buffer (67mM, pH 6.8) was prepared by combining the following reagents:
NaH2PO4
51 ml
134mM
Na2HPO4
49 ml
134mM
d. H2O
100 ml
-
Preparation of Guanidine Thiocyanate (GTC) Solution
Guanidine Thiocyanate (GTC) was prepared by combining the following reagents:
Guanidium thiocyanate
295.4g
N-lauryl sarcosine
2.5g
Trisodium citrate
12.5ml
10% (w/v)Tween 80
25ml
Reagents were dissolved in 200ml of distilled water incubated at 37°C with shaking (100
rpm) for 6 hr. When fully dissolved, solution was made up to a final volume of 500ml with
distilled water. GTC then was separated into 20ml aliquots in 50ml polypropylene centrifuge
tubes and stored away from heat and light. Immediately prior to use, 140 µl of β-
mercaptoethanol was added to 20 ml of the GTC solution to reach the final concentration of
7µl/ml.
Preparation of Mtb H37Rv Culture Supernatant (SN)
A freeze dried pellet (kindly supplied by Dr. Galina Mukamolova) from 32ml of M.
tuberculosis H37Rv culture supernatant prepared as described by Mukamolova et al. (2010)
and stored at -20°C was used for Rpf-dependency assays. Prior to use, H37Rv SN was
dissolved in 16ml of sterile distilled water and 16ml of 7H9-ADC-Tween 80 and then was
kept on ice for 30-60 min before use.
Chapter 2: Materials and Methods
38
Preparations of Rpf-dependacy assessment for M. tuberculosis cells
Control 7H9 plate
In a sterile falcon tube 45 ml Middlebrook 7H9 autoclaved fresh broth, 5 ml ADC and 0.125
ml of 10% (w/v) Tween-80 were combined and mixed carefully.
Supernatant plate
A 32 ml of dried powdered sterile H37Rv SN was dissolved in 16 ml of sterile d.H2O and
kept on ice for an hr to dissolve all solid particles. Once ready, the SN was diluted with the
same control preparation of 50 % (v/v) of Middlebrook 7H9 broth, ADC and Tween-80 then
used directly.
Preparation of media with cholesterol
The preparation of media supplemented with cholesterol (Sigma-Aldrich) was adapted from
Klein et al., (1995). Methyl-ß-cyclodextrin (Sigma-Aldrich) 1g was dissolved in 11 ml of PBS
in a sterile glass test tube at 80°C in plate stirrer (Grant Instruments SUB6, Cambridge,
England) with continuous stirring. Cholesterol (30mg) was dissolved in 400 µl
isopropanol/chloroform (2:1 v/v) in a small glass tube. Cholesterol solution was added to the
warmed methyl-ß-cyclodextrin solution in 50 μl aliquots, stirring was continued until all the
cholesterol went into solution before adding additional material. The final concentration of
cholesterol in solution is 6.8 mM cholesterol and 70 mM cyclodextrin (~9% w/v cyclodextrin).
The combined mixture was cooled down and kept at room temperature. Methyl-ß-
cyclodextrin (70mM) solution was used as a control solution.
The cholesterol/Cyclodextrin mixture and Methyl-ß-cyclodextrin control solution were added
to Sauton`s broth warmed at 80°C in water bath. The final concentration of cholesterol and
Cyclodextrin mixture is 0.01% (v/v).
Addition of antibiotics
Antimycobacterial drugs were used according to Inderlied, (1991). Antibiotics were ordered
from SIGMA and stock solutions sterilised by filtration though 0.22 µm pore membrane then
stored at -80°C for up to 12 months. Concentrations used and diluents are mentioned in the
table 4 below:
Chapter 2: Materials and Methods
39
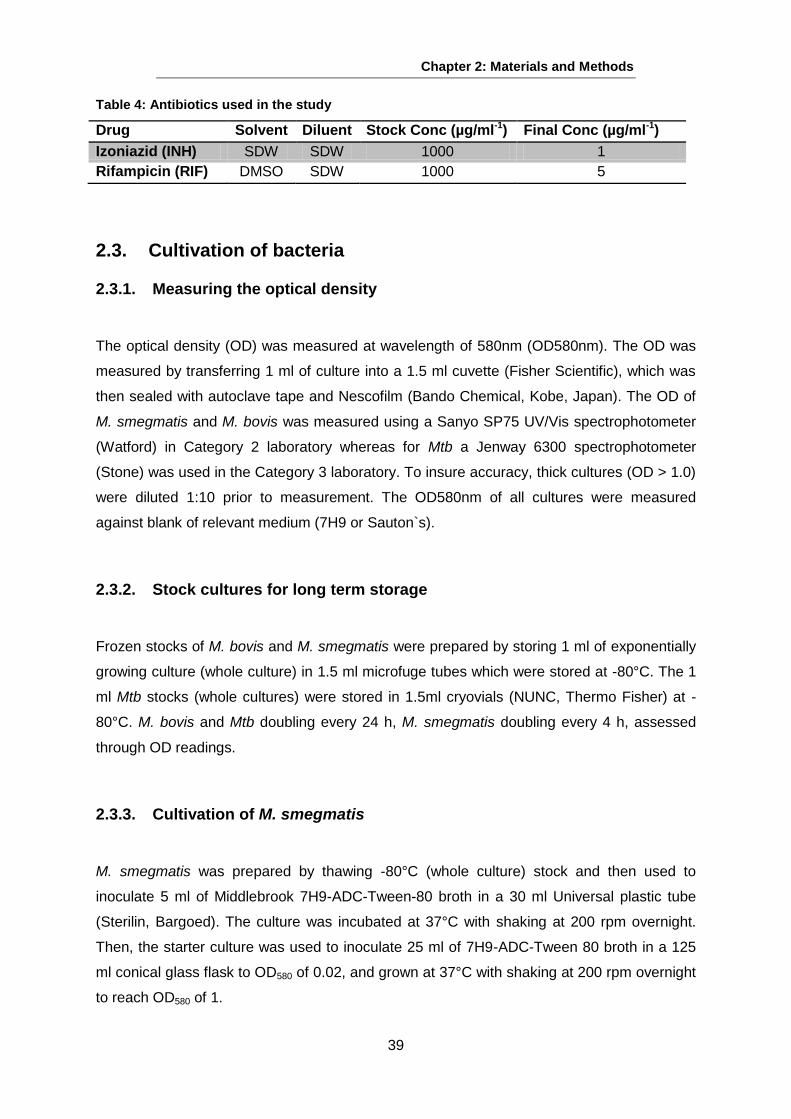
Table 4: Antibiotics used in the study
Drug Solvent Diluent Stock Conc (µg/ml-1) Final Conc (µg/ml-1)
Izoniazid (INH) SDW SDW 1000 1
Rifampicin (RIF) DMSO SDW 1000 5
2.3. Cultivation of bacteria
2.3.1. Measuring the optical density
The optical density (OD) was measured at wavelength of 580nm (OD580nm). The OD was
measured by transferring 1 ml of culture into a 1.5 ml cuvette (Fisher Scientific), which was
then sealed with autoclave tape and Nescofilm (Bando Chemical, Kobe, Japan). The OD of
M. smegmatis and M. bovis was measured using a Sanyo SP75 UV/Vis spectrophotometer
(Watford) in Category 2 laboratory whereas for Mtb a Jenway 6300 spectrophotometer
(Stone) was used in the Category 3 laboratory. To insure accuracy, thick cultures (OD > 1.0)
were diluted 1:10 prior to measurement. The OD580nm of all cultures were measured
against blank of relevant medium (7H9 or Sauton`s).
2.3.2. Stock cultures for long term storage
Frozen stocks of M. bovis and M. smegmatis were prepared by storing 1 ml of exponentially
growing culture (whole culture) in 1.5 ml microfuge tubes which were stored at -80°C. The 1
ml Mtb stocks (whole cultures) were stored in 1.5ml cryovials (NUNC, Thermo Fisher) at -
80°C. M. bovis and Mtb doubling every 24 h, M. smegmatis doubling every 4 h, assessed
through OD readings.
2.3.3. Cultivation of M. smegmatis
M. smegmatis was prepared by thawing -80°C (whole culture) stock and then used to
inoculate 5 ml of Middlebrook 7H9-ADC-Tween-80 broth in a 30 ml Universal plastic tube
(Sterilin, Bargoed). The culture was incubated at 37°C with shaking at 200 rpm overnight.
Then, the starter culture was used to inoculate 25 ml of 7H9-ADC-Tween 80 broth in a 125
ml conical glass flask to OD580 of 0.02, and grown at 37°C with shaking at 200 rpm overnight
to reach OD580 of 1.
Chapter 2: Materials and Methods
40
2.3.4. Cultivation of M. bovis BCG
The M. bovis BCG was prepared by thawing -80°C 1ml stock BCG culture aliquot and then
used to inoculate 5 ml of Middlebrook 7H9-ADC-Tween-80 broth in a 30 ml Universal plastic
tube (Sterilin, Bargoed). The culture was incubated at 37°C statically for 10 days to reach
OD580 of 1.0. Then, the starter culture was used to inoculate 25 ml of 7H9-ADC-Tween 80
broth in a 125 ml conical glass flask to OD580 of 0.05, and grown at 37°C statically for 5-6
days to reach OD580 of 1.
2.3.5. Cultivation of M. tuberculosis
Mtb is classified by the Advisory Committee on Dangerous Pathogens (ACDP) as Category
3 hazardous pathogen requiring biohazard containment at level 3. Therefore, all Mtb work
was carried out in Class I or Class II microbiological safety cabinets within the Containment
laboratory suite, in accordance with the suite code of practice.
Mtb starter cultures were prepared as described for M. bovis BCG (Section 2.3.4). Mtb
starter culture then was sub-cultured into 25ml of Middlebrook 7H9-ADC-Tween-80 in a
125ml polycarbonate conical flask (Corning Life Science, Massachusette, USA) and
incubated with shaking at 100 rpm for H37Rv and 80 rpm for Beijing 65 at 37°C. All Mtb solid
and liquid cultures were double bagged during incubation.
2.3.6. Enumeration of colony-forming units (CFU)
Colony counting was carried out according to the modified version of the Miles and Misra
(surface viable count) method. Ten-fold serial dilutions of cell suspension were performed in
450 µl of 7H9-ADC-Tween 80 medium in 1.5 ml microfuge tubes (Axygen, USA). Three 20 µl
drops from each dilution were plated out onto Middlebrook 7H10 agar in duplicate plates.
Each agar plate was separated into 6 sectors. Agar plates were sealed with Nescofilm to
avoid drying and incubated at 37°C until isolated colonies became visible. The incubation
time for M. smegmatis plates about 2-3 days while generally M. bovis and Mtb required 14-
30 days.
The dilution produces 10-100 colonies (averaged over the six replicate spots) were used for
the final calculation of CFUs, using the equation:
A = Average colony count per 20μl spot
D = Dilution factor
Chapter 2: Materials and Methods
41
2.3.7. Enumeration of most probable number (MPN)
MPN assays were performed in quadruple replicates in 48-well microtitre plates (Greiner
Bio-One, Frickenhausen, Germany), by diluting 50 µl of cell suspension into 450 μl of 7H9-
ADC-Tween 80. Each microtitre plate was separated into 6 or 7 dilution sectors according to
the growth nature of the strain. Plates were then sealed with PetriSEAL™ (Diversified
Biotech, Dedham, UK) tape, to avoid drying and incubated statically at 37°C. The incubation
time for Mtb MPN plates about 4-6 wks.
2.3.8. Nitric Oxide Exposure
Solutions of Nitric Oxide donor, Spermine NONOate (SPER/NO, ENZO, UK) and its control
compound, Spermine tetrahydrochloride (SPER.4HCl, Sigma-Aldrich, UK) were both
prepared to a concentration of 10 mM in sterile PBS as stock solutions. SPER/NO is a fine
powder stock, SPER/NO working solution was prepared immediately prior to use under flow
of nitrogen gas in the fume hood due to its oxygen sensitive nature and discarded after 30
min. When SPER/NO powder dissolved in PBS, it was filter sterilised through 0.2 µm filter
and used immediately. Both SPER/NO and its control SPER.4HCl were added to the Mtb
culture at the final concentration of 100 µM according to Daniel et al. (2004) and Sherratt
(2008) protocols. All cultures were exposed to the nitric oxide or the SPER.HCl control for 4
h.
2.4. Immobilising of bacteria on glass slides for microscopy
2.4.1. Immobilising of M. bovis BCG and M. smegmatis onto slides for
microscopy
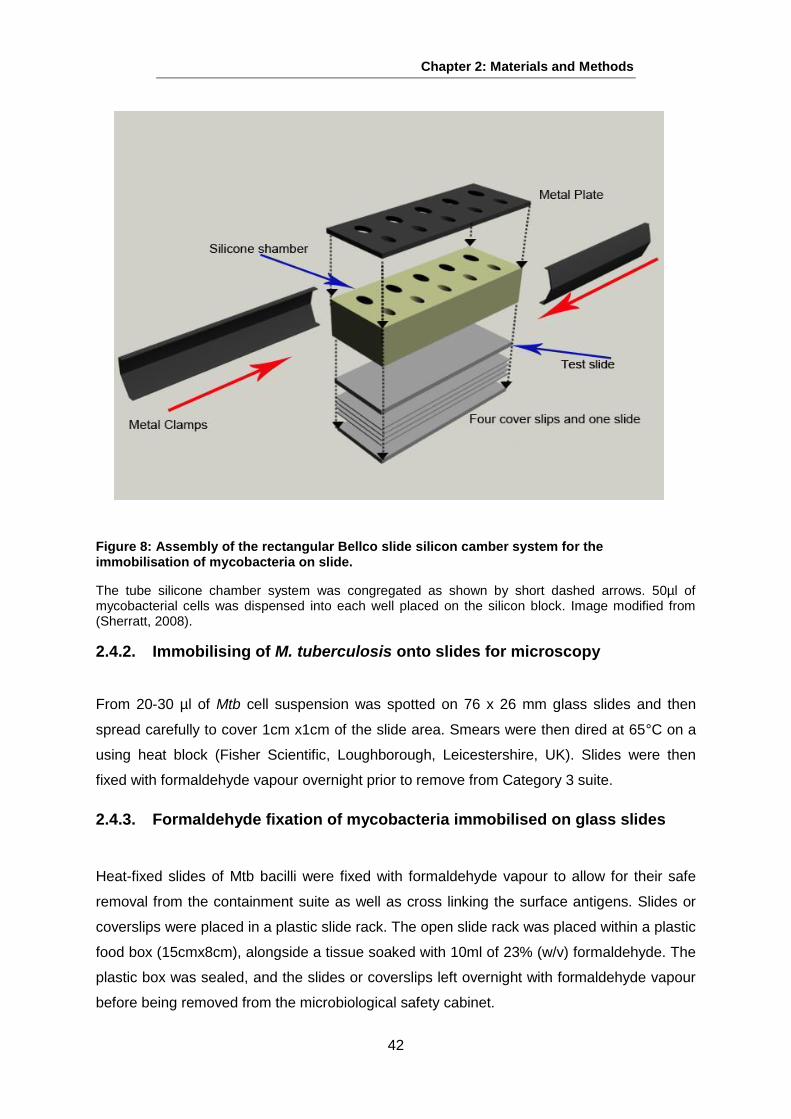
M. bovis BCG and M. smegmatis cells were immobilised onto 76 x 26 mm glass slides using
rectangular Bellco slide chamber system (Figure 8). A 50 µl cell suspension was dispensed
into each well of the silicone block followed by centrifugation at 1000 xg for 10 min in an IEC
Centra-4X centrifuge (International Equipment Company, Dunstable, Bedfordshire, UK). The
supernatant then was removed and the slide was air dried and was finally fixed with
formaldehyde vapour overnight (see below 2.4.3).
Chapter 2: Materials and Methods
42
Figure 8: Assembly of the rectangular Bellco slide silicon camber system for the immobilisation of mycobacteria on slide.
The tube silicone chamber system was congregated as shown by short dashed arrows. 50µl of mycobacterial cells was dispensed into each well placed on the silicon block. Image modified from (Sherratt, 2008).
2.4.2. Immobilising of M. tuberculosis onto slides for microscopy
From 20-30 µl of Mtb cell suspension was spotted on 76 x 26 mm glass slides and then
spread carefully to cover 1cm x1cm of the slide area. Smears were then dired at 65°C on a
using heat block (Fisher Scientific, Loughborough, Leicestershire, UK). Slides were then
fixed with formaldehyde vapour overnight prior to remove from Category 3 suite.
2.4.3. Formaldehyde fixation of mycobacteria immobilised on glass slides
Heat-fixed slides of Mtb bacilli were fixed with formaldehyde vapour to allow for their safe
removal from the containment suite as well as cross linking the surface antigens. Slides or
coverslips were placed in a plastic slide rack. The open slide rack was placed within a plastic
food box (15cmx8cm), alongside a tissue soaked with 10ml of 23% (w/v) formaldehyde. The
plastic box was sealed, and the slides or coverslips left overnight with formaldehyde vapour
before being removed from the microbiological safety cabinet.
Chapter 2: Materials and Methods
43
2.4.4. Syringe treatment to break cultural clumps
Where necessary, clumps were broken by passage of the cell suspension through a blunt
Auramine O 60ms Fluorescence Kinyoun 80ms RLx 10ms GLx 60ms BD 40ms SYTO9 and PI 300ms IF and IIF 300ms PNA 1.5sec
Chapter 2: Materials and Methods
49
2.7.1. Image analysis: measuring cell Fluorescence Intensity and the relative
proportions of cells with various phenotypes
Fluorescence intensity data and cell sub-population sizes were acquired from fluorescence
images using bespoke image analysis algorithm developed at the University of Leicester by
Andrew Bell (Bell, 2013). This process uses ImageJ-based software (National Institutes of
Health, Besthda, Maryland) to count and analyse fluorescence intensities and staining
proportions. For each phase image, ImageJ identifies the region of interest through
thresholding. The area of interest was applied to the consistent fluorescent image and then
the fluorescence intensity was measured (Bell, 2013). The acid-fastness and proportions of
lipid body positive cells were assessed by measuring the fluorescence intensity of each cell
per area and comparing the cell intensity with the cut off value that determined automatically
by the ImageJ software (Bell, 2013).
To filter out non-cellular fluorescence signals, the R Project Software Environment for
Statistical Computing (R Development Core Team, GNU General Public License and The
University of Auckland, New Zealand) was developed and applied (Bell, 2013).
2.7.2. Displaying images
In this project, the images displayed are either phase contrast and fluorescence images. Any
additional format is mentioned in the figure legend. Some of images are displayed with a
Lookup table (LUT). The Green-Fire-Blue format (Figure 9) was used. TOP-HAT filtering was
also used in some cases through Image-Pro-Plus 5.0 software.
Figure 9: LUT Green-Fire-Blue.
The Green-Fire-Blue LUT imaging format application to help in differentiating fluorescence intensities. Colour ranges from the lowest fluorescence value in (black) to the highest in (white).
Chapter 2: Materials and Methods
50
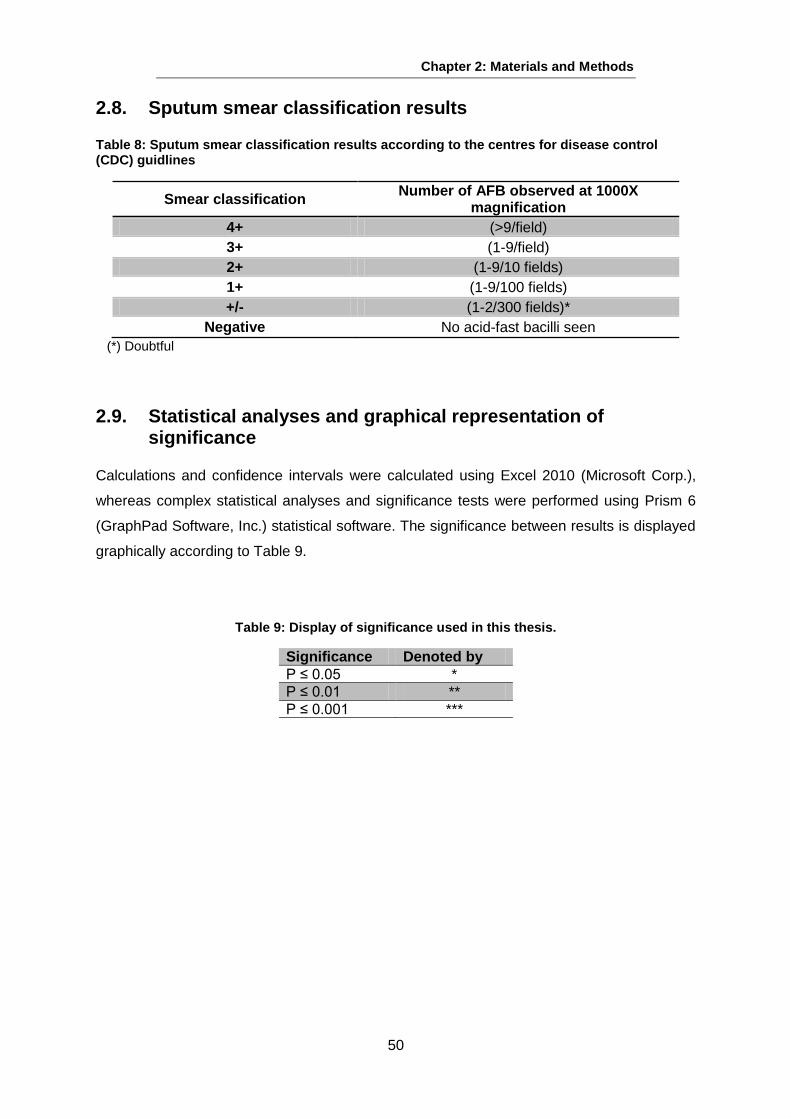
2.8. Sputum smear classification results
Table 8: Sputum smear classification results according to the centres for disease control (CDC) guidlines
Smear classification Number of AFB observed at 1000X
magnification
4+ (>9/field)
3+ (1-9/field)
2+ (1-9/10 fields)
1+ (1-9/100 fields)
+/- (1-2/300 fields)*
Negative No acid-fast bacilli seen
(*) Doubtful
2.9. Statistical analyses and graphical representation of significance
Calculations and confidence intervals were calculated using Excel 2010 (Microsoft Corp.),
whereas complex statistical analyses and significance tests were performed using Prism 6
(GraphPad Software, Inc.) statistical software. The significance between results is displayed
graphically according to Table 9.
Table 9: Display of significance used in this thesis.
Significance Denoted by
P ≤ 0.05 *
P ≤ 0.01 **
P ≤ 0.001 ***
Chapter 3
Development of staining
techniques to detect
M. tuberculosis from sputum and
pure culture
Chapter 3. Development of staining techniques to detect M. tuberculosis
from sputum and pure culture
51
3.1. Introduction
Sputum is considered the key source of TB infection (Leung, 1999). When it is expectorated
from pulmonary TB patients, it contains different Mtb populations expressing properties that
are thought to be required for transmission and initiation of the disease (Garton et al., 2008).
These tubercle bacilli originate from the margins of liquefied lesions in the lung that are
characterized by extensive and rapid bacterial growth (Young & Duncan, 1995 and Canetti,
1955). In an attempt to stay alive, Mtb faces dominant selection pressures to preserve and
express these un-defined transmission properties (Garton et al., 2008). Although the
identification of Mtb in sputum came more than a century ago, these expectorated
phenotypes in sputum remain unclear (Barksdale & Kim, 1977). Therefore, the identification
of any of these bacillary phenotypes in sputum might give clues for recognising these
undefined properties and ultimately offering improved treatment and prevention of TB
(Garton et al., 2008, Mitchison, 2004).
One of these phenotypes which are thought to be feature of Mtb in sputum is LBs (Garton et
al., 2008). It has been shown that the fast-growing M. smegmatis mc2 155 strain
accumulates intracellular triacylglycerol (TAG) LB in vitro (Garton et al., 2002). Although
these LBs have been observed in sputum, Mtb did not produce them in the same culture
conditions as used to observe them in M. smegmatis (Garton et al., 2002). In addition, it has
been shown that when Mtb is conditioned, under various stresses it accumulates TAG
(Daniel et al., 2004), which might later be consumed for long-term survival (Garton et al.,
2008). The transcriptome signatures and presence of LB suggest that lipid body positive
cells populations in sputum may exist in a NRP condition (Garton et al., 2008). Therefore, it
is considered a significant challenge to detect and identify mycobacterial phenotypes and
their expressed properties in sputum and in culture media.
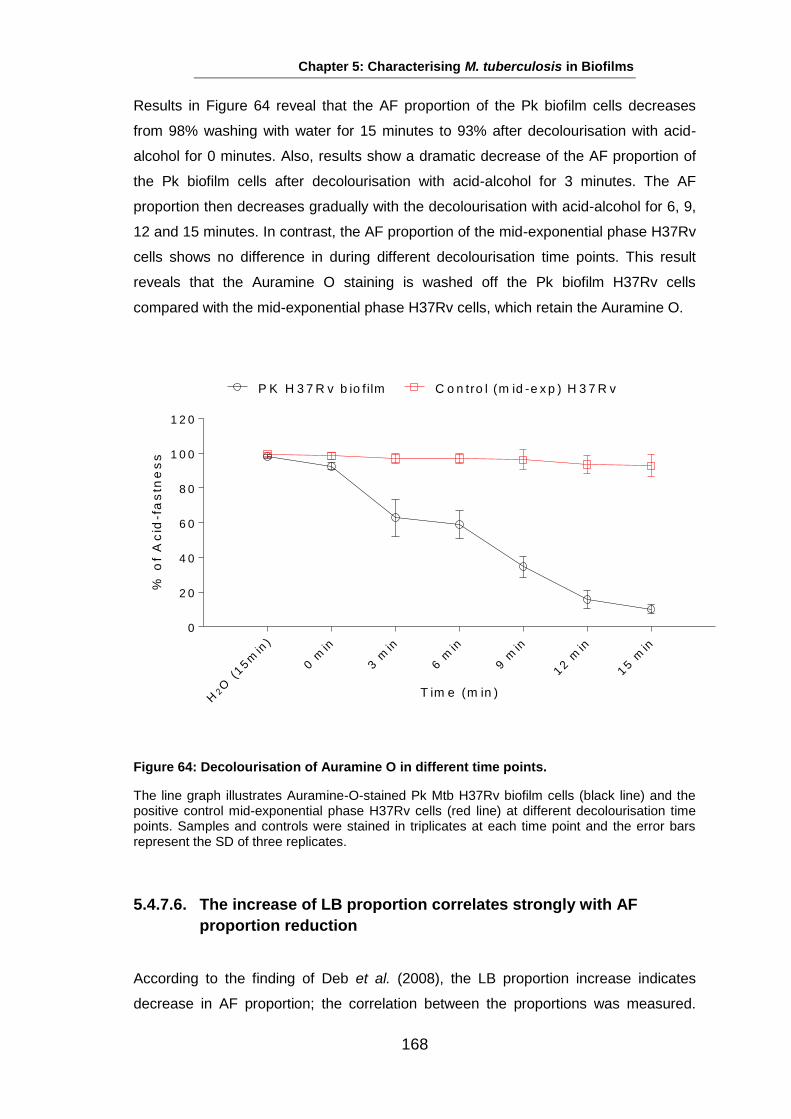
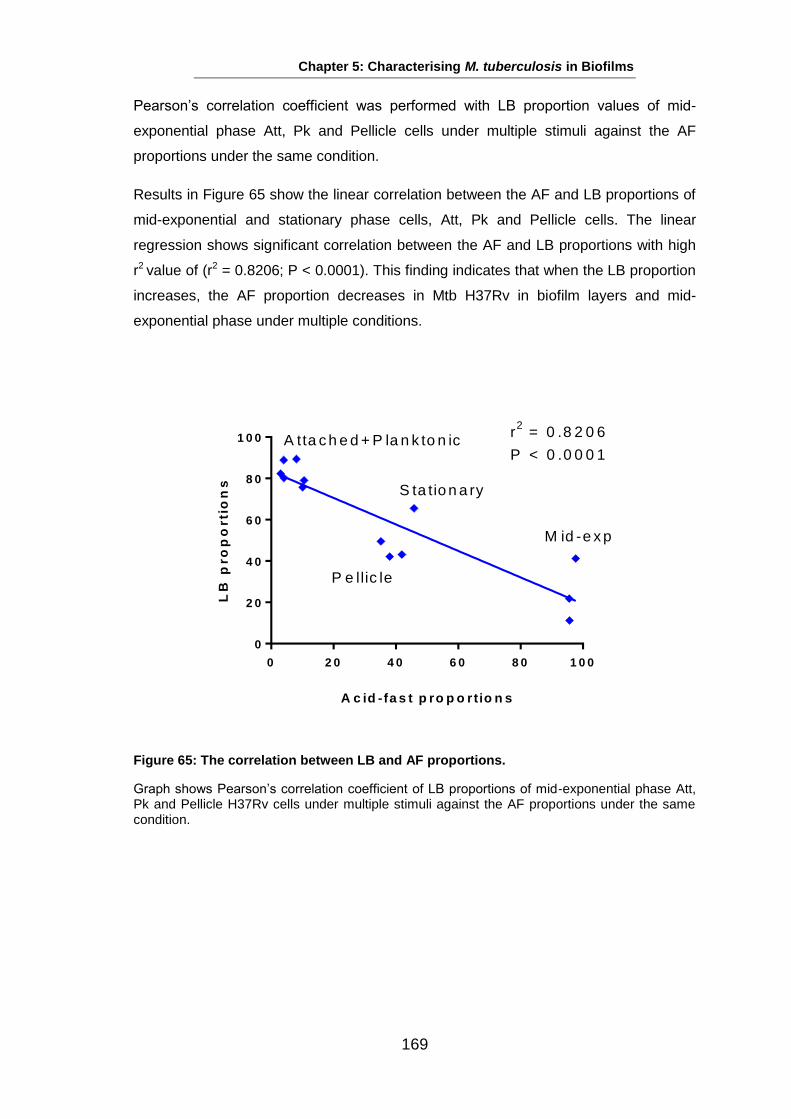
It has been hypothesised that under multiple-stresses including hypoxia, Mtb enter a NRP
state. Deb et al., (2009) showed that the proportion of acid-fastness decreases and the LB
proportion increases. This change in Mtb characteristics might be due to the alteration of the
mycobacterial cell envelope composition, thus leading to a loss of acid-fastness (Deb et al.,
2009). Therefore, conventional acid-fast (AF) staining methods, such as Z-N, Kinyoun and
Auramine O staining, will not detect the non-AF bacilli.
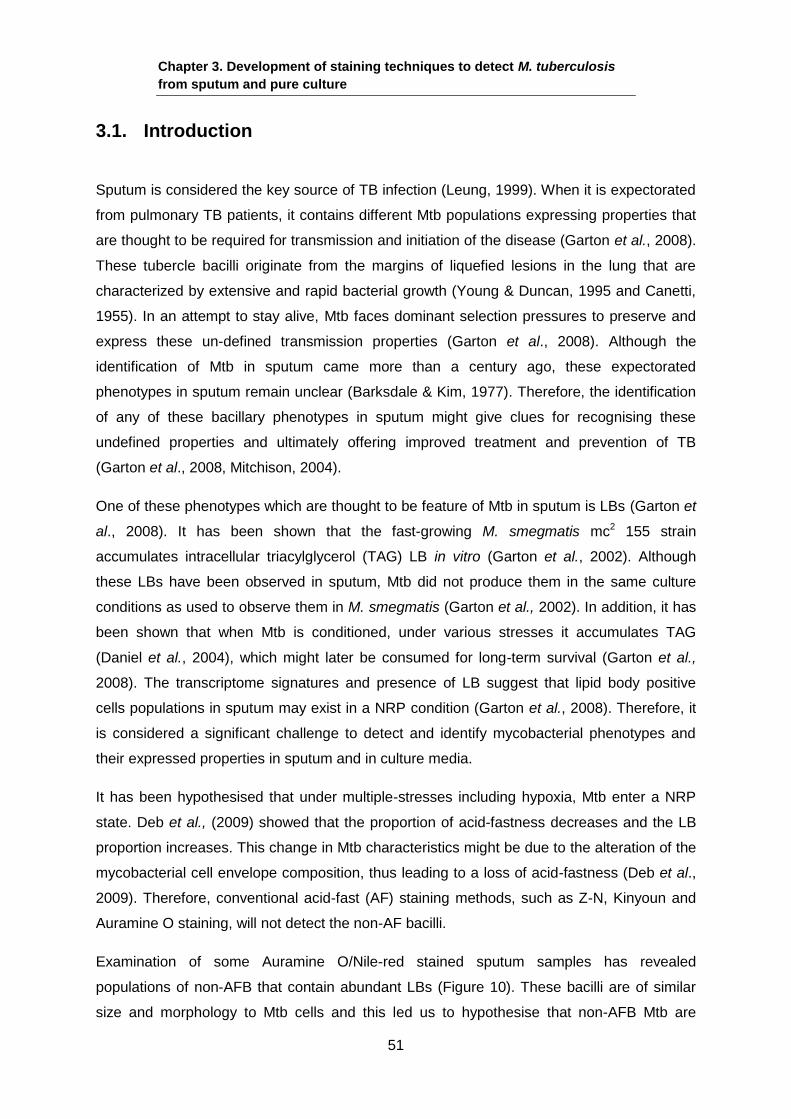
Examination of some Auramine O/Nile-red stained sputum samples has revealed
populations of non-AFB that contain abundant LBs (Figure 10). These bacilli are of similar
size and morphology to Mtb cells and this led us to hypothesise that non-AFB Mtb are
Chapter 3. Development of staining techniques to detect M. tuberculosis
from sputum and pure culture
52
present in sputum. This population has been thought to be non-AF Mtb bacilli that might be
in the NRP state. Identifying any of these populations may lead us to a better understanding
of Mtb physiology during transmission. Therefore, in order to identify these phenotypes, it
would be desirable to develop a staining technique that detects all Mtb bacilli in sputum.
A F B +
A F B -
Figure 10: Tubercle sputum sample.
This image shows Mtb heterogeneity in sputum. A (4+) tubercle sputum sample stained with Auramine O AFB staining (green pseudocolour) and Nile-Red neutral lipid staining (red pseudocolour). The image suggests that there are multiple populations of Mtb in sputum: AFB
+ve
population stained with Auramine O and the other population show the same Mtb morphology and decent LB, however, it did not stain with Auramine O. Scale bar 4 µm. Image modified from (Sloan, 2008).
The main aim of this work was to find an effective way to quantify the Mtb populations in
culture and ultimately in sputum samples. To accomplish this objective, techniques were
used in this work to initially assess their ability to detect all Mtb sub-populations in-vitro.
Then, the techniques were applied on sputum samples to detect all Mtb sub-populations ex-
vivo.
Chapter 3. Development of staining techniques to detect M. tuberculosis
from sputum and pure culture
53
3.2. Aims and objectives
The aim of this research was to develop cytological staining techniques that detect and
classify the majority of Mtb cells in a growth culture and sputum samples with particular
reference to their LB content.
The specific objectives were:
1. To investigate the staining of Mtb populations in vitro and in sputum taking
into account:
a. Growth conditions
b. The effects of freezing for storage
c. Use of different reagents including:
i. Auramine O
ii. Antibodies for immunofluorescence
iii. rRNA-directed Peptide Nucleic Acid (PNA) probes
iv. Carbol-Fuchsin detected by fluorescence
v. LipidTox Red and Green Neutral Lipid staining
Chapter 3. Development of staining techniques to detect M. tuberculosis
from sputum and pure culture
54
3.3. Methods
3.3.1. Immunofluorescence staining
3.3.1.1. Direct immunofluorescence (DIF)
Smears from cultures were treated with 1% (w/v) BSA, and sputum slides were treated with
10% (v/v) of Normal Goat serum (NGS) in BSA for 2h to block the non-specific binding.
Smears were then washed 3 times with sterile PBS for 5 min. Immediately after washing, a
1:25 dilution of IgG polyclonal primary Ab (Pab) raised against Mtb H37Rv in an in vivo
infection in 1% (w/v) BSA was added for 1h at 37°C. Subsequently, solutions were removed
and slides were washed 3 times with PBS for 5 min. Blocks were then disassembled and
slides were air dried. Finally, slides were mounted by 10% (w/v) glycerol in PBS and covered
with a glass coverslip and then sealed with nail varnish for microscopy.
3.3.1.2. Indirect immunofluorescence (IIF)
For the secondary Ab, after washing with PBS, 1:500 of an appropriate secondary Ab (SAb)
was added and incubated for 1h at RT. Slides were then washed with PBS 3 times for 5 min.
Blocks were then disassembled and slides were air dried. Finally, slides were mounted by
10% (w/v) glycerol in PBS and covered with a glass coverslip and then sealed with nail
varnish for microscopy.
3.3.2. FISH–PNA staining technique
Mtb bacilli from sputum or pure culture were fixed on slides as described above in Section
2.4. The protocol was carried out by immersing the smears in 80% (v/v) ethanol for 15 min
followed by air drying. Subsequently, 50 µl of the hybridization buffer (Table 8) was added to
the slide and a glass cover slip was carefully lowered onto the slide, taking care not to trap
air bubbles. The slide and coverslip were placed inside a Petri dish (Sterillin, Bargoed) with
wet tissue to ensure a humidified environment. Slides were then incubated in a hybridization
oven in the dark (Appligene, UK) at 55ºC for 90 min. Afterwards, slides were carefully taken
from the oven and immersed in a pre-warmed washing buffer (5 mM Tris.HCl, 15 mM NaCl,
0.1% (v/v) Triton X-100, pH 10) for 30 min at 55ºC in a water bath. Slides were then
immersed in sterile distilled water, air dried, and finally mounted with mounting media and
sealed with nail varnish (Stender et al., 1999).The hybridization buffer was prepared by
combining the solutions shown in Table 10.
Chapter 3. Development of staining techniques to detect M. tuberculosis
from sputum and pure culture
55
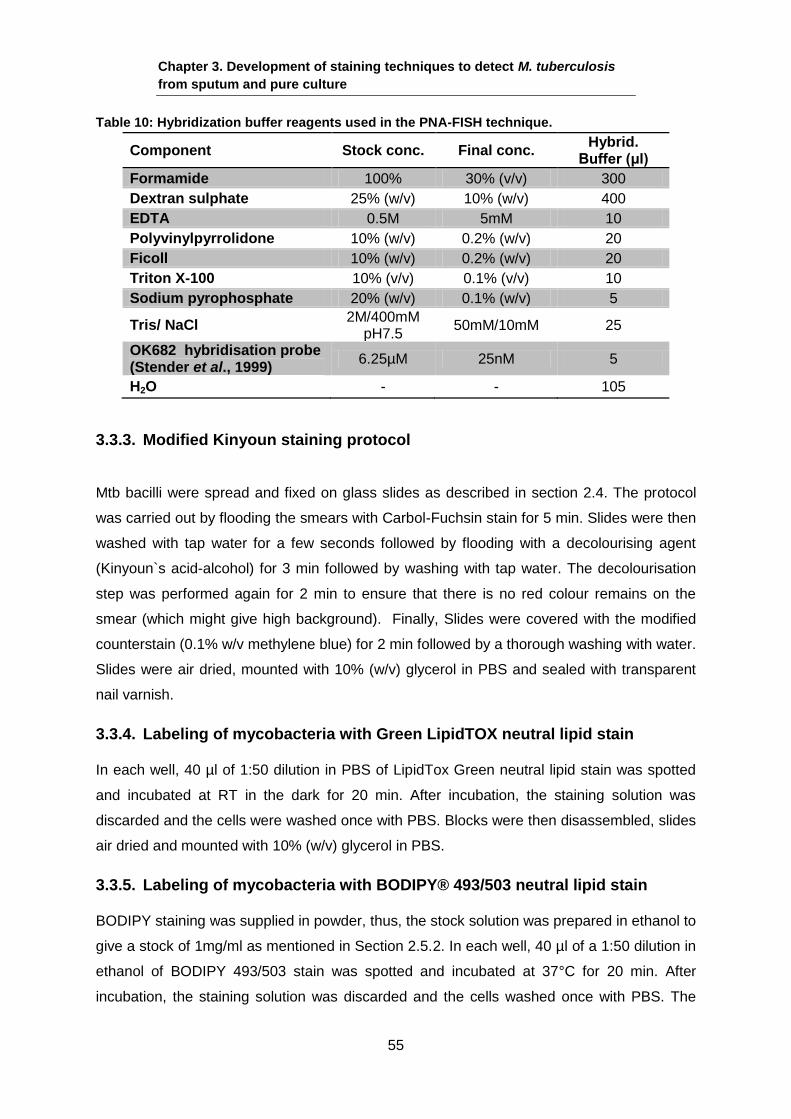
Table 10: Hybridization buffer reagents used in the PNA-FISH technique.
Component Stock conc. Final conc. Hybrid.
Buffer (μl)
Formamide 100% 30% (v/v) 300
Dextran sulphate 25% (w/v) 10% (w/v) 400
EDTA 0.5M 5mM 10
Polyvinylpyrrolidone 10% (w/v) 0.2% (w/v) 20
Ficoll 10% (w/v) 0.2% (w/v) 20
Triton X-100 10% (v/v) 0.1% (v/v) 10
Sodium pyrophosphate 20% (w/v) 0.1% (w/v) 5
Tris/ NaCl 2M/400mM
pH7.5 50mM/10mM 25
OK682 hybridisation probe (Stender et al., 1999)
6.25µM 25nM 5
H2O - - 105
3.3.3. Modified Kinyoun staining protocol
Mtb bacilli were spread and fixed on glass slides as described in section 2.4. The protocol
was carried out by flooding the smears with Carbol-Fuchsin stain for 5 min. Slides were then
washed with tap water for a few seconds followed by flooding with a decolourising agent
(Kinyoun`s acid-alcohol) for 3 min followed by washing with tap water. The decolourisation
step was performed again for 2 min to ensure that there is no red colour remains on the
smear (which might give high background). Finally, Slides were covered with the modified
counterstain (0.1% w/v methylene blue) for 2 min followed by a thorough washing with water.
Slides were air dried, mounted with 10% (w/v) glycerol in PBS and sealed with transparent
nail varnish.
3.3.4. Labeling of mycobacteria with Green LipidTOX neutral lipid stain
In each well, 40 µl of 1:50 dilution in PBS of LipidTox Green neutral lipid stain was spotted
and incubated at RT in the dark for 20 min. After incubation, the staining solution was
discarded and the cells were washed once with PBS. Blocks were then disassembled, slides
air dried and mounted with 10% (w/v) glycerol in PBS.
3.3.5. Labeling of mycobacteria with BODIPY® 493/503 neutral lipid stain
BODIPY staining was supplied in powder, thus, the stock solution was prepared in ethanol to
give a stock of 1mg/ml as mentioned in Section 2.5.2. In each well, 40 µl of a 1:50 dilution in
ethanol of BODIPY 493/503 stain was spotted and incubated at 37°C for 20 min. After
incubation, the staining solution was discarded and the cells washed once with PBS. The
Chapter 3. Development of staining techniques to detect M. tuberculosis
from sputum and pure culture
56
blocks were then disassembled, slides air dried and mounted with 10% (w/v) glycerol in
PBS.
3.3.6. Spiking a sputum sample with M. tuberculosis from culture
Mtb H37Rv cells from a mid-exponential phase with an OD of 1 were spiked with a 3+ AFB
decontaminated frozen sputum sample. The spiking step was done by separating the
sputum sample into two portions, with each portion containing 60 µl. Then, 10 µl of H37Rv
culture was added to the first portion and vortexed for 5 sec. H37Rv was incubated for 30
min at RT to let the H37Rv cells merge with the sputum. The two portions were then spotted
onto glass slides.
3.3.7. Bacterial strains used in the study
This study used Mtb H37Rv laboratory strain as the LB percentage of H37Rv strain is known
to be low at mid-exponential phase under aerated growth condition compared with other
clinical strains, such as Beijing and CH Mtb strains. In contrast, M. bovis BCG is known to
produce LBs even in mid-exponential phase, which is useful for comparing the LB counting
staining techniques. To assess the cross reactivity of IIF and PNA staining techniques, three
bacterial species were used. M. smegmatis was used as it is one of the mycobacterial
species that shares many features with Mtb, such as some surface Ags (He & De Buck,
2010). The other Gram negative bacteria E. coli DH5α and P. aeroginosa were used
because they might be found in sputum in some TB patients.
Chapter 3. Development of staining techniques to detect M. tuberculosis
from sputum and pure culture
57
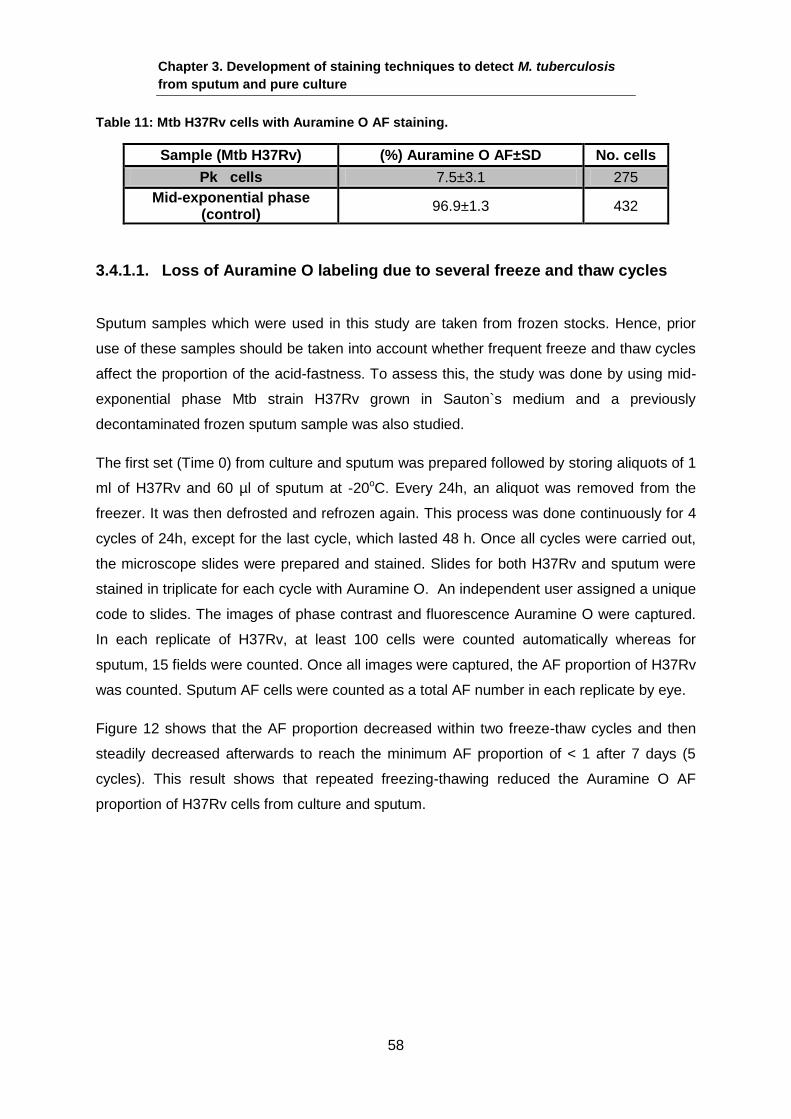
3.4. Results
3.4.1. Studying acid-fastness of M. tuberculosis by Auramine O staining
A combination of multiple stresses has been reported to result in loss of acid-fastness
including low O2, high CO2, low nutrients and acidic pH (Deb et al., 2009). A new observation
that is reported as responsible for low AF proportions of Mtb cells is seen when growth is
done with poor nutrients and a low O2 environment where bacteria form a net to share the
nutrients in the form of biofilm (Ehlers & Schaible, 2012). This condition will be discussed
and studied extensively in Chapter 5 of this thesis.
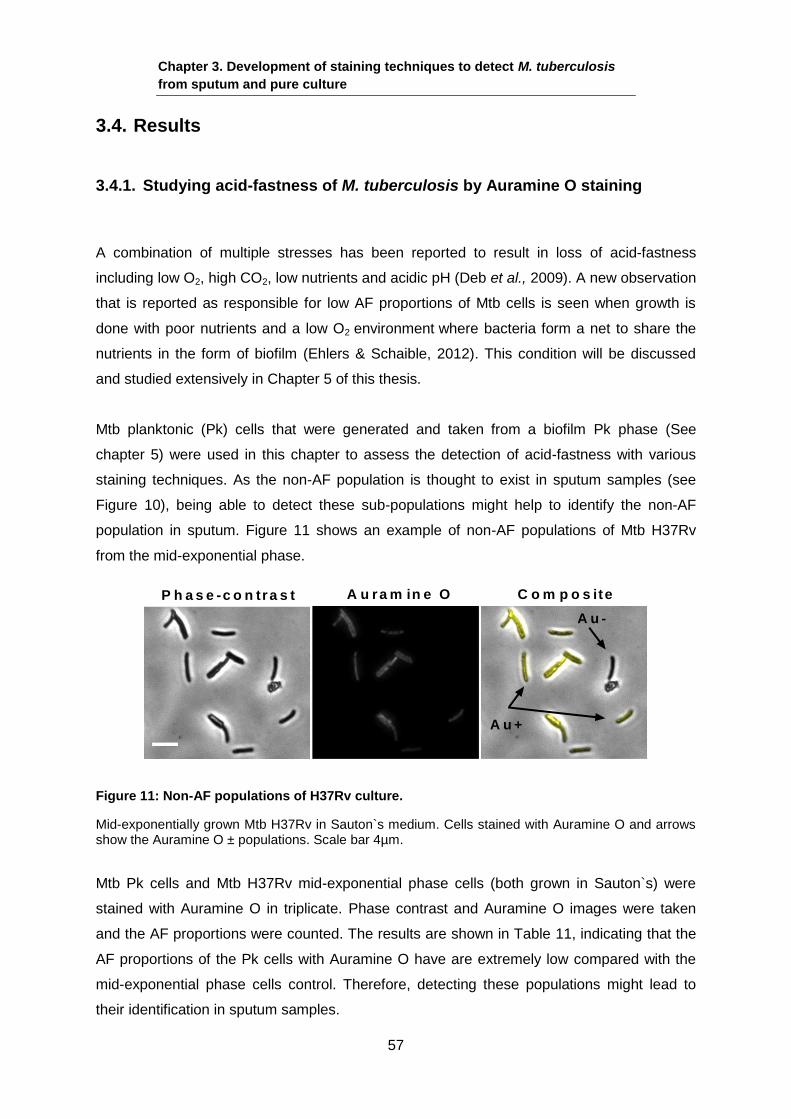
Mtb planktonic (Pk) cells that were generated and taken from a biofilm Pk phase (See
chapter 5) were used in this chapter to assess the detection of acid-fastness with various
staining techniques. As the non-AF population is thought to exist in sputum samples (see
Figure 10), being able to detect these sub-populations might help to identify the non-AF
population in sputum. Figure 11 shows an example of non-AF populations of Mtb H37Rv
from the mid-exponential phase.
P h a s e -c o n tra s t A u ra m in e O C o m p o s ite
A u +
A u -
Figure 11: Non-AF populations of H37Rv culture.
Mid-exponentially grown Mtb H37Rv in Sauton`s medium. Cells stained with Auramine O and arrows show the Auramine O ± populations. Scale bar 4µm.
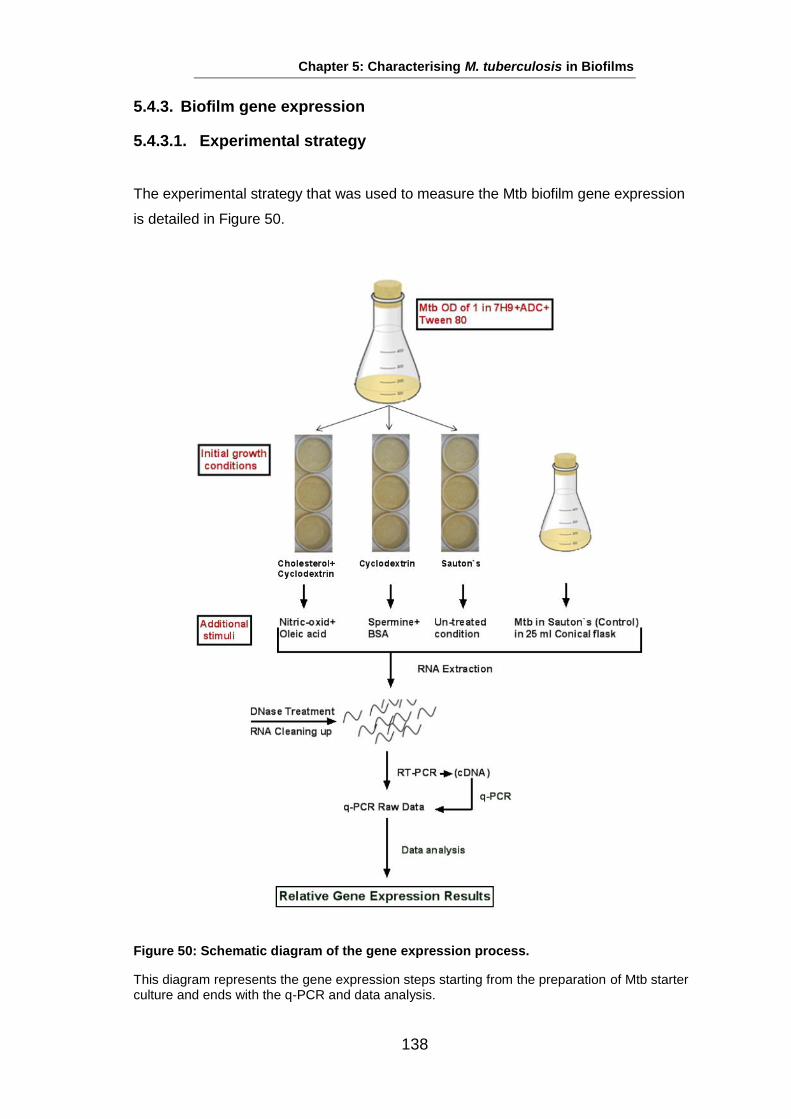
Mtb Pk cells and Mtb H37Rv mid-exponential phase cells (both grown in Sauton`s) were
stained with Auramine O in triplicate. Phase contrast and Auramine O images were taken
and the AF proportions were counted. The results are shown in Table 11, indicating that the
AF proportions of the Pk cells with Auramine O have are extremely low compared with the
mid-exponential phase cells control. Therefore, detecting these populations might lead to
their identification in sputum samples.
Chapter 3. Development of staining techniques to detect M. tuberculosis
from sputum and pure culture
58
Table 11: Mtb H37Rv cells with Auramine O AF staining.
Sample (Mtb H37Rv) (%) Auramine O AF±SD No. cells
Pk cells 7.5±3.1 275
Mid-exponential phase (control)
96.9±1.3 432
3.4.1.1. Loss of Auramine O labeling due to several freeze and thaw cycles
Sputum samples which were used in this study are taken from frozen stocks. Hence, prior
use of these samples should be taken into account whether frequent freeze and thaw cycles
affect the proportion of the acid-fastness. To assess this, the study was done by using mid-
exponential phase Mtb strain H37Rv grown in Sauton`s medium and a previously
decontaminated frozen sputum sample was also studied.
The first set (Time 0) from culture and sputum was prepared followed by storing aliquots of 1
ml of H37Rv and 60 µl of sputum at -20oC. Every 24h, an aliquot was removed from the
freezer. It was then defrosted and refrozen again. This process was done continuously for 4
cycles of 24h, except for the last cycle, which lasted 48 h. Once all cycles were carried out,
the microscope slides were prepared and stained. Slides for both H37Rv and sputum were
stained in triplicate for each cycle with Auramine O. An independent user assigned a unique
code to slides. The images of phase contrast and fluorescence Auramine O were captured.
In each replicate of H37Rv, at least 100 cells were counted automatically whereas for
sputum, 15 fields were counted. Once all images were captured, the AF proportion of H37Rv
was counted. Sputum AF cells were counted as a total AF number in each replicate by eye.
Figure 12 shows that the AF proportion decreased within two freeze-thaw cycles and then
steadily decreased afterwards to reach the minimum AF proportion of < 1 after 7 days (5
cycles). This result shows that repeated freezing-thawing reduced the Auramine O AF
proportion of H37Rv cells from culture and sputum.
Chapter 3. Development of staining techniques to detect M. tuberculosis
from sputum and pure culture
59
0 1 2 3 4 7
0
2 0
4 0
6 0
8 0
1 0 0
0
2 0
4 0
6 0
8 0
1 0 0
1 2 0
1 4 0
T im e (D a y s )
AF
B (
+v
e)%
Au
ram
ine
-O
H3
7R
v
To
tal A
FB
(+v
e)
Au
ram
ine
-O/1
5 fie
lds
sp
utu
m
H 37R v
S pu tum
Figure 12: Effect of several freezing and thawing cycles on H37Rv and Mtb from sputum during five time points.
The graph shows the effect of multiple freeze-thaw cycles on Mtb H37Rv and from sputum. There is a decline in trend of Auramine O acid-fastness with an increase of the number of freeze-thaw cycles over several days. Three H37Rv from mid-exponential phase replicates were processed from each time point and almost 100 cells were counted automatically from each replicate. The average number of AF cells of 4+ sputum sample per 15 fields of view was counted by eye in three replicates of each cycle. Error bars represent the SD of the three replicates.
3.4.1.2. LipidTOX™ Red Neutral Lipid staining development to combine with
Auramine O AF staining
In attempts to detect and identify the Mtb populations in sputum and pure culture, an
Auramine O and LipidTox Red Neutral Lipid (RLx) dual-staining technique was developed. A
late-exponential phase culture M. bovis BCG Glaxo cells was grown in Sauton`s medium.
Cells were then harvested and slides were prepared. The dual staining procedure was done
by staining slides with Auramine O followed by RLx (a neutral lipid stain has an extremely
high affinity for neutral lipid droplets with approximate excitation/emission of 577/609 nm) on
top, slides were air-dried and sealed.
This technique was developed by using specific microscope filters that were selected
carefully to enable imaging of the individual probes (Table 5). Figure 13 shows the AFB BCG
cells with Auramine O (yellow pseudocolour) and the RLx labelling with (red pseudocolour).
Auramine O was taken first followed by RLx, and this preserves the fluorescence signal from
fading.
These results show that Auramine O could not detect most Mtb populations in sputum and
pure culture. Therefore, other staining techniques toned to be developed to detect these
populations.
Chapter 3. Development of staining techniques to detect M. tuberculosis
from sputum and pure culture
60
A u -/L B +
A u + /L B +
A u + /L B -
A u + /L B -
A u -/L B -
A B
Figure 13: Auramine O combination with LipidTOX™ Red Neutral Lipid Staining labelling.
Representative images show Auramine O with RLx staining of M. bovis BCG (Glaxo) late-exponentially grown cells in Sauton`s medium. Image (A) shows the phase contrast, while image (B) shows a composite image with Auramine O/RLx dual staining. The arrows indicate Auramine O fluorescence (yellow pseudocolour) and RLx (red pseudocolour) BCG different cell populations. Scale bars 5 μm.
3.4.2. IF staining Development to detect M. tuberculosis from sputum and
culture
An alternative technique to detect Mtb is immunofluorecence (IF) staining. Although IF has
been used as a diagnostic technique to detect microorganisms in culture and clinical
samples, there are no published studies on Mtb in sputum. Thus, considerable effort was
required to optimize the procedure and manage the challenge of cross reactivity (Ulrichs et
al., 2005). This section shows the developed IF approach to detect Mtb from sputum and
pure culture.
3.4.2.1. Antibody detection of M. tuberculosis from pure culture
Mtb H37Rv cells were grown to the mid-exponential phase prior to labelling them with
Purified Protein Derivative (PPD) Ab. PPD used in this study was boiled, and crude extract
of Mtb H37Rv proteins was taken from filtrates of sterilized and concentrated culture medium
containing 8-12 week old Mtb bacilli (Landi, 1982). H37Rv cells were treated with 23%
formaldehyde vapor. In the current study, a primary rabbit polyclonal PPD IgG antibody was
used. It is known that IIF gives a stronger signal compared to IF (Lamvik et al., 2001).
Therefore, IIF technique was applied using an unlabelled rabbit polyclonal PPD as a primary
Ab (PAb) and Alexa-Fluoro goat anti-rabbit as a secondary antibody (SAb).
Chapter 3. Development of staining techniques to detect M. tuberculosis
from sputum and pure culture
61
Figure 14A shows that when H37Rv cells are labelled directly, heterogeneous antibody
labelling patterns are formed around cells with a lower signal than the more uniform pattern
obtained with IIF (Figure 14B).
A B
Figure 14: Indirect immunofluorescence staining gives better labelling of Mtb in vitro.
The displayed images show a comparison between (A) direct PPD antibody detection of exponentially grown Mtb H37Rv grown in Middlebrook 7H9, which shows a higher background and lower fluorescence signal (assessed by eye), and (B) the same set of cells labeled indirectly with PPD followed by staining with FITC-labeled goat anti-rabbit Alexa-Fluoro SAb, which shows a lower background with a higher fluorescence signal around the cells. Antibody fluorescence fields are exposed. Scale bars 4 µm.
In the current study, four anti-Mtb Abs were assessed. These polyclonal Abs included: Ab
raised in rabbit against H37Rv PPD, Ab raised in rabbit against H37Rv whole cell lysate
(WCL) and Abs raised separately against H37Rv live infection (Rv and CDC1551). The
same preparations of the mid-exponentially grown Mtb H37Rv cells were labelled indirectly
with these anti-H37Rv Abs. Cells were labelled and examined by fluorescence microscopy at
the same time in triplicates for each sample.
The results in Table 12 show that more than 95% of cells were detected with PPD and Rv
Abs, whereas CDC155 and WCL showed a lower detection rate. PPD and Rv Abs were
chosen for further assessment, as they had slightly higher detection rate.
Table 12: M. tuberculosis H37Rv cells detection proportions with anti-Mtb SAb.
Ab (Mtb H37Rv) (%) SAb (+ve)±SD # cells(total triplicates)
PPD 97.3±2.5 251
Rv 99.0±1.0 310
CDC1551 93.6±6.1 301
WCL 91.3±3.0 296
Fluorescence Fluorescence
Chapter 3. Development of staining techniques to detect M. tuberculosis
from sputum and pure culture
62
This table illustrates the PPD, Rv, CDC1551 and WCL Ab detection proportions indirectly with Mtb H37Rv from mid-exponential phase grown in Sauton`s medium. Proportions were taken from the average of approximately 100 cells per slide in three replicates of each. Fluorescently labelled cells were counted manually against the phase contrast.
3.4.2.2. PPD and Rv Antibody detection assessment during M. tuberculosis
growth cycle
Cocito & Vanlinden, (1988) reported that mycobacterial surface antigen levels vary during
the growth cycle. Also, the obvious Mtb characteristic in sputum is the heterogeneity of the
mycobacterial bacilli (Garton et al., 2002, Garton et al., 2008). Hence, it would be expected
that in sputum, Mtb may be found in different growth phases. For this reason, it would be
necessary to assess Ab detection with Mtb from different phases during the growth cycle.
Mtb H37Rv cells in Sauton`s medium were grown to early-exponential phase OD of 0.2, mid-
exponential phase OD of 1, late-exponential phase OD of 1.5 and stationary phase OD of
1.9. Cells from different growth phases were labelled with PPD and Rv Abs. The labelling
was done according to the standard IIF staining protocol in Section 3.3.1.2. Figure 15
reveals that the PPD Ab detects a lower detection proportion of Mtb H37Rv cells in early-
exponential phase, while in other growth phases the Ab has > 90% detection. In contrast,
the Rv Ab shows almost constant detection proportion during all Mtb growth phases.
Therefore, Rv Ab was used for further analysis.
Figure 15: PPD and Rv Ab IF detection proportions in different H37Rv growth phases.
This bar chart shows detection proportions of different growth phases of Mtb H37Rv cells with Rv Ab (open columns) and PPD Ab (grey columns). Each phase was done in triplicate and from each replicate 100 cells were counted. Error bars display standard deviation. Unpaired t-tests were used to compare the antibody proportions. The asterisks designate significant results.
Ear l
y E
xp
Mid
Exp
Late
Exp
Sta
t . p
hase
0
2 0
4 0
6 0
8 0
1 0 0
1 2 0
A n ti-R v A b A n ti-P P D A b
(%)
of
an
tib
od
y d
ete
cti
on **
Chapter 3. Development of staining techniques to detect M. tuberculosis
from sputum and pure culture
63
3.4.2.3. Assessment of non-specific binding of indirect IF with different
bacterial species
The major difficulty in using Ab-based techniques to detect Mtb is the cross-reactivity with
other bacterial strains (Yanez et al., 1986). As such, the final stage of this work is to optimize
the IF technique to detect Mtb from sputum. It is known that a sputum sample contains a
mixture of bacterial and fungal species (McClean et al., 2011). Hence, assessing Ab cross-
reactivity in vitro with a variety of bacterial strains will give an idea of Ab cross-reactivity
performance. The Ab showing the highest detection proportion in all Mtb H37Rv growth
phases was assessed with P. aerginosa, E. coli, and M. smegmatis with Rv Ab.
Samples of P. aerginosa, E. coli, and M. smegmatis were stained indirectly with Rv Ab
according to the standard Ab staining protocol in Section 3.3.1.2. Figure 16 shows that there
is no cross-reactivity between Rv Ab and the other bacterial strains.
P h a s e c o n tra s t F lu o re s c e n c e P h a s e c o n tra s t F lu o re s c e n c e P h a s e c o n tra s t F lu o re s c e n c e
A B C
Figure 16: Rv Ab cross reactivity assessment with different bacterial strains.
The images shown here represent IIF reactions with different bacterial species. A, B and C show Rv
Ab with M. smegmatis mc2 155, E. coli DH5α, and Pseudomonas aerginosa. Scale bar 5 µm.
3.4.2.4. Antibody detection of M. tuberculosis in sputum
A sputum sample classified as (See Table 8) was stained with the IIF technique. It was
observed that when the Mtb from sputum was stained with Rv Ab using the standard IIF
protocol, it shows a high background signal (Figure 17A). In comparison, using a normal
goat serum (NGS) blocking solution, which is widely used in IF staining and where the
secondary antibody was produced in goat, minimises the high background of the sputum
(Figure 17B).
Chapter 3. Development of staining techniques to detect M. tuberculosis
from sputum and pure culture
64
A B
F lu o re s c e n c e F lu o re s c e n c e
Figure 17: Rv Ab labelling on M. tuberculosis from sputum using NGS treatment.
The images represent fluorescence fields of (A) Mtb cells from a (4+) sputum sample labeled
indirectly with Rv Ab with no NGS treatment. (B) The same sample with NGS treatment which
resulted in minimising the high background of sputum. Scale bar 5 µm.
3.4.2.5. IIF staining reveals cross reactivity with non-M. tuberculosis cells in
sputum
Rv Ab was applied on a known AFB-ve sputum sample (from non-TB patient). This sample
was stained with Kinyoun AFB staining (an acid-fast staining which may be targeting nuclic
acids and MAs) visualised under the bright field, and no AFB detected as shown in Figure
18A. It was also stained with Auramine O AFB staining, which showed no AFB bacilli as
depicted in Figure 18B. Nevertheless, Rv Ab shows distinctive labelling patterns of 1-2 µm in
diameter as presented in Figure 18C. These cells do not look like Mtb and this may indicate
cross-reactivity.
Figure 18: Assessment of Rv Ab cross reactivity in sputum.
The fluorescence images show a known AF negative sputum sample stained with (A) Kinyoun (X1000 magnification), (B) Auramine O AF staining and (C) Rv Ab staining. All three images were taken from the same sample. These images indicate the cross reactivity of Rv antibody with sputum contents. Scale bar 5 µm.
F lu o re s c e n c e A u F lu o r e s c e n c e R v A bB r ig h t-f ie ld (K in y o u n )
A B C
Chapter 3. Development of staining techniques to detect M. tuberculosis
from sputum and pure culture
65
3.4.2.6. Detection proportion of M. tuberculosis from spiked sputum
To assess the detection of Ab, H37Rv from mid-exponential phase culture was spiked into a
known AFB+ve sputum sample. Unspiked sputum was used as a control sample as described
in Section 3.3.6. Both samples were stained with IIF wheras Auramine O was applied on on
un-spiked sputum sample only. The Mtb counting was done on 10 fields manually by eye.
The results in Figure 19A show a significantly higher detection of Mtb cells with Rv Ab from
spiked sputum compared with lower detection of Ab with the unspiked sputum. This result is
shown clearly in Figure 19B. In Figure19B, the bright Ab labelling is may be due to Mtb
clumps or non-specific labelling with the sputum contents.
These results show that the total detection number is much lower for IIF compared to
Auramine O in sputum sample. Hence, further studies are required to develop another
staining technique targeting another property of Mtb cell.
Au
sputu
m+R
v
Sputum
0
100
200
300
400
500
600
700
Sputum
To
tal d
ete
cti
on
/10 f
ield
s
***
***
***
Spiked Unspiked
A B
Ab+Ab+
Auramine O
Figure 19: Detection of M. tuberculosis in spiked sputum sample using Rv-Ab.
Mtb from spiked and unspiked sputum were detected with Rv-Ab. (A) shows the total cells count of Auramine O and Rv-Ab with both spiked and unspiked sputum all per 10 fields. (B) Shows composite images of phase contrast (grey) and the fluorescence field (green) of unspiked and spiked sputum and Auramine O fluorescence field. Scale bar 5 µm.
3.4.3. PNA Probe-FISH staining development to detect M. tuberculosis from
sputum and growth culture
In order to pursue more specific and sensitive detection and differentiation of Mtb cell states
from tissue and smears, recent research efforts have looked at peptide nuclic acid (PNA)
probes (Stender et al., 1999). PNA are described as pseudo-peptides having the capability
Chapter 3. Development of staining techniques to detect M. tuberculosis
from sputum and pure culture
66
to bind with DNA (Stender et al., 1999). The nucleobases of the PNA are covalently bonded
with the polyamide backbone of N-(2-aminoethyl) glycine units; this polyamide backbone
gives it a relative hydrophobic character compared to that of DNA (Egholm et al., 1993). This
characteristic allows the PNA probes to diffuse through the hydrophobic cell envelope of
mycobacteria under conditions that do not lead to disturbance of the bacterial structure
(Stender et al., 1999). Because of all these characteristics, PNA probes were used in the
detection of Mtb from sputum and growth culture.
3.4.3.1. PNA detection of M. tuberculosis from culture
In the current study, after extensive work to optimize use of FITC labelled OK682 probe,
which targets the 23S rRNA successful hybridization to H37Rv cells was obtained. As shown
in Figure 20, mid-exponential phase H37Rv cells in Sauton`s medium were detected by
FISH using the OK682 probe. PNA probe labelling of Mtb cells (Figure 20A) shows a
characteristic spotted accumulation. However, not all cells are equally labelled, spotted
distribution and more intense labelling is obvious in two cells. In contrast, the control sample
(Figure 20B), shows the background fluorescence.
Phase contrast Fluorescence
A
B
Figure 20: M. tuberculosis sample stained with OK682 FISH-PNA.
The images shown represent OK682 PNA-FISH staining of Mtb H37Rv mid-exponential phase cells. (A) Shows H37Rv cells labelled with OK682 targeting 23S rRNA. (B) Shows H37Rv negative control with d.H2O instead of the probe. Scale bar 5 µm.
Chapter 3. Development of staining techniques to detect M. tuberculosis
from sputum and pure culture
67
3.4.3.2. Assessment of the PNA cross-reactivity with different bacterial species
As presented above, spot accumulation is the marker of PNA labeling of some Mtb cells.
Prior to applying the PNA probes on Mtb from sputum, it was necessary to assess probe
specificity. Thus, OK682 was applied to Gram-negative Pseudomonas aerginosa (P.
aerginosa) and E. coli DH5α, and fast-growing M. smegmatis mc2 155. The results show a
limited (faint) labeling of the OK682 probe in Figure 21A with M. smegmatis mc2 155. P.
aerginosa and E. coli DH5α in (Figure 21 B&C) showed no labelling with the PNA probe as
expected.
P h a s e c o n tra s t F lu o re s c e n c e
A B C
P h a s e c o n tra s t F lu o re s c e n c e P h a s e c o n tra s t F lu o re s c e n c e
Figure 21: OK682 PNA probe cross reactivity assessment in bacterial pure cultures.
The example images represent an OK682 PNA probe reaction with different bacterial species. A, B, C
show OK682 probe with M. smegmatis mc2 155, E. coli DH5α, and P. aerginosa, respectively. Phase
contrast (where applicable) is illustrated, along with PNA fluorescence images. Scale bars are 5 µm.
3.4.3.3. PNA detection of M. tuberculosis from sputum
The detection of Mtb in sputum requires a highly-specific and sensitive technique in order to
pick up the majority of Mtb populations in sputum. Previously, PNA probes were developed
to detect Mtb from sputum samples and paraffin-embedded tissues (Stender et al., 1999). As
here, OK682 was applied on Mtb cells from 4+ sputum samples. There was much effort put
into optimizing the PNA-FISH technique and Stender published a protocol to label Mtb from
sputum. Subsequently, however, attempts at labelling using the published protocol were
unsuccessful. Later efforts with Stender`s protocol applied to sputum and pure culture was
done by modifying the PNA probe concentration (Table 8). The Mtb bacilli from sputum have
similar to labelling of the in vitro culture and spotty appearance when labelled with an OK682
probe as shown in (Figure 22A), compared with no labelling with the d.H2O control (Figure
22B). To make a comparison with the modified and published protocol, (Figure 22C) shows
the results of following Stender`s published protocol and (Figure 22D) shows the negative
control with d.H2O instead of the probe, which is similar.
Chapter 3. Development of staining techniques to detect M. tuberculosis
from sputum and pure culture
68
A B
C D
Figure 22: Sputum sample stained with OK682 probe.
The images represent the modification of a PNA-FISH staining protocol in tubercle sputum. (A) The modified protocol shows localisation spots of the OK682 probe targeting 23S rRNA of Mtb cells. (B) Shows the negative control of the modified protocol (d.H2O instead of the probe) showing no fluorescence localisation of 23S rRNA. (C) Shows OK682 labelling with Stender`s published protocol, whereas (D) is the negative control sample from Stender`s published protocol (d.H2O instead of the probe). Scale bar 5 µm.
3.4.3.4. Lysozyme treatment
Lysozyme (10mg/ml) at 37°C for 1h of incubation was applied on two 4+ decontaminated
frozen sputum samples before hybridisation in an attempt to improve the penetration of the
OK682 probe. Counting was done manually by eye in 25 fluorescence field for samples with
and without lysozyme treatment. The average detection number was then calculated. The
results in Figure 23 show that lysozyme treatment was able to significantly enhance the
detection proportion of the OK682 probe with a hybridisation time of 90 min at 55°C.
Chapter 3. Development of staining techniques to detect M. tuberculosis
from sputum and pure culture
69
1 2
1 0
2 0
3 0
4 0
Av
era
ge
de
tec
tio
n/2
5 f
ield
s
L y s o z y m e +
L y s o z y m e -
*
*
Figure 23: PNA detection averages on M. tuberculosis from sputum using lysozyme treatment.
This bar chart shows the average cell detection rate in two (4+) sputum samples stained with an OK682 probe with lysozyme treatment (open columns), and without lysozyme treatment (grey columns). The results show the average of three replicates of each sample with 25 fields of view and were counted in each replicate. PNA proportions were counted by eye in triplicates for each sample. The error bars show standard deviation. Paired t-tests were used to compare lysozyme and no-lysozyme treatment proportions. The asterisks designate significant results.
3.4.3.5. Assessing OK682 for the detection of M. tuberculosis in sputum
To assess the detection proportion of the OK682 PNA probe, H37Rv from a mid-exponential
phase culture was spiked into a known AFB+ve sputum sample. Unspiked sputum was used
as a control sample as described in Section 3.3.6. The OK682 probe was hybridized to Mtb
smears and images were taken from 10 fields of views for both spiked and unspiked sputum.
Figure 24A shows a significant difference in the total detection number per 10 fields between
spiked and unspiked sputum. This difference suggests that an OK682 probe detects
significantly more cells from the mid-exponential phase growth than Mtb from sputum (Figure
24B).
PNA detection of Mtb from sputum showed higher total detection number compared to IIF.
However, in comparison with Auramine O, PNA failed to detect higher number of Mtb in
sputum. Thus, the development of another staining technique to detect higher number of Mtb
populations in sputum is necessary.
Chapter 3. Development of staining techniques to detect M. tuberculosis
from sputum and pure culture
70
Au
Sputu
m+R
v
Sputum
100
200
300
400
500
600
700
To
tal
PN
A d
ete
cti
on
/10
fie
lds ***
***
***
A BSpiked Unspiked
PNA+ PNA+
Auramine O
Figure 24: Detection of M. tuberculosis in spiked sputum sample using OK682 PNA probe.
Mtb from both spiked and unspiked sputum were detected with OK682. (A) Shows the total cell count of OK682 with both spiked and unspiked sputum per 10 fields. (B) Shows composite images of phase contrast (grey) and a fluorescence field (green) of spiked and unspiked sputum in addition to Auramine O fluorescence field of the same sample. Scale bar 5 µm.
3.4.4. Kinyoun staining development to detect M. tuberculosis populations
from sputum and pure culture
A central aim of this work has been to develop a staining technique to detect all or at least
the majority of Mtb populations from sputum. By developing this technique, it will be possible
to identify Mtb sub-populations. Research has demonstrated that Auramine O has similar
sensitivity and specificity to Z-N staining (Ba & Rieder, 1999 and Steingart et al., 2006). As
shown earlier in this chapter, however, there are apparent Mtb populations that show distinct
LBs and they have a similar Mtb cell morphology, but they are non-Auramine O AF.
3.4.5. M. tuberculosis detection with a fluorescence Kinyoun AF staining
technique
Because Kinyoun staining does not require heating it is easier and safer to perform than Z-N
(Kinyoun, 1915). Thus, Kinyoun AF staining, which uses a higher concentration of phenol
than Z-N, increases the penetration of fuchsin; with the result that staining can occur at room
temperature (Kinyoun, 1915). Shapiro et al., (2008) modified the Z-N technique for use as a
fluorescence staining method to detect Mtb from sputum (Shapiro and Hänscheid, 2008). A
Chapter 3. Development of staining techniques to detect M. tuberculosis
from sputum and pure culture
71
modified Kinyoun AF staining technique as a fluorescence staining method to detect Mtb
from sputum and pure cultures with approximate excitation/emission of 546/590 nm, was
applied here.
The Pk biofilm cells (cultured in Sauton`s medium) are characterised by a low Auramine O
AF proportion (3%-14%), thus they were used to measure Kinyoun staining sensitivity. Mid-
exponential phase Mtb strain H37Rv cells grown in Sauton`s medium were used as a
positive control. Slides were then prepared in triplicates and stained with the modified
Kinyoun staining technique (3.3.3) and at least 100 cells were counted in each replicate.
Figure 25A shows the Pk Mtb cells with Kinyoun, which detects almost 99% of Mtb bacilli
out of 475 cells compared with phase contrast (Table 13). Figure 25B shows the control cells
from a mid-exponential phase with Kinyoun, which detects almost 100% of the Mtb bacilli out
of 645 cells compared with phase contrast (Table 13). Additionally, Kinyoun staining was
applied on Mtb cells from sputum in Figure 25C. These results show that fluorescent
Kinyoun AF staining shows a higher detection proportion with the already known non-
Auramine O AF Pk Mtb cells.
FluorescencePhase contrast
A
B
C
Chapter 3. Development of staining techniques to detect M. tuberculosis
from sputum and pure culture
72
Figure 25: M. tuberculosis H37Rv cells with Kinyoun fluorescence AF staining.
The images show Kinyoun stained Mtb H37Rv cells. Image (A) shows mid-exponential H37Rv cells with fluorescence Kinyoun, (B) shows Pk Mtb cells with fluorescence Kinyoun staining whereas (C) shows the fluorescence Kinyoun with Mtb cells from sputum. The microscopic images were captured using phase contrast and fluorescence microscopy (TexasRed filter). Scale bar 5 µm.
Table 13: Kinyoun AF proportions in Mtb from growth culture.
Sample (Mtb H37Rv) AF+ve (%)±SD # cells
Pk cells 98.9±1.2 475
Mid-exponential phase 99.7±2.4 645
The table shows the AF proportions of mid-exponential phase and Pk Mtb H37Rv cells with fluorescence Kinyoun staining. AF proportions were counted in triplicate for each sample (almost 100 cells per slide).
3.4.6. BODIPY (493/503) staining shows no localisation of labelling to lipid
bodies
BODIPY (BD) is a neutral lipid due to its nonpolar structure and long-wavelength absorption
with approximate excitation/emission of 493/503 nm with cell-permeable lipophilic molecule
(Listenberger & Brown, 2007). It can emit bright green fluorescent and red fluorescent
alternatives. BD fluorophores differ from RLx and GLx in fluorescence stability (Chen et al.,
1998).
Late-exponential phase M. bovis BCG Glaxo cells were grown in Middlebrook 7H9 medium.
The dual staining procedure was done by staining both test and control slides (each in
triplicates) with Kinyoun staining. The slides were then allowed to air dry. The lipid staining
for test slides with BD and control slides with GLx were done according to the protocol in
Section 3.3.4. Images were taken for both Kinyoun/BD and Kinyoun/GLx.
Figure 26 shows example images of BD and GLx LB localization in the BCG cells in
combination with Kinyoun staining. Figure 26A shows BD labeling of BCG cells that reflect
poor LB labeling compared with GLx labeling of BCG cells from the same culture in Figure
26B. Thus, BD lipid staining shows poor labeling on BCG cells compared with the GLx lipid
staining.
Chapter 3. Development of staining techniques to detect M. tuberculosis
from sputum and pure culture
73
Figure 26: BODIPY Neutral Lipid Staining labelling in combination with Kinyoun.
The images show lipid staining localisation on BCG cells in combination with Kinyoun. The images show M. bovis BCG (Glaxo) late-exponential phase grown in Middlebrook 7H9 medium. Image (A) shows BCG cells with Kinyoun/BD staining, whereas image (B) shows control BCG cells with Kinyoun/GLx dual staining. The cells were stained and imaged with lipid staining at the same time. An image of Kinyoun fluorescence (red pseudocolour) is overlaid on the BD or GLx (green pseudocolour) image. Scale bar 5 μm.
3.4.7. Comparison between neutral lipid staining techniques to identify the LB
M. tuberculosis sub-populations
To identify LB sub-populations from sputum and in vitro culture, it is crucial to choose a
reliable technique to detect and identify the LBs in combination with modified Kinyoun
staining. This was especially the case when choosing between the two green LB staining
options of BD and LipidTox Green neutral lipid neutral lipid staining (GLx, a neutral lipid stain
has an extremely high affinity for neutral lipid droplets with approximate excitation/emission
of 495/505 nm). For a direct comparison of neutral lipid staining techniques, late-exponential
phase M. bovis BCG strain Glaxo cells were grown in Sauton`s medium. The cells were then
harvested and slides were prepared according to the protocol in Section 2.4.1. Slides were
prepared in triplicate for each staining technique and LB staining was applied for each
staining technique at the same time.
At least 100 cells were counted in each replicate. Figure 27A shows that there was a
significant difference between the LB detection proportion between of RLx and BD and GLx
and BD. Almost 50% of the cells with LB+ve were undetected by the BD lipid staining in
comparison with RLx and GLx. Figure 27B shows images of the different neutral lipid
labeling of BCG cells from the same culture.
A B
Chapter 3. Development of staining techniques to detect M. tuberculosis
from sputum and pure culture
74
Figure 27: Lipid body proportions comparison between neutral lipid staining on M. bovis BCG cells.
Bar chart (A) shows proportions of LB+ve
cells of late-exponential phase BCG labelled with RLx, GLx and BD neutral lipid staining techniques. The results indicate that RLx and GLx LB
+ve cell proportions
are significantly higher than BD staining. Selected cells in (B) were then converted to LUTs to show the LB localization clearly. Asterisks designate significant results (P < 0.01).
3.4.8. Comparison between Kinyoun, Auramine O, immunofluorescence and
PNA staining techniques to detect M. tuberculosis
The main objective of this chapter was to develop a staining technique to detect as larger
proportion of Mtb in sputum and pure culture as possible. Four different staining techniques
were used in this study: IIF with Rv Ab, PNA-FISH with the OK682 probe, Auramine O, and
fluorescence Kinyoun AF staining. Each one of these techniques targeted a specific property
of the Mtb cell.
Multiple Mtb populations within sputum samples were detectable with Auramine O, but not
by the other techniques. Pk non-Auramine O AF cells were used in the assessment of the
staining techniques. Hence, when there were a higher proportion of non-AF cells detected,
the more reliable particular staining technique was needed to be for the detection of a
greater proportion of the total Mtb cells in sputum. For this reason, PK cells from Mtb
H37Rv biofilm (non-AF cells) were stained with the four staining techniques in triplicate for
each staining series. A comparison was also done on Mtb cells from sputum using the four
staining techniques. Cells which were labeled with the IF and PNA techniques were counted
manually. At least 100 cells were counted from each replicate. Mtb cells from sputum were
counted by the Mtb total cell number/15 field of view by eye in triplicate (45 fields in total for
each staining technique).
A B CRL
x
GL
xB
D
4 0
6 0
8 0
1 0 0
LB
Pe
rc
en
tag
e % **
**
R L x G L x B D
A B
Chapter 3. Development of staining techniques to detect M. tuberculosis
from sputum and pure culture
75
Figure 28 shows the detection of Pk cells according to the four different staining
techniques. Auramine O AF staining detects the lowest proportion at < 20% of Pk cells,
whereas PNA staining detects almost 50% of Pk cells. IF staining detects about 90% of Pk
cells, which is high detection proportion. However, Rv Ab shows non-specific binding with
non-Mtb sputum cells. Fluorescence Kinyoun AF staining shows nearly 100% detection of
Pk cells with very low SD, which is the highest detection proportion. Furthermore, results
from sputum show that the highest total cell number is counted by fluorescence Kinyoun
staining, whereas the Ab staining shows the lowest number of detection. Auramine O is
significantly lower than Kinyoun staining, which indicates that Kinyoun is more specific than
Auramine O. The detection levels with PNA are slightly higher than with IIF. Hence,
fluorescence Kinyoun staining is considered the staining technique that best detects the
greatest proportion of Auramine non-AF Mtb cells.
Kin
A
uA
b
PN
A
0
2 0
4 0
6 0
8 0
1 0 0
0
1 0 0
2 0 0
3 0 0
4 0 0
5 0 0
6 0 0
7 0 0
8 0 0
S ta in in g
(%)
De
tec
tio
n o
f H
37
Rv
Pk
bio
film
ce
lls
To
tal d
ete
ctio
n o
f ce
lls in
sp
utu
m #
10
3/1
5 fie
lds
P K
S p 1 0 3
Figure 28: M. tuberculosis cells detected by different staining techniques.
Comparison between fluorescence Kinyoun, Auramine O, IIF(Rv Ab) and PNA-FISH (OK682) probe staining techniques to detect Pk non-AF Mtb H37Rv cells (hatched columns) and Mtb from sputum #103 (grey columns). Pk cells were counted in triplicates and almost 100 cells were counted in each replicate, Auramine O and Kinyoun stained cells were counted using image-J based software whereas PNA and IIF stained cells were counted by eye. Mtb from sputum were counted as a total detection number per 15 fields of view in triplicates by eye for all staining techniques, then the average and SD was calculated from the three means for each replicate.
Figure 29 shows a summery image of the detection of Mtb bacilli from the same sputum
sample. Image A shows the Auramine O labelling of Mtb, which is much less than the
Chapter 3. Development of staining techniques to detect M. tuberculosis
from sputum and pure culture
76
Kinyoun staining detection on image B, which is from the same sputum sample. Image A
shows three Mtb populations (Au+ve/LB+ve, Au+ve/LB-ve and Au-/LB+ve), whereas image B
shows two populations from the same sample (Kin+ve/LB+ve and Kin+ve/LB-ve). Thus, in a
comparison with Figure 10 in the introduction of this chapter, which shows LB+ve /AFB-ve
populations with image A & B in Figure 29, it can be seen that these populations are
detected with fluorescence Kinyoun where there is no AFB-ve /LB+ve.
A u + /L B +
A u -/L B +
K in + /L B +
K in + /L B -
A B
A u + /L B -
Figure 29: Tubercle sputum sample.
The images show Mtb heterogeneity in the same 4+ sputum sample. (A) Shown Mtb cells with Auramine O (yellow pseudocolour) and RLx (red pseudocolour), whereas (B) shows Mtb cells with Kinyoun (red pseudocolour) and GLx (green pseudocolour). Both images were taken from the same sample with different staining techniques. The images suggest that there are multiple populations of Mtb in sputum that were not detected with Auramine O, but were detected with Kinyoun staining. Scale bar 5 µm.
Chapter 3. Development of staining techniques to detect M. tuberculosis
from sputum and pure culture
77
3.5. Discussion
3.5.1. Studying acid-fastness of M. tuberculosis by Auramine O staining
Auramine O staining is widely used in research and clinical laboratories around the world
(Steingart et al., 2006). This technique requires limited effort as the protocol does not require
heating, in contrast to Z-N staining. Auramine O has also shown a higher sensitivity for
detection of Mtb than transmitted light Z-N and Kinyoun staining (Sawadogo et al., 2012).
However, some reports showed that the transmitted light of Z-N was more sensitive for the
detection of Mycobacterium paratuberculosis than Auramine O (Huntley et al., 2005). Both
techniques have lower specificity for the detection of Nocardia and Corynobacteria (Shinnick
& Good, 1994). In this study all the sputum samples were already clinically diagnosed as
Mtb samples.
Many conditions are responsible for the loss of acid-fastness. In multiple stress model Mtb
was incubated under several conditions including low O2, 5% CO2, low nutrient and acidic
pH which resulted in loss of acid-fastness (Deb et al., 2009). The existence of a non-AF Mtb
phenomenon is well recognised (Mudd & Mudd, 1927). There are several mechanisms that
affect AF staining and result in the forming of non-AF Mtb cells, such as cell wall disruption
(Yegian & Porter, 1944), UV irradiation (Murohashi & Yoshida, 1965), the lack of the growth
nutrients or starvation (Nyka, 1974), mycobacteriophage infection (Gangadharam & Stager,
1975), cell wall alteration resulting in changes in mycolic acid (MA) content (Yuan et al.,
1998, Bhatt et al., 2007a) and isoniazid exposure (Bhatt et al., 2007b). Recently, it was
shown that a decontamination step with N-Acetly-L-Cysteine (NALC) decontamination with
NaOH to thinned sputum samples significantly reduces the mycobacterial acid-fastness
(Garton et al., 2008). Also, it was also shown that dry heating the sputum and culture smears
in a heat block might alter the cell wall and as a result reduce acid-fastness (Gokhale et al.,
1990). Therefore, the acid-fastness could be affected and lost by many mechanisms which
require an alternative staining technique for the identification of Mtb bacilli. The mechanism
of the acid-fastness mechanisms was discussed in Section 1.4.1.
Another avenue explored in this project was to study the effect of multiple freeze-thaw cycles
on the AF proportion. The current study shows that multiple freeze-thaw cycles over a 24h
freeze time sharply reduced the acid-fastness of cells from Mtb H37Rv culture and sputum
samples. A previous study done by Bell, (2013) showed that the acid-fastness of the Mtb CH
strain was substantially reduced. Due to the extended freezing time of this study (24h), large
Chapter 3. Development of staining techniques to detect M. tuberculosis
from sputum and pure culture
78
ice crystals were developed in freezing and subsequent thawing which affected the cells wall
integrity and subsequent AF staining. The effect of freezing-thawing cycles seems to
permeabilise the Mtb cells from culture and sputum.
Furthermore, the sputum sample that was used in this study was already decontaminated,
which is an additional reduction factor for acid-fastness. This was studied by Nyka (1971),
who showed that Z-N AF staining is destroyed by reduction, and that the Mtb bacilli can be
recovered again by oxidation.
Another limitation of this study is that counting the AF cells from sputum was done manually
by eye in contrast with the cells from culture, which was counted by computer software.
However, the bias rate of the manual count is not high, as the AF and non-AF bacilli are
reasonably clear and can be differentiated. Overall, it is preferable to examine clinical
samples for AFB prior to freezing, as the result will be significantly affected by freeze-thaw
cycles.
The other staining methods that are available to detect Mtb include PNA-FISH (Stender et
al., 1999 and Lefmann et al., 2006) and IF staining (Brozostec A et al., 2009 and Ryan et al.,
2010). AF staining, however, is the most commonly used in clinical laboratories (Ulukanligil
et al., 2000). None of these methods are known to detect all Mtb populations in sputum.
Thus, it is necessary to develop a staining method to show a higher detection of these
populations in sputum.
3.5.2. Immunofluorescence application to detect M. tuberculosis
Initially, four anti Mtb Abs techniques that were directed towards the Mtb surface Ags such
as RV, PPD and CDC1551 Abs and WCL Ab which directed towards whole cell lysate, were
applied on H37Rv culture from a mid-exponential phase. PPD and WCL Abs were prepared
in vitro and then injected into Guinea pigs to produce polyclonal Abs. CDC1551 and WCL
Abs showed a slightly lower detection against the Mtb H37Rv strain in comparison to PPD
and Rv Abs. WCL Ab was used in another study that showed that this Ab does not detect
the complete set of H37Rv populations at a mid-exponential phase (Ryan et al., 2010). The
study also suggested the reason for the incomplete detection was the late-exponential phase
growth used for immunisation, which might miss mid-exponential phase Ags. Another reason
might be due to masking of surface Ags by the polysaccharide-rich capsule (Ortalomagne et
al., 1995). Additionally, PPD antibody was not be able to detect the majority of H37Rv cells
Chapter 3. Development of staining techniques to detect M. tuberculosis
from sputum and pure culture
79
in the early-exponential phase in this study, which means that the Mtb surface Ags at this
stage may be different to the phase of growth used for the production of PPD.
In a study examining the ability of the Mtb to accumulate and utilise cholesterol, the same
PPD Ab was not able to detect Mtb cells cultured with cholesterol (Brozostec et al., 2009).
The cholesterol may mask the Mtb cell surface Ags preventing detection by the Ab. This
finding potentially explains why IIF could not detect the majority of Mtb populations from
sputum which is known to have high cholesterol content (Garton, personal communication).
However, the exact reasons for why IIF does not detect the complete set of Mtb populations
remain unknown (Ryan et al., 2010).
Through this study, IIF succeeded in detecting the majority of H37Rv cells in pure culture. In
sputum on the other hand, it was noticed that when the Rv-Ab was used with a 4+ sputum
sample, the number of bacilli per field was lower compared with cells detected with
Auramine O staining. Therefore, a spiked sputum sample was used with the IIF. The results
showed that Mtb bacilli from sputum display different surface Ags than Mtb from culture, as
the spiked sputum sample showed a significantly higher detectable cell number than
unspiked.
Ag60, the essential constituent of tuberculin, reaches the highest level at the stationary
phase, whereas in the early-exponential phase, it is secreted in low levels (Harboe, 1981).
An analysis of differentially expressed proteins in mid-exponential, early-stationary and late-
stationary H37Rv growth phases showed that ten proteins are differentially expressed in the
late-stationary phase, but not in the other phases (Ang et al., 2013). These studies are
consistent with the finding that H37Rv labelled differently with Anti-PPD in early-exponential
phase from the other growth phases.
3.5.3. PNA-FISH application to detect M. tuberculosis
In this study it was shown that the OK682 probe detects Mtb from culture and sputum
samples. However, some H37Rv populations in culture lack a fluorescence signal and are
not detected. Also, the mycobacterial ribosomal genes are simultaneously downregulated
with the cessation of growth (Trauner et al., 2012), this was also shown with mid-exponential
phase Mtb cells in the current study. The rRNA number in the earlier exponential phase
increases in contrast to the number in the stationary phase, which decreases (Verma &
Chapter 3. Development of staining techniques to detect M. tuberculosis
from sputum and pure culture
80
Davidson, 1994). In the formation of NRP populations, these populations might have
downregulated 23S rRNA. As a result, the OK682 probe would give a low signal when
hybridized to NRP Mtb populations.
The insufficient signal of the PNA probes is a significant problem. This may reflect
downregulation of the rRNA in the bacterial cell during the NRP stat (Amann et al., 1995).
Another reason for the lack of the PNA signal may be the insufficient accessibility of the
target probe into the mycobacterial cells (Amann et al., 1995). Lysozyme is a N-
acetylmuramide glycanhydrolase, which is a glycoside hydrolyses agent (Say et al., 2012)
that hydrolyses the glycosidic bonds of the bacterial peptidoglycan (Bidnenko et al., 1998).
By using this permeabilising agent, an improvement the PNA labelling average was made
and the detection number increased.
Many Mtb cells in sputum were not detected with the OK682 probe in this study, possibly
because their rRNA was low (Garton et al, 2008; Trauner et al., 2012).Use of sputum spiked
with H37Rv cells in mid-exponential phase supported the hypothesis that unlabelled sputum
bacilli had low rRNA content.
A study was done to reveal the multiple Mtb populations in mouse and Guinea pig tissues
revealed that FISH yielded a stronger signal of single strand DNA (ssDNA) probes targeting
16S rRNA on H37Rv under a hypoxic condition, a weak signal from mouse, and failure to
detect Mtb from Guinea pig (Ryan et al., 2010). Ryan et al., (2010) suggested that the failure
of the nucleic acid probes to detect Mtb from Guinea pig tissue as arising from the number of
rRNA in necrotic tissue, which is below the limit of FISH detection. Additionally, the cell wall
might have been altered and became less permeable to the nucleic acid probes (Ryan et al.,
2010). All these findings of FISH on mouse and Guinea pig tissues might justify the variation
on the detection percentages between sputum and pure culture.
The PNA detection results from this project on Mtb from sputum were similar to the FISH
results of Ryan on a mouse in vivo model, where the signal is weaker than the in vitro
culture. Although, the reported high sensitivity and specificity of PNA probes to detect Mtb in
sputum (Stender et al., 1999), the current study showed a limited detection of Mtb by the
OK682 PNA probe in sputum. Therefore, it continues to be necessary to find a staining
technique that is able to detect the majority of Mtb populations in sputum.
Chapter 3. Development of staining techniques to detect M. tuberculosis
from sputum and pure culture
81
3.5.4. Fluorescence Kinyoun staining to detect M. tuberculosis from sputum
Many Mtb positive samples by culture are not positive by Z-N (Dewit et al., 1992). The first
reason for this is because the Z-N staining detection limit is 104 bacilli per ml or slide (Allen,
1992 and Marks, 1974). It is also proposed that Z-N staining fails to accurately detect Mtb
from clinical samples due to the alteration of the mycobacterial cell envelope infection (Seiler
et al., 2003).
In the current study it was shown that Auramine O detects some, but not all Mtb populations
in sputum and pure culture. With Auramine O/LB dual staining, however, there are LB+ve
populations observed that are morphologically similar to Mtb and yet are AF-. Additionally, in
culture Auramine O is not able to detect more than 90% of the non-AF populations.
Although, recent studies have shown that the sensitivity is increased for TB diagnosis when
using fluorescence microscopy (Steingart et al., 2006), the work shown here indicates the
potential presence of multiple AF- population. Likewise, PNA-FISH probe and IF staining
techniques in this study showed a lower detection for Mtb in sputum.
Examination of Mtb Pk biofilm cells stained with fluorescence Kinyoun in the current study
resulted in about a 99% detection percentage in the same sample that gave a below 10%
detection proportion with Auramine O (Figure 28). Exactly why assessing fluorescence of
fuchsin following Kinyoun results in a higher detection proportion than detection of
fluorescence Auramine O is still unknown. Although the staining times of Kinyoun and
Auramine are the same, Kinyoun shows a higher sensitivity for the detection of AFB from
culture and sputum over Auramine O. Although the equal decolourisation time and higher
acid and ethanol concentrations in the decolourisation agent of Kinyoun staining than
Auramine O (Kinyoun, 95% v/v ethanol and 3.1% v/v HCl, Auramine O, 35% v/v ethanol and
0.5% v/v HCl), Kinyoun staining showed higher detection proportion than Auramine O.
Further, it was reported that staining with potassium permanganate (KMnO4) for 30 sec has
an effect on Mtb acid-fastness (Heimer et al., 1978). The higher phenol concentration used
in Kinyoun staining, (3.4% w/v in Auramine O, 6.8% w/v in Kinyoun) might permit more
carbol-fuchsin to get into the cell.
Although there is a higher detection proportion with fluorescence Kinyoun, the main
drawback is that the background level in the fluorescence field is higher than with Auramine
O. This might be due to the effect of the KMnO4 with Auramine O, which significantly
Chapter 3. Development of staining techniques to detect M. tuberculosis
from sputum and pure culture
82
quenches the background level (Smithwick et al., 1995). This disadvantage, however, does
not affect cell counting for fluorescence Kinyoun, which can be easily counted by Image-J
based software.
Chapter 3. Development of staining techniques to detect M. tuberculosis
from sputum and pure culture
83
3.6. Conclusions
The work presented here demonstrates that the fluorescence Kinyoun staining technique
detects the majority of non-Auramine O AFB Mtb populations in growth from in vitro culture
and also the Mtb from a sputum sample, which was the ultimate aim. IF and PNA detected
the majority of Auramine O non-AFB from the Pk biofilm cultures tested here, in contrast to
sputum, where they failed to detect the majority of Mtb population. Auramine O had a lower
detection of Pk Mtb from culture and Mtb from sputum. As such, fluorescence Kinyoun
staining is the best staining technique for use in detection of majority of Mtb from sputum.
The principle findings of this chapter are:
Auramine O shows poor detection of Mtb populations in Pk cells and Mtb from
sputum compared with fluorescence Kinyoun.
IF and PNA staining techniques show lower detection of Mtb from sputum than
Auramine O and Kinyoun staining.
Auramine O AFB-ve/LB+ve populations that have the same morphology as Mtb were
identified by Kinyoun staining as AFB populations.
Fluorescence Kinyoun staining shows the highest detection average of non-
Auramine O AFB Mtb from culture and sputum when compared with other staining
techniques.
Chapter 4
Microscopic studies of
M. tuberculosis in sputum
Chapter 4. Microscopic studies of M. tuberculosis in sputum
84
4.1. Introduction
When Mtb bacilli first enter the lung, they are met by alveolar macrophages (Saunders
& Cooper, 2000), which are the first line of defence against Mtb (Miranda et al., 2012).
In most individuals the infection is then controlled by host-cellular granuloma formation
(Saunders & Cooper, 2000). It has been thought that margins of liquefied lesions in the
lung cavities are the location of tubercle bacillus that are characterised by rapid and
extensive bacterial growth (Canetti, 1955b, Young & Duncan, 1995). Once the
infection becomes active, sputum expectorated from pulmonary TB patient contains
different Mtb populations (Garton et al; 2008). Some of these populations may express
properties that are required for transmission (Garton et al., 2008).
Recent cytological studies on mycobacteria reported that Mtb exists in multiple
populations in vitro and in vivo, even within an apparent single microenvironment
(Ryan et al., 2010; Hoff et al., 2011). Ryan et al. (2010) found multiple Mtb phenotypes
in mouse and Guinea pig lung tissues by using Auramine-Rhodamine and
immunohistochemistry dual-staining techniques. The study revealed that two
populations of Mtb from stationary phase were detected with Auramine-Rhodamine/IF
dual staining. However, applying this technique to Mtb from hypoxic culture revealed
three populations, IF (alone), Auramine-Rhodamine (alone), and both Auramine-
Rhodamine/IF. Interestingly, IF on Mtb from hypoxic culture showed punctuated
staining manner. On the other hand, when applying Auramine-Rhodamine/IF dual
staining to Mtb from lung tissue of Guinea pig, three populations were detected, similar
to hypoxic culture (Ryan et al., 2010). Moreover, Mtb within lipid-loaded macrophages
accumulated lipid droplets and lost acid-fastness (Daniel et al., 2004; Gomez &
McKinney, 2004).
These populations may be reflecting the phenotypic features of Mtb in human sputum.
Hence, any identified bacillary population in sputum may provide clues to recognise
these undefined properties and ultimately offer avenues toward improved treatment
and prevention of TB disease. Further, defining of Mtb phenotypes from sputum
provides an idea of stimuli throughout specific phases of infection. Within this
laboratory, several in vitro models have been developed with H37Rv to reproduce the
transcriptional profile and LB contents of Mtb from sputum (Lee, 2012). These
conditions were chosen to replicate the sputum environment in TB disease.
Chapter 4. Microscopic studies of M. tuberculosis in sputum
85
One of the clear characteristics of Mtb bacilli in sputum is the formation of LBs (Garton
et al., 2008 and Garton et al., 2002). LB droplets were first seen in leprosy bacilli in
1946, using the lipid stain Sudan black B (Burdon, 1946). Garton et al. succeeded in
characterizing Mtb-LB-rich populations in sputum using Nile-Red neutral lipid staining
(Garton et al; 2002). Further, study revealed that the LB proportion varies in TB
patients from 8 - 80% (Garton et al., 2008). It has also been shown that Mtb could
produce LB in vitro (Sherratt, 2008). In various stress conditions the morphology and
frequency, however, differs from the LB in sputum; LB formed in vitro are less distinct.
The sputum transcriptome of Mtb has revealed some important findings related to the
LB formation by Mtb in sputum. The transcriptome signatures and presence of LB
suggest that LB+ve cell population may exist in a slow or non-growing Mtb in sputum
(Garton et al., 2008). Therefore, it is considered a significant challenge to detect and
identify mycobacterial phenotypes and their expressed properties in sputum and in
culture media. Doing this may enable the development of specific therapeutic agents
and ultimately prevent transmission. It has been recorded that many TB cases go
undetected with conventional microscopy staining methods, but are positive with
molecular-based methods (i.e., PCR) and cultural methods (Kim et al., 2011). Thus, it
has been assumed that there is a detection limit in conventional staining methods such
as with Auramine O and standard Z-N due to the presence of non-AF population.
The specific reasons why some of these populations go undetected are still unknown
(Ryan et al., 2010). It is likely, however, that it is due mainly to cell wall variations that
alter the permeability to dyes (Bhatt et al., 2007). Various studies of mutants have
revealed that Mtb bacilli with altered cell wall lipid composition loss acid-fastness. The
acid-fastness can also be lost through death and injury of Mtb cells (Seiler et al., 2003;
Ulriches et al., 2005). Recently, Shapiro et al., (2008) revealed that there are some
Mtb populations that could not be detected with using Z-N transmitted light, but could
be detected with fluorescence light (Shapiro & Hänscheid, 2008). This indicates that
fluorescence microscopy of carbol-fuchsin staining is more sensitive than bright field
examination.
Researchers evaluating Mtb in sputum have revealed populations of LB+ve bacilli
(Garton et al., 2008), non-AF Mtb bacilli (Nyka, 1976, Chandrasekhar et al., 1990) and
an Mtb population only recovered with Rpfs (Mukamolova et al., 2010). The study of
Ryan et al., (2010) showed that the phenotypic characteristics of in vitro-grown Mtb
Chapter 4. Microscopic studies of M. tuberculosis in sputum
86
under hypoxia are not the same as those in the hypoxic, necrotic lesions of Guinea pig
and mouse in vivo models (Ryan et al., 2010).
Relying on the hypothesis that there are multiple Mtb populations in sputum (Nyka,
1969, Garton et al., 2008), a central objective of this work has been to identify these
populations using different staining techniques. A number of studies show the multiple
Mtb populations in pure culture (Andreu et al., 2008, Deb et al., 2009 and Ryan et al.,
2010), whereas there are just a few studies showing the non-AF bacilli in sputum
samples (Shapiro & Hänscheid, 2008) and in vivo (Nyka & Oneill, 1970).
There is no published study showing the various Mtb populations in sputum using
different Mtb cell target staining techniques. Combining different staining techniques
with different targets of the Mtb cell effectively provides more opportunity to identify
these sub-populations in sputum. The work presented in this chapter will show multiple
Mtb populations in pure culture and sputum using different staining approaches and
will also further characterise these populations.
Chapter 4. Microscopic studies of M. tuberculosis in sputum
87
4.2. Aims and objectives
To use various cytological staining methods to identify the multiple Mtb sub-
populations in pure culture and ultimately in sputum samples.
The specific objectives are to:
1. Identify Mtb sub-populations in vitro and sputum using:
I. IIF triple-staining technique
II. PNA triple-staining technique
III. Auramine O/LipidTox Red Neutral Lipid stain dual-staining
technique
IV. Kinyoun/ LipidTox Green Neutral Lipid stain dual-staining
technique
2. Characterise the Mtb LBs subpopulations using the previous staining
techniques
3. Study the validation of manual cell counts with different staining
techniques compared with automated cell count
Chapter 4. Microscopic studies of M. tuberculosis in sputum
88
4.3. Methods
4.3.1. Auramine O, Ab (or) PNA and RLx triple-staining technique
The staining procedures were carried out by initially staining Mtb smears from sputum
or pure culture with IIF or PNA. Prior to examining slides under the microscope, the
regions of interest were marked with a clear permanent marker and then images were
taken. The cover slip was then taken off and the slide left to dry. Auramine O staining
was done on top of IIF, and the images were taken from the same regions of interest.
The cover slip was then taken off again and the slide left to dry. Finally, RLx staining
was carried out on the top of IIF and Auramine O, and images were taken from the
same regions of interest. The triple-staining order should be taken under account as
IIF fluorophores fade when exposed to the phenol of Auramine O.
4.3.2. Auramine O, Kinyoun and RLx triple-staining technique
The Mtb smear was first stained with Auramine O. Images were captured from marked
fields and then the cover slip was taken off. The smear was then stained with Kinyoun
stain on top of Auramine O, and the images were recorded from the same regions of
interest. The coverslip was then taken off and the smear was stained again with RLx
on the top of Auramine O and Kinyoun. The images were then taken from the same
The dual-staining techniques were done by staining the smears of sputum or pure
culture with Auramine O or Kinyoun stain. Slides were then air dried and RLx (with
Auramine O) or GLx (with Kinyoun) was applied.
4.3.4. Cell-count analysis
Mtb cells from sputum from IIF/Auramine O/RLx, PNA/Auramine O/RLx triple-staining
and Auramine O/RLx, fluorescence Kinyoun dual-staining techniques were counted in
triplicate. Cell counts were done in triplicate by assessing each cell individually with the
three stains by scoring positive cells as 1 and negative as 0. Statistical analyses were
performed using Excel 2010 (Microsoft Corp.). Figure 30 shows the statistical analysis
Chapter 4. Microscopic studies of M. tuberculosis in sputum
89
on the Excel spreadsheet and explains the calculations of the sputum sample stained
with the PNA/Auramine O/RLx triple-staining technique.
T o ta l c e ll n u m b e r d e te c te d b y A u + R L x
e .g . = IF (H 6 = 0 ,I6 + J 6 , 0 )
T h e a v e ra g e n u m b e r a n d
th e S ta n d a rd d e v ia t io n o f th e
th re e re p lic a te w a s ta k e n
T o ta l c e ll n u m b e r
d e te c te d b y x s ta in in g
T o ta l c e ll n u m b e r d e te c te d
b y in d iv id u a l s ta in in g
T o ta l n u m b e r o f
c o u n te d c e lls b y P N A
1
2
3
T h e s u m o f c e l ls
d e te c t e d b y a l l s t a in in g
Figure 30: Example of Excel spreadsheet used to calculate the total cell count.
Image is an example of the Excel spreadsheet depicting PNA/Auramine O/RLx triple-staining cell calculations. The sheet shows detailed data of each statistical analysis as well as example equations. The bottom image shows a spreadsheet of the calculations from three replicates of the sputum sample that ended with calculations for average and standard deviation.
Chapter 4. Microscopic studies of M. tuberculosis in sputum
90
4.4. Results
4.4.1. IIF staining reveals multiple M. tuberculosis sub-populations in
pure culture
The triple-staining technique using IIF (Rv Ab; raised in Guinea pig live
H37Rv)/Auramine O/RLx was applied to a pure Mtb H37Rv culture of stationary-phase
cells grown in Sauton`s. As mentioned in Section 4.3.1, all images were taken from the
same field of view directly after applying the staining technique. The images of the
three staining techniques were merged using Image-Pro-Plus 5.0 software. Mtb cells
from pure culture were pseudocoloured as IIF (green), Auramine O (yellow) and RLx
(red). AF+ve and LB+ve proportions of H37Rv were counted automatically in triplicate
and almost 100 cells were counted from each replicate against the phase contrast,
whereas the Ab proportions were counted manually by eye.
Figure 31 shows the multiple populations of Mtb from the stationary-phase culture. The
results show that the IIF is able to detect all Mtb populations in pure culture. In
comparison, Auramine O can detect only some of the total H37Rv population. Also,
there is heterogeneity in neutral lipid staining and presence of LBs within Mtb cells
from culture. There are four sub-populations of H37Rv in pure culture detected with
IIF/Auramine O/RLx. These populations are Ab+ve /Au+ve /LB-ve, Ab+ve /Au-ve/LB+ve, Ab+ve
/Au-ve/LB-ve and Ab+ve /Au+ve /LB+ve.
Chapter 4. Microscopic studies of M. tuberculosis in sputum
91
Cell populations IIF Auramine O Red
LipidTox Composite
Figure 31: Multiple M. tuberculosis populations in pure culture.
Representative images to show the multiple populations in pure Mtb H37Rv stationary-phase culture grown in Sauton`s broth. Images show the IIF, Auramine O, RLx triple-staining technique where the images were then merged to show the composite. After aligning to the phase contrast image, each fluorophore was imaged separately and then the images were pseudocoloured as Rv Ab (green), Auramine O (yellow), and RLx (red). Scale bars 4 µm.
The results in Figure 32 represent the IIF+ve/AF+ve /LB+ve proportions of the Mtb H37Rv
strain during the growth cycle over 23 days. In Sauton`s broth almost 100% of H37Rv
bacilli were detected by the Rv-Ab in all growth phases, whereas the size for the AF+ve
population decreases in contrast to the LB+ve population, which increases.
Ab+/Au-/LB-
Ab+/Au+/LB-
Ab+/Au-/LB+
Ab+/Au+/LB+
Chapter 4. Microscopic studies of M. tuberculosis in sputum
92
0 T
ime 4 9
14
23
0
2 0
4 0
6 0
8 0
1 0 0
R v -A b+ v e
A u ra m in e O -A F B+ v e
R L x -L B+ v e
D a y s
Pe
rc
en
tag
e %
0 4 8 1 2 1 6 2 0 2 4 2 8
0 .0
0 .5
1 .0
1 .5
2 .0
T im e (D a y s )
OD
58
0n
m
A B
Figure 32: Ab, AF and LB proportions of M. tuberculosis H37Rv during growth cycle.
The bar chart shows (A) the proportions of IIF+ve
/AF+ve
/LB+ve
of H37Rv culture grown in
Sauton`s stained with Rv antibody (open columns), Auramine O (solid columns) and RLx (hatched columns) during the growth cycle. The AF and LB proportions were counted automatically, whereas the Ab proportions were counted by manually eye. Each experiment represents three replicates. Error bars display standard deviation. (B) Shows the linear OD580nm growth curve during 24 days of Mtb H37Rv grown in Sauton`s and supplemented with ADC and Tween-80.
4.4.2. Antibody staining shows poor detection of acid-fast bacilli in
sputum
IIF staining was performed on four 4+ decontaminated frozen sputum samples. In
order to show the different Mtb populations from sputum the triple-staining technique
was applied on sputum following the procedure in Section 4.3.1. A comparison
between IIF, Auramine O and RLx was done by recording the images of all three
staining techniques and then counting by eye. Each cell was assessed individually with
the three staining techniques see (Section 4.3.4).
The results in Figure 33 show a comparison between IIF+ve, Auramine O-AFB+ve and
LB+ve detection of Mtb in sputum. Three replicates were counted and 100 Auramine O-
AFB+ve Mtb cells were counted in each replicate. These cells, which were detected with
Auramine O, were then assessed for whether they are IIF+ve and LB+ve. All results from
the four samples show that just a few Auramine O-AFB+ve cells were detected with IIF.
There is just also a small proportion of Auramine O-AFB+ve /IIF+ve that is LBve+. This
result indicates that IIF detects much lower Mtb proportions than Auramine O in
sputum samples.
Chapter 4. Microscopic studies of M. tuberculosis in sputum
93
1 2 3 4
0
2
4
6
8
1 0
S p u tu m sa m p le s
Pro
po
rtio
n p
er
30
0
Au
ram
ine
O-
AF
B+
ve
Mtb
ce
lls
I IF+ v e
I IF+ v e
/L B+ v e
Figure 33: The detection number of IIF+ve
and IIF+ve
/LB+ve
populations per 300 Auramine O-AFB
+ve M. tuberculosis cells.
The bar chart shows the detection percentages of IIF+ve
and IIF+ve
/LB+ve
populations per 300 Auramine O-AFB
+ve Mtb cells in four 4+ sputum samples. Mtb cells were stained with Rv-Ab,
Auramine O and RLx triple-staining technique. The AF proportion was counted with Auramine O independently. The same cells then were assessed whether they are IIF
+ve and LB
+ve. Each
sample was counted in three replicates by eye. Error bars display standard deviation.
4.4.3. IIF/Auramine O/RLx triple-staining reveals multiple M. tuberculosis
sub-populations in pure culture
After revealing that the IIF detects just a small population of Mtb in sputum in
comparison with Auramine O, it was necessary to identify these populations. To
achieve this aim, the triple-staining technique was performed on a 4+ sputum sample.
Figure 34 shows the multiple Mtb populations in sputum that was detected using the
IIF/Auramine O/RLx triple-staining technique. There are more Mtb sub-populations
detected with triple-staining technique in sputum than pure culture because of the
existence of the IIF negative population in sputum. Eight different Mtb sub-populations
were detected in sputum. These sub-populations are Ab+ve /Au+ve /LB+ve, Ab+ve /Au+ve
ve/Au-ve/LB+ve and Ab-ve/Au-ve/LB-ve. The characterisation of these sub-populations in
sputum is shown in the next section.
Chapter 4. Microscopic studies of M. tuberculosis in sputum
94
Cell populations IIF Auramine O Red
LipidTox Composite
A b + /A u + /L B +
A b + /A u - /L B +
A b -/A u + /L B +
A b -/A u -/L B -
A b + /A u + /L B -
A b + /A u -/L B -
A b - /A u + /L B -
A b - /A u - /L B +
Figure 34: The multiple M. tuberculosis populations in sputum.
Representative images show the multiple populations of Mtb in sputum. Images show the IIF, Auramine O, RLx triple-staining technique and then the images were merged to show a composite section. Each fluorophore was imaged separately and then the images were pseudocoloured as Rv Ab (green), Auramine O (yellow) and RLx (red). Scale bars 5 µm.
Chapter 4. Microscopic studies of M. tuberculosis in sputum
95
4.4.4. Characterising the multiple M. tuberculosis sub-populations in
sputum using IIF/Auramine O/RLx triple-staining
Three sputum samples were used in this study. Images of IIF, Auramine O and RLx
triple-staining were done manually by capturing the field of interest from each staining
technique. Three replicate slides were prepared from each sample and from each
replicate at least 100 cells were counted. Cell counts were done by assessing each
cell individually with the three stains and by scoring positively stained cells as 1 and
cells negative for the stain as 0. The total cell number was determined in each sample
as the sum of cells that detected by any of staining techniques. Statistical analyses
were performed mentioned in Section 4.3.4.
The results in Figure 35 show that IIF/Auramine O/ RLx triple-staining reveals multiple
Mtb populations in sputum. IIF staining in all three sputum samples detects lower than
10% of the total cell number of Mtb cell populations. This is in contrast with Auramine
O, which detects from 25-60% of the total cell number. The number of cells that are
detected with both IIF and Auramine O in all samples is about 2-6, which a significantly
low proportion in comparison with the total cell number counted in each sample. The
results also show that lower than 4% of the total cell number in all samples show LB in
the cells detected with IIF, whereas cells detected with Auramine O show variation in
LB cell numbers which is between 13-23%. The LB+ve cells that were detected with
RLx only and which are thought to be Mtb bacilli as they morphologically similar are
34% in sample 103, 16% in sample 96 and 7% in sample 85. The results show that
between 0%-5% of the total cell number of Mtb bacilli were stained with all three
staining techniques.
Chapter 4. Microscopic studies of M. tuberculosis in sputum
96
RLx
only
IIF o
nly
Au o
nly
Au/R
lx o
nly
IIF/A
u only
IIF/R
Lx only
RLx/
Au/II
F0
20
40
60
80
100
IIF/Au/RLx
To
tal
nu
mb
er
of
de
tec
ted
ce
lls 103
96
85
Figure 35: The total number of the multiple populations of M. tuberculosis in sputum
using IIF/Auramine O/RLx triple-staining technique.
The total number of Mtb cells in three sputum samples, 103 (red bars), 96 (green bars) and 85 (grey bars), are shown in this graph by using IIF/Auramine O/RLx triple-staining technique. From each sample, three replicate slides were stained and at least 100 cells were counted from each replicate and the SD was calculated from the average of the three replicates.
4.4.5. M. tuberculosis H37Rv sub-populations using PNA-FISH triple-
staining technique
4.4.5.1. The PNA signal intensity is increases in actively growing H37Rv
and decreases in the stationary phase of growth
It has been reported that mycobacterial ribosomal genes are simultaneously
downregulated with the cessation of growth (Trauner et al., 2012). The rRNA number
in the exponential phase increases in contrast to the number in the stationary phase
(Verma & Davidson, 1994). Relying on this finding, the hypothesis in this study is that
OK682 PNA probe fluorescence intensity will decrease during the growth cycle.
Mtb H37Rv cells were inoculated into Sauton`s medium to an initial calculated OD of
0.05. The culture was then harvested at different time points at 4, 7, 10, 15 and 23
days. Cells from all time points were stained with the OK682 PNA-FISH probe. From
each time point almost 300 cells were assessed using Image-J-based software
developed by Bell, 2013. Samples for negative control were used identically from the
Chapter 4. Microscopic studies of M. tuberculosis in sputum
97
mid-exponential phase of H37Rv cells. For the negative control, the PNA probe in the
hybridisation buffer was replaced with d.H2O.
The results in Figure 36 show that the median fluorecence intensity (MFI) of the
OK682 probe after 4 days of growth is significantly higher than the other growth
stages. Also, the MFI decreased significantly at each time point until reaching the
lowest intensity after 23 days. This finding is identical to that reported by Trauner et al.,
(2012), showing that rRNA is downregulated with the cessation of growth.
-v e c o n t . (4 d ) 4 d 7 d 1 0 d 1 5 d 2 3 d
0
2 5 ,0 0 0
5 0 ,0 0 0
7 5 ,0 0 0
1 0 0 ,0 0 0
1 2 5 ,0 0 0
1 5 0 ,0 0 0
OK
68
2-M
FI/
Are
a
***
**** ***
Figure 36: M. tuberculosis H37Rv cells with PNA staining during the growth cycle.
The scatter-dot graph shows the OK682 PNA probe median fluorescence intensity of H37Rv cells in Sauton`s during the growth cycle. PNA MFIs were assessed from triplicate slides at each time point and (at least 100 cells per slide) using Image-J developed software. A paired t-test was used to compare the PNA MFI between the different variables; asterisks designate significant result.
4.4.5.2. PNA, Auramine O and RLx triple-staining reveals multiple M.
tuberculosis populations in pure culture
The proportions of PNA/AF/LB by the PNA/Auramine O/RLx triple-staining technique
were measured from a late-exponential Mtb strain H37Rv culture in Sauton`s. A
comparison was done of each staining compared with the phase contrast on triplicate
slide preparations. The PNA positivity was scored according to the presence of spots
of staining in the cells, meaning that cells with no spots were scored negative.
Chapter 4. Microscopic studies of M. tuberculosis in sputum
98
Figure 37A shows the multiple Mtb populations revealed by PNA/Auramine O/RLx
triple-staining. The detected proportions of the total cell population with OK682 PNA
probe, Auramine O and RLx staining of Mtb are shown in Figure 37B. The result
reveals that the detected proportion with OK682 PNA probe staining is significantly
higher than with Auramine O staining. Also, a large Mtb H37Rv proportion was
detected with the OK682 PNA probe as non-AFB Mtb cells detectable by PNA-FISH.
P N A A u ra m in e O R L x
4 0
6 0
8 0
1 0 0
Pe
rc
en
tag
e %
A B
Figure 37: The PNA, Auramine O and RLx proportions of M. tuberculosis H37Rv by triple-staining technique.
The bar chart shows: (A) the multiple Mtb H37Rv populations revealed by PNA (green)/Auramine O (yellow)/RLx (red) triple-staining technique; (B) the average PNA, AF and LB staining proportions of Mtb H37Rv strain from the late-exponential phase grown in Sauton’s assessed with the triple-staining technique. Each staining was applied to triplicate slides and the error bars represent the SD of the three replicates.
To investigate the hypothesis that there are multiple Mtb populations in sputum sample
and in pure culture, the PNA, Auramine O and RLx triple-staining technique was
applied to H37Rv cells from the late-exponential phase of growth. Microscopic images
were taken following each staining technique and the composite images were
prepared. The results in Figure 38 show the multiple H37Rv populations from culture
identified with the triple-staining technique. There are eight different populations:
ve/Au+ve /LB+ve, PNA-ve/Au-ve/LB+ve, PNA-ve/Au+ve /LB-ve, PNA-ve/Au-ve/LB-ve. All these
populations were detected by the triple-staining technique and shown separately, with
the composite image subsequently done to show how the cell population looks when
combined.
Chapter 4. Microscopic studies of M. tuberculosis in sputum
99
Cell populations PNA Auramine O Red
LipidTox Composite
Figure 38: Multiple M. tuberculosis populations in pure culture using PNA, Auramine O and RLx triple-staining technique.
Representative images show the multiple Mtb H37Rv populations in Sauton`s revealed by the triple-staining technique. Images show the PNA, Auramine O, RLx stains, with the images subsequently merged to show the composite. Each fluorophore was imaged separately and then the images were pseudocoloured as PNA (green), Auramine O (yellow) and RLx (red). Scale bars 5 µm.
PNA+/Au+/LB+
PNA+/Au-/LB+
PNA+/Au+/LB-
PNA+/Au-/LB-
PNA-/Au+/LB+
PNA-/Au+/LB-
PNA-/Au-/LB+
PNA-/Au-/LB-
Chapter 4. Microscopic studies of M. tuberculosis in sputum
100
4.4.5.3. PNA, Auramine O and Neutral lipid (Red LipidTox) triple
staining reveals multiple M. tuberculosis populations in sputum
Three 4+ decontaminated and frozen sputum samples were used in this study
according to the protocol in Section 4.3.1. Then a comparison was done between the
PNA, Auramine O and RLx by recording the images of all three stains with the
counting then done manually by eye.
The results in Table 14 show a comparison between PNA, Auramine O and RLx
detection of Mtb in sputum. Three replicates were counted and 100 Auramine+ve cells
were counted in each replicate. Then these cells which were detected with Auramine
O were assessed for whether they were PNA+ve and LB+ve. All results from the four
samples show that just a few Auramine O+ve Mtb cells are PNA+ve and LB+ve. This result
indicates that the PNA detects much lower Mtb proportions than Auramine O.
Table 14: The detection number of PNA and LB populations per 300 Auramine O-AFB+ve
M. tuberculosis cells
Sputum sample PNA+ve
(%)±SD PNA+ve
/LB+ve
(%)±SD
1 35.3±11.5 9.3±8.3
2 19.6±7 11±8.5
3 25.3±12.3 23±5.6
The comparison between PNA, Auramine O and RLx, shows that PNA detects just a
proportion of the cells compared with Auramine O. Thus, it was necessary to identify
these populations. To achieve this target, the triple-staining technique was performed
on a 4+ sputum sample. Figure 39 shows the multiple Mtb populations in sputum
which were detected by three different staining techniques, PNA, Auramine O and
RLx. Eight different Mtb sub-populations were detected in sputum. These sub-
/Au-ve/LB+ve, PNA-ve/Au+ve /LB+ve, PNA-ve/Au+ve /LB-ve, PNA-ve/Au-ve/LB+ve and PNA-ve/Au-
ve/LB-ve.
Chapter 4. Microscopic studies of M. tuberculosis in sputum
101
Cell populations PNA Auramine O Red
LipidTox Composite
Figure 39: Multiple M. tuberculosis populations in sputum
Representative images show the multiple populations of Mtb in sputum. Images show PNA, Auramine O, RLx triple-staining technique, and subsequently the images were merged to show the composite. Each fluorophore was imaged separately and then the images were pseudocoloured as PNA (green), Auramine O (yellow) and RLx (red). Scale bars 5 µm.
PNA+/Au+/LB+
PNA+/Au-/LB+
PNA+/Au+/LB-
PNA+/Au-/LB-
PNA-/Au+/LB+
PNA-/Au-/LB+
PNA-/Au+/LB-
PNA-/Au-/LB-
Chapter 4. Microscopic studies of M. tuberculosis in sputum
102
4.4.5.4. Characterising the multiple Mtb sub-populations in sputum
using PNA/Auramine O/RLx triple-staining
The same three sputum samples (103, 96 and 85) that were used with IIF were used
with PNA, Auramine O and RLx, and triple-staining was done manually by capturing
the field of interest from each staining technique. Three replicates from each sample
were used. From each replicate almost 100 cells were counted. The cell counts were
as mentioned in Section 4.3.4.
The results in Figure 40 show that Mtb cell populations that were detected with PNA
was equal to or lower than 9%, which is much lower than the cell populations detected
with Auramine O varying between 28%-60%. The results also reveal that just less than
5% of the total cell population was detected in all three samples when assessing cells
stained with both PNA and Auramine O. Less than 5% of PNA+ve cell populations are
LB+ve, whereas Auramine O+ve populations show variation in LB cell numbers between
samples of 18% of sample 103, 24% of sample 96 and 17% of sample 85. The LB+ve
cells that were detected with RLx only and thought to be AFB -ve Mtb bacilli according
to their similar size and morphology compared with Auramine O-AFB+ve cells,
comprised 43% in sample 103, 17% in sample 96 and 4% in sample 85.
RLx
only
PNA o
nly
Au o
nly
Au/R
lx
PNA/A
u
PNA/R
Lx
PNA/A
u/RLx
0
20
40
60
80
PNA/Au/RLx
To
tal
nu
mb
er
of
de
tec
ted
ce
lls
103
96
85
Figure 40: The total number of the multiple populations of M. tuberculosis in sputum using PNA/Auramine O/RLx triple-staining technique.
Graph showing the total number of Mtb populations in the three sputum samples, 103, 96 and 85, by using PNA/Auramine O/RLx. From each sample three replicates were counted and the SD was calculated from the average of the three replicates.
Chapter 4. Microscopic studies of M. tuberculosis in sputum
The previous results show that Auramine O detects higher numbers of Mtb from
sputum than either IIF or PNA. However, it has already been shown that Auramine O
failed to detect non-AFB in sputum and pure culture. Furthermore, examination of
fluorescence following Kinyoun staining was shown to detect a higher proportion of
Mtb H37Rv from pure culture and Mtb from sputum. Therefore, a comparison between
Auramine O and fluorescent Kinyoun was done in five sputum samples to prove that
fluorescence Kinyoun staining detects a higher proportion of Mtb than Auramine O.
The experiment was performed by staining the formaldehyde-fixed sputum smears
with a dual-staining technique. Auramine O staining was performed first and then
images were captured from marked fields on the slides. The cover slip was then taken
out and Kinyoun staining was applied on the same smear. Images of the fluorescence
of carbol-fuchsin were then taken from the same marked fields. The counting was
done manually by eye by comparing Auramine O count against the count of
fluorescence Kinyoun stained cells. In each staining method, cells from 20 fields were
counted and then the mean number was calculated in those fields from triplicate
slides.
The results in Figure 41 show that there is a variation in the Auramine O detection
mean per 20 fields compared to fluorescence Kinyoun staining count in the sputum
samples. Some samples, such as sample 41 and 88 and 104 show a significantly
higher detection of fluorescence Kinyoun than Auramine O, whereas some show no
significant difference in mean cells count per 20 fields, such as sample 23 and 44.
Chapter 4. Microscopic studies of M. tuberculosis in sputum
104
23
41
44
88
104
0
2 0
4 0
6 0
S p u tu m s a m p le
Av
era
ge
ce
ll n
um
be
r/
20
fie
lds
A u ra m in e O
K in y o u n
*
*
*
Figure 41: Comparison between fluorescence Auramine O and fluorescence Kinyoun of M. tuberculosis from sputum.
The bar chart represents the acid-fast averages of Mtb from five (4+) decontaminated and frozen sputum samples per 20 fields. Samples were stained with an Auramine O and Kinyoun dual-staining technique in three replicate slides for each sample. The AF cells were counted manually by eye. Error bars represent the standard deviation of AF cells from 20 fields of view. Unpaired t-tests were used to compare the fluorescence Auramine O with fluorescence Kinyoun. Asterisks designate significant results.
Identifying Mtb populations in sputum that were not detected with Auramine O (AFB-)
might give further clues to the Mtb physiology during transmission. For this purpose, a
triple-staining technique comprised of Auramine O, Kinyoun and RLx was done on a
4+ sputum sample following the protocol in Section 4.3.2. Figure 42 shows the multiple
Mtb populations using the Auramine O, Kinyoun and RLx triple-staining technique.
Images A, B, C and D show the separate fields of the staining techniques, whereas
image E is the composite image of the three staining techniques. This technique
reveals some Mtb sub-populations detected with fluorescence Kinyoun staining, but
not with Auramine O. There are three different populations shown in this image: Au+ve
/Kin+ve /LB+ve, Au-ve/Kin+ve /LB+ve and Au-ve/Kin+ve /LB-ve. This finding reveals the
heterogeneity of Mtb bacilli in sputum samples. However, it is essential to classify
these sub-populations in terms of showing the predominant population in a number of
sputum samples.
Chapter 4. Microscopic studies of M. tuberculosis in sputum
105
A u -/K in + /L B +
A u + /K in + /L B +
A u -/K in + /L B -
A u r a m in e O
F lu o r o -K in
R L x
P h a s e -c o n t r a s t
A
B
C
D
E
Figure 42: The multiple M. tuberculosis populations in sputum revealed by Auramine, Kinyoun and RLx triple-staining technique.
A tuberculous sputum sample is imaged by phase contrast: (A) then stained and imaged sequentially with Auramine O (B), Kinyoun (C) and LipidTox Red Neutral Lipid (D). After aligning to the phase contrast image, each fluorophore was imaged separately and then the images were pseudo-coloured as shown (B-D) before preparing an overlaid composite image (E). Scale bar 5 µm. Note that the Kinyoun stain imaged by fluorescence detects Auramine negative bacilli.
4.4.7. The multiple Mtb populations revealed by Auramine O/RLx and
fluorescence Kinyoun/GLx dual-staining techniques
As fluorescence Kinyoun revealed Mtb populations that could not be detected by
Auramine O in sputum, it was decided to compare between these two staining
techniques. The GLx was combined with Kinyoun as the RLx interferes with
fluorescence Kinyoun because both have red fluorophores. Auramine O/RLx and
fluorescence Kinyoun/GLx dual-staining techniques were applied on the same three
sputum samples: 103, 96 and 85 as assessed with the triple PNA and IIF staining
techniques. The staining was done according to the protocol in Section 4.3.3. Three
Chapter 4. Microscopic studies of M. tuberculosis in sputum
106
replicates from each sample were used. From each replicate almost 100 cells were
counted. The cell counts were done as mentioned in Section 4.3.4.
The result in Figure 43A reveals that the total number of a cell population that was only
detected with RLx becomes higher than when assessed by the IIF (Figure 35) and
PNA (Figure 40) triple-staining techniques. For sputum samples 103, 96 and 85, the
population proportion that stained with RLx only by using Auramine O/RLx dual
staining technique was subsequently 56%, 30% and 8%. This result indicates that IIF
and PNA detect non-AFB Mtb populations in sputum. Further, the proportion number
of the Auramine O-AFB+ve/RLx-LB+ve population of samples 103, 96 and 85 are of 20%,
31% and 19%. However, sample 96 showed higher cell populations detected with
Auramine O/RLx than the other triple-staining techniques. This might be due to bias in
the manual counting method of the triple-staining techniques. Also, the proportion of
the cells that show RLx only, is inversely proportional to the proportion of the Auramine
O cells. This indicates that when the number of AFB-ve/LB+ve cells increases, the
number of AFB+ve /LB-ve cells decreases and vice versa.
The results in Figure 43B show the fluorescence Kinyoun/GLx dual-staining technique
that was applied on the same sputum samples. This showed that there are almost no
Mtb that were detected only with GLx alone. This means that fluorescence Kinyoun
was able to detect the majority of the Mtb population in these sputum samples. Also,
the proportion number of the Mtb cells that are AFB+ve/LB+ve is much higher than the
previous staining techniques. The proportion number of the Kinyoun+ve/GLx+ve
population of samples 103, 96 and 85 were subsequently 41, 50 and 44%,
respectively. Similarly, as found in the Auramine O/RLx results, sample 96 showed
higher cell populations detected with Kinyoun/GLx than the other triple-staining
techniques. This might be due to the bias of the manual counting method utilized in the
triple-staining techniques. It is significant that using fluorescence Kinyoun/GLx
technique reveals that the LB+ve/AFB-ve populations with Auramine O are AFB+ve/LB+ve
populations with Kinyoun staining. This result also confirms that LB+ve/AFB-ve
populations with Auramine O in sputum are Mtb cells as they detected with carbol-
fuchsin.
Chapter 4. Microscopic studies of M. tuberculosis in sputum
107
RL
x o
nly
Au
on
ly
Au
/RL
x
0
2 0
4 0
6 0
8 0
1 0 0
1 2 0
A u /R L x
To
tal
nu
mb
er o
f c
ell
s
Au
/RL
x d
ete
cti
on
1 0 3
9 6
8 5
GL
x o
nly
Kin
on
ly
Kin
/GL
x
0
2 0
4 0
6 0
8 0
1 0 0
1 2 0
K in /G L x
To
tal
nu
mb
er o
f c
ell
s
Kin
/GL
x d
ete
cti
on
1 0 3
9 6
8 5
A B
Figure 43: The total number of the multiple populations of M. tuberculosis in sputum using Auramine O/RLx and fluorescence Kinyoun/GLx dual-staining techniques.
The total number of Mtb cells in the three sputum samples, 103, 96 and 85, are shown in this graph with application of Auramine O/RLx and fluorescence Kinyoun/GLx. From each sample three replicate slides were stained and were counted and the SD was calculated from the average population sizes of the three replicates.
4.4.8. Comparison between manual and automated lipid body counting
using Auramine O/RLx Kinyoun/GLx dual-staining techniques
Counting Mtb staining types, specifically LB+ve populations will provide an assessment
regarding the predominant population in the sputum. The Mtb LB+ve phenotypes are
worthy of inquiry because it is thought to be transmission adapted populations (Garton
et al; 2008).
The previous section described the classification of the Mtb populations in sputum
using different staining methods. The non-Auramine O AFB population which was
LB+ve was detected with the fluorescence Kinyoun staining method. However, the
counting was done using a manual counting system. Therefore, it is necessary to
develop automated software for the counting of LB populations from sputum to avoid
any potential for bias in manual counting. To achieve the non-subjective target of
counting LB from different sputum samples by different users, Image-J based software
was developed by Andrew Bell (Bell, 2013).
Four decontaminated and frozen sputum samples (96, 104, 115 and 44) were stained
with Auramine O/RLx and Kinyoun/GLx dual-staining techniques as shown in Figure
44. Each sample was stained with Auramine O and Kinyoun dual-staining techniques
Chapter 4. Microscopic studies of M. tuberculosis in sputum
108
in triplicate. The manual counting method was done by eye by counting almost 100
cells from each replicate. The automated counting method was done by using the
Image-J-based software, which captures the fluorescence field of an individual cell and
then assesses the LB result of each cell blindly.
Figure 44: Multiple M. tuberculosis populations in sputum revealed by Auramine/RLx, Kinyoun/GLx dual-staining techniques.
Tuberculous sputum sample imaged by: (A) Auramine O combined with RLx; and (B) Fluorescence Kinyoun combined with GLx. The two fluorophores for each dual labelling technique were labelled with different filters then images were pseudo-coloured before preparing an overlaid composite image. Scale bars 5 µm.
The results in Figure 45 show the LB+ve proportions of the four sputum samples assess
with each AF dye. The LB proportions vary between sputum samples with both
techniques. The result also shows that the LB proportions with both techniques are
significantly higher with the fluorescence Kinyoun dual technique than Auramine O.
This is because fluorescence Kinyoun detects all Mtb populations and the counting
was done on the whole population. However, Auramine O misses the detection of
some LB+ve /AFB-ve populations that results in a lower LB proportion.
A u + /L B +
A u -/L B +
A u + /L B -
K in + /L B +
K in + /L B -
C o m b in e d A u ra m in e O a n d R L x C o m b in e d K in y o u n a n d G L x
A B
Chapter 4. Microscopic studies of M. tuberculosis in sputum
109
96
104
115
44
2 0
4 0
6 0
8 0
1 0 0
M a n u a l L B s p u tu m c o u n t
S p u tu m s a m p le
LB
po
sit
ive
%
A u ra m in e O
K in yo u n
96
104
115
44
2 0
4 0
6 0
8 0
1 0 0
A u to m a te d L B s p u tu m c o u n t
S p u tu m s a m p le
LB
po
sit
ive
%
A u ra m in e O
K in yo u n
Figure 45: The LB proportions of M. tuberculosis from sputum with two staining
techniques.
Bar graphs show the LB proportions in four 4+ sputum samples. The counting was done with
two methods, manual by eye and automated using Image-J based software.
Chapter 4. Microscopic studies of M. tuberculosis in sputum
110
4.5. Discussion
The main aim of this work is to identify the Mtb sub-populations in sputum and pure
culture. To achieve this objective, current detection staining techniques were assessed
for their ability to detect the majority of Mtb in pure culture and sputum samples. The
detection techniques which were used for the identification of the multiple sub-
populations in pure culture and sputum are IIF, which uses the Rv Ab (live infection)
detecting the surface Ags, PNA targeting the 23S rRNA, Auramine O, and Kinyoun
staining which is believed to target the mycobacterial MAs (Richards, 1941) and
nucleic acids (Oster, 1951 and Hanscheid et al., 2007).
In this study new approaches were introduced to detect and identify the Mtb sub-
populations in pure culture and sputum. These approaches combine staining
techniques to detect and identify Mtb populations simultaneously. These different
staining techniques target different sites of the Mtb cell and each has different
detection ability. These approaches are IIF-Auramine O-RLx, PNA-Auramine-O-RLx,
Auramine-O-RLx and fluorescence Kinyoun-GLx. The intention was that by using each
of these approaches, it would be possible to detect both AF and non-AF Mtb.
Additionally, there was the aim to show the total cell number of each of these sub-
populations.
One of the findings of this study shows that fluorescence Kinyoun staining detects a
much greater proportion of Mtb populations in sputum and pure culture in comparison
with Auramine O. There are also multiple Mtb populations in sputum and pure culture
and each staining technique detects different population types. It was also shown that
Auramine O has higher detection of Mtb from sputum than the IIF and PNA staining
techniques. Using the four staining approaches on the same three sputum samples
revealed that Fluorescence Kinyoun staining shows the total cells number of
populations that were found with the total number of the other approaches. It was also
shown that the AFB-ve/LB+ve population detected with IIF/Auramine O/RLx or
PNA/Auramine O/RLx triple-staining techniques and Auramine O/RLx dual-staining is
AFB+ve/LB+ve/-ve following fluorescence Kinyoun/GLx dual-staining technique. However,
the total cell number indicates that the majority of this population is AFB+ve/LB+ve.
Chapter 4. Microscopic studies of M. tuberculosis in sputum
111
4.5.1. M. tuberculosis populations revealed by IIF, Auramine O and RLx
triple-staining from pure culture and sputum
The IIF application using Rv Ab to stain Mtb from pure culture successfully detected
almost all populations with reasonably no background auto-fluorescence. It was clearly
noted that the IIF application to Mtb from pure culture was highly reproducible and
easy to perform. Mtb H37Rv bacilli were shown to be stained exclusively with either IIF
or by IIF with and without Auramine-O and RLx. In the H37Rv sample from the
stationary phase culture, all Mtb bacilli were stained with IIF staining. Auramine O and
RLx show some heterogeneity in the stationary phase culture. As shown in this study,
the acid-fastness decreases whilst the LB proportion increases at this stage of growth.
The results show that four sub-populations can be observed in H37Rv culture from the
mid-exponential phase. The first two populations are both IIF+ve and AFB+ve with and
without LBs, (IIF+ve /Auramine O+ve /LB+ve) and (IIF+ve /Auramine O+ve /LB-ve). The
second two populations are IIF+ and non-AFB with and without LBs, (IIF+ve /Auramine
O-ve/LB+ve) and (IIF+ve /Auramine O-ve/LB-ve). Based on this result, the IIF/Auramine
O/RLx triple-staining technique is able to characterize the Mtb populations in pure
culture.
Although a number of studies have shown the phenotypic alteration of Mtb under
multiple stress conditions (Kussell et al., 2005 and Deb et al., 2009), this is the first
study showing the multiple Mtb populations in pure culture using a triple-staining
technique. Ryan et al., (2010) did a study showing the multiple Mtb populations in
Guinea pig and mouse tissue using a dual-staining technique. The study showed that
two populations are observed when H37Rv cells from the stationary phase were
stained with IIF (WCL anti-Mtb Ab)/Auramine-Rhodamine dual-staining. These
populations were IIF+ve /Auramine-Rhodamine+ve and IIF+ve /Auramine-Rhodamine-ve
(Ryan et al., 2010). This result is identical with what was found in the results of this
chapter regardless the type of the polyclonal Ab.
In the same study, however, it was shown that when H37Rv cells were exposed to
hypoxic condition, there are three populations revealed with the dual-staining
technique. These populations are IIF+ve /Auramine-Rhodamine+ve, IIF-ve/Auramine-
Rhodamine+ve and IIF+ve /Auramine-Rhodamine-ve. Surprisingly, H37Rv cells in hypoxic
culture show a higher acid-fast proportion than cells from the stationary phase culture
(Ryan et al., 2010).
Chapter 4. Microscopic studies of M. tuberculosis in sputum
112
Deb et al. (2009) established a novel in vitro multiple-stress dormancy model for Mtb
by exposing the bacilli to combined stresses of hypoxia (5% O2), high CO2 (10%),
nutrient starvation (10% Dubos medium), and acidic pH (5.0), where these conditions
are thought to reflect the Mtb in vivo. The study revealed that Mtb under these stresses
stopped replicating, lost acid-fastness, accumulated TAG and WE, and became
tolerant to anti-mycobacterial agents (Deb et al., 2009). Another in vitro model used
H37Rv under gradual O2 depletion and after 30 days of incubation, the AF percentage
dropped from 70% to 40% whereas the LB percentage increased from 30% to 60%
(Shi et al., 2010). Recently, Kapoor et al. (2013) developed an in vitro granuloma
model reflecting the in vitro granuloma condition and found that the Mtb bacilli lost the
acid-fastness and accumulated LBs (Kapoor et al., 2013).
In sputum, the current study showed that all sub-populations that have been found in
pure culture were found homogeneous over the studied sputum samples. Because it
was already known through this work that a tubercle sputum sample has non-AF
population, it was therefore expected that this population would be found in most
samples. Surprisingly, IIF staining failed to detect all Mtb populations in sputum. Three
new sub-populations were detected in sputum using the IIF/Auramine O/RLx triple-
staining technique in addition to the four that were found in pure culture. The first four
populations were detected in both pure culture and sputum and were: (IIF+ve /Auramine
One of the aims of this study is to identify the AF-ve/LB+ve populations in sputum that
have the same morphology as Mtb to secure the hypothesis that these are non-AF
Mtb. In all sputum samples that were used in this study it was observed that the total
cell number of the IIF-ve/AF-ve/LB+ve population varied between 8%-33%. Thus, effort
was placed into applying this technique to identify this population. Currently, there is
no published study that applies the IIF/Auramine O/RLx simultaneous triple-staining
technique on Mtb from a sputum sample.
This study found the different cell populations that reflect the heterogeneous
environment of Mtb in sputum, which is coughed up from the cavitary lesion from the
lung. The IIF staining failed to detect the AF-ve/LB+ve population in sputum as the total
cell number of IIF+ve /LB+ve was lower than 5%. Although, Auramine O is believed to
target cell-wall contents (Seiler et al., 2003 and Ulrichs et al., 2005), and IIF is
Chapter 4. Microscopic studies of M. tuberculosis in sputum
113
targeting the surface Ags, it is unclear why the IIF results in poor labelling of Mtb in
sputum. Because the Rv antibody that was used to label Mtb in sputum in this study is
raised from H37Rv live infection in Guinea pig, the growth stage might be from the
mid-exponential phase. Mtb bacilli in sputum are also thought to be at NRP state;
therefore, the expressed Ags at this stage might be different than the surface proteins
of the mid-exponential phase cells. Also, bacilli in different environment in sputum
compared with Guinea pig infection. Guinea pig foci of infection don not breakdown
and form cavities as Mtb in human (Clark-Curtiss, 1994). As a result the surface Ags of
Mtb in human sputum might be different than Guinea pig infection.
Another observation that could be seen in Mtb from sputum when stained with IIF is
the punctuate staining manner. This characteristic was observed only with Mtb from
sputum. This is in contrast to Auramine O staining which shows uniform labelling on
Mtb from sputum. It has been reported that Mtb could show punctuated Ab labelling
when it is exposed to a hypoxic condition (Ryan et al; 2010). It has also been reported
from the same study that Mtb showed the same staining manner from mice and
Guinea pig tissues (Ryan et al., 2010).
It has been hypothesized that Mtb could alter its metabolic activities depending on the
environment in order to survive (Jamshidi et al., 2007). Therefore, it might be that the
set of surface Ags expressed by Mtb in vitro are different to in vivo surface Ags. The
lack of detection of IIF in sputum might be due to the effect of sputum, which masks
the surface Ags of Mtb bacilli. Furthermore, when Mtb cells show punctuate labelling it
is more likely to raise the IIF-ve population in contrast to the pure culture where the IIF
labelling is uniform and the detection proportion is around 100%. In contrast, Auramine
O shows a higher detection of Mtb in sputum. The identification of the AFB-ve/LB+ve
population was not achieved by the IIF/Auramine O/RLx triple-staining technique.
There is a significantly high proportion of this population in all sputum samples that
were used in this study. Hence, the PNA/Auramine O/RLx triple-staining technique
was applied in an attempt to identify this population.
4.5.2. M. tuberculosis populations revealed by PNA, Auramine O and RLx
triple-staining from pure culture and sputum
In the current study, an OK682 PNA probe using FISH was assessed for the ability to
label all Mtb populations in pure culture and a sputum sample by targeting the 23S
rRNA. It has been observed that the MFI of H37Rv cells differed during the growth
cycle. In the mid-exponential phase where growth is maximal active, the signal
Chapter 4. Microscopic studies of M. tuberculosis in sputum
114
reaches the highest intensity then it goes down gradually to the lowest intensity at the
stationary phase of growth. It has also been observed that PNA+ve Mtb cells in sputum
differ in PNA intensity as some cells look brighter than others. This could reflect cells in
sputum are in different growth states. These findings together indicate that Mtb bacilli
in vitro and in vivo environments differ in their ability to be identified by the FISH
technique. The lack of fluorescence intensity in a sputum sample may be due to a
decrease of the numbers of rRNA in Mtb within the necrotic lesions in the lung cavity
that are below the limits of PNA-FISH detection. Another explanation is that Mtb bacilli
in sputum came from the NRP state and due to the alternation of the cell wall, might
become impermeable to the PNA probe.
In a study to detect multiple Mtb populations in vivo and in vitro (Ryan et al., 2010), it
was observed that the signal of a ssDNA-FISH probe targeting the 16S rRNA is higher
in H37Rv under hypoxia, lower in Mtb in mice tissue, and there is no signal in Guinea
pig tissue (Ryan et al., 2010). Although, the human granuloma is presumed to be
hypoxic (Lenaerts et al., 2007 and Via et al., 2008), it was observed that FISH yielded
a strong signal for Mtb in culture under hypoxia (Ryan et al., 2010). This finding
indicates that the hypoxic condition is not the only stimulus that decreases the rRNA
ssDNA-FISH signal. This finding also indicates that ssDNA-FISH has different staining
ability according to the microenvironment. Another in vitro study on Mtb reported that
the level of rRNA is stable during the stationary phase, aerobic NRP1 and anaerobic
NRP2 (Desjardin et al., 2001). However, in this study 23S rRNA PNA-FISH MFI was
not the same in all H37Rv growth stages. Furthermore, the signal intensity of Mtb
bacilli in sputum differs between the tubercle bacilli. Therefore, PNA-FISH staining can
discriminate between cell populations in growth and rRNA content.
According to the findings in this study, the main advantage of using IIF staining in pure
culture is to detect all Mtb populations that are labelled with IIF in all growth stages.
Thus, because there is no IIF-ve population in pure culture, the triple-staining technique
using IIF/Auramine O/RLx showed four different populations. In contrast, the sputum
sample has eight populations identified by the IIF/Auramine O/RLx triple-staining
technique. PNA/Auramine O/RLx triple-staining also identified four extra populations in
addition to the four that IIF detected in pure culture. These populations were detected
in all the sputum samples.
The PNA-ve populations might indicate the downregulation of the rRNA in these cells.
Also, in a comparison between IIF and PNA triple-staining on sputum, PNA triple-
staining detects more Mtb cells than IIF. This might be due to Triton-X, which helps the
Chapter 4. Microscopic studies of M. tuberculosis in sputum
115
PNA probe get into the Mtb cell. It also might be due to the nature of sputum masking
the targets of the IIF staining. The main drawback of using PNA staining in this study
was the high background that might interfere with the cell detection. The washing time
was extended to various time points with no significant improvement in background as
a result.
One observation seen clearly in PNA labelling on Mtb from sputum is that the
punctuate PNA cellular labelling pattern shows a different appearance on Mtb from
pure culture. The discrete spots of the PNA probe on Mtb cells in sputum are brighter
than the spots in H37Rv from pure culture and also different in morphology. This might
because this probe was designed specifically to detect Mtb from sputum (Stender et
al., 1999), where cells have different permeability than pure culture.
The Mtb populations that were detected with PNA triple-staining technique correlate
with the populations that were detected with IIF triple-staining. The target population,
AFB-ve/LB+ve was still not detected by any of these techniques as the total number of
this population is more or less similar by both staining approaches. By using
PNA/Auramine O/RLx triple-staining technique, the total cell number that was detected
by Auramine O alone is still significantly high compared with the total number detected
by PNA. Due to hypoxic stimulus in the lung granuloma, which is the source of Mtb in
sputum, protein and RNA synthesis is known to be significantly reduced (Dick, 2001,
Wayne et al., 2001 and Voskuil et al., 2004), and this might explain why IIF and PNA
failed to detect all Mtb populations from sputum.
The OK682 probe has been shown to have 100% diagnostic sensitivity (Stender et al.,
1999). This probe was also used in this project to detect Mtb from sputum and pure
culture. However, in Stender’s study only two sputum samples were assessed, and
there have been no further publications based on this method, which might indicate
that other sputum samples may vary in their susceptibility to staining with PNA-FISH.
For these reasons, to ameliorate any lack of detection by IIF and PNA, other staining
techniques were used in this study to detect and identify putative AFB-ve/LB+ve
populations in sputum.
Chapter 4. Microscopic studies of M. tuberculosis in sputum
116
4.5.3. Revealing the multiple M. tuberculosis populations in sputum by
Auramine O/RLx and fluorescence Kinyoun/GLx dual-staining
techniques
Previous sections of this discussion showed that IIF and PNA staining techniques
failed to detect the majority of Mtb in sputum. It was also noticed that Auramine O
detects a higher number of Mtb than IIF and PNA. However, Auramine O still misses
some cell populations that are thought to be Mtb, according to their size and
morphology.
A systemic review (Steingart et al., 2006) included 45 studies and compared Auramine
O staining with the conventional Z-N staining method (bright-field detection). The
review reported that Auramine O is significantly greater diagnostic sensitivity than Z-N
staining by an average of 10%. Furthermore, the same review showed that the
specificity of Auramine O and conventional Z-N are similar at 98%, with both excluding
HIV-infected individuals (Steingart et al., 2006). Our study has shown that using a
fluorescence detection of CF raises the sensitivity of the cell detection compared with
the Auramine O. This finding is identical with those using Z-N under fluorescence
microscopy, instead of the transmitted light approach, which was developed recently
(Shapiro et al., 2008). Thus, the Kinyoun staining technique was developed for use by
detecting fluorescence of CF detection rather than under transmitted light.
The average cell number of Mtb per 20 fields of fluorescence Kinyoun was significantly
higher than Auramine O in 3 sputum samples out of the 5 samples studied. Also, none
of the sputum samples showed a higher detection with Auramine O than fluorescence
Kinyoun. In order to achieve the aim that AFB-ve/LB+ve should be identified as Mtb by a
staining method, the same three sputum samples were used with both IIF and PNA
triple-staining techniques, and were used in the Auramine O/RLx and fluorescent
Kinyoun/GLx dual-staining techniques. These populations of AFB-ve/LB+ve were
identified with the Kinyoun dual technique as the total number of cells staining with
alone GLx was almost 0% in all three sputum samples. The hypothesis that the AFB-
ve/LB+ve population is Mtb bacilli is positively confirmed by showing that Mtb cells
detected by fluorescence Kinyoun/GLx population are significantly higher than the
Auramine O/RLx population.
In a study of Mtb in multiple stress conditions the Auramine O staining AFB+ve
proportion increased as the LB+ve proportion decreased as the culture aged (Deb et al.,
2008), a similar situation is described here. This was shown when the total number of
Chapter 4. Microscopic studies of M. tuberculosis in sputum
117
Mtb cells detected in sputum by RLx in Auramine O/RLx dual-staining increased, the
Auramine O total cell number decreased and vice versa. However, this assessment
requires more than 10 sputum samples.
Counting Mtb populations from sputum might have some limitations as the process
was done manually by eye. Therefore, identifying these populations using a
microscopically automated counting method is more reliable than manual counting.
Thus, Image-J-based software was developed by (Bell, 2013) to count Mtb LB+ve cells
from sputum by comparing the AF staining field with the fluorescence LipidTox field,
which are detected by dual-staining techniques. The automated counted method offers
more reliable results as it relies less as operator input. The comparison between the
manual and the automated counting showed that both counting techniques are highly
correlated. Thus, the manual counting results of LB+ve proportion using the triple and
dual-staining technique are reliable, but might have high bias probability.
Chapter 4. Microscopic studies of M. tuberculosis in sputum
118
4.6. Conclusions
The work presented in this chapter shows that sputum samples contain multiple Mtb
populations. Some sub-populations failed to be stained with conventional fluorescence
staining techniques perhaps due to different cell envelope compositions of Mtb bacilli
in sputum. It was possible to detect AFB-ve/LB+ve bacilli with fluorescent Kinyoun
staining and it was shown to be one of the Mtb sub-populations in sputum.
Fluorescence Kinyoun reveals that the majority of the Auramine O-AFB-ve/LB+ve
population is fluorescence Kinyoun-AFB+ve/LB+ve. Furthermore, manual counting
method is significantly and highly correlated with the automated counting method
which reflects reliable counting numbers in this study.
The principle findings of this chapter include:
Auramine O, IIF and PNA staining techniques failed to detect all Mtb
populations from sputum
The number of Mtb population detected by IIF is different that number of
populations detected with PNA
IIF and PNA staining techniques detected just a few bacilli in sputum compared
with Auramine O
Fluorescence Kinyoun staining was able to detect almost all Mtb populations in
sputum
The non-Auramine O-AFB Mtb cells are more likely to be LB+ve
The manual counting method of the triple- and dual-staining technique
correlated with the automated counting method.
Chapter 5
Characterising M. tuberculosis in
biofilms
Chapter 5: Characterising M. tuberculosis in Biofilms
119
5.1. Introduction
Numerous studies have been performed to understand Mtb physiology in the
pulmonary cavity specifically in granulomatous lesions (Canetti, 1955a, Saunders and
Cooper, 2000, Peyron et al., 2008, Kruh et al., 2010; Kumar et al., 2011, Kapoor et al.,
2013). Indeed, understanding TB physiology in its microenvironment can offer more
efficient treatments and control of the disease (Stokes et al., 2009). Therefore, it is
increasingly important to determine the conditions that produced the phenotypes that
have been observed in sputum. One way to understand these conditions and give
further insight into Mtb physiology is to replicate the Mtb phenotypes in vitro.
Lee, (2012) has compared the gene expression of Mtb in sputum against Mtb exposed
to in vitro stimuli. Data from this study revealed that no obvious growth condition fully
replicated the sputum transcriptome. However, gene expression of Mtb cultures
exposed to multiple stimuli such as RPMI or PBS medium, cholesterol, nitric oxide
(NO), oleic acid (OA) and static incubation correlates significantly to sputum
transcriptome (Lee, 2012).
In this part of the project the capacity of an in vitro biofilm system to replicate the Mtb
sputum phenotypes was explored. Mycobacterial biofilms were discussed in Section
1.8.3.
5.1.1. M. tuberculosis features in sputum
The features of Mtb bacilli in sputum have been described in chapter 1. All three
aspects, cytological, transcriptional and growth related have been explored in biofilm
cultures in this chapter. In the transcriptional studies a subset of genes differentially
expressed in sputum was chosen to screen for comparable expression in vitro. These
had been selected by a previous worker in this lab (Lee, 2012)
5.1.2. Genes selected to represent the sputum transcriptome
Twenty selected genes (10 upregulated and 10 downregulated) from the sputum
transcriptome were compared with the gene expression of Mtb exposed to in vitro
conditions. These 20 genes were selected, as they were the only genes that up or
down regulated >2.5-fold in the sputum transcriptome (Figure 46). Each one of these
genes reflects function hypothesised to be affected by one or more of the selected
Chapter 5: Characterising M. tuberculosis in Biofilms
120
growth conditions in this study. These 20 genes include DosR regulon genes, genes
involved in lipid and cholesterol metabolisms, virulence, toxin-antitoxin system, aerobic
respiration, MA metabolism, and ribosomal genes.
S e le c te d g e n e e x p re s s io n in s p u tu m
(M ic ro a rra y D a ta )h
sp
X
Rv
35
51
tgs
1
icl1
na
rk
2
vir
S
mc
e3
C
ltp
2
Rv
31
80
c
pp
sA
Rv
11
03
c
atp
D
Rv
21
41
c
qc
rC
mm
Aa
2
cta
D
nu
oL
mc
e1
A
nu
oB
rp
sL
- 6
-3
0
3
6
log
2(f
old
ch
an
ge
)
G e n e s
Figure 46: Microarray data of the Selected Gene Expression of M. tuberculosis in sputum.
The bar chart shows the microarray data gene expression of the 20 selected target genes of Mtb in Sputum (Garton et al.; 2008). The X-axis represents the 20 selected genes, whereas the Y-axis represents the Log2-fold change of each individual gene. Genes on the X-axis were arranged from the highest upregulation (the first 10 genes) to the lowest downregulation (the second 10 genes).
In this study, 4 housekeeping genes were selected and used for normalisation. These
reference genes were selected according to a previous study by Lee (2012). The study
measured and compared the Average Expression Stability (M) of 11 candidate
reference genes, including sigA and 16S rRNA, in different Mtb growth conditions.
The study concluded that sigA and 16S rRNA are the least stable whereas the four
housekeeping genes (thyA, dfrA, aroA and polA) are the most stable genes. Therefore,
these reference genes were used in the current study. Gene products and functions of
the selected genes are summarised in Tables 15 and 16. In addition, the use of 5
different housekeeping genes was considered to normalise gene expression ratios.
These are summarised in Table 17.
Chapter 5: Characterising M. tuberculosis in Biofilms
121
Table 15: Upregulated M. tuberculosis genes in sputum transcriptome.
mce3C Rv1968 Mammalian cell entry family protein (possible cell invasion protein)
Thought to be involved in host cell invasion (Tekaia F et al;
1999)
ltp2 Rv3540c Probable lipid transfer protein or Keto Acyl-CoA Thiolase
Supposed involvement in lipid and cholesterol metabolism. Member of the putative kstR regulon that controls cholesterol utilisation
(Sassetti CM et al; 2003)
Rv3180c Rv3180c
Conserved hypothetical; possible toxin (part of toxin-antitoxin operon with Rv3181c)
Represents a possible toxin, part of a toxin-antitoxin (TA) operon with Rv3181c. may be induced following exposure to stress conditions, allowing the cell to respond to the adverse conditions
Involved in the biosynthesis of pththioceroldimycocerosate (PDIM), a component of the cell wall. Upregulation of ppsA in sputum may help the bacillus adapt to transmission
(Camacho LR et al; 2001)
Chapter 5: Characterising M. tuberculosis in Biofilms
122
Table 16: Downregulated M. tuberculosis genes in sputum transcriptome.
Gene Gene
number Product Function Reference
Rv1103c Rv1103c
Conserved hypothetical; possible mazE3, antitoxin, part of toxin-antitoxin operon with Rv1102c
A putative antitoxin gene. Virulence, detoxification, adaptation
(Betts JC et al; 2002)
atpD Rv1310 Probable ATP synthase beta chain
Produces ATP from ADP in the presence of a proton gradient across the membrane. [Catalytic activity: ATP + H (2) O + H (+) (in) = ADP + phosphate + H (+) (out)]. Intermediary metabolism and respiration
(Sassetti CM et al; 2003)
Rv2141c Rv2141c Conserved hypothetical; possible protease
Identified to be downregulated on nitric oxide exposure to be similarly repressed in sputum
(Sassetti CM et al; 2003)
qcrC Rv2194 Probable Ubiquinol-cytochrome C reductase, QcrC (cytochrome C subunit)
Intermediary metabolism and respiration (Shi L et al; 2005)
Involved in mycolic acids modification (Cole ST et al; 2001)
ctaD Rv3043c Probable cytochrome C oxidase polypeptide I, ctaD
Intermediary metabolism and respiration (Sassetti CM et al;
2003)
nuoL Rv3156 Probable NADH dehydrogenase I (chain L), nuoL
Intermediary metabolism and respiration (Betts JC et al; 2002)
mce1A Rv0169 Mammalian cell entry family protein (possible cell invasion protein)
Unknown, but thought to be involved in host cell invasion (entry and survival inside macrophages). The disruption of the complete mce1 operon led to a hypervirulent mutant
(Flessells B et al; 1999)
nuoB Rv3146
Probable NADH dehydrogenase I (chain B) NuoB (NADH-ubiquinone oxidoreductase chain B)
Protein S12 is involved in the translation initiation step
(Mulder MA et al; 1997)
Chapter 5: Characterising M. tuberculosis in Biofilms
123
Table 17: Housekeeping genes for M. tuberculosis
Gene Gene
Number Product Function Reference
16S rrs Ribosomal RNA ( 16S ) component of small prokaryotic ribosomal subunit (30S)/interacts with 23S subunit.
Translation, ribosomal structure and biogenesis
(Garton NJ et al; 2008)
Rv 2703
sigA The sigma factor is an initiation factor that promotes attachment of the RNA polymerase to specific initiation sites and then is released. This is the primary sigma-factor of these bacteria.
RNA-polymerase sigma factor A –sigA is an initiation factor that promotes attachment of RNA polymerase to specific initiation sites and then is released.sigA is the primary sigma-factor of these bacteria. Supposedly involved in the housekeeping regulons
(Garton NJ et al; 2008)
Rv2764a
thyA Probable thymidylate synthase ThyA (ts) (TSASE). Involved in deoxyribonucleotide biosynthesis. Provides the sole de novo source of dTMP for DANA.
Involved in the biosynthesis of chorismate within the biosynthesis of aromatic amino acids (the shikimate pathway). Acts in the sixth step of this pathway
(Parish and Stoker,2002)
Rv1629 polA Probable DNA polymerase I PolA.
Involved in post-incision events. In addition to DNA polymerase activity, this DNA polymerase exhibits 3' to 5' and 5' to 3' exonuclease activity
(Institut Pasteur, 2004, Huberts and Mizrahi, 1995)
Chapter 5: Characterising M. tuberculosis in Biofilms
124
5.2. Aims and objectives
To develop an in vitro Mtb biofilm system and determine the degree to which it
replicates the Mtb phenotypes that were seen in sputum.
The specific objectives were to:
1. Develop an Mtb biofilm system under various growth conditions.
2. Use of qPCR to analyse the gene expression of Mtb biofilm layers.
3. Compare the biofilm gene expression of Mtb biofilm layers to sputum
microarray data.
4. To measure if growth is occurring during biofilm formation by assessing
the uptake of 3H uracil by Mtb biofilm layers.
5. Assess the tolerance of Mtb biofilm layers to INH and RIF.
6. Assess the ability of Mtb biofilm layers to replicate sputum phenotypes in
terms of:
I. LB and AF proportions
II. Tolerance to RIF and INH
III. Formation of Rpf-dependant populations
Chapter 5: Characterising M. tuberculosis in Biofilms
125
5.3. Methods
5.3.1. M. tuberculosis basic biofilm culture development
The Mtb biofilm was developed according to Ojha et al, 2008 protocol. Mtb H37Rv and
Beijing65 strains from mid-exponential phase were grown in 7H9 Middlebrook broth
supplemented with ADC and Tween-80 as a starter culture. Mtb biofilms were grown in
24-well polystyrene tissue culture plates (Corning®Costar® Cell Culture Plates) by
inoculating 2 ml of warmed (37°C) Sauton`s medium (no Tween-80) with 30 μl of
saturated Pk Mtb cells. The plate was sealed with PetriSEAL™ tape properly, double
bagged with wet tissue to ensure the humidity and then placed into a plastic box
incubated statically at 37°C for 5 wks.
5.3.2. Stimuli added to the biofilm and mid-exponential phase cultures
A number of stimuli were added to the biofilm and mid-exponential phase cultures
selected according to the genes that were upregulated in sputum see (Figure 46).
These included cholesterol +oleic acid (OA) +nitric oxide (NO) as test conditions that
were added to the Mtb cultures. Control conditions were made in parallel to assess the
effect of the test conditions and these include Spermine-hydrochloride (Sper) (the
endogenous polyamine, inhibits neuronal NO synthase), Methyl-β-cyclodextrin (CD)
and BSA as a control condition of the lipid and cholesterol stimulatory conditions. To
have the same oxygen exposure when the additional conditions were added, the un-
treated condition was exposed to sterile PBS.
Then, the gene expression of Mtb biofilm layers and mid-exponential phase cultures
under the selected growth conditions was compared with the sputum transcriptome. All
biofilm cultures were initially grown in Middlebrook 7H9 starter culture up to mid-
exponential phase as described in Section 5.3.1; it was then used to inoculate the
biofilm culture in Sauton’s. The mid-exponential phase culture (control) was grown
identically with the biofilm in Sauton’s medium. All Mtb biofilm cultures under the
selected growth conditions were developed in 24-well plates whereas all mid-
exponential phase cultures were grown in 25ml conical flasks. Mtb H37Rv and
Beijing65 cultures used in this study were:
Chapter 5: Characterising M. tuberculosis in Biofilms
126
Biofilm grown with cholesterol and exposed to NO+OA for 4h (Ch+NO+OA)
(Test).
Biofilm grown with CD and exposed to Sper+BSA for 4h (CD+Sper+BSA)
(Control).
Biofilm culture exposed to PBS for 4h (un-treated condition).
Mid-exponential culture grown with cholesterol and exposed to NO+OA for 4h
(Mid-Exp (Ch+NO+OA)).
Mid-exponential culture grown with CD and exposed to Sper+BSA for 4h (mid-
Exp (CD+Sper+BSA)).
Un-treated mid-exponential culture.
5.3.3. Harvesting of Biofilm layers
The developed biofilm culture was separated into three layers:
1- Pk biofilm layer, non-attached cells in the middle of the biofilm (see Figure 47),
was separated by piercing the top layer of the biofilm with a 1 ml sterile-filtered
pipette tip gently and withdrawing the cell suspension. Three-quarters of the
biofilm liquid was taken into 5 ml-bijoux tube (Sterillin, Bargoed), to ensure that
the top layer did not touch the bottom biofilm layer.
2- Pellicle (the top air-liquid interface) layer was separated by adding the same
original amount of warmed biofilm medium (37°C), onto the biofilm to aid the
Pellicle harvesting by resuspending thoroughly using 1 ml sterile-filtered pipette
tip into the same liquid medium of the original biofilm.
3- Att biofilm layer was harvested by washing the Att biofilm with the same
original amount of warm biofilm medium 3 times gently to remove the other
non-attached biofilm cell layers. The Att cells were then harvested by carefully
scraping the surface with a pipette tip into with the same volume of warmed
medium. This was then transferred into 5 ml-bijoux tube. The biofilm harvesting
process is explained in Figure 47.
Chapter 5: Characterising M. tuberculosis in Biofilms
127
1 P la n k to n ic c e lls
h a rv e s tin g
2 P ellic le
h a rv e s tin g
3 A tta c h e d c e lls
h a rv e s tin g
3 m l
w a r m e d
S a u to n `s
3 X w a s h in g
w a r m
S a u to n `s
Figure 47: Schematic diagram of biofilm harvesting steps.
The figure shows the 3 harvesting steps of Mtb biofilm. The harvesting protocol was done in 12-wells & 24-wells flat microtitre polystyrene plates (Corning, UK).
Chapter 5: Characterising M. tuberculosis in Biofilms
134
as 3H Uracil whereas the second section was labelled as CFU, MPN and DNA and
RNA extractions. The biofilm plates then were sealed with plastic sealing tape and
incubated at 37°C statically. The biofilm harvested in four time points from the 2nd–5th
wk. Prior harvesting, each well of the first section was injected with 16.4 µl of 3H uracil
(Perkin Elmer, 36 Ci/mmole) to reach the final radioactive concentration of 1.09
µCi/well and the second section was injected with 16.4 µl of sterile PBS as a control for
the possible disturbance of the Pellicle layer. The biofilm plate was then sealed with
plastic sealing tape and incubated at 37°C statically for 30 h. When ready, the biofilm
was harvested and processed as following:
Section1: Cells were harvested from the first 6-wells to 3 different layers:
1- The Pk layer in the middle: 2 ml from each well was harvested using 1ml filter tip
into sterile 50ml falcon tube to a final pooled volume of 12ml.
2- The Pellicle layer: was harvested from each well using 1ml sterile filter tip and
resuspended in 18ml of Sauton`s in sterile 50ml falcon tube..
3- The Att layer: was washed twice with sterile warmed Sauton`s carefully. The layer
then harvested from each well by resuspending cells in 3ml Sauton`s medium by
scratching the plastic well bottom with a 1ml filter tip. Cells were then transferred into
sterile 50ml falcon tube to a final pooled volume of 18ml.
Tubes were centrifuged at 2000 xg for 10 minutes and the supernatant was removed
to the radioactive aqueous waste bottle. The pellet was resuspended in PBS to the
same original volume, centrifuged at 2000 xg for 10 minutes and the supernatant was
removed leaving 1ml in the falcon tube. Cells were then transferred to a sterile 1.5ml
microfuge screw cap tube and centrifuged at 9600 xg for 2 minutes. Supernatant was
discarded and cells were resuspended in 300µl PBS.
3H Uracil measurements
To measure the incorporation of 3H uracil, 100µl from each layer was transferred to a
plastic scintillation tube. This step was done in triplicate for each layer. 231µl of
absolute ethanol was added to the cells (final concentration of 70% v/v ethanol); the
tubes were capped and kept in the cabinet overnight to kill the viable mycobacteria.
Prior to measuring the label, 2.5ml of Emulsifier safe scintillation fluid was added to
Chapter 5: Characterising M. tuberculosis in Biofilms
135
each tube. Tubes were then capped tightly and were taken to the scintillation counter
for measurement.
Harvesting Section2 for CFU, MPN and DNA and RNA extractions: Cells were
harvested and separated into 3 layers:
Biofilm cells harvesting was done as mentioned above in Section 5.3.2. Following
washing, pellets were resuspended in 2ml PBS. The cell suspension then was used to
count the Mtb H37Rv cells by MPN, CFU, RNA and DNA extraction techniques as
described previously.
Chapter 5: Characterising M. tuberculosis in Biofilms
136
5.4. Results
5.4.1. Biofilm development
Mycobacterial biofilms have been attributed to the pellicle formed at the liquid-air
interface in a diversity of synthetic media (Ojha et al., 2008 and Sambandan et al.,
2013). However, in these experiments biomass was assessed in of three different
layers. Each one of these layers contains different cell numbers. These layers are: the
top Pellicle layer at the air-interface of the biofilm, the Pk layer in the middle of the
biofilm mass and the bottom layer with attached to the plastic surface (Att) (Figure 48).
Each individual layer was analysed in this chapter.
Figure 48: Classification of mycobacterial biofilm layers.
Biofilms were developed in 12-well sealed microtitre plates over 5 wks static incubation according to Ojha et al.; 2008. Image (A) shows the Mtb H37Rv biofilm, whereas (B) shows M .bovis BCG (Glaxo) biofilm. The two biofilms show distinctive appearance of colour and morphology. The schematic (C) represents the observed layers. Biofilms were harvested separately into three layers as mentioned in section 5.3.3: Pellicle (Pellicle) the top layer, Pk (Pk) in the middle and cells Att (Att) to the plastic surface.
5.4.2. Biofilm layers yield different colony morphologies
The Mtb H37Rv biofilm cells grown in Sauton`s and aerated grown mid-exponential
H37Rv cells in Sauton’s were cultured on sealed Middlebrook 7H10 agar for 30 days.
Figure 49 shows distinctive Mtb colonies derived from the different layers compared to
a subculture from a mid-exponential culture. Att and Pk biofilm colonies appear smaller
in size compared with the Pellicle and mid-exponential phase colonies. Also, the
biofilm colonies show rougher colonies compared to the mid-exponential phase
derived colonies.
A B C
Chapter 5: Characterising M. tuberculosis in Biofilms
137
M id -E x p A tta c h e d P la n k to n ic P e ll ic le
Figure 49: Phenotypic changes of M. tuberculosis cells.
Images display the phenotypic changes of Mtb H37Rv cells from the control mid-exponential phase cells, Att, Pk and Pellicle biofilm cells in Sauton’s. Cells were cultured from biofilm culture in Sauton’s then 20 µl was spotted in 7H10 agar. Representative colonies were taken after 30 days of incubation. Scale bars 1.5mm.
Chapter 5: Characterising M. tuberculosis in Biofilms
138
5.4.3. Biofilm gene expression
5.4.3.1. Experimental strategy
The experimental strategy that was used to measure the Mtb biofilm gene expression
is detailed in Figure 50.
Figure 50: Schematic diagram of the gene expression process.
This diagram represents the gene expression steps starting from the preparation of Mtb starter culture and ends with the q-PCR and data analysis.
Chapter 5: Characterising M. tuberculosis in Biofilms
139
This experiment was performed initially as described in Section 5.3.1 by developing
the Mtb biofilm and mid-exponential cultures in Sauton`s medium under four initial
growth conditions (see Section 5.3.2). These conditions are Mtb biofilm with
cholesterol+CD, control (CD), un-treated biofilms and mid-exponential phase cultures.
The additional stimuli were added to the 5-wk biofilms and mid-exponential phase.
5.4.3.2. Gene expression of M. tuberculosis H37Rv biofilms exposed to
selected stimuli
After harvesting and separating the biofilm into three layers (Att, Pk and Pellicle) as
described in Section 5.3.3, the mRNA of all cultures was extracted, cleaned, and
reverse transcribed into cDNA and diluted 1:3 as described in Section 5.3.4. The
qPCR was done in triplicate, and then the data analyses including the comparison with
the gene expression of the mid-exponential phase were performed as mentioned in
Section 5.3.4.
The results of the gene expression patterns for Mtb biofilms under the selected
conditions are shown in Figure 51. The results showed that most of the 10 selected
genes, which were dowregulated in sputum transcriptome, are repressed in all biofilm
conditions. Most of them are genes involved in the aerobic respiration. The DosR
regulon genes (hspX, tgs1 and nark2), which were significantly upregulated in sputum
and known to be upregulated under stress conditions, are upregulated in all Att and Pk
biofilm conditions. The tgs1 was significantly upregulated in test condition compared to
the control and un-treated conditions in both Att and Pk biofilm cells. Likewise, DosR
regulon genes were significantly induced in mid-exponential phase test condition. The
FA enzyme icl1, the gene originally recognised under NRP conditions by Wayne and
Sohaskey (2001) and essential for Mtb pathogenesis and intracellular survival in mice
infection (Munoz-Elias and McKinney, 2005), was repressed in all biofilm conditions.
However, the icl1 was significantly repressed in un-treated Pk and Pelli biofilm cells
compared to the test and control. In contrast, icl1 was significantly upregulated in the
mid-exponential phase test condition. The ribosomal gene rpsL was significantly
repressed (>2.5-fold) in all biofilm conditions.
Furthermore, the results showed that ppsA, as the component of the cell wall that is
involved in the biosynthesis of PDIM and plays a role in countering the early immune
response of the host (McKinney, 2000), was downregulated in all biofilm conditions.
Similarly, virS the gene that is involved in virulence and significantly induced in sputum
was downregulated in all biofilm conditions. Surprisingly, most genes in Pellicle biofilm
cells under all conditions were downregulated (Figure 51).
Chapter 5: Characterising M. tuberculosis in Biofilms
140
hs
pX
Rv
35
51
tgs
1
icl1
na
rk
2
vir
S
mc
e3
C
ltp
2
Rv
31
80
c
pp
sA
Rv
11
03
c
atp
D
Rv
21
41
c
qc
rC
mm
Aa
2
cta
D
nu
oL
mc
e1
A
nu
oB
rp
sL
-1 2
-6
0
6
1 2
log
2(f
old
ch
an
ge
)
H 3 7 R v A tt b io f ilm g e n e e x p re s s io n
C D A tt S p e r+ B S A
C h o le A tt N O + O A
A tt
* * *
**h
sp
X
Rv
35
51
tgs
1
icl1
na
rk
2
vir
S
mc
e3
C
ltp
2
Rv
31
80
c
pp
sA
Rv
11
03
c
atp
D
Rv
21
41
c
qc
rC
mm
Aa
2
cta
D
nu
oL
mc
e1
A
nu
oB
rp
sL
-1 2
-6
0
6
1 2
log
2(f
old
ch
an
ge
)
H 3 7 R v P k b io film g e n e e x p r e s s io n
C D P k S p e r+ B S A
C h o le P k N O + O A
P k
* *
hs
pX
Rv
35
51
tgs
1
icl1
na
rk
2
vir
S
mc
e3
C
ltp
2
Rv
31
80
c
pp
sA
Rv
11
03
c
atp
D
Rv
21
41
c
qc
rC
mm
Aa
2
cta
D
nu
oL
mc
e1
A
nu
oB
rp
sL
-1 2
-6
0
6
1 2
log
2(f
old
ch
an
ge
)
H 3 7 R v P e lli b io f ilm g e n e e x p re s s io n
C D P e lli S p e r+ B S A
C h o le P e lli N O + O A
P e lli
**
hs
pX
Rv
35
51
tgs
1
icl1
na
rk
2
vir
S
mc
e3
C
ltp
2
Rv
31
80
c
pp
sA
Rv
11
03
c
atp
D
Rv
21
41
c
qc
rC
mm
Aa
2
cta
D
nu
oL
mc
e1
A
nu
oB
rp
sL
-1 2
-6
0
6
1 2
log
2(f
old
ch
an
ge
)
C h o le M id -E x p N O
C y c lo M id -E x p S p e r
H 3 7 R v m id -e x p g e n e e x p re s s io n
A
B
C
D
*
***
***
***
Chapter 5: Characterising M. tuberculosis in Biofilms
141
Figure 51: The gene expression of 20 selected genes for Mtb biofilm layers under selected growth conditions
Bar charts display gene expression of 20 selected target genes in Mtb H37Rv for (A) Att biofilm with Cholesterol/Nitric Oxide/Oleic Acid, CD/Spermine-HCl/BSA, and Sauton’s, (B) Pk biofilm Cholesterol/Nitric Oxide/Oleic Acid, CD/Spermine-HCl/BSA, and Sauton’s (C) Pellicle biofilm Cholesterol/Nitric Oxide/Oleic Acid, CD/Spermine-HCl/BSA, and Sauton’s and (D) Mid-Exp phase cells with Cholesterol/Nitric Oxide/Oleic Acid and CD/Spermine-HCl/BSA. All (log2) fold changes calculated against aerobic exponential growth. Dotted line represents 2.5-fold (1log2-fold change). Asterisks indicate significant result.
5.4.3.3. M. tuberculosis H37Rv Biofilm correlation with Sputum
Transcriptome
To study the correlation of the 20 selected genes on each condition on the biofilm
layers to sputum transcriptome, Spearman’s rank correlation was used as a parametric
measurement. This is a non-paramedic test and positive correlation only reflects a
monotonic function (a function between ordered sets that preserve the given order),
which measures the strength between two ranked variables (Hollander et al., 2004).
Therefore, Spearman’s correlation statistical analysis does not essentially indicate a
linear relationship. The perfect R-Ranking is 1 or closer and the poor R-Ranking is 0 or
closer. If the R equals or is greater than 0.8, the correlation is strong, whereas if the r
is 0.5 or less, the correlation is weak (Grzegorzewski et al., 2011). This particular
measurement was used because the microarray gene expression data of sputum had
non-Gaussian’s distribution. P-values, R-rank values and 95% confidence intervals
were calculated and are displayed in Table 18.
Table 18: Spearman’s Rank Correlation R and p-values are displayed for each condition of H37Rv vs. Sputum Gene Expression.
Sample Ch-NO-OA Cyclo-Sper.HCl-BSA No additional stimuli
Chapter 5: Characterising M. tuberculosis in Biofilms
142
The results show significant correlation between all Pk biofilm conditions studied and
sputum microarray gene expression, with P-values of <0.05 and higher R values than
all the other conditions examined (Figure 52). Also, each Pk culture harvested showed
predominant changes in expression pattern consistent with sputum: Ch+NO+OA
biofilm (6/10 up, 9/10 down), CD+Sper+BSA biofilm (7/10 up, 9/10 down) and the
Biofilm control (4/10 up, 9/10 down). These patterns are closer to sputum microarray
gene expression as indicated by the 95% confidence intervals. The higher correlation
with sputum is for the downregulated genes by >2-fold (1 log2) downregulated in all
conditions. The upregulated genes in sputum tgs1, hspX and narK2, which are part of
the DosR regulon are shown to be upregulated in all Pk biofilm conditions.
Icl1, which was shown to be significantly upregulated in sputum, is downregulated in
all Pk biofilm conditions. The results of the gene expression of the Pk biofilm from all
conditions revealed that the exposure to NO for 4 h doesn’t affect the level of the DosR
regulon genes expression significantly with hspX and narK2, whereas tgs1 shows
significant effect of NO on gene expression. Furthermore, Rv2141c, which is
downregulated during exposure to NO, is downregulated in all PK biofilm growth
conditions. Ltp2, which controls cholesterol utilisation, is upregulated in Pk biofilm test
condition that contains cholesterol, whereas the control condition is downregulated.
Also, the results show downregulation of the rpsL in all Pk biofilm conditions. This
indicates that Pk cells might be in an NRP state within the H37Rv biofilm.
Chapter 5: Characterising M. tuberculosis in Biofilms
143
-2 0 -1 0 1 0 2 0
-2 0
-1 0
1 0
2 0
R = 0 .8 6 2 3
P < 0 .0 0 0 1
C y c lo d . P K . S p e r .
Sp
utu
m
- 2 0 -1 0 1 0 2 0
-2 0
-1 0
1 0
2 0
R = 0 .8 3 6 0
C h o le . P K . N O
Sp
utu
m
P < 0 .0 0 0 1
A B
-2 0 -1 0 1 0 2 0
-2 0
-1 0
1 0
2 0
R = 0 .7 1 0 3
P =
P K S a u to n `s
Sp
utu
m
0 .0 0 0 4
-2 0 -1 0 1 0 2 0
-2 0
-1 0
1 0
2 0
R = 0 .5 8 8 4
P < 0 .0 0 0 1
C h o le . A tt . N O
Sp
utu
m
C D
Figure 52: Scatter Plots showing H37Rv biofilm gene expression patterns correlating best with Sputum Microarray Gene Expression.
Scatter plots representing gene expression for Mtb H37Rv biofilms with multi-stimuli versus Sputum Microarray gene expression. (A) Pk biofilm Cholesterol/Nitric oxide/OA (B) Pk biofilm CD/Spermine-HCl/BSA, (C) Pk biofilm in Sauton`s and (D) Att biofilm Cholesterol/Nitric oxide/OA. Graphs show the closest correlation conditions to Sputum Gene Expression. Spearman’s Rank Correlation R and p-values are displayed for each graph.
The H37Rv Att biofilm test culture with Cholesterol+CD and exposed to NO+OA
comes after the Pk biofilm layers by correlation with sputum transcriptome with
significant P-value of <0.05. The gene expression pattern of the Att biofilm test
condition shows 6 upregulated genes out of 10 and 10 downregulated genes out of 10.
Nevertheless, the Pk biofilm layers show higher downregulation level in all respiratory
genes (atpD, qcrC, ctaD, nuoB and nuoL) than the Att biofilm test condition. On the
other hand, the Att biofilm control of the test culture shows less correlation than test
culture with significant P-value. Furthermore, the rpsL gene is downregulated in all Att
biofilm conditions, which might indicate the NRP state of the Att layer. However, the
H37Rv Pellicle and mid-exponential phase show no correlation with sputum microarray
Chapter 5: Characterising M. tuberculosis in Biofilms
144
gene expression. Interestingly, in all Pellicle growth conditions, 10/10 of genes are
repressed, while 4/10 of genes on the test and control Pellicle condition and 3/10 in the
basic Pellicle culture are upregulated. NO has shown no effect on the biofilm layer’s
gene expression in contrast to the mid-exponential phase culture, which shows a
strong effect on DosR regulon genes. Rv2141c, which is known to be downregulated
with NO is shown to be 1 log2-fold upregulated with no NO exposure than with NO.
The lipid metabolism gene icl1 is known to be upregulated more than 3-fold in sputum
and is downregulated in all biofilm layers and conditions. Although the mid-exponential
phase test and control cultures show no correlation with gene expression in sputum,
the mid-exponential phase test culture with Cholesterol+NO+OA shows high
upregulation on the icl1 gene by 4 log2-fold. This indicates that the Mtb cells within the
biofilm have distinct gene expression from mid-exponential phase growth.
5.4.3.4. Gene expression of M. tuberculosis Beijing65 biofilms exposed
to selected stimuli
One of the aims of the current study is to compare between sputum transcriptome
gene expression and Mtb biofilm layers gene expression in vitro. It was used in this
comparison Mtb H37Rv laboratory strain. However, using laboratory strain may not be
the best choice to compare with Mtb gene expression from sputum. This is because
H37Rv strain has been passaged for many decades outside the host. Consequently,
the relevance of the H37Rv genome sequence to clinical Mtb strains has been
minimised (Fleischmann et al., 2002). A preliminary exploration of this hypothesis was
made using a more recently isolated Mtb Beijing strain.
Beijing clinical strain is a member family of Mtb that was thought to be originated in
Asia before spreading around the world (van Soolingen et al., 1995). This strain has
genetic advantages (Bifani et al., 2002), which allows it to be implicated to many
outbreaks and drug resistance around the world (Glynn et al., 2002). In the current
study, Mtb Beijing65 strain was prepared in a biofilm culture to compare gene
expression with the sputum pattern. The gene expression for Mtb biofilm under
selected conditions of the 20 selected genes is shown in Figure 53.
Because Beijing biofilm might have different phenotypic features than H37Rv, the gene
expression profile has different patterns. One of the obvious differences is that genes
involved in the aerobic respiration in all H37Rv Pk biofilm conditions seemed to
Chapter 5: Characterising M. tuberculosis in Biofilms
145
repress more compared to Beijing Pk biofilm conditions. The PDIM synthesis gene
ppsA was upregulated in all Beijing biofilm conditions and it is clearly induced in Att
and Pelli biofilm layers (>2.5-fold; > 1-log2 fold change) as shown in Figure 53. The
ribosomal gene rpsL was highly downregulated in H37Rv biofilm cells, in contrast to
the Beijing biofilm. The gene expression pattern of Pelli Beijing biofilm in all conditions
differed from H37Rv where most genes were downregulated. Moreover, genes
involved in aerobic respiration, such as nuoB, nuoL, ctaD, and qcrC, are
downregulated in Beijing Pk layer in all conditions in contrast to the Beijing Pelli biofilm
layer where these genes are upregulated in all conditions. In Beijing Att biofilm layer,
aerobic respiration genes are upregulated in the un-treated condition (atpD, nuoB and
nuoL are significantly induced) while in the test and control conditions these genes are
repressed (Figure 53).
One of the main similarities in the gene expression between Beijing and H37Rv strains
is the downregulation of icl1. Furthermore, the DosR regulation genes are induced in
all Beijing biofilm conditions. The results in all Beijing biofilm conditions showed no
obvious effect of the NO on the gene expression profile. The same observation was
noticed in the H37Rv gene expression profile (See section 5.4.3.2).
Chapter 5: Characterising M. tuberculosis in Biofilms
146
B e ij in g A tt b io f i lm g e n e e x p re s s io n
hs
pX
Rv
35
51
tgs
1
icl1
na
rk
2
vir
S
mc
e3
C
ltp
2
Rv
31
80
c
pp
sA
Rv
11
03
c
atp
D
Rv
21
41
c
qc
rC
mm
Aa
2
cta
D
nu
oL
mc
e1
A
nu
oB
rp
sL
-1 2
-6
0
6
1 2
log
2(f
old
ch
an
ge
)A tt
C h o le A tt N O + O A
C D A tt S p e r+ B S A
****
**
B e ij in g P k b io f i lm g e n e e x p re s s io n
hs
pX
Rv
35
51
tgs
1
icl1
na
rk
2
vir
S
mc
e3
C
ltp
2
Rv
31
80
c
pp
sA
Rv
11
03
c
atp
D
Rv
21
41
c
qc
rC
mm
Aa
2
cta
D
nu
oL
mc
e1
A
nu
oB
rp
sL
-1 2
-6
0
6
1 2
log
2(f
old
ch
an
ge
) C D P k S p e r+ B S A
P k
C h o le P k N O + O A
hs
pX
Rv
35
51
tgs
1
icl1
na
rk
2
vir
S
mc
e3
C
ltp
2
Rv
31
80
c
pp
sA
Rv
11
03
c
atp
D
Rv
21
41
c
qc
rC
mm
Aa
2
cta
D
nu
oL
mc
e1
A
nu
oB
rp
sL
-1 2
-6
0
6
1 2
log
2(f
old
ch
an
ge
) C D P e lli S p e r+ B S A
P e lli
C h o le P e lli N O + O A
B e ij in g P e ll i b io f i lm g e n e e x p re s s io n
A
B
C
Figure 53: The gene expression of 20 selected genes for Mtb Beijing65 strain biofilm layers under selected growth conditions.
Bar charts display gene expression of 20 selected target genes in Mtb Beijing65 strain for (A)
Att biofilm with Cholesterol/Nitric Oxide/Oleic Acid, CD/Spermine-HCl/BSA, Sauton’s (B) Pk
biofilm with Cholesterol/Nitric Oxide/Oleic Acid, CD/Spermine-HCl/BSA, Sauton’s and (C) Pelli
biofilm with Cholesterol/Nitric Oxide/Oleic Acid, CD/Spermine-HCl/BSA, Sauton’s Sauton’s. All
(log2) fold changes calculated against aerobic exponential growth. Dotted line represents 2.5-
correlation of the laboratory strain than the clinical strain with sputum transcriptome.
Chapter 5: Characterising M. tuberculosis in Biofilms
149
A B
C
-2 0 -1 0 1 0 2 0
-2 0
-1 0
1 0
2 0
P K C h + N O + O A
Sp
utu
m
R = 0 .5 9 2 9
P = 0 .0 0 5 9
-2 0 -1 0 1 0 2 0
-2 0
-1 0
1 0
2 0
P K C D + S p e r+ B S A
Sp
utu
m
R = 0 .5 9 7 4
P = 0 .0 0 5 4
-2 0 -1 0 1 0 2 0
-2 0
-1 0
1 0
2 0
P K (U n tre a te d )
Sp
utu
m
R = 0 .6 5 0 1
P = 0 .0 0 1 9
Figure 54: Scatter Plots comparing Pk Beijing65 biofilm in the three stimuli vs. Sputum Gene Expression.
Scatter plots display gene expression of Pk Mtb Beijing65 biofilms with and without multi-stimuli
versus Sputum Gene Expression. Graphs show Spearman’s Rank Correlation R and p-values
for each graph.
5.4.3.6. Comparison of gene expression levels with different
normalisation procedures
The bacterial biofilm is known to be genetically and phenotypically altered due to
environmental and nutritional conditions (Stoodley et al., 2004). This stress may
change the gene expression of the ribosomal genes such as 16S rRNA and sigA
(Larsson et al., 2012), although these genes have been used as housekeeping genes
of many studies (Wu et al., 2009, Garton et al., 2008 and Larsson et al., 2012). Lee,
Chapter 5: Characterising M. tuberculosis in Biofilms
150
(2012) compared the gene expression stability of 12 candidate genes in stationary
phase, SDS, PBS, exponential phase and RPMI growth conditions. The study revealed
that the most stable genes were thyA, polA, dfrA and aroA in different H37Rv growth
conditions. Ribosomal genes 16S rRNA and sigA were two of three least-stable genes
(Lee, 2012). Therefore, it was required to compare the gene expression level of the six
housekeeping genes.
The comparison was done with H37Rv Pk biofilm cells with Spermine-HCl, as it is the
closer condition to sputum transcriptome. Three DosR regulon genes hspX, tgs1 and
narK2 were used in this study, as they were known to be highly induced during stress.
Results in Figure 55 shows that the 16S rRNA housekeeping gene is significantly
upregulated by 3 log2-folds than sigA, thyA, polA, dfrA and aroA housekeeping genes
(4HKGs). Furthermore, sigA housekeeping shows significant upregulation of tgs1 gene
compared with the 4HKGs. However, sigA has shown closer gene expression level to
the 4HKGs.
hsp
X
tgs1
narK
2
0
5
1 0
1 5
D o s R re g u lo n g e n e s
log
2(f
old
ch
an
ge
)
1 6 S rR N A
sigA
4 H K G
**
**
Figure 55: Comparison of DosR regulated gene expression levels with different normalisations.
Bar graphs comparing the DosR regulon selected genes (hspX, tgs1and narK2) of Pk Mtb H37Rv biofilm with multi-stimuli (the highest correlated condition with sputum) in different optimisation housekeeping genes. Displayed columns show the gene expression of normalisation with16S rRNA (green columns), sigA (red columns), and 4HKG (white columns). Error bars represent the SD of three (log2) values of each gene. Unpaired t-tests were used to compare the different growth conditions; asterisks indicate significant results.
Chapter 5: Characterising M. tuberculosis in Biofilms
151
5.4.4. M. tuberculosis biofilm antibiotic sensitivities
In the current work, it was revealed that Pk and Att Mtb biofilm cells from both H37Rv
and Beijing65 strains have closer correlation with sputum transcriptome. This leads to
a question whether Mtb biofilm cells share another phenotypic characteristic with
sputum. The bacterial biofilm is known to be non-responsive to antimicrobial drugs,
which may be due to the persisters that arise as a result of the phenotypic
heterogeneity in the bacterial biofilm (Spoering et al., 2001; Dhar et al., 2007). Hence,
to assess other phenotypic similarities between Mtb biofilm and sputum, a drug
tolerance assay was performed.
Previously, Corper and Cohn (1933) studied the in vitro growth of human and bovine
Mtb isolates in sealed containers and they noticed that 24 out of 56 cultures included
culturable bacilli even after 12 years of incubation. From this study it was revealed the
in vitro characteristics of Mtb persist in a bacteriostatic environment (Corper & Cohn,
1933). However, the evidence of the mycobacterial biofilm formation in the human lung
cavity is still not proven.
H37Rv and Beijing65 were used to assess biofilm-associated drug tolerance. Biofilm
and mid-exponential phase cultures were incubated for 7 days with direct exposure to
5µg/ml-1 RIF and 1µg/ml-1 of INH. After incubation, the biofilm layers as well as the
mid-exponential phase Mtb cells were harvested then CFU analysis was carried out.
Results in Table 20 represent the log10 data and CFU proportions of the three Mtb
biofilm layers and mid-exponential phase cells of H37Rv and Beijing65 strains in 7
days exposure to RIF and INH antibiotics. The results in the table also represent the
relative tolerance to mid-exponential phase cells.
In mid-exponential phase for H37Rv and Beijing65 Mtb cells, incubation with either RIF
or INH lead to an increased rate of death after 7 days of exposure. In contrast, the
H37Rv Pellicle biofilm cells show a high proportion of cells (45%) remaining alive with
INH. On the other hand, the majority of H37Rv Pellicle cell population is killed by
5µg/ml-1 RIF. Although, Beijing65 Pellicle shows different reading in the viability
proportion after exposure to INH and RIF, the killing trend is similar to H37Rv Pellicle
as RIF kills a higher proportion than INH.
Mtb H37Rv and Beijing65 Pk biofilm cells show higher response to RIF as ~98% and
95.4% of cell population is killed subsequently. However, the H37Rv and Beijing65 Pk
biofilm cells show less response to the INH as shown in Table 18. It has been
Chapter 5: Characterising M. tuberculosis in Biofilms
152
observed that about 4% of the H37Rv Pk biofilm cell population are drug-tolerant to the
INH, whereas ~10% of Beijing65 Pk biofilm cell population are drug-tolerant to INH.
The Att biofilm H37Rv and Beijing strains show higher persistence to the RIF and INH
exposure. Mtb H37Rv Att biofilm shows ~27% of the cell population is still alive even
after 7 days of exposure to 1µg/ml-1 of INH. Also, the greater proportion of drug-
tolerant persisters to high RIF concentration is observed in the Mtb H37Rv Att biofilm
cells with a viability proportion of 8%. The Mtb Beijing65 Att biofilm cells show about
30% of cell populations persist against RIF, whereas a lower proportion of 0.74%
persists against INH.
The relative tolerance of Mtb H37Rv biofilm cells compared to the mid-exponential
phase cells shows higher tolerance with Pellicle and attached cells against INH. The
same trend is shown with Beijing65 Pellicle and Att cells against INH except the
Pellicle which shows lower tolerance compared to mid-exponential phase cells. Pk and
Att cells in both H37Rv and Beijing65 show much higher tolerance to RIF than Pellicle
cells in both strains compared to mid-exponential phase cells.
These results suggest that cells in biofilm show drug-tolerance persistence against
high INH and RIF concentrations. This indicates that cells within the Mtb biofilm may
not be actively growing. In addition, there are obvious variations in the cell response to
the antimicrobial treatments between the different biofilm layers due to the
heterogeneity of the Mtb biofilm.
Chapter 5: Characterising M. tuberculosis in Biofilms
153
Table 20: M. tuberculosis biofilm cells’ drug sensitivity performed by colony-forming unit (CFU) counts.
Cells Treatment H37Rv Log10
CFU (±SD)
CFU%
Relative tolerance
Beijing65 Log10 CFU
(±SD)
CFU%
Relative tolerance
Mid-Exp phase
No drug 8.7 (±0.5) 100 - 8.4 (±0.3) 100 -
INH 6.4 (±1.6) 0.5 - 6.2 (±0.1) 0.6 -
RIF 3.8 (±0.5) 0.001 - 3.2 (±0.2) 0.000
5 -
Pellicle
No drug 6.8 (±0.3) 100 1 7.9 (±0.8) 100 1
INH 6.5 (±0.1) 45 90 5.3 (±0.1) 0.2 0.3333
RIF 4.1 (±0.4) 0.2 200 4.9 (±0.3) 0.08 160
Planktonic
No drug 4.6 (±0.4) 100 1 4.8 (±0.3) 100 1
INH 3.2 (±0.1) 4 8 3.8 (±0.1) 9.2 15.333
RIF 2.8 (±0.3) 1.4 1400 3.5 (±0.1) 4.6 9200
Attached
No drug 7 (±0.01) 100 1 6.9(±0.3) 100 1
INH 6.4 (±0.8) 26.7 53.4 6.3 (±0.2) 30 50
RIF 5.8 (±0.57) 8 8000 4.7 (±0.5) 0.74 1480
The table shows the effect of RIF and isoniazid treatments on in vitro viability of Mtb biofilm
cells. Log10 CFU values and drug tolerance ratios of H37Rv and Beijing65 biofilm and Mid-
Exponential cells after 7 days of incubation with isoniazid (1 µg ml-1
) and RIF (5 µg ml-1
) for 7
days. Relative tolerance values of the biofilm were calculated by deviding the %CFU of the
biofilm by the %CFU of the control (mid-exponential phase cells). Antibiotics were injected
directly into the Pk layer of biofilm cultures. SD displays the mean of three biological replicates.
Chapter 5: Characterising M. tuberculosis in Biofilms
154
5.4.5. M. tuberculosis H37Rv Resuscitation Promoting Factors (Rpfs)
Assessment
5.4.5.1. Experimental Strategy
The experimental strategy that was used to assess the Mtb H37Rv Rpf-dependency is
detailed in Figure 56.
C h o le s te ro l
C h o le s te ro l+ S p e r
C h o le s te ro l
+ A D C + N O
C h o le s te ro l
+ A D C
C h o le s te ro l
+ A D C + S p e r
C h o le s te ro l+ O A D C
C h o le s te ro l+ O A D C + N O
C h o le s te ro l+ O A D C + S p e r
O A D C + S p e r
C h o le s te ro l+ N O
H 3 7 R v m id -e x p p h a s e
c u ltu re in 7 H 9 b ro th ,
O D o f 1
H 3 7 R v b io f ilm
g ro w th s t im u li
5 w e e k s in c u b a t io n
M P N + C F U
M P N M P N + S N M id d le b ro o k 7 H 1 0
D a ta a n a ly s is
G r o w th fo l lo w in g -u p
M P N u p to 6 w e e k s
C F U u p to 4 w e e k s
P ro m is in g c o n d it io n
M P N + C F U
D a ta a n a ly s is a n d c o n c lu s io n
O A D C + N O
Figure 56: Pictorial representation of the Rpf-dependency assessment experiment.
The schematic diagram demonstrates the Mtb H37Rv Att and Pk biofilm Rpf dependency
assessment starting from the biofilm preparation in multiple growth stimuli through to the MPN
and CFU of the initial promising condition and ending with the data analysis and conclusions.
Chapter 5: Characterising M. tuberculosis in Biofilms
155
In the current work, it was revealed that the Mtb biofilm shows drug-tolerance to RIF
and INH. This added some weight to the hypothesis that Mtb biofilm might replicate
sputum phenotypes. However, it was necessary to assess the other phenotypes that
Mtb biofilm might share with Mtb from sputum.
One of the most important characteristics of Mtb in sputum is the Rpf-dependency.
Mukamolova et al., (2010) have shown that smear-positive human sputum is
dominated by a population that requires Rpf proteins to grow. Furthermore, in the
same study, it was revealed that these Rpf-dependent populations are RIF tolerant
(Mukamolova et al., 2010). Thus, it was essential to assess Mtb biofilm cells Rpf-
dependency to assess if they share this characteristic with Mtb from sputum.
This experiment was performed initially by developing the Mtb H37Rv biofilm under 11
conditions. The reason behind using multiple stimuli was to mimic the Mtb environment
in the lung cavity. Table 21 represents all conditions that were used. The statistical
analyses for CFU and MPN were done independently. The resuscitation index (RI)
was calculated by subtracting the log10 culture supernatant (SN) by the log10 CFU
values. The more significant RI should be 1 and more.
Chapter 5: Characterising M. tuberculosis in Biofilms
156
Table 21: Growth conditions and additional stimuli of the Mtb H37Rv biofilm.
Test culture Control culture Without NO/Sper.HCl
culture resuspended in Sauton`s/ADC pre-prepared
with 0.01% (w/v) cholesterol/CD with added
spermine NOnoate solution (4h time-point)
culture resuspended in Sauton`s/ADC pre-prepared
with 0.01% (w/v) cholesterol/CD with added Spermine hydrochloride solution (4h time-point)
culture resuspended in Sauton`s/ADC pre-prepared
with 0.01% (w/v) cholesterol/CD
culture resuspended in Sauton`s/OADC (BD BBL) pre-prepared with 0.01% (w/v) cholesterol/CD with added spermine NOnoate
solution (4h time-point)
culture resuspended in Sauton`s/OADC (BD BBL) pre-prepared with 0.01% (w/v) cholesterol/CD with
added Spermine hydrochloride
solution (4h time-point)
culture resuspended in Sauton`s/OADC (BD BBL)
pre-prepared with 0.01% (w/v) cholesterol/CD
culture resuspended in Sauton`s/OADC (BD BBL)
with added spermine NOnoate
solution (4h time-point)
culture resuspended in Sauton`s/OADC (BD BBL)
with added Spermine hydrochloride
solution (4h time-point)
culture resuspended in Sauton`s/OADC (BD BBL)
culture resuspended in Sauton`s pre-prepared with 0.01% (w/v) cholesterol/CD
with added spermine NOnoate
solution (4h time-point)
culture resuspended in Sauton`s pre-prepared with 0.01% (w/v) cholesterol/CD
with added Spermine hydrochloride
solution (4h time-point)
culture resuspended in Sauton`s pre-prepared with 0.01% (w/v) cholesterol/CD
5.4.5.2. The Rpf-dependency assessment of M. tuberculosis Pk and Att
biofilm cells under multiple growth conditions
This work was performed on Mtb Pk and Att biofilms, which were grown under multiple
stimuli as shown in Table 21. This experiment was done in large scale in order to
choose the candidate condition for further investigation. All samples were done in
duplicate and two users performed the work and the statistical analyses independently.
Some samples were mould-contaminated, and were therefore excluded and indicated
as N/A in Table 22.
Chapter 5: Characterising M. tuberculosis in Biofilms
157
Table 22: Rpf-dependancy assessment assay of M. tuberculosis H37Rv Att and Pk biofilm cells with multiple stimuli.
Results in Table 22 represent log10 MPN (with and without SN), CFU and the RI
values of Att and Pk H37Rv biofilm cells. Also, results observe large variations
between the two user’s readings of MPN, SN and CFU counts. Although there was a
Chapter 5: Characterising M. tuberculosis in Biofilms
158
large variation between replicates, the aim was to identify the best conditions to form
Rpf-dependent Att and Pk H37Rv biofilm cells.
By looking at the RI in Table 22, it can be observed that adding OADC+Ch+Sper and
to the biofilm medium enhances the formation of Rpf-dependent populations in both Att
and Pk biofilm layers where the SN above the 7H9 and 7H10 controls (RI is ~1).
Further, the Att biofilm cells, which were supplemented with OADC+Ch+Sper, showed
higher RI than Pk cells with the same condition. Hence, by presenting these results to
Rpf experts, the decision was to choose Att biofilm cells supplemented with OADC+Ch
and exposed to NO as it was thought that NO should has an effect on Mtb Att biofilm
cells in contrast the control Sper.
5.4.5.3. Rpf-dependency of M. tuberculosis Attached biofilm cells with
multiple stimuli
Att H37Rv biofilm cells were grown in Sauton’s medium supplemented with OADC and
Cholesterol and exposed to NO. The experiment was done in four biological replicates,
and each replicate was taken from independent 12-well plates. After 5 wks of
incubation, the biofilm was harvested according to the protocol in Section 5.3.3. MPNs
and CFUs were performed in 4 technical replicates.
Figure 57a shows that SN has significant stimulation above CFU and 7H9 Middlebrook
controls on resuscitating the Att H37Rv biofilm cells in 3 replicates out of 4. The fourth
replicate did not show significant stimulation above the CFU control. However, by
taking the mean and the SD results in Figure 57b, there is no significant difference
between the SN and the CFU count in contrast to the Middlebrook 7H9 control, where
the SN exceeded the cell count obtained.
Chapter 5: Characterising M. tuberculosis in Biofilms
159
CF
U
MP
N
MP
N+S
N
0
2
4
6
8
Lo
g1
0 C
FU
-MP
N/m
l-1
* * *
1 2 3 4
0
2
4
6
8
7 H 1 0
7 H 9
S N
s a m p le
Lo
g1
0C
FU
-MP
N m
l-1
A B
Figure 57: Effect of culture supernatant on the Att M. tuberculosis biofilm cells.
Graphs show the effect of the 7H9+SN on the Att Mtb H37Rv cells grown with Cholesterol/NO/OADC. (A) Shows 4 Att biofilm replicates compare the effect of the SN+MPN on the Att biofilm cells in comparison to the MPN and CFU. (B) Shows the average log10 of the 4 replicates. Error bars represent the SD of three (log10) values for each replicate. Asterisks indicate significant data.
Table 23 shows the log10 MPN, CFU and MPN+SN counts of each replicate of the
biofilms. The RI was also accounted for (SN-CFU and SN-MPN). Results in the table
signify that out of 4 replicates, 2 replicates are shown between 1.5-1.7 log10 difference
between the SN and CFU. However, the RI of the other two replicates shows no
significant stimulation of the SN on the Att biofilm cells. Hence, the difference between
the CFU control and the SN is not significant if the RI mean is taken of the 4 replicates.
The RI of the SN-MPN indicates that the difference between the SN and the MPN
control is significant. The RI of all 4 replicates shows above 1 value of SN+MPN than
MPN-free supernatant. Therefore, the Att biofilm cells in this condition are inhibited in
MPN-SN and stimulated by MPN+SN.
The trend for MPN with no SN log10 counts to be lower than CFU log10 counts is
represented in Table 23 by derivation of an inhibitory index (II = log10 MPN/CFU). The
II counts in Table 23 show that there is more than 0.5 log10 inhibition in two replicates,
compared with the other two.
Chapter 5: Characterising M. tuberculosis in Biofilms
160
Table 23: Rpf-dependancy assessment assay of M. tuberculosis H37Rv Att biofilm cells with OADC+Cholesterol+NO.
count and (E) Log10 DNA count. Error bars represent the SD. Asterisk points reading below detection limit.
The relative count of 3H uracil uptake compared to CFU, MPN, DNA and RNA reveals
that Pellicle biofilm layer has the lowest 3H uracil uptake followed by the Att and the
highest uptake is in Pk biofilm cells (Figure 59). The Pellicle biofilm layer also shows
sharp drop in RNA and DNA relative counts to reach the lowest incorporation at wk 5.
Chapter 5: Characterising M. tuberculosis in Biofilms
162
2 w 3 w 4 w 5 w
0 .0 0 1
0 .0 1
0 .1
1
1 0
1 0 0
Lo
g1
0 (
cp
m/C
FU
)/w
ell
A tt
P k
P e lli
*
2 w 3 w 4 w 5 w
0 .0 0 1
0 .0 1
0 .1
1
1 0
Lo
g1
0 (
cp
m/M
PN
)/w
ell
A tt
P k
P e lli
2 w 3 w 4 w 5 w
0 .0 0 0 0 0 1
0 .0 0 0 0 1
0 .0 0 0 1
0 .0 0 1
0 .0 1
0 .1
1
1 0
1 0 0
Lo
g1
0 (
cp
m/D
NA
)/w
ell A tt
P k
P e lli
2 w 3 w 4 w 5 w
0 .0 0 0 0 0 1
0 .0 0 0 0 1
0 .0 0 0 1
0 .0 0 1
0 .0 1
0 .1
1
1 0
1 0 0
Lo
g1
0 (
cp
m/R
NA
)/w
ell A tt
P k
P e lli
A B
C D
Figure 59: Measuremant of 3H Uracil uptake in biofilm layers.
Graphs show Log10 relative counts of 3H uracil of Att, Pk and Pellicle biofilm cells per (A) CFU,
(B) MPN, (C) DNA and (D) RNA. Error bars represent the 95% confidence interval. Asterisk points reading below detection limit.
Figure 60 shows the relative counts of MPN, DNA and RNA per CFU as well as the
relative count of RNA per DNA. The result shows that DNA and RNA relatively
increase from wk 2 to reach the highest number at wk 5 for Att and Pellicle layers. The
accumulation of cells in Pellicle and Att layers is indicated by this finding as Figure
60b&c show the highest accumulation of Pellicle cells followed by Att.
Chapter 5: Characterising M. tuberculosis in Biofilms
163
2 w 3 w 4 w 5 w
0 .0 1
0 .1
1
1 0
1 0 0
Lo
g1
0 (
MP
N/C
FU
)/w
ell
A tt
P k
P e lli
*
2 w 3 w 4 w 5 w
1 0
1 0 0
1 0 0 0
1 0 0 0 0
1 0 0 0 0 0
Lo
g1
0 (
DN
A/C
FU
)/w
ell
A tt
P k
P e lli
*
2 w 3 w 4 w 5 w
1
1 0
1 0 0
1 0 0 0
1 0 0 0 0
Lo
g1
0 (
RN
A/C
FU
)/w
ell A tt
P k
P e lli
*
2 w 3 w 4 w 5 w
0 .0 0 0 1
0 .0 0 1
0 .0 1
0 .1
1
1 0
1 0 0
Lo
g1
0 (
RN
A/D
NA
)/w
ell
A tt
P k
P e lli
A B
C D
Figure 60: The relative count of CFU in biofilm layers measured by different techniques.
Graphs show the (A) MPN, (B) DNA, (C) RNA relative counts of Att, Pk and Pellicle biofilm layers compared to the CFU counts. Graph (D) shows the relative count of RNA per DNA. Error bars represent the 95% confidence interval. Asterisk points reading below detection limit.
5.4.7. Cytological studies on M. tuberculosis biofilms
5.4.7.1. Integrity and activity of biofilm cells
Table 24 shows percentages of un-treated Mtb biofilm Att, Pk and Pellicle layers and
mid-exponential phase cells grown in Sauton`s with SYTO9, PI and INT staining.
Results show that the percentage of mid-exponential phase cells stained with SYTO9
is about 90% which is significantly higher than all biofilm layers. Pellicle biofilm layer
contains the higher percentage of PI with about 40% compared with the Att and Pk
layers which have 29% and 25% respectively. About 61% of mid-exponential cells
form fromazan droplets which is significantly higher than Att and Pellicle biofilm cells.
Chapter 5: Characterising M. tuberculosis in Biofilms
164
Table 24: Averages and SD of biofilm and mid-exponential phase cells with SYTO9, PI
and INT
CellsSYTO9
Average (SD)
PI
Average( SD)
Formazan
Average( SD)
Mid-Exp 90 4.1 10 4.1 61 17
Attached 71 4.0** 29 4.0 26 7.0*
Planktonic 75 5.4* 25 5.5 36 4.0
Pellicle 60 1.4*** 40 1.3 17 5.0*
Table shows the proportions of 5-wks grown Att, Pk and Pellicle biofilm cells and the mid-
exponential phase control cells with SYTO9 and PI nucleic acid stain and INT staining by
counting the formazan droplets. Asterisks indicate significant data compared with the mid-
exponential phase culture.
5.4.7.2. rRNA content of biofilm cells
Figure 61 shows that the PNA median signal intensity (MFI) per area of mid-
exponential phase cells is significantly higher than PNA MFI of all biofilm layers. There
is no significant difference of the PNA MFI between the three biofilm layers. The result
also shows that the PNA MFI of the Pellicle biofilm layer is significantly higher than the
PNA MFI of the Att biofilm layer. Moreover, there is no significant difference of the
PNA MFI between the Att layer and the Pk layer or between the Pk layer and the
Pellicle.
-v e c o n t . M id -E x p At t P N A P K P N A P e lli P N A
0
2 0 0 0 0
4 0 0 0 0
6 0 0 0 0
8 0 0 0 0
1 0 0 0 0 0
PN
A M
FI/
are
a
***
***
***
*
Figure 61: 5 wk biofilm cells show lower rRNA signals than mid exponential cells
Scatter dot graph shows the OK682 PNA probe median signal intensity of Att, Pk and Pellicle biofilm cells in comparison with mid-exponential phase (positive control) grown cells. PNA median signal intensities were counted automatically in triplicates for each sample (almost 100 cells per slide). Unpaired t-tests were used to compare the PNA MFI of the mid-exponential phase cells with the different variables, whereas paired t-tests were used for the comparison between the different biofilm layers. Asterisks indicate significant results.
Chapter 5: Characterising M. tuberculosis in Biofilms
165
5.4.7.3. LB frequencies in the biofilm layers
Table 25 and Figure 62 show comparisons between NO treatment, Sper control and
un-treated cells in biofilm and mid-exponential phase. Results represent that the 4 h of
NO incubation increases the LB proportion in mid-exponential phase by 2- to 4-fold
compared to the Sper and un-treated cells.
On the other hand, that there is no effect attributable to NO exposure in the biofilm
cells from all layers. Results also show heterogeneity within the biofilm as Att and Pk
cells show higher LB proportions than Pellicle.
The lower LB proportions in Pellicle indicate that the oxygen exposure or the air-
interface might reduce the LB proportion. The LB proportion of the Pellicle biofilm cells
is in between 42-49%. This LB proportion of Pellicle biofilm cells in basic condition is
much higher than the mid-exponential phase cells in the basic condition, which
indicates that the extreme condition within the biofilm matrix induces the LB proportion.
Table 25: . The LB proportions (%) of Mtb H37Rv biofilm layers and mid-exponential phase cells in different culture stimuli.
Sample LB% #cells
Mid-Exp NO 41.2 485
Mid-Exp Sper 21.8 352
Mid-Exp 11.2 398
Att NO 89.4 270
Att Sper 75.7 288
Att 79.0 315
Pk NO 88.9 210
Pk Sper 80.2 268
Pk 82.3 245
Pellicle NO 49.5 652
Pellicle Sper 43.1 498
Pellicle 42.1 510
Chapter 5: Characterising M. tuberculosis in Biofilms
166
M id -e x p (C o n t.) A tta c h e d P la n k to n ic P e llic le
Flu
oro
-
RL
x
Flu
oro
-RL
x-
LU
Ts
Figure 62: M. tuberculosis H37Rv biofilm cells LBs.
Displayed example images are LipidTox Red stained biofilm cells and the control mid-exponential phase cells in basic biofilm condition. Green-Fire-Blue LUT applied. Scale bar 3µm.
5.4.7.4. Measuring the acid-fast proportions of M. tuberculosis biofilm
Table 26 and Figure 63 show comparisons between NO treatment, Sper control and
un-treated cells in biofilm and mid-exponential phase. Results demonstrated that
biofilm cells are much less AF than short term broth cultures. Mid-exponential phase
cells have the highest AF proportions (>95%) in all conditions studied while the Pellicle
biofilm cells have the highest AF proportion (35-41%) amongst the biofilm layers. Att
and Pk biofilm cells have very low AF proportions. NO exposure has no discernible
effect on acid fastness in the short term.
Table 26: The acid-fast proportions (%) of Mtb H37Rv biofilm cells under different conditions.
Sample Acid-fast% #Cells
Mid-Exp NO 97.7 531
Mid-Exp Sper 95.6 511
Mid-Exp 95.7 432
Att NO 8.1 298
Att Sper 10.1 310
Att 10.5 305
Pk NO 4.0 290
Pk Sper 4.1 288
Pk 3.0 287
Pellicle NO 35.2 640
Pellicle Sper 41.9 486
Pellicle 38.0 496
Chapter 5: Characterising M. tuberculosis in Biofilms
167
M id -e x p (C o n t.) A tta c h e d P la n k to n ic P e llic le
Ph
as
e
co
ntr
as
t
Flu
oro
-Au
ra
min
e O
Figure 63: M. tuberculosis H37Rv biofilm cells acid-fastness.
Displayed example images are Auramine-O-stained biofilm cells and the control mid-exponential phase cells. Scale bar 3µm.
5.4.7.5. Auramine O staining mechanism on Pk M. tuberculosis biofilm
cells
Pk Mtb biofilm cells are known to be non-AF bacilli. This was shown in Section 2.8.8.4,
as the AF proportion of the PK H37Rv biofilm cells are about 4% under all culturing
stimuli. In contrast, the mid-exponential phase Mtb cells show >95% AF proportion
under all culture conditions. Thus, the question that can be addressed is does
Auramine O wash off or was it difficult to penetrate the Pk biofilm cells during the
staining procedure?
To answer this question, Pk H37Rv biofilm cells as well as the positive mid-exponential
phase H37Rv control, both under basic conditions, were stained with Auramine O. In
order to assess whether Auramine O was washed off the Mtb cells or was difficult to
penetrate, the decolourisation step was performed at different time points. The first
time point was using the d.H2O for decolourisation instead of ethanol-HCl as a
negative control for both Pk biofilm and the mid-exponential phase cells. Then, the
decolourisation time points for Pk biofilm and the mid-exponential phase cells with
ethanol-HCl were conducted for 0 (washed directly), 3, 6, 9, 12 and 15 minutes. It was
analysed using three replicates from each sample and almost 100 Mtb cells were
counted per sample.
Chapter 5: Characterising M. tuberculosis in Biofilms
168
Results in Figure 64 reveal that the AF proportion of the Pk biofilm cells decreases
from 98% washing with water for 15 minutes to 93% after decolourisation with acid-
alcohol for 0 minutes. Also, results show a dramatic decrease of the AF proportion of
the Pk biofilm cells after decolourisation with acid-alcohol for 3 minutes. The AF
proportion then decreases gradually with the decolourisation with acid-alcohol for 6, 9,
12 and 15 minutes. In contrast, the AF proportion of the mid-exponential phase H37Rv
cells shows no difference in during different decolourisation time points. This result
reveals that the Auramine O staining is washed off the Pk biofilm H37Rv cells
compared with the mid-exponential phase H37Rv cells, which retain the Auramine O.
Figure 64: Decolourisation of Auramine O in different time points.
The line graph illustrates Auramine-O-stained Pk Mtb H37Rv biofilm cells (black line) and the positive control mid-exponential phase H37Rv cells (red line) at different decolourisation time points. Samples and controls were stained in triplicates at each time point and the error bars represent the SD of three replicates.
5.4.7.6. The increase of LB proportion correlates strongly with AF
proportion reduction
According to the finding of Deb et al. (2008), the LB proportion increase indicates
decrease in AF proportion; the correlation between the proportions was measured.
H2O
(15m
in)
0 m
in
3 m
in
6 m
in
9 m
in
12 m
in
15 m
in
0
2 0
4 0
6 0
8 0
1 0 0
1 2 0
P K H 3 7 R v b io f ilm C o n tro l (m id -e x p ) H 3 7 R v
T im e (m in )
% o
f A
cid
-fa
stn
es
s
Chapter 5: Characterising M. tuberculosis in Biofilms
169
Pearson’s correlation coefficient was performed with LB proportion values of mid-
exponential phase Att, Pk and Pellicle cells under multiple stimuli against the AF
proportions under the same condition.
Results in Figure 65 show the linear correlation between the AF and LB proportions of
mid-exponential and stationary phase cells, Att, Pk and Pellicle cells. The linear
regression shows significant correlation between the AF and LB proportions with high
r2 value of (r2 = 0.8206; P < 0.0001). This finding indicates that when the LB proportion
increases, the AF proportion decreases in Mtb H37Rv in biofilm layers and mid-
exponential phase under multiple conditions.
0 2 0 4 0 6 0 8 0 1 0 0
0
2 0
4 0
6 0
8 0
1 0 0
A c id -fa s t p ro p o rtio n s
LB
pro
po
rti
on
s
r2
= 0 .8 2 0 6
P < 0 .0 0 0 1
M id -e x p
S ta tio n a ry
P e llic le
A tta c h e d + P la n k to n ic
Figure 65: The correlation between LB and AF proportions.
Graph shows Pearson’s correlation coefficient of LB proportions of mid-exponential phase Att, Pk and Pellicle H37Rv cells under multiple stimuli against the AF proportions under the same condition.
Chapter 5: Characterising M. tuberculosis in Biofilms
170
5.5. Discussion
Published studies on Mtb biofilm have shown that the most prominent features are Pellicle
which is characterised by free MAs and a lipid-rich structure as well as high tolerance to RIF
and INH. However, these studies focused on studying the whole biomass of the Mtb biofilm
(Ojha et al., 2008; Sambandan et al., 2013). There is no published study comparing the Mtb
biofilm microenvironment genetically or morphologically with the Mtb in sputum. Hence, the
current study provides further detail in this regard. It was hypothesised that populations
underneath the Pellicle might have distinctive phenotypic and genetic features. Thus, the
biofilm was separated into three different layers.
5.5.1. Gene expression of M. tuberculosis under selected growth conditions
5.5.1.1. Selection of M. tuberculosis biofilm growth stimuli
Mtb bacilli are known to form clumping or cording structure in detergent-free liquid culture
and in certain conditions such as long term starvation they form Pellicle structure (Kim et al.,
1976; Hunter et al., 2006). It was not possible to use cholesterol/tyloxapol complex with the
Mtb biofilm as tyloxapol has a detergent action by preventing cell clumping. Thus CDs, the
cylclic water-soluble oligomers of glucose (Duchene, 1987), was used instead to help
cholesterol absorption by Mtb cells (Christian et al., 1997).
Bacteria within the biofilm are facing stresses such as nutrient starvation, hypoxia and low
pH (Fux et al., 2003). However, there are a number of stressors that are thought to be in the
lung cavity that are not included in the current study. These stressors comprise reactive
oxygen species (ROs) and phosphate deprivation (Van der Vliet et al., 1999). Furthermore,
the host immune system stress plays a major role in Mtb gene expression profile
(Muttucumaru et al., 2004). However, as an initial study the Mtb biofilm was studied under
selected stimuli and the other stressors could be done in the future.
5.5.1.2. M. tuberculosis H37Rv Pk biofilm gene expression correlates to the
sputum transcriptome
In the current study, it was shown that 16S rRNA reference gene is overexpressed from
DosR regulon genes in Pk biofilm cells compared with sigA and the 4HKGs. In addition to
overexpression, it was also shown that the 23S rRNA show lower PNA signal of all biofilm
cells compared with the mid-exponential-phase-grown cells. Furthermore, it was shown that
sigA is not constant in stationary phase and low oxygen level (Manganelli et al., 1999). Thus,
Chapter 5: Characterising M. tuberculosis in Biofilms
171
the 4HKGs were used as reference genes to measure the gene expression from Mtb biofilm
layers in the current study.
When Mtb H37Rv biofilm layers as well as mid-exponential phase culture in three conditions
were compared with sputum microarray, the Pk biofilm layers appear to be significantly the
most similar gene expression by using Spearman`s ranking. The gene expression from all
H37Rv Pk and Att biofilm conditions show upregulation of DosR regulated genes. However,
the mid-exponential phase H37Rv gene expression when exposed to NO and OA shows
higher upregulation of the DosR regulon genes. Clearly, Att and Pk biofilm cells are not
responding to the NO stress. One reason might be that Pk and Att biofilm cells are already in
the NRP state, therefore the NO exposure is not significantly affecting the cells gene
expression.
It is noted that three genes significantly induced in sputum (icl1, virS and ppsA) appear to be
repressed in Pk biofilm gene expression. Icl1 gene was shown to be repressed in end-stage
human granuloma (Rachman et al., 2006), which indicates that icl1 is essential for early-
stage growth but not late-stage persistence (Savvi et al., 2008). Perhaps the cells here were
well established in a NRP state. VirS is known to be upregulated in macrophage infection in
acidic conditions (Singh et al., 2003). However, it was downregulated here which might
indicate that the pH of the Mtb biofilm is not reaching the level of acidity required for
induction. No explanation is offered for the lack of ppsA induction at this stage.
The Att H37Rv biofilm cells show significant correlation with sputum transcriptome for test
and control conditions, whereas the un-treated stimulus shows no correlation. However, this
correlation was lower than with Pk biofilm cells. The result shows that all downregulated
genes in the sputum transcriptome are also downregulated in Att biofilm test and control
conditions. Rv3551, icl1, virS and ppsA, are all downregulated in all Att biofilm conditions.
The downregulation of Rv3551, which involves in the catabolic gene cluster encoding
cholesterol catabolism in macrophages as well as virulence, was not expected. However,
ltp2 the cholesterol metabolism gene is upregulated, which means that Rv3551 might be
affected by the cholesterol concentration as the Att biofilm cells consumed the cholesterol in
the medium for 5 wks.
The H37Rv Pellicle biofilm gene expression exposes predominantly downregulation of 16
selected genes out of 20. The DosR regulon gene narK2 which is known to be essential for
nitrate respiration during anaerobic dormancy was repressed in all Pellicle biofilm conditions.
In addition, the other DosR regulon genes showed lower upregulation in all Pellicle biofilm
conditions compared with the Att and Pk biofilm layers. This difference might be due to the
location of the Pellicle cells, where they are exposed to the air-interface layer where the
Chapter 5: Characterising M. tuberculosis in Biofilms
172
upper side is exposed to air and the inner side exposed liquid, there might be heterogeneity
in transcriptional features of Pellicle biofilm cells. The Pellicle H37Rv cells have distinctive
and modified gene expression compare to Att and Pk biofilm layers. The gene expression of
all H37Rv biofilm layers revealed downregulation in rpsL gene which indicates that biofilm
cells may be in a NRP state.
Using the same 20 genes, the gene expression of Mtb H37Rv Pk biofilm exposed to
Cholesterol+NO+OA and CD+Sper+BSA in the current study showed better correlation to
sputum transcriptome than PBS and RPMI exposed Colesterol+NO+OA which were tested
by Lee, (2012). The LB percentage of Pk biofilm cells from all conditions was higher than
PBS and RPMI exposed Colesterol+NO+OA.
Furthermore, it has been hypothesised that bacteria in biofilms are stationary-phase like
cells (Beloin et al., 2005). By comparing the gene expression of H37Rv biofilm layers of the
20 selected genes and growth conditions with the gene expression of an un-treated
stationary phase culture tested by Lee, (2012), there was no correlation with any of the
biofilm layers (data not shown). The LB percentage of the stationary phase culture is lower
than those of Pk biofilm cells. Relying on these comparisons, biofilm cells differ in their gene
expression from stationary phase cells. Moreover, the biofilm system represents an
improved in vitro system to replicate sputum phenotypes than the conditions tested by Lee,
(2012).
5.5.1.3. M. tuberculosis Beijing65 Pk biofilm gene expression correlates to the
sputum transcriptome
Interestingly, all Mtb Beijing65 biofilm layers’ gene expression shows no correlation with
BEAMAN, B. L. 1973. An ultrastructural analysis of Nocardia during experimental
infections in mice. Infect Immun, 8, 828-840.
BEATTY, W. L., RHOADES, E. R., ULLRICH, H. J., CHATTERJEE, D., HEUSER, J. E.
& RUSSELL, D. G. 2000. Trafficking and release of mycobacterial lipids from
infected macrophages. Traffic, 1, 235-247.
BEGGS, C. B., NOAKES, C. J., SLEIGH, P. A., FLETCHER, L. A. & SIDDIQI, K. 2003.
The transmission of tuberculosis in confined spaces: an analytical review of
alternative epidemiological models. Int J Tuberc Lung Dis, 7, 1015-1026.
BELDA, J., LEIGH, R., PARAMESWARAN, K., O'BYRNE, P. M., SEARS, M. R. &
HARGREAVE, F. E. 2000. Induced sputum cell counts in healthy adults. Am J
Respir Crit Care Med, 161, 475-8.
BELL, A. J. 2013. Towards Understanding Lipid Body Formation in Mycobacteria in
Tuberculosis. PhD, University of Leicester.
BELOIN, C. & GHIGO, J. M. 2005. Finding gene-expression patterns in bacterial
biofilms. Trends Microbiol, 13, 16-9.
BERRIDGE, M. V., HERST, P. M. & TAN, A. S. 2005. Tetrazolium dyes as tools in cell
biology: new insights into their cellular reduction. Biotechnol Annu Rev, 11,
127-152.
BEHR, M. A., WARREN, S. A., SALAMON, H., HOPEWELL, P. C., PONCE DE LEON,
A., DALEY, C. L. & SMALL, P. M. 1999. Transmission of Mycobacterium
tuberculosis from patients smear-negative for acid-fast bacilli. Lancet, 353,
444-9.
BEHR, M. A., WILSON, M. A., GILL, W. P., SALAMON, H., SCHOOLNIK, G. K.,
RANE, S. & SMALL, P. M. 1999. Comparative genomics of BCG vaccines by
whole-genome DNA microarray. Science, 284, 1520-3.
BERG, H. & SCHRODTER, S. 1955. ["Swing therapy" in pulmonary tuberculosis with a
triple combination]. Tuberkulosearzt, 9, 385-93.
BERMUDEZ, L. E., NASH, K. A., PETROFSKY, M., YOUNG, L. S. & INDERLIED, C.
B. 1996. Effect of ethambutol on emergence of clarithromycin-resistant
Mycobacterium avium complex in the beige mouse model. J Infect Dis, 174,
1218-1222.
BETTS, J. C., LUKEY, P. T., ROBB, L. C., MCADAM, R. A. & DUNCAN, K. 2002. Evaluation of a nutrient starvation model of Mycobacterium tuberculosis persistence by gene and protein expression profiling. Mol Microbiol, 43, 717-31.
191
BHATT, A., KREMER, L., DAI, A. Z., SACCHETTINI, J. C. & JACOBS, W. R., JR.
2005. Conditional depletion of KasA, a key enzyme of mycolic acid
biosynthesis, leads to mycobacterial cell lysis. J Bacteriol, 187, 7596-606.
BHATT, A., FUJIWARA, N., BHATT, K., GURCHA, S. S., KREMER, L., CHEN, B.,
CHAN, J., PORCELLI, S. A., KOBAYASHI, K., BESRA, G. S. & JACOBS, W.
R. 2007a. Deletion of kasB in Mycobacterium tuberculosis causes loss of acid-
fastness and subclinical latent tuberculosis in immunocompetent mice. Proc
Natl Acad Sci U S A, 104, 5157-5162.
BHATT, A., MOLLE, V., BESRA, G. S., JACOBS, W. R., JR. & KREMER, L. 2007b.
The Mycobacterium tuberculosis FAS-II condensing enzymes: their role in
mycolic acid biosynthesis, acid-fastness, pathogenesis and in future drug
development. Mol Microbiol, 64, 1442-54.
BIFANI, P. J., MATHEMA, B., KUREPINA, N. E. & KREISWIRTH, B. N. 2002. Global
dissemination of the Mycobacterium tuberculosis W-Beijing family strains.
Trends Microbiol, 10, 45-52.
BIKETOV, S., MUKAMOLOVA, G. V., POTAPOV, V., GILENKOV, E.,
VOSTROKNUTOVA, G., KELL, D. B., YOUNG, M. & KAPRELYANTS, A. S.
2000. Culturability of Mycobacterium tuberculosis cells isolated from murine
macrophages: a bacterial growth factor promotes recovery. FEMS Immunol
Med Microbiol, 29, 233-240.
BISHOP, P. J. & NEUMANN, G. 1970. The history of the Ziehl-Neelsen stain.
Tubercle, 51, 196-206.
BIDNENKO, E., MERCIER, C., TREMBLAY, J., TAILLIEZ, P. & KULAKAUSKAS, S.
1998. Estimation of the state of the bacterial cell wall by fluorescent In situ
hybridization. Appl Environ Microbiol, 64, 3059-3062.
BLANCHARD, J. S. 1996. Molecular mechanisms of drug resistance in Mycobacterium
tuberculosis. Annu Rev Biochem, 65, 215-39.
BLOCH, H. & NOLL, H. 1955. Studies on the virulence of Tubercle bacilli; the effect of
BURDON, K. L. 1946. Disparity in Appearance of True Hansen's Bacilli and Cultured
"Leprosy Bacilli" When Stained for Fat. J Bacteriol, 52, 679-80.
CAMACHO, L. R., CONSTANT, P., RAYNAUD, C., LANEELLE, M. A., TRICCAS, J. A., GICQUEL, B., DAFFE, M. & GUILHOT, C. 2001. Analysis of the phthiocerol dimycocerosate locus of Mycobacterium tuberculosis. Evidence that this lipid is involved in the cell wall permeability barrier. J Biol Chem, 276, 19845-54.
CANETTI, G. 1955a. The tubercle bacillus in the pulmonary lesion of man.
Histobacteriology and its bearing on therapy of pulmonary tuberculosis. The
tubercle bacillus in the pulmonary tuberculous lesion. New York, Springer
Publishing Company. 29-85.
CANETTI, G. 1955b. Growth of the tubercle bacillus in the tuberculosis lesion. The
Tubercle Bacillus in the Pulmonary Lesion of Man. " New York: Springer
Publishing.
CARTER, G., WU, M., DRUMMOND, D. C. & BERMUDEZ, L. E. 2003.
Characterization of biofilm formation by clinical isolates of Mycobacterium
avium. J Med Microbiol, 52, 747-52.
CASALI, N., KONIECZNY, M., SCHMIDT, M. A. & RILEY, L. W. 2002. Invasion activity
of a Mycobacterium tuberculosis peptide presented by the Escherichia coli
AIDA autotransporter. Infect Immun, 70, 6846-52.
CAVIEDES, L., LEE, T. S., GILMAN, R. H., SHEEN, P., SPELLMAN, E., LEE, E. H.,
BERG, D. E. & MONTENEGRO-JAMES, S. 2000. Rapid, efficient detection
and drug susceptibility testing of Mycobacterium tuberculosis in sputum by
microscopic observation of broth cultures. The Tuberculosis Working Group in
Peru. J Clin Microbiol, 38, 1203-1208.
CENTRES FOR DISEASE CONTROL AND PREVENTION. 2013. Data and Statistics
2013.
CHANDRASEKHAR, S. & RATNAM, S. 1992. Studies on cell-wall deficient non-acid
fast variants of Mycobacterium tuberculosis. Tuber Lung Dis, 73, 273-9.
CHAO, M. C. & RUBIN, E. J. 2010. Letting sleeping dos lie: does dormancy play a
role in tuberculosis? Annu Rev Microbiol, 64, 293-311.
CHANG, Z. Y., PRIMM, T. P., JAKANA, J., LEE, I. H., SERYSHEVA, I., CHIU, W.,
GILBERT, H. F. & QUIOCHO, F. A. 1996. Mycobacterium tuberculosis 16-kDa
antigen (Hsp16.3) functions as an oligomeric structure in vitro to suppress
thermal aggregation. Journal of Biological Chemistry, 271, 7218-7223.
CHANG, J. C., HARIK, N. S., LIAO, R. P. & SHERMAN, D. R. 2007. Identification of
mycobacterial genes that alter growth and pathology in macrophages and in
mice. Journal of Infectious Diseases, 196, 788-795.
CHATTERJEE, D., HUNTER, S. W., MCNEIL, M. & BRENNAN, P. J. 1992.
Lipoarabinomannan - Multiglycosylated Form of the Mycobacterial
Mannosylphosphatidylinositols. Journal of Biological Chemistry, 267, 6228-
6233.
CHATTERJEE, D. 1997. The mycobacterial cell wall: structure, biosynthesis and sites
of drug action. Current Opinion in Chemical Biology, 1, 579-588.
193
CHEN, C. S., ARTTAMANGKUL, S., ZHOU, M. & HAUGLAND, R. P. 1998. BODIPY
FL-pepstatin A, a fluorescent probe for the subcellular distribution of cathepsin
D. Molecular Biology of the Cell, 9, 470a-470a.
CHEUNG, M. K., LAM, W. Y., FUNG, W. Y. W., LAW, P. T. W., AU, C. H., NONG, W.
Y., KAM, K. M., KWAN, H. S. & TSUI, S. K. W. 2013. Sputum Microbiota in
Tuberculosis as Revealed by 16S rRNA Pyrosequencing. Plos One, 8.
CHO, H., LASCO, T. M., ALLEN, S. S., YOSHIMURA, T. & MCMURRAY, D. N. 2005.
Recombinant guinea pig tumor necrosis factor alpha stimulates the expression
of interleukin-12 and the inhibition of Mycobacterium tuberculosis growth in
macrophages. Infection and Immunity, 73, 1367-1376.
CHO, K. Y. & SALTON, M. R. 1966. Fatty acid composition of bacterial membrane and
wall lipids. Biochim Biophys Acta, 116, 73-9.
CHRISTIAN, A. E., HAYNES, M. P., PHILLIPS, M. C. & ROTHBLAT, G. H. 1997. Use
of cyclodextrins for manipulating cellular cholesterol content. J Lipid Res, 38,
2264-2272.
CLARK-CURTISS, J. E. 1998. Identification of virulence determinants in pathogenic mycobacteria. Curr Top Microbiol Immunol, 225, 57-79.
COCITO, C. & VANLINDEN, F. 1988. Metabolism of the TMA group of antigens
during the growth cycle of mycobacteria. Med Microbiol Immunol, 177, 357-67.
COHEN-GONSAUD, M., BARTHE, P., BAGNERIS, C., HENDERSON, B., WARD, J.,
ROUMESTAND, C. & KEEP, N. H. 2005. The structure of a resuscitation-
promoting factor domain from Mycobacterium tuberculosis shows homology to
COLE, S. T., BROSCH, R., PARKHILL, J., GARNIER, T., CHURCHER, C., HARRIS,
D., GORDON, S. V., EIGLMEIER, K., GAS, S., BARRY, C. E., TEKAIA, F.,
BADCOCK, K., BASHAM, D., BROWN, D., CHILLINGWORTH, T., CONNER,
R., DAVIES, R., DEVLIN, K., FELTWELL, T., GENTLES, S., HAMLIN, N.,
HOLROYD, S., HORNSBY, T., JAGELS, K., KROGH, A., MCLEAN, J.,
MOULE, S., MURPHY, L., OLIVER, K., OSBORNE, J., QUAIL, M. A.,
RAJANDREAM, M. A., ROGERS, J., RUTTER, S., SEEGER, K., SKELTON, J.,
SQUARES, R., SQUARES, S., SULSTON, J. E., TAYLOR, K., WHITEHEAD,
S. & BARRELL, B. G. 1998. Deciphering the biology of Mycobacterium
tuberculosis from the complete genome sequence (vol 393, pg 537, 1998).
Nature, 396, 190-198.
COLE, S. T., EIGLMEIER, K., PARKHILL, J., JAMES, K. D., THOMSON, N. R., WHEELER, P. R., HONORE, N., GARNIER, T., CHURCHER, C., HARRIS, D., MUNGALL, K., BASHAM, D., BROWN, D., CHILLINGWORTH, T., CONNOR, R., DAVIES, R. M., DEVLIN, K., DUTHOY, S., FELTWELL, T., FRASER, A., HAMLIN, N., HOLROYD, S., HORNSBY, T., JAGELS, K., LACROIX, C., MACLEAN, J., MOULE, S., MURPHY, L., OLIVER, K., QUAIL, M. A., RAJANDREAM, M. A., RUTHERFORD, K. M., RUTTER, S., SEEGER, K., SIMON, S., SIMMONDS, M., SKELTON, J., SQUARES, R., SQUARES, S., STEVENS, K., TAYLOR, K., WHITEHEAD, S., WOODWARD, J. R. & BARRELL, B. G. 2001. Massive gene decay in the leprosy bacillus. Nature, 409, 1007-11.
COLE, S. T. 2002. Comparative and functional genomics of the Mycobacterium
DUCHENE, D.1987. Cyclodextrin and Their Industrial Uses. Editions de Santé, Paris.
DUBNAU, E., CHAN, J., RAYNAUD, C., MOHAN, V. P., LANEELLE, M. A., YU, K. M.,
QUEMARD, A., SMITH, I. & DAFFE, M. 2000. Oxygenated mycolic acids are
necessary for virulence of Mycobacterium tuberculosis in mice. Molecular
Microbiology, 36, 630-637.
DUBNAU, E., FONTAN, P., MANGANELLI, R., SOARES-APPEL, S. & SMITH, I. 2002. Mycobacterium tuberculosis genes induced during infection of human macrophages. Infection and Immunity, 70, 2787-2795.
DUTT, A. K., 2011. Epidemiology and Host Factors. In: SCHLOSSBERG, D. (ed.)
Tuberculosis and Nontuberculosis Mycobacterial Infections. 6 ed. Washington
DC, USA: ASM Press.
EGHOLM, M., BUCHARDT, O., NIELSEN, P. E. & BERG, R. H. 1992. Peptide
Nucleic-Acids (Pna) - Oligonucleotide Analogs with an Achiral Peptide
Backbone. Journal of the American Chemical Society, 114, 1895-1897.
EGHOLM, M., BUCHARDT, O., CHRISTENSEN, L., BEHRENS, C., FREIER, S. M.,
DRIVER, D. A., BERG, R. H., KIM, S. K., NORDEN, B. & NIELSEN, P. E.
1993. Pna Hybridizes to Complementary Oligonucleotides Obeying the
GLICKMAN, M. S. & JACOBS, W. R. 2001. Microbial pathogenesis of Mycobacterium
tuberculosis: Dawn of a discipline. Cell, 104, 477-485.
GLICKMAN, M. S. 2003. The mmaA2 gene of Mycobacterium tuberculosis encodes
the distal cycloproplane synthase of the alpha-mycolic acid. Journal of
Biological Chemistry, 278, 7844-7849.
GLYNN, J. R., WHITELEY, J., BIFANI, P. J., KREMER, K. & VAN SOOLINGEN, D.
2002. Worldwide occurrence of Beijing/W strains of Mycobacterium
tuberculosis: A systematic review. Emerging Infectious Diseases, 8, 843-849.
GOKHALE S, QADIR S. 1990. Efficacy of cold staining method of AFB in sputum a
comparision with Ziehl Neelsen method under field conditions. Ind. J. Tub. 37,
135 – 138.
GOMEZ, J. E. & MCKINNEY, J. D. 2004. M-tuberculosis persistence, latency, and
drug tolerance. Tuberculosis, 84, 29-44.
GORDON, S. V., BROSCH, R., BILLAULT, A., GARNIER, T., EIGLMEIER, K. &
COLE, S. T. 1999. Identification of variable regions in the genomes of tubercle
bacilli using bacterial artificial chromosome arrays. Molecular Microbiology, 32,
643-655.
GONZALEZ-JUARRERO, M., TURNER, O. C., TURNER, J., MARIETTA, P.,
BROOKS, J. V. & ORME, I. M. 2001. Temporal and spatial arrangement of
lymphocytes within lung granulomas induced by aerosol infection with
Mycobacterium tuberculosis. Infection and Immunity, 69, 1722-1728.
GRZEGORZEWSKI, P. & ZIEMBINSKA, P. 2011. Spearman's Rank Correlation
Coefficient for Vague Preferences. Flexible Query Answering Systems, 7022,
342-353.
198
GUPTA, S. & TYAGI, A. K. 1993. Sequence of a Newly Identified Mycobacterium-
Tuberculosis Gene Encoding a Protein with Sequence Homology to Virulence-
Regulating Proteins. Gene, 126, 157-158.
GUPTA, S., JAIN, S. & TYAGI, A. K. 1999. Analysis, expression and prevalence of the
Mycobacterium tuberculosis homolog of bacterial virulence regulating proteins.
Fems Microbiology Letters, 172, 137-143.
GUPTA, A. 2009. Killing activity and rescue function of genome-wide toxin-antitoxin
loci of Mycobacterium tuberculosis. Fems Microbiology Letters, 290, 45-53.
GUPTA, R. K. & SRIVASTAVA, R. 2012. Resuscitation Promoting Factors: a Family of
Microbial Proteins in Survival and Resuscitation of Dormant Mycobacteria.
Indian Journal of Microbiology, 52, 114-121.
HABEENZU, C., LUBASI, D. & FLEMING, A. F. 1998. Improved sensitivity of direct
microscopy for detection of acid-fast bacilli in sputum in developing countries.
Transactions of the Royal Society of Tropical Medicine and Hygiene, 92, 415-
416.
HAGEMANN PKH. 1937. Floureszenzmikroskopische untersuchungen uber virus und
andere microben. Zentralbl Bakteriol,140:184.
HAILE, Y., BJUNE, G. & WIKER, H. G. 2002. Expression of the mceA, esat-6 and
hspX genes in Mycobacterium tuberculosis and their responses to aerobic
conditions and to restricted oxygen supply. Microbiology-Sgm, 148, 3881-3886.
HALL-STOODLEY, L. & LAPPIN-SCOTT, H. 1998. Biofilm formation by the rapidly
growing mycobacterial species Mycobacterium fortuitum. Fems Microbiology
Letters, 168, 77-84.
HALL-STOODLEY, L. & STOODLEY, P. 2002. Developmental regulation of microbial
biofilms. Current Opinion in Biotechnology, 13, 228-233.
HALL-STOODLEY, P., et al. 2002. Biofilms as complex differentiated communities.
Annual Review of Microbiology, 56, 187-209.
HALL-STOODLEY, L., COSTERTON, J. W. & STOODLEY, P. 2004. Bacterial biofilms:
From the natural environment to infectious diseases. Nature Reviews
Microbiology, 2, 95-108.
HALL-STOODLEY, L., COSTERTON, J. W. & STOODLEY, P. 2004. Bacterial biofilms:
from the natural environment to infectious diseases. Nat Rev Microbiol, 2, 95-
108.
HANSCHEID, T., RIBEIRO, C. M., SHAPIRO, H. M. & PERLMUTTER, N. G. 2007.
Fluorescence microscopy for tuberculosis diagnosis. Lancet Infectious
Diseases, 7, 236-237.
HARADA, K. 1976. The nature of mycobacterial acid-fastness. Stain Technol, 51, 255-
60.
HARADA, K., GIDOH, S. & TSUTSUMI, S. 1976. Staining Mycobacteria with
Carbolfuchsin - Properties of Solutions Prepared with Different Samples of
Basic Fuchsin. Microscopica Acta, 78, 21-27.
HARBOE, M. 1981. Antigens of Ppd, Old Tuberculin, and Autoclaved Mycobacterium-
Bovis Bcg Studied by Crossed Immunoelectrophoresis. American Review of
Respiratory Disease, 124, 80-87.
HARRINGTON, B. J. 1966. A numerical taxonomicalstudy of some corynebacteria and
related organisms. J. Gen. Microbiol, 45, 31-40.
199
HARTMANN, G., HONIKEL, K. O., KNUSEL, F. & NUESCH, J. 1967. The specific
inhibition of the DNA-directed RNA synthesis by rifamycin. Biochim Biophys
Acta, 145, 843-4.
HE, Z. & DE BUCK, J. 2010. Cell wall proteome analysis of Mycobacterium smegmatis strain MC2 155. BMC Microbiol, 10, 121.
HEIMER, G. V., JOSEPH, N. & TAYLOR, C. E. 1978. Staining clinical specimens for
acid-fast bacilli by means of a mechanical conveyor system. J Clin Pathol, 31,
185-8.
HERSHBERG, R., LIPATOV, M., SMALL, P. M., SHEFFER, H., NIEMANN, S.,
HOMOLKA, S., ROACH, J. C., KREMER, K., PETROV, D. A., FELDMAN, M.
W. & GAGNEUX, S. 2008. High Functional Diversity in Mycobacterium
tuberculosis Driven by Genetic Drift and Human Demography. Plos Biology, 6,
2658-2671.
HESTVIK, A. L., HMAMA, Z. & AV-GAY, Y. 2005. Mycobacterial manipulation of the
host cell. FEMS Microbiol Rev, 29, 1041-50.
HETT, E. C., CHAO, M. C., STEYN, A. J., FORTUNE, S. M., DENG, L. L. & RUBIN, E.
J. 2007. A partner for the resuscitation-promoting factors of Mycobacterium
tuberculosis. Mol Microbiol, 66, 658-68.
HETT, E. C. & RUBIN, E. J. 2008. Bacterial growth and cell division: a mycobacterial
perspective. Microbiol Mol Biol Rev, 72, 126-56, table of contents.
HOFF, D. R., RYAN, G. J., DRIVER, E. R., SSEMAKULU, C. C., DE GROOTE, M. A.,
BASARABA, R. J. & LENAERTS, A. J. 2011. Location of intra- and
extracellular M. tuberculosis populations in lungs of mice and guinea pigs
during disease progression and after drug treatment. PLoS One, 6, e17550.
HOLLANDER, M. & PENA, E. A. 2004. Nonparametric Methods in Reliability. Stat Sci,
19, 644-651.
HOLT, J. G., N. R. KRIEG, P. H. A. SNEATH, J. T. STALEY, and S. T. WILLIAMS
(ed.). 1994. Bergey's manual of determinative bacteriology, 9th ed. Williams &
Wilkins, Baltimore, MD.
HONER ZU BENTRUP, K. & RUSSELL, D. G. 2001. Mycobacterial persistence:
adaptation to a changing environment. Trends Microbiol, 9, 597-605.
HONAKER, R. W., STEWART, A., SCHITTONE, S., IZZO, A., KLEIN, M. R. &
VOSKUIL, M. I. 2008. Mycobacterium bovis BCG vaccine strains lack narK2
and narX induction and exhibit altered phenotypes during dormancy. Infect
Immun, 76, 2587-93.
HOPEWELL, P., C. & JAMSER, R., M. (2005). Overview of Clinical Tuberculosis. In:
COLE, S. T., EISENACH, K. D., MCMURRAY, D. N. & JACOBS JR, W. R.
(eds.) Tuberculosis and the Tubercle Bacillus. Washington,DC: ASM Press.
HU, Y. M., MOVAHEDZADEH, F., STOKER, N. G. & COATES, A. R. M. 2006.
Deletion of the Mycobacterium tuberculosis alpha-crystallin-like hspX gene
causes increased bacterial growth in vivo. Infection and Immunity, 74, 861-868.
HUNTER, R. L., OLSEN, M., JAGANNATH, C. & ACTOR, J. K. 2006. Trehalose 6,6 '-
dimycolate and lipid in the pathogenesis of caseating granulomas of
tuberculosis in mice. American Journal of Pathology, 168, 1249-1261.
HUNTLEY, J. F. J., WHITLOCK, R. H., BANNANTINE, J. P. & STABEL, J. R. 2005.
Comparison of diagnostic detection methods for Mycobacterium avium subsp
paratuberculosis in North American bison. Veterinary Pathology, 42, 42-51.
200
HUSEBY, J. S. 1976. Miliary Tuberculosis and Adult Respiratory-Distress Syndrome.
Annals of Internal Medicine, 85, 609-611.
HUYNH, K. K., JOSHI, S. A. & BROWN, E. J. 2011. A delicate dance: host response
to mycobacteria. Curr Opin Immunol, 23, 464-72.
INDERLIED, C. B. (1991). "Antimycobacterial agents: In vitro susceptibility testing, spectrums of activity, mechanisms of action and resistance, and assays for activity in biological fluids", p. 134-197. In V. Lorian (ed.), Antibiotics in laboratory medicine, 3rd ed. Williams & Wilkins, Baltimore, Md.
ISLAM, M. S., RICHARDS, J. P. & OJHA, A. K. 2012. Targeting drug tolerance in
mycobacteria: a perspective from mycobacterial biofilms. Expert Review of
Anti-Infective Therapy, 10, 1055-1066.
JI, Y. E., COLSTON, M. J. & COX, R. A. 1994. The ribosomal RNA (rrn) operons of
fast-growing mycobacteria: primary and secondary structures and their relation
to rrn operons of pathogenic slow-growers. Microbiology, 140 ( Pt 10), 2829-
2840.
JAMSHIDI, N. & PALSSON, B. O. 2007. Investigating the metabolic capabilities of
Mycobacterium tuberculosis H37Rv using the in silico strain iNJ661 and
proposing alternative drug targets. Bmc Systems Biology, 1.
KAISER, D. 2003. Coupling cell movement to multicellular development in
myxobacteria. Nat Rev Microbiol, 1, 45-54.
KAYNE, G. G.1935. The Use of Sanocrysin in the Treatment of Pulmonary
Tuberculosis: (Section of Medicine). Proc R Soc Med, 28, 1463-1468.
KENDALL, S. L., MOVAHEDZADEH, F., RISON, S. C. G., WERNISCH, L., PARISH,
T., DUNCAN, K., BETTS, J. C. & STOKER, N. G. 2004. The Mycobacterium
tuberculosis dosRS two-component system is induced by multiple stresses.
Tuberculosis, 84, 247-255.
KENDALL, S. L., WITHERS, M., SOFFAIR, C. N., MORELAND, N. J., GURCHA, S.,
SIDDERS, B., FRITA, R., TEN BOKUM, A., BESRA, G. S., LOTT, J. S. &
STOKER, N. G. 2007. A highly conserved transcriptional repressor controls a
large regulon involved in lipid degradation in Mycobacterium smegmatis and
KENDALL, B. A., VARLEY, C. D., HEDBERG, K., CASSIDY, P. M. & WINTHROP, K.
L. 2010. Isolation of non-tuberculous mycobacteria from the sputum of patients
with active tuberculosis. International Journal of Tuberculosis and Lung
Disease, 14, 654-656.
KANA, B. D. & MIZRAHI, V. 2010. Resuscitation-promoting factors as lytic enzymes
for bacterial growth and signaling. Fems Immunology and Medical
Microbiology, 58, 39-50.
KAPOOR, N., PAWAR, S., SIRAKOVA, T. D., DEB, C., WARREN, W. L. &
KOLATTUKUDY, P. E. 2013. Human Granuloma In Vitro Model, for TB
Dormancy and Resuscitation. Plos One, 8.
KIERNAN JA. 2000. Formaldehyde, formalin, paraformaldehyde and glutaraldehyde:
What they are and what they do. Microscopy Today,1,8–12.
KIERNAN, J. A. 2001. Classification and naming of dyes, stains and fluorochromes.
Biotech Histochem, 76, 261-78.
KIM, K. S., SALTON, M. R. & BARKSDALE, L. 1976. Ultrastructure of superficial
mycosidic integuments of Mycobacterium sp. J Bacteriol, 125, 739-43.
201
KIM, J. H., KIM, Y. J., KI, C. S., KIM, J. Y. & LEE, N. Y. 2011. Evaluation of Cobas
TaqMan MTB PCR for detection of Mycobacterium tuberculosis. J Clin
Microbiol, 49, 173-6.
KINYOUN, J. J. 1915. A NOTE ON UHLENHUTHS METHOD FOR SPUTUM
EXAMINATION, FOR TUBERCLE BACILLI. Am J Public Health (N Y), 5, 867-
870.
KIRKSEY, M. A., TISCHLER, A. D., SIMEONE, R., HISERT, K. B., UPLEKAR, S.,
GUILHOT, C. & MCKINNEY, J. D. 2011. Spontaneous phthiocerol
dimycocerosate-deficient variants of Mycobacterium tuberculosis are
susceptible to gamma interferon-mediated immunity. Infect Immun, 79, 2829-
2838KOIVUNEN, M. E. & KROGSRUD, R. L. 2006. Principles of
immunochemical techniques used in clinical laboratories. Labmedicine, 37,
490-497.
KHOO, K. H., DELL, A., MORRIS, H. R., BRENNAN, P. J. & CHATTERJEE, D. 1995.
Inositol Phosphate Capping of the Nonreducing Termini of Lipoarabinomannan
from Rapidly Growing Strains of Mycobacterium. Journal of Biological
Chemistry, 270, 12380-12389.
KOCH-WESER, D., BARCLAY, W. R. & EBERT, R. H. 1955. The influence of
isoniazid and streptomycin on acid-fastness, tetrazolium reduction, growth, and
survival of tubercle bacilli. Am Rev Tuberc, 71, 556-65.
KONDO, E. & KANAI, K. 1972. The lethal effect of long-chain fatty acids on mycobacteria. Jpn J Med Sci Biol, 25, 1-13.
KRUH, N. A., TROUDT, J., IZZO, A., PRENNI, J. & DOBOS, K. M. 2010. Portrait of a
pathogen: the Mycobacterium tuberculosis proteome in vivo. PLoS One, 5.
KUMAR, A., TOLEDO, J. C., PATEL, R. P., LANCASTER, J. R. & STEYN, A. J. C.
2007. Mycobacterium tuberculosis DosS is a redox sensor and DosT is a
hypoxia sensor. Proceedings of the National Academy of Sciences of the
United States of America, 104, 11568-11573.
KUMAR, A., FARHANA, A., GUIDRY, L., SAINI, V., HONDALUS, M. & STEYN, A. J.
2011. Redox homeostasis in mycobacteria: the key to tuberculosis control?
Expert Rev Mol Med, 13, e39.
KULKA, K., HATFULL, G. & OJHA, A. K. 2012. Growth of Mycobacterium tuberculosis
biofilms. J Vis Exp.
KUSSELL, E. & LEIBLER, S. 2005. Phenotypic diversity, population growth, and
information in fluctuating environments. Science, 309, 2075-8.
LAMVIK, J., HELLA, H., LIABAKK, N. B. & HALAAS, O. 2001. Nonlabeled secondary
antibodies augment/maintain the binding of primary, specific antibodies to cell
membrane antigens. Cytometry, 45, 187-93.
LANDI, S. 1982. Production and standardization of tuberculin (a brief history). Indian J Chest Dis Allied Sci, 24, 78-87.
LARSSON, C., LUNA, B., AMMERMAN, N. C., MAIGA, M., AGARWAL, N. & BISHAI, W. R. 2012. Gene expression of Mycobacterium tuberculosis putative transcription factors whiB1-7 in redox environments. PLoS One, 7, e37516.
LEE, S.-M. 2012. In vitro Studies on the Sputum Phenotype of Mycobacterium
tuberculosis. University of Leicester.
LEFMANN, M., SCHWEICKERT, B., BUCHHOLZ, P., GOBEL, U. B., ULRICHS, T.,
SEILER, P., THEEGARTEN, D. & MOTER, A. 2006. Evaluation of peptide
nucleic acid-fluorescence in situ hybridization for identification of clinically
202
relevant mycobacteria in clinical specimens and tissue sections. J Clin
Microbiol, 44, 3760-7.
LENAERTS, A. J., HOFF, D., ALY, S., EHLERS, S., ANDRIES, K., CANTARERO, L.,
ORME, I. M. & BASARABA, R. J. 2007. Location of persisting mycobacteria in
a Guinea pig model of tuberculosis revealed by r207910. Antimicrob Agents
Chemother, 51, 3338-45.
LEISTIKOW, R. L., MORTON, R. A., BARTEK, I. L., FRIMPONG, I., WAGNER, K. &
VOSKUIL, M. I. 2010. The Mycobacterium tuberculosis DosR regulon assists in
metabolic homeostasis and enables rapid recovery from nonrespiring
dormancy. J Bacteriol, 192, 1662-70.
LEWIS, K. 2007. Persister cells, dormancy and infectious disease. Nat Rev Microbiol,
5, 48-56.
LEUNG, A. N. 1999. Pulmonary tuberculosis: the essentials. Radiology, 210, 307-22.
LIN, P. L. & FLYNN, J. L. 2010. Understanding latent tuberculosis: a moving target. J
Immunol, 185, 15-22.
LIPSCOMB, M. F. & MASTEN, B. J. 2002. Dendritic cells: Immune regulators in health
and disease. Physiological Reviews, 82, 97-130.
LISTENBERGER, L. L. & BROWN, D. A. 2007. Fluorescent detection of lipid droplets
and associated proteins. Curr Protoc Cell Biol, Chapter 24, Unit 24 2.
LIU, J., BARRY, C. E., 3RD, BESRA, G. S. & NIKAIDO, H. 1996. Mycolic acid
structure determines the fluidity of the mycobacterial cell wall. J Biol Chem,
271, 29545-51.
LEUNG, A. N. 1999. Pulmonary tuberculosis: the essentials. Radiology, 210, 307-22.
MALHOTRA, V., SHARMA, D., RAMANATHAN, V. D., SHAKILA, H., SAINI, D. K.,
CHAKRAVORTY, S., DAS, T. K., LI, Q., SILVER, R. F., NARAYANAN, P. R. &
TYAGI, J. S. 2004. Disruption of response regulator gene, devR, leads to
attenuation in virulence of Mycobacterium tuberculosis. FEMS Microbiol Lett,
231, 237-45.
MANGANELLI, R., DUBNAU, E., TYAGI, S., KRAMER, F. R. & SMITH, I. 1999.
Differential expression of 10 sigma factor genes in Mycobacterium tuberculosis.
Molecular Microbiology, 31, 715-724.
MARAIS, B. J., BRITTLE, W., PAINCZYK, K., HESSELING, A. C., BEYERS, N.,
WASSERMAN, E., VAN SOOLINGEN, D. & WARREN, R. M. 2008. Use of
light-emitting diode fluorescence microscopy to detect acid-fast bacilli in
MCKINNEY, J. D., ZU BENTRUP, K. H., MUNOZ-ELIAS, E. J., MICZAK, A., CHEN,
B., CHAN, W. T., SWENSON, D., SACCHETTINI, J. C., JACOBS, W. R. &
RUSSELL, D. G. 2000. Persistence of Mycobacterium tuberculosis in
macrophages and mice requires the glyoxylate shunt enzyme isocitrate lyase.
Nature, 406, 735-738.
MCKINNEY, J. D. 2000. In vivo veritas: the search for TB drug targets goes live. Nat
Med, 6, 1330-3.
MIDDLEBROOK, G., DUBOS, R. J. & PIERCE, C. 1947. Virulence and Morphological
Characteristics of Mammalian Tubercle Bacilli. J Exp Med, 86, 175-84.
MITCHISON, D. A. 1979. Basic mechanisms of chemotherapy. Chest, 76, 771-81.
MITCHISON, D. A. & NUNN, A. J. 1986. Influence of initial drug resistance on the
response to short-course chemotherapy of pulmonary tuberculosis. Am Rev
Respir Dis, 133, 423-30.
MITCHISON, D. A. 2004. The search for new sterilizing anti-tuberculosis drugs. Front
Biosci, 9, 1059-72.
MITCHISON, D. A. 2005. The diagnosis and therapy of tuberculosis during the past
100 years. Am J Respir Crit Care Med, 171, 699-706.
MONAHAN, I. M., BETTS, J., BANERJEE, D. K. & BUTCHER, P. D. 2001. Differential expression of mycobacterial proteins following phagocytosis by macrophages. Microbiology, 147, 459-71.
MUDD, S. & MUDD, E. B. 1927. The Surface Composition of the Tubercle Bacillus and
Other Acid-Fast Bacteria. J Exp Med, 46, 167-72.
MUKAMOLOVA, G. V., KORMER, S. S., KELL, D. B. & KAPRELYANTS, A. S. 1999.
Stimulation of the multiplication of Micrococcus luteus by an autocrine growth
factor. Arch Microbiol, 172, 9-14.
MUKAMOLOVA, G. V., TURAPOV, O. A., YOUNG, D. I., KAPRELYANTS, A. S.,
KELL, D. B. & YOUNG, M. 2002. A family of autocrine growth factors in
MUKAMOLOVA, G. V., YANOPOLSKAYA, N. D., KELL, D. B. & KAPRELYANTS, A.
S. 1998. On resuscitation from the dormant state of Micrococcus luteus.
Antonie Van Leeuwenhoek, 73, 237-243.
MUKAMOLOVA, G. V., et al. 2006. Occult Tubercle Bacilli Revealed 179Rpf and its
relationship to physiological activity in promoting bacterial growth and
resuscitation. Mol Microbiol, 59,84–98.
MUKAMOLOVA, G. V., TURAPOV, O., MALKIN, J., WOLTMANN, G. & BARER, M. R.
2010. Resuscitation-promoting factors reveal an occult population of tubercle
Bacilli in Sputum. Am J Respir Crit Care Med, 181, 174-80.
MUNOZ-ELIAS, E. J., TIMM, J., BOTHA, T., CHAN, W. T., GOMEZ, J. E. & MCKINNEY, J. D. 2005. Replication dynamics of Mycobacterium tuberculosis in chronically infected mice. Infect Immun, 73, 546-51.
204
MUNOZ-ELIAS, E. J. & MCKINNEY, J. D. 2005. Mycobacterium tuberculosis isocitrate
lyases 1 and 2 are jointly required for in vivo growth and virulence. Nat Med,
11, 638-44.
MUROHASHI, T. & YOSHIDA, K. 1965. [Relation between the Loss of Acid-Fastness
Due to the Uv Irradiation and the Virulence of Tubercle Bacilli]. Nihon
Saikingaku Zasshi, 20, 233-8.
MUROHASHI, T. & YOSHIDA, K. 1968. Biology of the mycobacterioses. Biological
significance of acid-fastness of mycobacteria. Ann N Y Acad Sci, 154, 58-67.
MURRAY, H. W., TUAZON, C. U., KIRMANI, N. & SHEAGREN, J. N. 1978. The adult
respiratory distress syndrome associated with miliary tuberculosis. Chest, 73,
37-43.
MUTTUCUMARU, D. G. N., ROBERTS, G., HINDS, J., STABLER, R. A. & PARISH, T.
2004. Gene expression profile of Mycobacterium tuberculosis in a non-
replicating state. Tuberculosis, 84, 239-246.
NEONAKIS, I. K., GITTI, Z., KONTOS, F., BARITAKI, S., PETINAKI, E., BARITAKI,
M., ZERVA, L. & SPANDIDOS, D. A. 2009. Mycobacterium thermoresistibile:
Case report of a rarely isolated mycobacterium from Europe and review of
literature. Indian Journal of Medical Microbiology, 27, 264-267.
NIGOU, J., GILLERON, M. & PUZO, G. 2003. Lipoarabinomannans: from structure to
biosynthesis. Biochimie, 85, 153-166.
NIELSEN, P. E., EGHOLM, M., BERG, R. H. & BUCHARDT, O. 1991. Sequence-
Selective Recognition of DNA by Strand Displacement with a Thymine-
Substituted Polyamide. Science, 254, 1497-1500.
NYKA, W. 1967. Method for staining both acid-fast and chromophobic tubercle bacilli
with carbolfuschsin. J Bacteriol, 93, 1458-1460.
NYKA, W. & ONEILL, E. F. 1970. New Approach to Study of Non-Acid-Fast
Mycobacteria. Annals of the New York Academy of Sciences, 174, 862.
NYKA, W. 1971. Influence of Oxidation and Reduction on Acid-Fastness of
Mycobacteria. Infection and Immunity, 4, 513.
NYKA, W. 1974. Studies on the effect of starvation on mycobacteria. Infect Immun, 9,
843-850.
O'GARRA, A. 2011. Regulation of the immune response in tuberculosis: Lessons
learned from mouse models and human disease. Cytokine, 56, 58-58.
OHNO, H., ZHU, G. F., MOHAN, V. P., CHU, D., KOHNO, S., JACOBS, W. R. &
CHAN, J. 2003. The effects of reactive nitrogen intermediates on gene
expression in Mycobacterium tuberculosis. Cellular Microbiology, 5, 637-648.
OJHA, A., ANAND, M., BHATT, A., KREMER, L., JACOBS, W. R. & HATFULL, G. F.
2005. GroEL1: a dedicated chaperone involved in mycolic acid biosynthesis
during biofilm formation in mycobacteria. Cell, 123, 861-873.
OJHA, A. K., BAUGHN, A. D., SAMBANDAN, D., HSU, T., TRIVELLI, X.,
GUERARDEL, Y., ALAHARI, A., KREMER, L., JACOBS, W. R. & HATFULL, G.
F. 2008. Growth of Mycobacterium tuberculosis biofilms containing free mycolic
acids and harbouring drug-tolerant bacteria. Molecular Microbiology, 69, 164-
174.
OJHA, A. K., TRIVELLI, X., GUERARDEL, Y., KREMER, L. & HATFULL, G. F. 2010.
Enzymatic hydrolysis of trehalose dimycolate releases free mycolic acids
during mycobacterial growth in biofilms. J Biol Chem, 285, 17380-9.
205
OlATUNBOSUN, F. M. 2012. Mycobacterium bovis BCG physiology within the biofilm
system. MSc in Infection, Immunity and Inflammation, University of Leicester.
ORTALO-MAGNE, A., DUPONT, M. A., LEMASSU, A., ANDERSEN, A. B., GOUNON,
P. & DAFFE, M. 1995. Molecular composition of the outermost capsular
material of the tubercle bacillus. Microbiology, 141 ( Pt 7), 1609-20.
OSTER, G. 1951. [Fluorescence of auramine O in the presence of nucleic acid]. C R
Hebd Seances Acad Sci, 232, 1708-10.
O'TOOLE, G. A., PRATT, L. A., WATNICK, P. I., NEWMAN, D. K., WEAVER, V. B. &
KOLTER, R. 1999. Genetic approaches to study of biofilms. Methods Enzymol,
310, 91-109.
PANG, J. M., LAYRE, E., SWEET, L., SHERRID, A., MOODY, D. B., OJHA, A. &
SHERMAN, D. R. 2012. The polyketide Pks1 contributes to biofilm formation in
PAVELKA, M. S. 2007. Another brick in the wall.Trends Microbiol, 15, 147-149.
PANDEY, A., et al. 2009. Cold acid fast staining method: Efficacy in diagnosis of
Mycobacterium tuberculosis. African Journal of Microbiology Research, 3, 546-
549.
PARISH, T. & STOKER, N. G. 2002. The common aromatic amino acid biosynthesis pathway is essential in Mycobacterium tuberculosis. Microbiology, 148, 3069-77.
PARISH, T., SMITH, D. A., KENDALL, S., CASALI, N., BANCROFT, G. J. &
STOKER, N. G. 2003. Deletion of two-component regulatory systems increases
the virulence of Mycobacterium tuberculosis. Infect Immun, 71, 1134-40.
PARRISH, N. M., DICK, J. D. & BISHAI, W. R. 1998. Mechanisms of latency in
SCHMIDT, I., STEENBAKKERS, P. J., OP DEN CAMP, H. J., SCHMIDT, K. &
JETTEN, M. S. 2004. Physiologic and proteomic evidence for a role of nitric
oxide in biofilm formation by Nitrosomonas europaea and other ammonia
oxidizers. J Bacteriol, 186, 2781-8.
SCHNAPPINGER, D., EHRT, S., VOSKUIL, M. I., LIU, Y., MANGAN, J. A.,
MONAHAN, I. M., DOLGANOV, G., EFRON, B., BUTCHER, P. D., NATHAN,
C. & SCHOOLNIK, G. K. 2003. Transcriptional Adaptation of Mycobacterium
tuberculosis within Macrophages: Insights into the Phagosomal Environment. J
Exp Med, 198, 693-704.
SEILER, P., T. ULRICHS, et al. 2003. Cell-wall alterations as an attribute of
Mycobacterium tuberculosis in latent infection. J Infect Dis, 188, 1326-1331.
SELVAKUMAR, N., RAHMAN, F., GARG, R., RAJASEKARAN, S., MOHAN, N. S.,
THYAGARAJAN, K., SUNDARAM, V., SANTHA, T., FRIEDEN, T. R. &
NARAYANAN, P. R. 2002. Evaluation of the phenol ammonium sulfate
sedimentation smear microscopy method for diagnosis of pulmonary
tuberculosis. J Clin Microbiol, 40, 3017-20.
SENARATNE, R. H., SIDDERS, B., SEQUEIRA, P., SAUNDERS, G., DUNPHY, K.,
MARJANOVIC, O., READER, J. R., LIMA, P., CHAN, S., KENDALL, S.,
MCFADDEN, J. & RILEY, L. W. 2008. Mycobacterium tuberculosis strains
disrupted in mce3 and mce4 operons are attenuated in mice. J Med Microbiol,
57, 164-70.
SENSI, P., MARGALITH, P. & TIMBAL, M. T. 1959. Rifomycin, a new antibiotic;
preliminary report. Farmaco Sci, 14, 146-7.
SHAPIRO, H. M. & HANSCHEID, T. 2008. Fuchsin fluorescence in Mycobacterium
tuberculosis: the Ziehl-Neelsen stain in a new light. J Microbiol Methods, 74,
119-120.
SHEELVA, M., MUKAMOLOVA, G. V., YOUNG, M., WILLIAMS, H. D. &
KAPRELYANTS, A. S. 2004. Formation of 'non-culturable' cells of
208
Mycobacterium smegmatis in stationary phase in response to growth under
suboptimal conditions and their Rpf-mediated resuscitation. Microbiology, 150,
1687-97.
SHEPARD, C. C., & KIRSH, D. 1963. Fluorescent antibody stainability and other
consequences of the disruption of mycobacteria. Proceedings of the Society
for Experimental Biology and Medicine, 106, 685.
SHERMAN, D. R., VOSKUIL, M., SCHNAPPINGER, D., LIAO, R., HARRELL, M. I. &
SCHOOLNIK, G. K. 2001. Regulation of the Mycobacterium tuberculosis
hypoxic response gene encoding alpha -crystallin. Proc Natl Acad Sci U S A,
98, 7534-7539.
SHERRATT, A. L. 2008. Lipid Bodies in Mycobacteria. PhD, University of Leicester.
SHI, L., SOHASKEY, C. D., KANA, B. D., DAWES, S., NORTH, R. J., MIZRAHI, V. &
GENNARO, M. L. 2005. Changes in energy metabolism of Mycobacterium
tuberculosis in mouse lung and under in vitro conditions affecting aerobic
respiration. Proc Natl Acad Sci U S A, 102, 15629-34.
SHI, L., SOHASKEY, C. D., PFEIFFER, C., DATTA, P., PARKS, M., MCFADDEN, J., NORTH, R. J. & GENNARO, M. L. 2010. Carbon flux rerouting during Mycobacterium tuberculosis growth arrest. Mol Microbiol, 78, 1199-215.
SHINNICK, T. M. & GOOD, R. C. 1994. Mycobacterial taxonomy. Eur J Clin Microbiol
Infect Dis, 13, 884-901.
SILVA MIRANDA, M., BREIMAN, A., ALLAIN, S., DEKNUYDT, F. & ALTARE, F. 2012.
The tuberculous granuloma: an unsuccessful host defence mechanism
providing a safety shelter for the bacteria? Clin Dev Immunol, 2012, 139127.
SHOEB, H. A., BOWMAN, B. U., JR., OTTOLENGHI, A. C. & MEROLA, A. J. 1985.
Peroxidase-mediated oxidation of isoniazid. Antimicrob Agents Chemother, 27,
399-403.
SMITH, I. 2003. Mycobacterium tuberculosis pathogenesis and molecular
determinants of virulence. Clin Microbiol Rev, 16, 463-96.
SINGH, P. K., SCHAEFER, A. L., PARSEK, M. R., MONINGER, T. O., WELSH, M. J.
& GREENBERG, E. P. 2000. Quorum-sensing signals indicate that cystic
fibrosis lungs are infected with bacterial biofilms. Nature, 407, 762-4.
SINGH, A., JAIN, S., GUPTA, S., DAS, T. & TYAGI, A. K. 2003. mymA operon of
Mycobacterium tuberculosis: its regulation and importance in the cell envelope.
FEMS Microbiol Lett, 227, 53-63.
SINGH, A., CROSSMAN, D. K., MAI, D., GUIDRY, L., VOSKUIL, M. I., RENFROW, M.
B. & STEYN, A. J. 2009. Mycobacterium tuberculosis WhiB3 maintains redox
homeostasis by regulating virulence lipid anabolism to modulate macrophage
response. PLoS Pathog, 5, e1000545.
SKERMAN, V. B. D., V. MCGOWAN. 1980. Approved Lists of Bacterial Names.
International Journal of Systematic Bacteriology, 30, 225-420.
SMITHWICK, R. W., BIGBIE, M. R., JR., FERGUSON, R. B., KARLIX, M. A. &
WALLIS, C. K. 1995. Phenolic acridine orange fluorescent stain for
mycobacteria. J Clin Microbiol, 33, 2763-4.
SOHASKEY, C. D. 2008. Nitrate enhances the survival of Mycobacterium tuberculosis
during inhibition of respiration. J Bacteriol, 190, 2981-6.
SOLAN G. 2008. Detection of Mycobacterium tuberculosis using Auramine O and Nile
Red dual staining. University of Leicester.
209
SOMOSKOVI, A., HOTALING, J. E., FITZGERALD, M., O'DONNELL, D., PARSONS,
L. M. & SALFINGER, M. 2001. Lessons from a proficiency testing event for
acid-fast microscopy. Chest, 120, 250-7.
SOMOSKOVI, A., PARSONS, L. M. & SALFINGER, M. 2001. The molecular basis of
resistance to isoniazid, rifampin, and pyrazinamide in Mycobacterium
tuberculosis. Respir Res, 2, 164-8.
SPOERING, A. L. & LEWIS, K. 2001. Biofilms and planktonic cells of Pseudomonas
aeruginosa have similar resistance to killing by antimicrobials. J Bacteriol, 183,
6746-6751.
SREEVATSAN, S., PAN, X., STOCKBAUER, K. E., WILLIAMS, D. L., KREISWIRTH,
B. N. & MUSSER, J. M. 1996. Characterization of rpsL and rrs mutations in
streptomycin-resistant Mycobacterium tuberculosis isolates from diverse
STEINGART, K. R., HENRY, M., NG, V., HOPEWELL, P. C., RAMSAY, A.,
CUNNINGHAM, J., URBANCZIK, R., PERKINS, M., AZIZ, M. A. & PAI, M.
2006. Fluorescence versus conventional sputum smear microscopy for
tuberculosis: a systematic review. Lancet Infect Dis, 6, 570-81.
STENDER, H., MOLLERUP, T. A., LUND, K., PETERSEN, K. H., HONGMANEE, P. &
GODTFREDSEN, S. E. 1999. Direct detection and identification of
Mycobacterium tuberculosis in smear-positive sputum samples by fluorescence
in situ hybridization (FISH) using peptide nucleic acid (PNA) probes. Int J
Tuberc Lung Dis, 3, 830-7.
STENDER, H., K. LUND, et al. 1999. Fluorescence in situ hybridization assay using
peptide nucleic acid probes for differentiation between tuberculous and
nontuberculous mycobacterium species in smears of Mycobacterium cultures.J
Clin Microbiol, 37, 2760-2765.
STOKES, R. W. & WADDELL, S. J. 2009. Adjusting to a new home: Mycobacterium
tuberculosis gene expression in response to an intracellular lifestyle. Future
Microbiol, 4, 1317-1335.
STALLINGS, C. L., STEPHANOU, N. C., CHU, L., HOCHSCHILD, A., NICKELS, B. E.
& GLICKMAN, M. S. 2009. CarD is an essential regulator of rRNA transcription
required for Mycobacterium tuberculosis persistence. Cell, 138, 146-159.
STENGER, S., HANSON, D. A., TEITELBAUM, R., DEWAN, P., NIAZI, K. R.,
FROELICH, C. J., GANZ, T., THOMA-USZYNSKI, S., MELIAN, A., BOGDAN,
C., PORCELLI, S. A., BLOOM, B. R., KRENSKY, A. M. & MODLIN, R. L. 1998.
An antimicrobial activity of cytolytic T cells mediated by granulysin. Science,
282, 121-5.
SULTAN, L., NYKA, W., MILLS, C., O'GRADY, F., WELLS, W. & RILEY, R. L. 1960.
Tuberculosis disseminators. A study of the variability of aerial infectivity of
tuberculous patients. Am Rev Respir Dis, 82, 358-69.
SUTHERLAND, I. W. 2001. Exopolysaccharides in biofilms, flocs and related
structures. Water Sci Technol, 43, 77-86.
TAKAHASHI, S. 1979. [L-phase growth of mycobacteria. 2. Consideration on the
survival of tubercle bacillus in caseous lesion (author's transl)]. Kekkaku, 54,
231-5.
TAKAYAMA, K., WANG, C. & BESRA, G. S. 2005. Pathway to synthesis and
processing of mycolic acids in Mycobacterium tuberculosis. Clin Microbiol Rev,
18, 81-101.
210
TALAAT, A. M., LYONS, R., HOWARD, S. T. & JOHNSTON, S. A. 2004. The temporal
expression profile of Mycobacterium tuberculosis infection in mice.
Proceedings of the National Academy of Sciences of the United States of
America, 101, 4602-4607.
TEKAIA, F., GORDON, S. V., GARNIER, T., BROSCH, R., BARRELL, B. G. & COLE, S. T. 1999. Analysis of the proteome of Mycobacterium tuberculosis in silico. Tuber Lung Dis, 79, 329-42.
TELENTI, A., IMBODEN, P., MARCHESI, F., LOWRIE, D., COLE, S., COLSTON, M.
J., MATTER, L., SCHOPFER, K. & BODMER, T. 1993. Detection of rifampicin-
resistance mutations in Mycobacterium tuberculosis. Lancet, 341, 647-50.
TELKOV, M. V., DEMINA, G. R., VOLOSHIN, S. A., SALINA, E. G., DUDIK, T. V.,
STEKHANOVA, T. N., MUKAMOLOVA, G. V., KAZARYAN, K. A.,
GONCHARENKO, A. V., YOUNG, M. & KAPRELYANTS, A. S. 2006. Proteins
of the Rpf (resuscitation promoting factor) family are peptidoglycan hydrolases.
Biochemistry (Mosc), 71, 414-22.
TENG, R. & DICK, T. 2003. Isoniazid resistance of exponentially growing
ULRICHS, T., LEFMANN, M., REICH, M., MORAWIETZ, L., ROTH, A., BRINKMANN,
V., KOSMIADI, G. A., SEILER, P., AICHELE, P., HAHN, H., KRENN, V.,
GOBEL, U. B. & KAUFMANN, S. H. 2005. Modified immunohistological staining
allows detection of Ziehl-Neelsen-negative Mycobacterium tuberculosis
organisms and their precise localization in human tissue. J Pathol, 205, 633-40.
VAN BEEK, S. C., NHUNG, N. V., SY, D. N., STERK, P. J., TIEMERSMA, E. W. &
COBELENS, F. G. J. 2011. Measurement of exhaled nitric oxide as a potential
screening tool for pulmonary tuberculosis. International Journal of Tuberculosis
and Lung Disease, 15, 185-191.
VAN DER VLIET, A., EISERICH, J. P., SHIGENAGA, M. K. & CROSS, C. E. 1999.
Reactive nitrogen species and tyrosine nitration in the respiratory tract:
epiphenomena or a pathobiologic mechanism of disease? Am J Respir Crit
Care Med, 160, 1-9.
VAN DER GEIZE, R., YAM, K., HEUSER, T., WILBRINK, M. H., HARA, H.,
ANDERTON, M. C., SIM, E., DIJKHUIZEN, L., DAVIES, J. E., MOHN, W. W. &
ELTIS, L. D. 2007. A gene cluster encoding cholesterol catabolism in a soil
actinomycete provides insight into Mycobacterium tuberculosis survival in
macrophages. Proceedings of the National Academy of Sciences of the United
States of America, 104, 1947-1952.
VAN DEUN, A., SALIM, A. H., AUNG, K. J. M., HOSSAIN, M. A., CHAMBUGONJ, N., HYE, M. A., KAWRIA, A. & DECLERCQ, E. 2005. Performance of variations of carbolfuchsin staining of sputum smears for AFB under field conditions. International Journal of Tuberculosis and Lung Disease, 9, 1127-1133.
VANSOOLINGEN, D., QIAN, L. S., DEHAAS, P. E. W., DOUGLAS, J. T., TRAORE,
H., PORTAELS, F., QING, H. Z., ENKHSAIKAN, D., NYMADAWA, P. &
VANEMBDEN, J. D. A. 1995. Predominance of a Single Genotype of
Mycobacterium-Tuberculosis in Countries of East-Asia. Journal of Clinical
Microbiology, 33, 3234-3238.
VERCELLONE, A., NIGOU, J. & PUZO, G. 1998. Relationships between the Structure
and the Roles of Lipoarabinomannans and Related Glycoconjugates in
Tuberculosis Pathogenesis. Frontiers in Bioscience-Landmark, 3, E149-E163.
VERMA, M. & DAVIDSON, E. A. 1994. Canine U2 Snrna Gene - Nucleotide-
Sequence, Characterization and Implications in Rna Processing and Cancer
Biology. Cancer Biochemistry Biophysics, 14, 123-131.
VIA, L. E., LIN, L., RAY, S. M., CARRILLO, J., ALLEN, S. S., EUM, S. Y., TAYLOR, K.,
KLEIN, E., MANJUNATHA, U., GONZALES, J., LEE, E. G., PARK, S. K.,
RALEIGH, J. A., CHO, S. N., MCMURRAY, D. N., FLYNN, J. L. & BARRY, C.
E. 2008. Tuberculous granulomas are hypoxic in guinea pigs, rabbits, and
nonhuman primates. Infection and Immunity, 76, 2333-2340.
VIA, L. E., WEINER, D. M., SCHIMEL, D., LIN, P. L., DAYAO, E., TANKERSLEY, S.
L., CAI, Y., COLEMAN, M. T., TOMKO, J., PARIPATI, P., ORANDLE, M.,
KASTENMAYER, R. J., TARTAKOVSKY, M., ROSENTHAL, A., PORTEVIN,
D., EUM, S. Y., LAHOUAR, S., GAGNEUX, S., YOUNG, D. B., FLYNN, J. L. &
BARRY, C. E., 3RD 2013. Differential virulence and disease progression
following Mycobacterium tuberculosis complex infection of the common