Articles www.thelancet.comVol 378 July 2, 2011 31 Lancet2011; 378: 31–40 Published Online June 25, 2011 DOI:10.1016/S0140- 6736(11)60679-X See Comment page 3 *These authors contributed equally to the research and manuscript and are listed in alphabetical order †Members listed at end of paper Department of Epidemiology(G Danaei MD), Department of Biostatistics(M M Finucane PhD, C J Paciorek PhD), and Departmen t of Global Health and Population(Y Lu MSc, G M Singh PhD, J K Lin AB, F Farzadfar MD, M Rao BA),Harvard School of Public Health, Boston, MA, USA; Department of Chronic Diseases and Health Promotion(M J Cowan MPH, L M Riley MSc) and Department of Health Statistics and Informatics(G A Stevens DSc), World Health Organization , Geneva, Switzerland; Department of Statistics, University of California, Berkeley , CA, USA (C J Paciorek); Department of Preventive Medicine, Universit y of Ulsan College of Medicine, Seoul, South Korea(Prof Y-H Khang MD); Hubert Departmen t of Global Health, Emory University, Atlanta, GA, USA (M K Ali MBChB); School of Pharmacy, University of California, San Francisco, CA, USA(C A Robinson BSc);MRC-HPA Centre for Environment and Health, Imperial College, London, UK (Prof M Ezzati PhD); and Department of Epidemiology and Biostatistics, School of Public Health, Imperial College London, London, UK (Prof M Ezzati) National, regional, and global trends in fasting plasma glucose and diabetes prevalence since 1980: systematic analysis of health examination surveys and epidemiological studies with 370 country-years and 2·7 million participants Goodarz Danaei*, Mariel M Finucane*, Yuan Lu, Gitanjali M Singh, Melanie J Cowan, Christopher J Paciorek, John K Lin, Farshad Farzadfar, Young-Ho Khang, Gretchen A Stevens, Mayuree Rao, Mohammed K Ali, Leanne M Riley, Carolyn A Robinson, Majid Ezzati, on behalf of the Global Burden of Metabolic Risk Factors of Chronic Diseases Collaborating Group (Blood Glucose)† Summary BackgroundData for trends in glycaemia and diabetes prevalence are needed to understand the effects of diet and lifestyle within populations, assess the performance of interventions, and plan health services. No consistent and comparable global analysis of trends has been done. We estimated trends and their uncertainties in mean fasting plasma glucose (FPG) and diabetes prevalence for adults aged 25 years and older i n 199 countries and territories. MethodsWe obtained data from health examination surveys and epidemiological studies (370 country-years and 2·7 million participants). We converted systematically between different glycaemic metrics. For each sex, we used a Bayesian hierarchical model to estimate mean FPG and its uncertainty by age, country, and year, accounting for whether a study was nationally, subnationally, or community representative. FindingsIn 2008, global age-standardised mean FPG was 5·50 mmol/L (95% uncertainty interval 5·37–5·63) for men and 5·42 mmol/L (5·29–5·54) for women, having risen by 0·07 mmol/L and 0·09 mmol/L per decade, respectively. Age-standardised adult diabetes prevalence was 9·8% (8·6–11·2) in men and 9·2% (8·0–10·5) in women in 2008, up from 8·3% (6·5–10·4) and 7·5% (5·8–9·6) in 1980. The number of people with diabetes increased from 153 (127–182) million in 1980, to 347 (314–382) million in 2008. We recorded almost no change in mean FPG in east and southeast Asia and central and eastern Europe. Oceania had the largest rise, and the highest mean FPG (6·09 mmol/L, 5·73–6·49 for men; 6·08 mmol/L, 5·72–6·46 for women) and diabetes prevalence (15·5%, 11·6–20·1 for men; and 15·9%, 12·1–20·5 for women) in 2008. Mean FPG and diabetes prevalence in 2008 were also high in south Asia, Latin America and the Caribbean, and central Asia, north Africa, and the Middle East. Mean FPG in 2008 was lowest in sub- Saharan Africa, east and southeast Asia, and high-income Asia-Pacific. In high-income subregions, western Europe had the smallest rise, 0·07 mmol/L per decade for men and 0·03 mmol/L per decade for women; North America had the largest rise, 0·18 mmol/L per decade for men and 0·14 mmol/L per decade for women. InterpretationGlycaemia and diabetes are rising globally, driven both by population growth and ageing and by i ncreasing age-specific prevalences. Effective preventive interventions are needed, and health systems should prepare to detect and manage diabetes and its sequelae. FundingBill & Melinda Gates Foundation and WHO. Introduction Hyperglycaemia and diabetes are important causes of mortality and morbidity worldwide, through both direct clinical sequelae and increased mortality from cardiovascular and kidney diseases. 1–6 With rising overweight and obesity, 7 concern has risen about a global diabetes epidemic, with harmful effects on life expectancy and health-care costs. 8,9 A few studies have examined global patterns of glycaemia and diabetes, finding substantial variation between regions. 1,10–13 Others have assessed trends in specific countries. 14–24Findings from these studies have helped to show that hyperglycaemia and diabetes are important world- wide and regional issues, but these studies also have limitations. First, diabetes definitions have varied by expert committees and over time. 25–27 Most current studies have either used all definitions without adjustment for incomparabil ity , or selected one definition and excluded data based on other definitions. Second, these studies pooled national, subnational, and community data, regarding them as equally representative of countries’ population s. Third, some data included in these studies used random (non-fasting) glucose measurement; other data were from specific occupational groups, com- munities with high obesity prevalence, health-care facilities and practitioners, registries, or self-reported diabetes. These sources were probably biased because obesity is a risk factor for hyperglycaemia, occupational groups might differ from the general population in their
Transcript
8102019 Studiu Diabet Lancet
httpslidepdfcomreaderfullstudiu-diabet-lancet 110
Articles
wwwthelancetcom
Vol 378 July 2 2011 31
Lancet 2011 378 31ndash40
Published Online
June 25 2011DOI101016S0140-
6736(11)60679-X
See Comment page 3
These authors contributed
equally to the research and
manuscript and are listed in
alphabetical order
daggerMembers listed at end of paper
Department of Epidemiology
(G Danaei MD) Department
of Biostatistics
(M M Finucane PhD
C J Paciorek PhD) and
Department of Global Health
and Population (Y Lu MSc
G M Singh PhD J K Lin AB
F Farzadfar MD M Rao BA)
Harvard School of Public
Health Boston MA USA
Department of Chronic
Diseases and Health Promotion
(M J Cowan MPH L M Riley MSc)
and Department of Health
Statistics and Informatics
(G A Stevens DSc) World Health
Organization Geneva
Switzerland Department
of Statistics University of
California Berkeley CA USA
(C J Paciorek) Department
of Preventive Medicine
University of Ulsan College of
Medicine Seoul South Korea
(Prof Y-H Khang MD) Hubert
Department of Global Health
Emory University Atlanta GA
USA (M K Ali MBChB) School of
Pharmacy University of
California San Francisco CA
USA (C A Robinson BSc)
MRC-HPA Centre for
Environment and Health
Imperial College London UK
(Prof M Ezzati PhD) and
Department of Epidemiology
and Biostatistics School of
Public Health Imperial College
London London UK
(Prof M Ezzati)
National regional and global trends in fasting plasma
glucose and diabetes prevalence since 1980 systematicanalysis of health examination surveys and epidemiological
studies with 370 country-years and 2middot7 million participants
Goodarz Danaei Mariel M Finucane Yuan Lu Gitanjali M Singh Melanie J Cowan Christopher J Paciorek John K Lin Farshad Farzadfar
Young-Ho Khang Gretchen A Stevens Mayuree Rao Mohammed K Ali Leanne M Riley Carolyn A Robinson Majid Ezzati on behalf of the Global
Burden of Metabolic Risk Factors of Chronic Diseases Collaborating Group (Blood Glucose)dagger
SummaryBackground Data for trends in glycaemia and diabetes prevalence are needed to understand the effects of diet andlifestyle within populations assess the performance of interventions and plan health services No consistent and
comparable global analysis of trends has been done We estimated trends and their uncertainties in mean fastingplasma glucose (FPG) and diabetes prevalence for adults aged 25 years and older in 199 countries and territories
Methods We obtained data from health examination surveys and epidemiological studies (370 country-years and2middot7 million participants) We converted systematically between different glycaemic metrics For each sex we used aBayesian hierarchical model to estimate mean FPG and its uncertainty by age country and year accounting forwhether a study was nationally subnationally or community representative
Findings In 2008 global age-standardised mean FPG was 5middot50 mmolL (95 uncertainty interval 5middot37ndash5middot63) for menand 5middot42 mmolL (5middot29ndash5middot54) for women having risen by 0middot07 mmolL and 0middot09 mmolL per decade respectivelyAge-standardised adult diabetes prevalence was 9middot8 (8middot6ndash11middot2) in men and 9middot2 (8middot0ndash10middot5) in women in 2008 upfrom 8middot3 (6middot5ndash10middot4) and 7middot5 (5middot8ndash9middot6) in 1980 The number of people with diabetes increased from153 (127ndash182) million in 1980 to 347 (314ndash382) million in 2008 We recorded almost no change in mean FPG in east and
southeast Asia and central and eastern Europe Oceania had the largest rise and the highest mean FPG (6middot09 mmolL5middot73ndash6middot49 for men 6middot08 mmolL 5middot72ndash6middot46 for women) and diabetes prevalence (15middot5 11middot6ndash20middot1 for men and15middot9 12middot1ndash20middot5 for women) in 2008 Mean FPG and diabetes prevalence in 2008 were also high in south Asia LatinAmerica and the Caribbean and central Asia north Africa and the Middle East Mean FPG in 2008 was lowest in sub-Saharan Africa east and southeast Asia and high-income Asia-Pacific In high-income subregions western Europe hadthe smallest rise 0middot07 mmolL per decade for men and 0middot03 mmolL per decade for women North America had thelargest rise 0middot18 mmolL per decade for men and 0middot14 mmolL per decade for women
Interpretation Glycaemia and diabetes are rising globally driven both by population growth and ageing and by increasingage-specific prevalences Effective preventive interventions are needed and health systems should prepare to detect andmanage diabetes and its sequelae
Funding Bill amp Melinda Gates Foundation and WHO
IntroductionHyperglycaemia and diabetes are important causes ofmortality and morbidity worldwide through both directclinical sequelae and increased mortality fromcardiovascular and kidney diseases1ndash6 With risingoverweight and obesity7 concern has risen about aglobal diabetes epidemic with harmful effects on lifeexpectancy and health-care costs89 A few studies haveexamined global patterns of glycaemia and diabetesfinding substantial variation between regions110ndash13 Others have assessed trends in specific countries14ndash24 Findings from these studies have helped to show thathyperglycaemia and diabetes are important world-wide and regional issues but these studies alsohave limitations
First diabetes definitions have varied by expertcommittees and over time25ndash27 Most current studies haveeither used all definitions without adjustment forincomparability or selected one definition and excludeddata based on other definitions Second these studiespooled national subnational and community dataregarding them as equally representative of countriesrsquopopulations Third some data included in these studiesused random (non-fasting) glucose measurement otherdata were from specific occupational groups com-munities with high obesity prevalence health-carefacilities and practitioners registries or self-reporteddiabetes These sources were probably biased becauseobesity is a risk factor for hyperglycaemia occupationalgroups might differ from the general population in their
8102019 Studiu Diabet Lancet
httpslidepdfcomreaderfullstudiu-diabet-lancet 210
Articles
32 wwwthelancetcom
Vol 378 July 2 2011
Correspondence to
Prof Majid Ezzati MRC-HPA
Centre for Environment and
Health Department of
Epidemiology and Biostatistics
School of Public Health
Imperial College London Medical
Faculty Building St Maryrsquos
Campus Norfolk Place
London W2 1PG UK
majidezzatiimperialacuk
See Online for webappendix
health risks and some diabetes cases are undiag-
nosed
2829
Fourth previous analyses assigned estimatesto countries without data based on geographicalproximity and ad-hoc expert opinion about similarity tocountries with data without a formal analytical modelFifth these studies pooled data from different yearswithout adjustment for underlying trends Finally thesestudies did not account for all sources of uncertaintyincluding missing and older country data leading tooverly confident estimates
These shortcomings have hindered our ability tosystematically examine trends In recent years healthexamination surveys have measured different glycaemicindicators providing an opportunity to systematicallyassess trends by country We reviewed and accessed
unpublished and published studies and collatedcomprehensive data for different glycaemic metrics Weapplied statistical methods to systematically address
measurement comparability missing data non-linear
time trends age patterns and national versus subnationaland community representativeness With these dataand methods we estimated trends and associateduncertainties by country and region
MethodsStudy designWe estimated 1980ndash2008 trends in mean fasting plasmaglucose (FPG) and diabetes by sex for 199 countries andterritories in the 21 subregions of the Global Burden ofDiseases Injuries and Risk Factors study which them-selves are grouped into larger regions (webappendix p 6)
We used mean FPG rather than postprandial glucoseor haemoglobin A1c (HbA1c) as the primary measure of
glycaemia because it is used in many more population-based studies We report population mean because thereis a continuous association between FPG and cardio-vascular disease including at levels below clinicalthresholds for diabetes diagnosis23031 We report diabetesprevalence as a secondary outcome because it is clinicallyrelevant and because associations with microvascularoutcomes can have a threshold32ndash34 We used the AmericanDiabetes Association (ADA) definition for diabetes FPG7middot0 mmolL or greater diagnosis or use of a glucose-lowering drug25 Estimates for primary and secondaryoutcomes were informed by all available data sourceswith systematic conversion between glycaemic metricsand definitions
Our analysis of primary measure (mean FPG) includedthree steps (1) identification of data sources andaccessing and extracting of data (2) conversion of datathat were reported in other metrics to FPG and(3) application of statistical models to estimate trends inmean FPG by country and sex We analysed theuncertainty of estimates taking into account samplingerror and uncertainty from statistical modelling insteps 2 and 3
Data sourcesOur data sources were health examination surveys andepidemiological studies with data available to Collaborating
Group members multicentre studies published articlesand unpublished data identified through the WHO GlobalInfoBase Figure 1 and webappendix pp 2ndash3 providesdetails of data identification access and extractionDuplicate sources were identified by comparison of allstudies from the same country-year Data that were basedsolely on known or self-reported diabetes were excludedbecause some cases might be undiagnosed and lead tounderestimation of prevalence2829
Fasting and postprandial glucose in venous wholeblood and fasting glucose in capillary whole blood weremultiplied by 1middot11 to convert to equivalent plasmaglucose35 19 studies with postprandial glucose in capillarywhole blood were excluded because the relation withplasma glucose is highly variable36 For each data sourceFigure 983089 Flow diagram for data source identification and accessPPG=postprandial glucose
3355 articles identified inMedline and Embase
1638 articles excluded based on titleand abstract review
154 health surveys and epidemiological studies analysed by Collaborating
Group members representing203 country-years
1717 articles remaining afterexclusion based on titleand abstract review
607 articles excluded because of fulltext review or because they werebased on the same study asanother article 140 because wecould not retrieve the full text
and 53 because we could nottranslate the article
917 articles remaining afterexclusion based on full
text review
13 reports with 14 country-yearsreceived through personalcommunications
802 articles excluded because datawere not accessible by age andsex because the same data wereavailable from CollaboratingGroup members because they
used capillary PPG or because datawere not from one of the 199countries or territories in our study
Data extracted from128 published studiesrepresenting 153 country-years
14 additional country-years ofdata retrieved from WHOGlobal InfoBase
Data extracted from 370 country-years with 2middot7 million participants
8102019 Studiu Diabet Lancet
httpslidepdfcomreaderfullstudiu-diabet-lancet 310
Articles
wwwthelancetcom
Vol 378 July 2 2011 33
we recorded whether the data were national (separated
into weighted and unweighted) subnational (coveredmultiple communities provinces or states) or fromindividual communities (denoted study coveragehereafter) and whether the study population was ruralurban or both (webappendix pp 7ndash24) This informationwas used to account for potential bias and additionalvariability in data sources that were not representative oftheir national populations
Conversion between glycaemic metricsAlthough mean FPG was the most common metric in ourdata some sources reported mean postprandial glucose orHbA1c Further some published studies reported diabetesprevalence with varying definitions but not mean glucose
We used data sources that had mean FPG and othermetrics to develop regression models to estimate meanFPG The dependent variable in these cross-walkingregressions was mean FPG the independent variableswere mean postprandial glucose mean HbA1c or diabetesprevalence and age sex year of survey and whether thecountry was high income We developed a separateregression for each diabetes definition used in at least onepublished study Webappendix pp 4 and 25ndash30 providesmodel details and coeffi cients
We used a similar approach to estimate diabetesprevalence our secondary outcome from the estimatedmean FPG The dependent variable of this reverse cross-walking regression was the logit of prevalence (based onthe ADA definition) and the independent variables wereLn of mean FPG age sex as well as whether the countrywas high income The uncertainties of the prevalenceestimates included those of the estimated mean FPG anduncertainty associated with conversion of mean toprevalence Details of uncertainty analyses are providedelsewhere37 Webappendix p 31 provides the coeffi cientsof the regression
Methods for country mean FPG estimatesMany country-years had no data or no nationallyrepresentative data Further some studies covered onlysome age groups We developed a statistical model to
estimate mean FPG by age group country and yearseparately for men and women We used a Bayesianhierarchical model in which estimates for each age-country-year unit were informed by data from that unititself if available and by data from other units Specificmodel features are described briefly here with completedetails provided elsewhere37
We used a hierarchical model in which mean FPG valuesand trends in countries were nested in subregionalregional and global values and trends The hierarchicalmodel borrows information across countries subregionsand regions appropriately compromising between (overly)uncertain within-unit estimates and (overly) simplifiedaggregate cross-unit estimates it borrows informationto a greater degree when data are non-existent or
non-informative (ie have large uncertainty) and to a lesser
degree in data-rich countries subregions and regionsFPG trends over time were modelled as a linear trendplus a smooth non-linear trend at all levels Bothcomponents were modelled hierarchically Time varyingcountry-level covariates informed the estimates Thecovariates described in webappendix p 5 and elsewhere37 were national income (Ln per-head gross domesticproduct converted to international dollars in 1990)urbanisation (proportion of population that lived inurban areas) national availability of multiple food typesand age-standardised mean body-mass index (BMI)7
Subnational and community studies might system-atically differ from nationally representative ones becausethey might be undertaken in low-glucose or high-glucose
areas They might also have larger variation than nationalstudies Our model included offsets for subnational andcommunity data and additional variance componentsfor subnational and community data and for nationaldata without sample weights These variance componentswere estimated empirically and allowed national datawith sample weights to have more effect on estimatesthan other sources
Mean FPG might differ systematically between ruraland urban populations with the difference dependenton the countryrsquos level of urbanisation Therefore themodel included an offset for rural-only and urban-onlydata The offset was empirically estimated and wasweighted by the difference between study-level andcountry-level urbanisation
Mean FPG might be non-linearly associated with ageand the age association might flatten or decrease in olderages The age association might vary across countriesand might be steeper when mean FPG is higherTherefore we used a cubic spline age model withparameters estimated as a function of mean FPG at abaseline age
Mean FPG was estimated from the model for 5ndash10-yearage groups for adults aged 25 years and older Estimatesfor subregions regions and the world were calculated aspopulation-weighted averages of the constituent countryestimates by age group and sex For presentation
estimates for each country or region and year were age-standardised to the WHO reference population38
We quantified the following sources of uncertaintywith details provided elsewhere37 sampling uncertaintyin the original data sources uncertainty associated withfluctuations over time in national data because ofunmeasured study design factors (eg national datafrom the USA in webappendix pp 218 and 350) orbecause some surveys did not have sample weightsadditional uncertainty associated with data sources thatwere not national because of variation across com-munities in each country uncertainty associated withconversion of various glycaemic metrics to FPG(primary outcome) and between mean FPG and diabetesprevalence (secondary outcome) and uncertainty due
8102019 Studiu Diabet Lancet
httpslidepdfcomreaderfullstudiu-diabet-lancet 410
Articles
34 wwwthelancetcom
Vol 378 July 2 2011
to making estimates by age group country and yearwhen data were missing
As described in detail elsewhere37 we fitted the Bayesianmodel with the Markov chain Monte Carlo (MCMC)algorithm and obtained samples from the posteriordistribution of model parameters which were in turnused to obtain the posterior distribution of mean FPGThe uncertainty intervals reported represent the2middot5ndash97middot5 percentiles of the posterior distribution of
estimated means Change was estimated as lineartrend over the 29 years of analysis and is reported aschange per decade We also report the posterior probabilitythat an estimated increase or decrease represents atruly increasing or decreasing trend as opposed to achance observation
We report estimates for all country-years many ofwhich were without data We verified the externalpredictive validity of these (out-of-sample) estimates andtheir uncertainty intervals We divided the countries withdata into five non-overlapping groups of equal size suchthat each group contained a mix of countries with richdata (ge4 years of data) average density data (2ndash3 years ofdata) and poor data (1 year of data) Within each group ofcountries we withheld 10 of data sources For a specific
country we withheld either all the countryrsquos data(ie created the appearance of countries with no datawhen we actually had data) or all the countryrsquos 2000ndash09data (ie created the appearance of no recent data) or arandom third of the countryrsquos data Our goals were tomeasure how well we estimated FPG for countrieswithout data how well we estimated recent FPG forcountries without recent data and how well we filled inthe gaps for countries with intermittent data For each of
the five groups we fitted the model to the remaining 90of the dataset and made estimates of the withheldobservations We then examined whether the estimated95 uncertainty intervals around these estimates coveredthe withheld study means In a model with good externalpredictive validity 95 of withheld values would becovered by the uncertainty intervals We assessed externalpredictive validity for the full withheld dataset and forsubsets based on region age gross domestic productand urbanisation level and year of data
Role of the funding sourceThe sponsor of the study had no role in study designdata collection data analysis data interpretation orwriting of the report The Writing and Global Analysis
Figure 983090 Trends in age-standardised mean FPG by region between 1980 and 2008 for men (A) and women (B)
Webappendix pp 51ndash53 shows trends by subregion and webappendix pp 57ndash91 trends by country The solid line represents the posterior mean and the shaded area the uncertainty interval FPG=fasting
plasma glucose
High-income region of AustralasiaNorth America and western Europe
F P G ( m m o l L )
6
5middot5
5
4middot5
6middot5
F P G ( m m o l L )
6
5middot5
5
4middot5
6middot5
F P G ( m m o l L )
6
5middot5
5
4middot5
6middot5
F P G ( m m o l L )
6
5middot5
5
4middot5
6middot5
6
5middot5
5
4middot5
6middot5
6
5middot5
5
4middot5
6middot5
6
5middot5
5
4middot5
6middot5
6
5middot5
5
4middot5
6middot5
Central and eastern Europe region Sub-Saharan Africa region
Change=0middot12 mmolL per decade (0middot00 to 0middot24) Change=0middot03 mmolL per decade (ndash0middot28 to 0middot33) Change=0middot05 mmolL per decade (ndash0middot15 to 0middot24)
Central Asia and north Africa andMiddle East region
South Asia region East Asia and southeast Asia region
Change=0middot06 mmolL per decade (ndash0middot14 to 0middot27) Change=0middot16 mmolL per decade (ndash0middot10 to 0middot43) Change=ndash0middot01 mmolL per decade (ndash0middot16 to 0middot15)
Southern and tropical Latin Americaregion
Central and Andean Latin America andCaribbean region
High-income Asia-Pacific region
Change=0middot17 mmolL per decade (ndash0middot13 to 0middot48) Change=0middot08 mmolL per decade (ndash0middot12 to 0middot29) Change=0middot13 mmolL per decade (ndash0middot04 to 0middot30)
Oceania region World
Change=0middot22 mmolL per decade (ndash0middot02 to 0middot47) Change=0middot07 mmolL per decade (ndash0middot02 to 0middot15)
Year Year
1985 1995 2005 1985 1995 2005
Year
1985 1995 2005
High-income region of AustralasiaNorth America and western Europe
Central and eastern Europe region Sub-Saharan Africa region
Change=0middot08 mmolL per decade (ndash0middot04 to 0middot19) Change=0middot02 mmolL per decade (ndash0middot31 to 0middot34) Change=0middot13 mmolL per decade (ndash0middot07 to 0middot34)
Central Asia and north Africa andMiddle East region
South Asia region East Asia and southeast Asia region
Change=0middot16 mmolL per decade (ndash0middot04 to 0middot37) Change=0middot20 mmolL per decade (ndash0middot06 to 0middot47) Change=0middot02 mmolL per decade (ndash0middot13 to 0middot17)
Southern and tropical Latin Americaregion
Central and Andean Latin America andCaribbean region
High-income Asia-Pacific region
Change=0middot13 mmolL per decade (ndash0middot17 to 0middot42) Change=0middot13 mmolL per decade (ndash0middot08 to 0middot33) Change=0middot08 mmolL per decade (ndash0middot09 to 0middot25)
Oceania region World
Change=0middot32 mmolL per decade (0middot08 to 0middot55) Change=0middot09 mmolL per decade (0middot00 to 0middot17)
Year Year
1985 1995 2005 1985 1995 2005
Year
1985 1995 2005
A Men B Women
8102019 Studiu Diabet Lancet
httpslidepdfcomreaderfullstudiu-diabet-lancet 510
Articles
wwwthelancetcom
Vol 378 July 2 2011 35
Group had access to all data sources and has responsibilityfor the decision to submit for publication
ResultsOur final dataset included 370 country-years with2middot7 million participants (figure 1) Of the includedstudies 71 had reported mean FPG or diabetesprevalence based on FPG with others using postprandialglucose or HbA1c (webappendix pp 7ndash24) 128 country-years were from 22 high-income countries and 242 from
85 low-income and middle-income countries Japan hadthe most nationally representative data with 8 years ofnational data since 1980 followed by the USA andSingapore (webappendix pp 46ndash48) We could not identifyany population-based data for 92 countries Central Asiacentral and eastern Europe and sub-Saharan Africa hadthe largest proportion of countries without data(webappendix pp 49ndash50) National surveys contributed29 of all data subnational studies 19 and communitystudies 52 (webappendix pp 49ndash50)
Globally age-standardised mean FPG was5middot50 mmolL (95 uncertainty interval 5middot37ndash5middot63) foradult men and 5middot42 mmolL (5middot29ndash5middot54) for womenin 2008 (figure 2) having risen by an estimated0middot07 mmolL per decade (ndash0middot02 to 0middot15 posterior
probability of the observed increase being a trueincrease=0middot94) for men and 0middot09 mmolL per decade(0middot00ndash0middot17 posterior probability=0middot98) for womensince 1980 Age-standardised prevalence of diabetes was9middot8 (8middot6ndash11middot2) in men and 9middot2 (8middot0ndash10middot5) inwomen in 2008 (figure 3) leading to an estimated173 (151ndash197) million men and 173 (151ndash197) millionwomen with diabetes 40 (about 138 million) of peoplewith diabetes were from China and India 10 (about36 million) from the USA and Russia and 12 (about
42 million) from Brazil Pakistan Indonesia Japan andMexico In 1980 age-standardised prevalence was 8middot3(6middot5ndash10middot4) in adult men and 7middot5 (5middot8ndash9middot6) in womenyielding 77 (60ndash97) million men and 76 (58ndash97) millionwomen with diabetes Of the nearly 194 millionadditional cases of diabetes between 1980 and 200870 (52ndash98) were attributable to population growth andageing and the other 30 (2ndash48) to a rise in age-specificprevalences Across regions the epidemiological shareof the change ranged from ndash2 in east and southeastAsia to 60 in Oceania (data not shown)
In 2008 mean FPG in men was lowest in sub-SaharanAfrica (5middot27 mmolL 4middot96ndash5middot58) followed by east andsoutheast Asia and high-income Asia-Pacific (figure 2)Women in high-income Asia-Pacific had the lowest mean
Figure 983091 Trends in age-standardised diabetes prevalence by region between 1980 and 2008 for men (A) and women (B)
Webappendix pp 54ndash56 shows trends by subregion
High-income region of AustralasiaNorth America and western Europe
D i a b e t e s p r e v a l e n c e ( )
16
12
8
4
20
D i a b e t e s p r e v a l e n c e ( )
16
12
8
4
20
D i a b e t e s p r e v a l e n c e ( )
16
12
8
4
20
D i a b e t e s p r e v a l e n c e ( )
16
12
8
4
20
16
12
8
4
20
16
12
8
4
20
16
12
8
4
20
16
12
8
4
20
Central and eastern Europe region Sub-Saharan Africa region
Central Asia and north Africa andMiddle East region
South Asia region East Asia and southeast Asia region
Southern and tropical Latin Americaregion Central and Andean Latin America andCaribbean region High-income Asia-Pacific region
Oceania region World
Year Year
1985 1995 2005 1985 1995 2005
Year
1985 1995 2005
High-income region of AustralasiaNorth America and western Europe
Central and eastern Europe region Sub-Saharan Africa region
Central Asia and north Africa andMiddle East region
South Asia region East Asia and southeast Asia region
Southern and tropical Latin Americaregion Central and Andean Latin America andCaribbean region High-income Asia-Pacific region
Oceania region World
Year Year
1985 1995 2005 1985 1995 2005
Year
1985 1995 2005
A Men B Women
8102019 Studiu Diabet Lancet
httpslidepdfcomreaderfullstudiu-diabet-lancet 610
Articles
36 wwwthelancetcom
Vol 378 July 2 2011
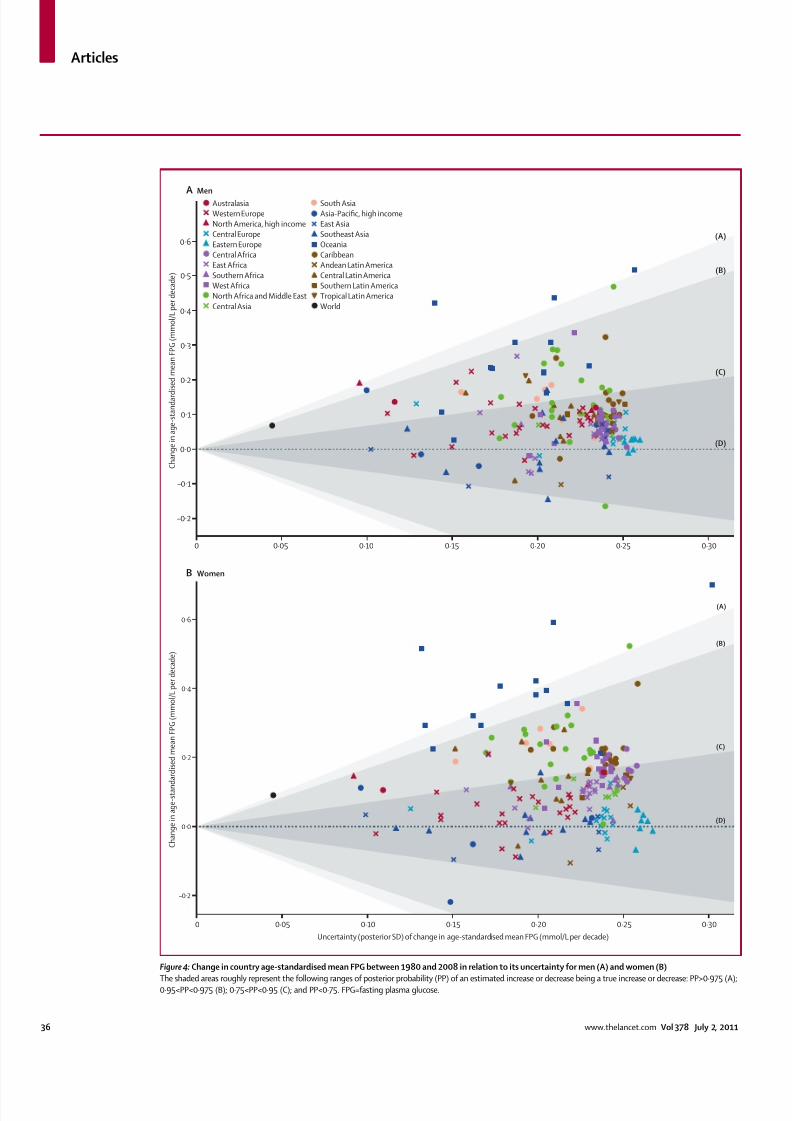
Figure 983092 Change in country age-standardised mean FPG between 1980 and 2008 in relation to its uncertainty for men (A) and women (B)
The shaded areas roughly represent the following ranges of posterior probability (PP) of an estimated increase or decrease being a true increase or decrease PPgt0middot975 (A)0middot95ltPPlt0middot975 (B) 0middot75ltPPlt0middot95 (C) and PPlt0middot75 FPG=fasting plasma glucose
i s e d m e a n F P G ( m m o l L p e r d e c a d e )
C h a n g e i n a g e - s t a n d a r d i s e d m e a n F P G ( m m o l L p e r d e c a d e )
AustralasiaWestern EuropeNorth America high incomeCentral EuropeEastern EuropeCentral AfricaEast AfricaSouthern AfricaWest AfricaNorth Africa and Middle East
Central Asia
South AsiaAsia-Pacific high incomeEast AsiaSoutheast AsiaOceaniaCaribbeanAndean Latin AmericaCentral Latin AmericaSouthern Latin AmericaTropical Latin America
Uncertainty (posterior SD) of change in age-standardised mean FPG (mmolL per decade)
(D)
(C)
(B)
(A)
B Women
8102019 Studiu Diabet Lancet
httpslidepdfcomreaderfullstudiu-diabet-lancet 710
Articles
wwwthelancetcom
Vol 378 July 2 2011 37
FPG (5middot17 mmolL 4middot94ndash5middot39) followed by sub-Saharan
Africa and east and southeast Asia (figure 2) Oceaniahad the highest mean FPG and diabetes prevalence ofany region in 2008 for both men (6middot09 mmolL5middot73ndash6middot49 and 15middot5 11middot6ndash20middot1) and for women(6middot08 mmolL 5middot72ndash6middot46 and 15middot9 12middot1ndash20middot5) MeanFPG and diabetes prevalence were also high for bothsexes in south Asia Latin America and the Caribbeanand a region consisting of central Asia north Africa andthe Middle East (figure 2 and figure 3) Men in the high-income region consisting of Australasia North Americaand western Europe also had relatively high FPG anddiabetes prevalence (figure 2 and figure 3) In high-income subregions mean FPG and diabetes were lowerin Asia-Pacific and western Europe than in Australasia
and north America with the difference between thehighest and lowest means and prevalences about0middot4 mmolL and 4ndash5 percentage points respectively(webappendix pp 51ndash56)
With few exceptions countries with the highest FPGand diabetes prevalence in 2008 were in Oceania northAfrica and the Middle East and the Caribbean with age-standardised mean FPG 6middot5 mmolL or higher in theMarshall Islands Kiribati Saudi Arabia the Cook Islandsand Samoa in both sexes (figure appendix 1) age-standardised diabetes prevalence in these countriesranged 21ndash25 in men and 21ndash32 in women (figureappendix 2) Countries in southeast Asia east Africa andAndean Latin America had the lowest mean FPG in 2008(as low as 5 mmolL or less figure appendix 1) Of high-income countries mean FPG and diabetes were highestin the USA Greenland Malta New Zealand and Spainand lowest in the Netherlands and Austria for both sexesand in France for women (figure appendix 1) Mean FPGin these western European countries was lower than inJapan and South Korea despite having higher BMIs7
FPG increased or at best remained unchanged inalmost every region between 1980 and 2008 (figure 2)FPG increased the most in Oceania by 0middot22 mmolL perdecade (ndash0middot02 to 0middot47 posterior probability=0middot97) in menand 0middot32 mmolL per decade (0middot08ndash0middot55 posteriorprobability gt0middot99) in women This rise led to an estimated
increase in age-standardised diabetes prevalence of5middot9 percentage points for men and 7middot8 percentage pointsfor women in this region (figure 3) Large increases inmean FPG were also recorded in southern and tropicalLatin America and south Asia for men and in south Asiaand the combined region of central Asia north Africaand the Middle East for women (all gt0middot15 mmolL perdecade posterior probabilities ge0middot87) In men andwomen we recorded almost no change in mean FPG ineast and southeast Asia and in central and eastern Europeduring these 28 years (figure 2) Male FPG trend in sub-Saharan Africa was indistinguishable from no change(posterior probability=0middot69) but women had an increaseof 0middot13 mmolL per decade (ndash0middot07 to 0middot34 posteriorprobability=0middot91) In high-income subregions FPG
increased the least in western Europe by 0middot07 mmolL
per decade (ndash0middot08 to 0middot21 posterior probability=0middot82) inmen and by 0middot03 mmolL per decade (ndash0middot13 to 0middot18posterior probability=0middot63) in women which was statis-tically indistinguishable from no change Conversely inhigh-income North America FPG rose by 0middot18 mmolLper decade (0middot00ndash0middot36 posterior probability=0middot98) inmen and 0middot14 mmolL per decade (ndash0middot03 to 0middot31posterior probability=0middot94) in women
Apart from women in Singapore for whom mean FPGdecreased by 0middot21 mmolL per decade (ndash0middot06 to 0middot51posterior probability=0middot92) no country had a meaningfulfall in FPG the few countries with apparent decreaseshad posterior probabilities of 0middot80 or less and hence werestatistically indistinguishable from flat trends (figure 4)
Countries with flat trends were in east and southeastAsia sub-Saharan Africa Andean and central LatinAmerica high-income Asia-Pacific and especially forwomen in Europe (figure 4) Countries in Oceania andNorth Africa and the Middle East had the largest increasein mean FPG by 0middot5 mmolL per decade or more in theMarshall Islands Samoa Kiribati and Saudi Arabia
Our model did well in external predictive validity testsSpecifically the 95 uncertainty intervals of our modelpredictions included 95 of withheld study means forwomen and 96 for men (webappendix p 45) Our modelalso had good predictive validity in most regions and byyear of data gross domestic product and age groupWhen we excluded all data for some countries (ie createdthe appearance of no data when data were available) theuncertainty intervals of model predictions included 96of the female study means that were known but excludedand 98 of the male study means Although data weresparse early in our analysis period our model covered99 of withheld values from 1980 to 1995 suggestingthat our uncertainty estimates were slightly conservativewhen data were scarce
DiscussionOur systematic analysis shows that glycaemia anddiabetes are a rising global hazard with the number ofadults with diabetes having more than doubled over
nearly three decades Although population growth andageing are important contributors to this increase thereis also an important epidemiological component withage-standardised global mean FPG having increased by0middot07 mmolL per decade or more
Our estimate of 347 (314ndash382) million adults withdiabetes is higher than Shaw and colleaguesrsquo estimate of285 million for 2010 (panel)13 The differences betweenthe estimates could be explained by the inclusion andexclusion criteria and the number of studies useddifferent age ranges of estimates or different methodsto deal with missing data year of data rural and urbandata and national versus subnational and communitydata Recent narrative reviews have stated that diabetesis rising in Asia and Africa without addressing whether
8102019 Studiu Diabet Lancet
httpslidepdfcomreaderfullstudiu-diabet-lancet 810
Articles
38 wwwthelancetcom
Vol 378 July 2 2011
the data were representative whether age groups werethe same in the included studies and other aspects ofdata comparability2039ndash41 We screened all data sourcesused in these overviews and used additional sources
Although we generally recorded increasing mean FPGand diabetes prevalence our quantitative results are notcomparable with the previous reports because we hadused a larger number of studies and different methodsNotably with use of national studies from China TaiwanThailand Malaysia Cambodia and the Philippines inaddition to multiple subnational and community studieswe noted no increase in age-standardised diabetesprevalence in east and southeast Asia although ageingand population growth led to an increase in the numberof people with diabetes
The strengths and innovations of this study includeanalysis of trends the large amount of data accessed andused systematic conversion between different metrics ofglycaemia and definitions of diabetes application of a
Bayesian hierarchical model to estimate mean FPG
which included non-linear time trends and ageassociations and used national income urbanisationfood availability and BMI as covariates incorporation ofstudy coverage as offset and variance components andsystematic analysis and reporting of uncertainty Coverage-specific offsets and variances allowed our estimates to useall available data and to follow data from nationallyrepresentative studies more closely Coverage-specificvariance components were larger for less representativedata sources which led to larger uncertainty when we didnot have nationally representative data thus representingthe true availability of information
The main limitation of our study is that despiteextensive data seeking many country-years still did not
have data especially in the 1980s and in some low-income and middle-income countries The absence ofdata is reflected in wider uncertainty intervals Ourexternal predictive validity assessment showed that theestimates and their uncertainty intervals are validimportantly applications of our results should use thefull uncertainty intervals Further we noted substantialincomparability in metrics of glycaemia in publisheddata Specifically we had data for mean postprandialglucose mean HbA1c and diabetes prevalence using18 different definitions Although we systematicallyconverted between different glycaemia metrics theconversions led to increases in uncertainty intervalsSimilarly to estimate diabetes prevalence we relied onmean FPG as an intermediate step for conversionbetween different metrics and for handling of missingdata The association between mean and prevalencecould vary between countries beyond what is measuredby variables in webappendix p 31mdasheg because of vari-ations in quality of care Such variability is shown bylarger uncertainty in our prevalence estimates than theuncertainty of mean FPG The persistent incomparabilityof glycaemic metrics is partly because definitions forclinical purposes are the subject of continuous debateresearch and refinement Population-based surveillancehowever needs indicators that are easy to measure andare comparable across populations and over time
Although we incorporated information about studycoverage into our model and excluded studies based onrandom (non-fasting) blood glucose other qualityindicatorsmdashsuch as duration of fasting laboratorymethods calibration and other sources of interassayand intra-assay variabilitymdashwere not included in themodel potentially accounting for some of the uncertaintyin our estimates
As important as the global rise were the similaritiesand differences between regions and countries Trendsranged from nearly flat in some regions to a rise of0middot2ndash0middot3 mmolL per decade in Oceania This variation isundoubtedly partly attributable to regional BMI trends7 the correlation between change in BMI and FPG acrossthe 21 subregions was 0middot71 for women and 0middot57 for men
Panel Research in context
Systematic review
A few studies have examined global patterns of glycaemia and diabetes but have not
estimated past trends for all countries and regions Other studies have assessed trends in
specific countries or regions A recent publication estimated that there were 285 million
people with diabetes worldwide in 201013 but some of the data were from specific
occupational groups communities with high obesity prevalence or health-care facilities and
practitioners registries and self-reported diabetes Recent narrative reviews2039ndash41 have
stated that diabetes is rising in Asia and Africa without addressing incomparable age groups
in the studies included and other aspects of data comparability Previous studies (including
one by some members of our study group1) also had not distinguished between data that
are nationally representative and those that are subnational or from specific communities
We obtained data for the levels of different glycaemic metrics from the following sources
health examination surveys and epidemiological studies with anonymised data available to
the Collaborating Group members multicentre studies review of published articles andunpublished data sources identified through the WHO Global InfoBase Our final dataset
included 370 country-years with 2middot7 million participants We could not identify any
population-based data for 92 countries We had data for mean fasting and postprandial
glucose mean HbA1c and diabetes prevalence with use of 18 different definitions We
systematically converted between different glycaemic metrics based on data sources that
had measured multiple metrics
Interpretation
Our estimate of 347 (uncertainty interval 314ndash382) million adults with diabetes in 2008 is
higher than the previous 285 million estimate for 201013 The differences between the
estimates could be due to the inclusion and exclusion criteria and the number of studies
used different age ranges of estimates or different methods of handling missing data
differences in year of data rural and urban data and national versus subnational and
community data Although we generally found increasing mean fasting plasma glucose anddiabetes prevalence our quantitative results are not comparable with the previous reports
because we had used a larger number of studies and different methods Notably with use of
national studies from China Taiwan Thailand Malaysia Cambodia and the Philippines and
multiple subnational and community studies we recorded no increase in age-standardised
diabetes prevalence in east and southeast Asia although ageing and population growth led
to an increase in the number of people with diabetes in these regions
8102019 Studiu Diabet Lancet
httpslidepdfcomreaderfullstudiu-diabet-lancet 910
Articles
wwwthelancetcom
Vol 378 July 2 2011 39
However genetic factors associated with ethnic origin
fetal and early life nutritional status diet quality andphysical activity might also affect glycaemic values andtrends Notably men in south Asia had the secondsmallest change in BMI (almost zero) of the 21 subregions7 but the sixth highest rise in mean FPG women in thisregion had the fourth smallest BMI change (0middot4 kgmsup2per decade) but the sixth largest rise in FPG about thesame as in high-income North America where femaleBMI rose three times as much7
The global and regional trends in mean FPG differfrom those of other metabolic risksmdashnamely systolicblood pressure which decreased globally and in mostsubregions37 and total cholesterol which decreased inAustralasia Europe and North America but rose in east
and southeast Asia and Asia-Pacific leading to relativelyunchanged global mean42 Because high BMI is a riskfactor for all three metabolic indicators these differencesprobably arise from other determinants including dietarycomposition and medical treatment Specificallyalthough effective drugs to lower blood pressure andcholesterol are increasingly used for primary preventionof cardiovascular disease in high-income countries theuse of specific drugs for primary prevention and thetargets and intensity of glycaemic management are stillbeing investigated43 Therefore primary prevention ofdysglycaemia will need weight control physical activityand improved diet quality Such interventions are diffi cultto implement within populations and will not affectdiabetes incidence in the short term Therefore healthsystems in most countries will inevitably have to developprogrammes to improve detection and management ofdiabetes to slow progression to microvascular andmacrovascular complications
Contributors
GD and ME developed the study concept GD YL MR and CARundertook reviews of published studies and managed databases JKLMJC GMS YL Y-HK and members of Country Data Group analysedhealth examination survey and epidemiological study data MMF andCJP developed the Bayesian statistical model with input from GD andME MMF YL GMS JKL and GD analysed databases and preparedresults GD and ME wrote the first draft of the report Other members ofthe Writing and Global Analysis Group contributed to study designanalysis and writing of report ME GD and CJP oversaw the research
ME is the study guarantor for this report
Global Burden of Metabolic Risk Factors of Chronic Diseases Collaborating
Group (Blood Glucose)
Writing and Global Analysis Group Goodarz Danaei Mariel M FinucaneYuan Lu Gitanjali M Singh Melanie J Cowan Christopher J PaciorekJohn K Lin Farshad Farzadfar Young-Ho Khang Gretchen A StevensMayuree Rao Mohammad K Ali Leanne M Riley Carolyn A RobinsonMajid Ezzati These authors contributed equally to the research andmanuscript and are listed in alphabetical orderCountry Data Group Ziad Abdeen Wichai Aekplakorn Mustafa M AfifiEnrico Agabiti-Rosei Carlos A Aguilar Salinas Mohannad AlnsourRamachandran Ambady Carlo M Barbagallo Alberto BarceloacuteHenrique Barros Leonelo E Bautista Athanase BenetosPeter Bjerregaard Simona Bo Pascal Bovet Michael BursztynAntonio Cabrera de Leoacuten Maurizio Castellano Katia CastetbonNoureddine Chaouki Chien-Jen Chen Lily Chua Renata Ciacutefkovaacute
Anna Maria Corsi Elias Delgado Yasufumi Doi Alireza EsteghamatiCaroline H D Fall Jian-Gao Fan Catterina Ferreccio Leopold Fezeu
Eva L Fuller Simona Giampaoli Luis F GoacutemezRamiro Guerrero Carvajal William H Herman Victor M Herrera
Suzanne Ho Akhtar Hussain Nayu Ikeda Tazeen H JafarJost B Jonas Othman A Kadiki Ioannis Karalis Joanne KatzOmid Khalilzadeh Stefan Kiechl Pawel Kurjata Jeannette LeeJeannette Lee Stephen Lim TO Lim Cheng-Chieh Lin Xu LinHsien-Ho Lin Xiaoqing Liu Roberto Lorbeer Stefan MaStefania Maggi Dianna J Magliano Norma McFarlane-AndersonJuhani Miettola J Jaime Miranda Mostafa K Mohamed V MohanAli Mokdad Dante D Morales Iraj Nabipour Tomoko NakagamiVinay Nangia Hannelore Neuhauser Marianna Noale Altan OnatMyriam Oroacutestegui Demosthenes B Panagiotakos Valeria M A PassosCynthia Peacuterez Rafael Pichardo Hwee Pin Phua Pedro PlansQing Qiao Luiz R Ramos Sanjay Rampal Lekhraj RampalJosep Redon Luis Revilla Luis Rosero-Bixby Selim Y SanisogluMarcia Scazufca Beatriz D Schaan Cevad Sekuri Abdul S SheraZumin Shi Egleacute Silva Leon A Simons Stefan SoumlderbergVincenzo Solfrizzi Ahmet Soysal Aryeh D Stein Jochanan StessmanMark P Vanderpump Lucie Viet Peter Vollenweider Ningli Wang
Ya X Wang Sarwono Waspadji Johann Willeit Mark WoodwardLiang Xu Xiaoguang Yang Jin-Sang Yoon Zhijie Yu Jian ZhangLei Zhang
Conflicts of interest
CJP holds stock in Pfizer JKL holds stock in Johnson amp JohnsonME has chaired a session at the World Cardiology Congress which wassupported by the organiser All other authors declare that they have noconflicts of interest
Acknowledgments
This work was undertaken as a part of the Global Burden of DiseasesInjuries and Risk Factors study The results in this paper are preparedindependently of the final estimates of the Global Burden of DiseasesInjuries and Risk Factors study Partial funding was provided by WHOWe thank Mara Horwitz and Wenfan Yu for research assistance andAbigail Donner for research coordination MJC GAS and LMR are staffmembers of WHO The authors alone are responsible for the views
expressed in this publication and they do no necessarily represent thedecisions policy or views of WHO
References1 Danaei G Lawes CMM Vander Hoorn S Murray CJ Ezzati M
Global and regional mortality from ischaemic heart disease andstroke attributable to higher-than-optimum blood glucoseconcentration comparative risk assessment Lancet 2006 368 1651ndash59
2 Lawes CM Parag V Bennett DA et al Blood glucose and risk ofcardiovascular disease in the Asia Pacific region Diabetes Care 200427 2836ndash42
3 The DECODE study group on behalf of the European DiabetesEpidemiology Group Glucose tolerance and mortality comparisonof WHO and American Diabetes Association diagnostic criteriaLancet 1999 354 617ndash21
4 Nakagami T Hyperglycaemia and mortality from all causes andfrom cardiovascular disease in five populations of Asian origin
Diabetologia 2004 47 385ndash945 Khaw KT Wareham N Bingham S Luben R Welch A Day N
Association of hemoglobin A1c with cardiovascular disease andmortality in adults the European prospective investigation intocancer in Norfolk Ann Intern Med 2004 141 413ndash20
6 Klein R Hyperglycemia and microvascular and macrovasculardisease in diabetes Diabetes Care 1995 18 258ndash68
7 Finucane MM Stevens GA Cowan MJ et al on behalf of theGlobal Burden of Metabolic Risk Factors of Chronic DiseasesCollaborating Group (Body Mass Index) National regional andglobal trends in body-mass index since 1980 systematic analysisof health examination surveys and epidemiological studies with960 country-years and 9middot1 million participants Lancet 2011377 557ndash67
8 Abegunde DO Mathers CD Adam T Ortegon M Strong KThe burden and costs of chronic diseases in low-income andmiddle-income countries Lancet 2007 370 1929ndash38
9 Zimmet P Alberti KG Shaw J Global and societal implications
of the diabetes epidemic Nature 2001 414 782ndash87
10 Wild S Roglic G Green A Sicree R King H Global prevalenceof diabetes estimates for the year 2000 and projections for 2030
Diabetes Care 2004 27 1047ndash5311 King H Aubert RE Herman WH Global burden of diabetes
1995ndash2025 prevalence numerical estimates and projectionsDiabetes Care 1998 21 1414ndash31
12 Amos AF McCarty DJ Zimmet P The rising global burden ofdiabetes and its complications estimates and projections to theyear 2010 Diabet Med 1997 14 (suppl 5) S1ndash85
13 Shaw JE Sicree RA Zimmet PZ Global estimates of the prevalenceof diabetes for 2010 and 2030 Diabetes Res Clin Pract 2009 87 4ndash14
14 Nagata M Ninomiya T Doi Y et al Trends in the prevalence ofchronic kidney disease and its risk factors in a general Japanesepopulation the Hisayama Study Nephrol Dial Transplant 201025 2557ndash64
15 Berger B Stenstrom G Sundkvist G Incidence prevalenceand mortality of diabetes in a large population A report fromthe Skaraborg Diabetes Registry Diabetes Care 1999 22 773ndash78
16 Gatling W Budd S Walters D Mullee MA Goddard JR Hill RD
Evidence of an increasing prevalence of diagnosed diabetes mellitusin the Poole area from 1983 to 1996 Diabet Med 1998 15 1015ndash21
17 Dunstan DW Zimmet PZ Welborn TA et al The rising prevalenceof diabetes and impaired glucose tolerance the Australian DiabetesObesity and Lifestyle Study Diabetes Care 2002 25 829ndash34
18 Gregg EW Cheng YJ Cadwell BL et al Secular trends incardiovascular disease risk factors according to body mass indexin US adults JAMA 2005 293 1868ndash74
19 Lusignan S Sismanidis C Carey IM DeWilde S Richards NCook DG Trends in the prevalence and management of diagnosedtype 2 diabetes 1994ndash2001 in England and Wales BMC Fam Pract 2005 6 13
20 Chan JC Malik V Jia W et al Diabetes in Asia epidemiology riskfactors and pathophysiology JAMA 2009 301 2129ndash40
21 Venketasubramanian N Trends in cerebrovascular disease mortalityin Singapore 1970ndash1994 Int J Epidemiol 1998 27 15ndash19
22 Bovet P Romain S Shamlaye C et al Divergent fifteen-year trendsin traditional and cardiometabolic risk factors of cardiovascular
diseases in the Seychelles Cardiovasc Diabetol 2009 8 3423 Bjorkelund C Andersson-Hange D Andersson K et al Secular
trends in cardiovascular risk factors with a 36-year perspectiveobservations from 38- and 50-year-ol ds in the Population Study ofWomen in Gothenburg Scand J Prim Health Care 2008 26 140ndash46
24 Cowie CC Rust KF Ford ES et al Full accounting of diabetes andpre-diabetes in the US population in 1988ndash1994 and 2005ndash2006Diabetes Care 2009 32 287ndash94
25 Report of the expert committee on the diagnosis and classificationof diabetes mellitus Diabetes Care 2003 26 (suppl 1) S5ndash20
26 International Expert Committee International Expert Committeereport on the role of the A1C assay in the diagnosis of diabetesDiabetes Care 2009 32 1327ndash34
27 American Diabetes A Standards of medical care in diabetes 2011Diabetes Care 2011 34 (suppl 1) S11ndash61
28 Danaei G Friedman AB Oza S Murray CJ Ezzati M Diabetesprevalence and diagnosis in US states analysis of health surveys
Popul Health Metr 2009 7 1629 Gakidou E Mallinger L Abbott-Klafter J et al Managementof diabetes and associated cardiovascular risk factors in sevencountries a comparison of data from national health examinationsurveys Bull World Health Organ 2011 89 172ndash83
30 Gerstein HC Glucose a continuous risk factor for cardiovasculardisease Diabet Med 1997 14 (suppl 3) S25ndash31
31 Is fasting glucose suffi cient to define diabetes Epidemiological datafrom 20 European studies The DECODE-study group EuropeanDiabetes Epidemiology Group Diabetes EpidemiologyCollaborative analysis of Diagnostic Criteria in Europe Diabetologia 1999 42 647ndash54
32 Engelgau MM Thompson TJ Herman WH et al Comparisonof fasting and 2-hour glucose and HbA1c levels for diagnosingdiabetes Diagnostic criteria and performance revisitedDiabetes Care 1997 20 785ndash91
33 McCance DR Hanson RL Charles MA et al Comparison of testsfor glycated haemoglobin and fasting and two hour plasma glucoseconcentrations as diagnostic methods for diabetes BMJ 1994308 1323ndash28
34 Ohkubo Y Kishikawa H Araki E et al Intensive insulin therapyprevents the progression of diabetic microvascular complicationsin Japanese patients with non-insulin-dependent diabetes mellitusa randomized prospective 6-year study Diabetes Res Clin Pract 199528 103ndash17
35 Sacks DB Bruns DE Goldstein DE Maclaren NK McDonald JMParrott M Guidelines and recommendations for laboratory analysisin the diagnosis and management of diabetes mellitus Clin Chem 2002 48 436ndash72
36 Carstensen B Lindstrom J Sundvall J Borch-Johnsen KTuomilehto J Measurement of blood glucose comparison betweendifferent types of specimens Ann Clin Biochem 2008 45 140ndash48
37 Danaei G Finucane MM Lin JK et al on behalf of the GlobalBurden of Metabolic Risk Factors of Chronic Diseases CollaboratingGroup (Blood Pressure) National regional and global trends insystolic blood pressure since 1980 systematic analysis of healthexamination surveys and epidemiological studies with786 country-years and 5middot4 million participants Lancet 2011377 568ndash77
38 Ahmad O Boschi-Pinto C Lopez A Murray C Lozano R Inoue MAge standardization of rates a new WHO standard Geneva WorldHealth Organization 2001
39 Ramachandran A Ma RCW Snehalatha C Diabetes in Asia Lancet 2010 375 408ndash18
40 Mbanya JCN Motala AA Sobngwi E Assah FK Enoru ST Diabetesin sub-Saharan Africa Lancet 2010 375 2254ndash66
41 Abubakari AR Lauder W Jones MC Kirk A Agyemang CBhopal RS Prevalence and time trends in diabetes and physicalinactivity among adult West African populations the epidemic hasarrived Public Health 2009 123 602ndash14
42 Farzadfar F Finucane MM Danaei G et al on behalf of the GlobalBurden of Metabolic Risk Factors of Chronic Diseases CollaboratingGroup (Cholesterol) National regional and global trends in serumtotal cholesterol since 1980 systematic analysis of healthexamination surveys and epidemiological studies with321 country-years and 3middot0 million participants Lancet 2011 377 578ndash86
43 Skyler JS Bergenstal R Bonow RO et al Intensive glycemic controland the prevention of cardiovascular events implications of theACCORD ADVANCE and VA diabetes trials a position statement
of the American Diabetes Association and a scientific statement ofthe American College of Cardiology Foundation and the AmericanHeart Association Circulation 2009 119 351ndash57
8102019 Studiu Diabet Lancet
httpslidepdfcomreaderfullstudiu-diabet-lancet 210
Articles
32 wwwthelancetcom
Vol 378 July 2 2011
Correspondence to
Prof Majid Ezzati MRC-HPA
Centre for Environment and
Health Department of
Epidemiology and Biostatistics
School of Public Health
Imperial College London Medical
Faculty Building St Maryrsquos
Campus Norfolk Place
London W2 1PG UK
majidezzatiimperialacuk
See Online for webappendix
health risks and some diabetes cases are undiag-
nosed
2829
Fourth previous analyses assigned estimatesto countries without data based on geographicalproximity and ad-hoc expert opinion about similarity tocountries with data without a formal analytical modelFifth these studies pooled data from different yearswithout adjustment for underlying trends Finally thesestudies did not account for all sources of uncertaintyincluding missing and older country data leading tooverly confident estimates
These shortcomings have hindered our ability tosystematically examine trends In recent years healthexamination surveys have measured different glycaemicindicators providing an opportunity to systematicallyassess trends by country We reviewed and accessed
unpublished and published studies and collatedcomprehensive data for different glycaemic metrics Weapplied statistical methods to systematically address
measurement comparability missing data non-linear
time trends age patterns and national versus subnationaland community representativeness With these dataand methods we estimated trends and associateduncertainties by country and region
MethodsStudy designWe estimated 1980ndash2008 trends in mean fasting plasmaglucose (FPG) and diabetes by sex for 199 countries andterritories in the 21 subregions of the Global Burden ofDiseases Injuries and Risk Factors study which them-selves are grouped into larger regions (webappendix p 6)
We used mean FPG rather than postprandial glucoseor haemoglobin A1c (HbA1c) as the primary measure of
glycaemia because it is used in many more population-based studies We report population mean because thereis a continuous association between FPG and cardio-vascular disease including at levels below clinicalthresholds for diabetes diagnosis23031 We report diabetesprevalence as a secondary outcome because it is clinicallyrelevant and because associations with microvascularoutcomes can have a threshold32ndash34 We used the AmericanDiabetes Association (ADA) definition for diabetes FPG7middot0 mmolL or greater diagnosis or use of a glucose-lowering drug25 Estimates for primary and secondaryoutcomes were informed by all available data sourceswith systematic conversion between glycaemic metricsand definitions
Our analysis of primary measure (mean FPG) includedthree steps (1) identification of data sources andaccessing and extracting of data (2) conversion of datathat were reported in other metrics to FPG and(3) application of statistical models to estimate trends inmean FPG by country and sex We analysed theuncertainty of estimates taking into account samplingerror and uncertainty from statistical modelling insteps 2 and 3
Data sourcesOur data sources were health examination surveys andepidemiological studies with data available to Collaborating
Group members multicentre studies published articlesand unpublished data identified through the WHO GlobalInfoBase Figure 1 and webappendix pp 2ndash3 providesdetails of data identification access and extractionDuplicate sources were identified by comparison of allstudies from the same country-year Data that were basedsolely on known or self-reported diabetes were excludedbecause some cases might be undiagnosed and lead tounderestimation of prevalence2829
Fasting and postprandial glucose in venous wholeblood and fasting glucose in capillary whole blood weremultiplied by 1middot11 to convert to equivalent plasmaglucose35 19 studies with postprandial glucose in capillarywhole blood were excluded because the relation withplasma glucose is highly variable36 For each data sourceFigure 983089 Flow diagram for data source identification and accessPPG=postprandial glucose
3355 articles identified inMedline and Embase
1638 articles excluded based on titleand abstract review
154 health surveys and epidemiological studies analysed by Collaborating
Group members representing203 country-years
1717 articles remaining afterexclusion based on titleand abstract review
607 articles excluded because of fulltext review or because they werebased on the same study asanother article 140 because wecould not retrieve the full text
and 53 because we could nottranslate the article
917 articles remaining afterexclusion based on full
text review
13 reports with 14 country-yearsreceived through personalcommunications
802 articles excluded because datawere not accessible by age andsex because the same data wereavailable from CollaboratingGroup members because they
used capillary PPG or because datawere not from one of the 199countries or territories in our study
Data extracted from128 published studiesrepresenting 153 country-years
14 additional country-years ofdata retrieved from WHOGlobal InfoBase
Data extracted from 370 country-years with 2middot7 million participants
8102019 Studiu Diabet Lancet
httpslidepdfcomreaderfullstudiu-diabet-lancet 310
Articles
wwwthelancetcom
Vol 378 July 2 2011 33
we recorded whether the data were national (separated
into weighted and unweighted) subnational (coveredmultiple communities provinces or states) or fromindividual communities (denoted study coveragehereafter) and whether the study population was ruralurban or both (webappendix pp 7ndash24) This informationwas used to account for potential bias and additionalvariability in data sources that were not representative oftheir national populations
Conversion between glycaemic metricsAlthough mean FPG was the most common metric in ourdata some sources reported mean postprandial glucose orHbA1c Further some published studies reported diabetesprevalence with varying definitions but not mean glucose
We used data sources that had mean FPG and othermetrics to develop regression models to estimate meanFPG The dependent variable in these cross-walkingregressions was mean FPG the independent variableswere mean postprandial glucose mean HbA1c or diabetesprevalence and age sex year of survey and whether thecountry was high income We developed a separateregression for each diabetes definition used in at least onepublished study Webappendix pp 4 and 25ndash30 providesmodel details and coeffi cients
We used a similar approach to estimate diabetesprevalence our secondary outcome from the estimatedmean FPG The dependent variable of this reverse cross-walking regression was the logit of prevalence (based onthe ADA definition) and the independent variables wereLn of mean FPG age sex as well as whether the countrywas high income The uncertainties of the prevalenceestimates included those of the estimated mean FPG anduncertainty associated with conversion of mean toprevalence Details of uncertainty analyses are providedelsewhere37 Webappendix p 31 provides the coeffi cientsof the regression
Methods for country mean FPG estimatesMany country-years had no data or no nationallyrepresentative data Further some studies covered onlysome age groups We developed a statistical model to
estimate mean FPG by age group country and yearseparately for men and women We used a Bayesianhierarchical model in which estimates for each age-country-year unit were informed by data from that unititself if available and by data from other units Specificmodel features are described briefly here with completedetails provided elsewhere37
We used a hierarchical model in which mean FPG valuesand trends in countries were nested in subregionalregional and global values and trends The hierarchicalmodel borrows information across countries subregionsand regions appropriately compromising between (overly)uncertain within-unit estimates and (overly) simplifiedaggregate cross-unit estimates it borrows informationto a greater degree when data are non-existent or
non-informative (ie have large uncertainty) and to a lesser
degree in data-rich countries subregions and regionsFPG trends over time were modelled as a linear trendplus a smooth non-linear trend at all levels Bothcomponents were modelled hierarchically Time varyingcountry-level covariates informed the estimates Thecovariates described in webappendix p 5 and elsewhere37 were national income (Ln per-head gross domesticproduct converted to international dollars in 1990)urbanisation (proportion of population that lived inurban areas) national availability of multiple food typesand age-standardised mean body-mass index (BMI)7
Subnational and community studies might system-atically differ from nationally representative ones becausethey might be undertaken in low-glucose or high-glucose
areas They might also have larger variation than nationalstudies Our model included offsets for subnational andcommunity data and additional variance componentsfor subnational and community data and for nationaldata without sample weights These variance componentswere estimated empirically and allowed national datawith sample weights to have more effect on estimatesthan other sources
Mean FPG might differ systematically between ruraland urban populations with the difference dependenton the countryrsquos level of urbanisation Therefore themodel included an offset for rural-only and urban-onlydata The offset was empirically estimated and wasweighted by the difference between study-level andcountry-level urbanisation
Mean FPG might be non-linearly associated with ageand the age association might flatten or decrease in olderages The age association might vary across countriesand might be steeper when mean FPG is higherTherefore we used a cubic spline age model withparameters estimated as a function of mean FPG at abaseline age
Mean FPG was estimated from the model for 5ndash10-yearage groups for adults aged 25 years and older Estimatesfor subregions regions and the world were calculated aspopulation-weighted averages of the constituent countryestimates by age group and sex For presentation
estimates for each country or region and year were age-standardised to the WHO reference population38
We quantified the following sources of uncertaintywith details provided elsewhere37 sampling uncertaintyin the original data sources uncertainty associated withfluctuations over time in national data because ofunmeasured study design factors (eg national datafrom the USA in webappendix pp 218 and 350) orbecause some surveys did not have sample weightsadditional uncertainty associated with data sources thatwere not national because of variation across com-munities in each country uncertainty associated withconversion of various glycaemic metrics to FPG(primary outcome) and between mean FPG and diabetesprevalence (secondary outcome) and uncertainty due
8102019 Studiu Diabet Lancet
httpslidepdfcomreaderfullstudiu-diabet-lancet 410
Articles
34 wwwthelancetcom
Vol 378 July 2 2011
to making estimates by age group country and yearwhen data were missing
As described in detail elsewhere37 we fitted the Bayesianmodel with the Markov chain Monte Carlo (MCMC)algorithm and obtained samples from the posteriordistribution of model parameters which were in turnused to obtain the posterior distribution of mean FPGThe uncertainty intervals reported represent the2middot5ndash97middot5 percentiles of the posterior distribution of
estimated means Change was estimated as lineartrend over the 29 years of analysis and is reported aschange per decade We also report the posterior probabilitythat an estimated increase or decrease represents atruly increasing or decreasing trend as opposed to achance observation
We report estimates for all country-years many ofwhich were without data We verified the externalpredictive validity of these (out-of-sample) estimates andtheir uncertainty intervals We divided the countries withdata into five non-overlapping groups of equal size suchthat each group contained a mix of countries with richdata (ge4 years of data) average density data (2ndash3 years ofdata) and poor data (1 year of data) Within each group ofcountries we withheld 10 of data sources For a specific
country we withheld either all the countryrsquos data(ie created the appearance of countries with no datawhen we actually had data) or all the countryrsquos 2000ndash09data (ie created the appearance of no recent data) or arandom third of the countryrsquos data Our goals were tomeasure how well we estimated FPG for countrieswithout data how well we estimated recent FPG forcountries without recent data and how well we filled inthe gaps for countries with intermittent data For each of
the five groups we fitted the model to the remaining 90of the dataset and made estimates of the withheldobservations We then examined whether the estimated95 uncertainty intervals around these estimates coveredthe withheld study means In a model with good externalpredictive validity 95 of withheld values would becovered by the uncertainty intervals We assessed externalpredictive validity for the full withheld dataset and forsubsets based on region age gross domestic productand urbanisation level and year of data
Role of the funding sourceThe sponsor of the study had no role in study designdata collection data analysis data interpretation orwriting of the report The Writing and Global Analysis
Figure 983090 Trends in age-standardised mean FPG by region between 1980 and 2008 for men (A) and women (B)
Webappendix pp 51ndash53 shows trends by subregion and webappendix pp 57ndash91 trends by country The solid line represents the posterior mean and the shaded area the uncertainty interval FPG=fasting
plasma glucose
High-income region of AustralasiaNorth America and western Europe
F P G ( m m o l L )
6
5middot5
5
4middot5
6middot5
F P G ( m m o l L )
6
5middot5
5
4middot5
6middot5
F P G ( m m o l L )
6
5middot5
5
4middot5
6middot5
F P G ( m m o l L )
6
5middot5
5
4middot5
6middot5
6
5middot5
5
4middot5
6middot5
6
5middot5
5
4middot5
6middot5
6
5middot5
5
4middot5
6middot5
6
5middot5
5
4middot5
6middot5
Central and eastern Europe region Sub-Saharan Africa region
Change=0middot12 mmolL per decade (0middot00 to 0middot24) Change=0middot03 mmolL per decade (ndash0middot28 to 0middot33) Change=0middot05 mmolL per decade (ndash0middot15 to 0middot24)
Central Asia and north Africa andMiddle East region
South Asia region East Asia and southeast Asia region
Change=0middot06 mmolL per decade (ndash0middot14 to 0middot27) Change=0middot16 mmolL per decade (ndash0middot10 to 0middot43) Change=ndash0middot01 mmolL per decade (ndash0middot16 to 0middot15)
Southern and tropical Latin Americaregion
Central and Andean Latin America andCaribbean region
High-income Asia-Pacific region
Change=0middot17 mmolL per decade (ndash0middot13 to 0middot48) Change=0middot08 mmolL per decade (ndash0middot12 to 0middot29) Change=0middot13 mmolL per decade (ndash0middot04 to 0middot30)
Oceania region World
Change=0middot22 mmolL per decade (ndash0middot02 to 0middot47) Change=0middot07 mmolL per decade (ndash0middot02 to 0middot15)
Year Year
1985 1995 2005 1985 1995 2005
Year
1985 1995 2005
High-income region of AustralasiaNorth America and western Europe
Central and eastern Europe region Sub-Saharan Africa region
Change=0middot08 mmolL per decade (ndash0middot04 to 0middot19) Change=0middot02 mmolL per decade (ndash0middot31 to 0middot34) Change=0middot13 mmolL per decade (ndash0middot07 to 0middot34)
Central Asia and north Africa andMiddle East region
South Asia region East Asia and southeast Asia region
Change=0middot16 mmolL per decade (ndash0middot04 to 0middot37) Change=0middot20 mmolL per decade (ndash0middot06 to 0middot47) Change=0middot02 mmolL per decade (ndash0middot13 to 0middot17)
Southern and tropical Latin Americaregion
Central and Andean Latin America andCaribbean region
High-income Asia-Pacific region
Change=0middot13 mmolL per decade (ndash0middot17 to 0middot42) Change=0middot13 mmolL per decade (ndash0middot08 to 0middot33) Change=0middot08 mmolL per decade (ndash0middot09 to 0middot25)
Oceania region World
Change=0middot32 mmolL per decade (0middot08 to 0middot55) Change=0middot09 mmolL per decade (0middot00 to 0middot17)
Year Year
1985 1995 2005 1985 1995 2005
Year
1985 1995 2005
A Men B Women
8102019 Studiu Diabet Lancet
httpslidepdfcomreaderfullstudiu-diabet-lancet 510
Articles
wwwthelancetcom
Vol 378 July 2 2011 35
Group had access to all data sources and has responsibilityfor the decision to submit for publication
ResultsOur final dataset included 370 country-years with2middot7 million participants (figure 1) Of the includedstudies 71 had reported mean FPG or diabetesprevalence based on FPG with others using postprandialglucose or HbA1c (webappendix pp 7ndash24) 128 country-years were from 22 high-income countries and 242 from
85 low-income and middle-income countries Japan hadthe most nationally representative data with 8 years ofnational data since 1980 followed by the USA andSingapore (webappendix pp 46ndash48) We could not identifyany population-based data for 92 countries Central Asiacentral and eastern Europe and sub-Saharan Africa hadthe largest proportion of countries without data(webappendix pp 49ndash50) National surveys contributed29 of all data subnational studies 19 and communitystudies 52 (webappendix pp 49ndash50)
Globally age-standardised mean FPG was5middot50 mmolL (95 uncertainty interval 5middot37ndash5middot63) foradult men and 5middot42 mmolL (5middot29ndash5middot54) for womenin 2008 (figure 2) having risen by an estimated0middot07 mmolL per decade (ndash0middot02 to 0middot15 posterior
probability of the observed increase being a trueincrease=0middot94) for men and 0middot09 mmolL per decade(0middot00ndash0middot17 posterior probability=0middot98) for womensince 1980 Age-standardised prevalence of diabetes was9middot8 (8middot6ndash11middot2) in men and 9middot2 (8middot0ndash10middot5) inwomen in 2008 (figure 3) leading to an estimated173 (151ndash197) million men and 173 (151ndash197) millionwomen with diabetes 40 (about 138 million) of peoplewith diabetes were from China and India 10 (about36 million) from the USA and Russia and 12 (about
42 million) from Brazil Pakistan Indonesia Japan andMexico In 1980 age-standardised prevalence was 8middot3(6middot5ndash10middot4) in adult men and 7middot5 (5middot8ndash9middot6) in womenyielding 77 (60ndash97) million men and 76 (58ndash97) millionwomen with diabetes Of the nearly 194 millionadditional cases of diabetes between 1980 and 200870 (52ndash98) were attributable to population growth andageing and the other 30 (2ndash48) to a rise in age-specificprevalences Across regions the epidemiological shareof the change ranged from ndash2 in east and southeastAsia to 60 in Oceania (data not shown)
In 2008 mean FPG in men was lowest in sub-SaharanAfrica (5middot27 mmolL 4middot96ndash5middot58) followed by east andsoutheast Asia and high-income Asia-Pacific (figure 2)Women in high-income Asia-Pacific had the lowest mean
Figure 983091 Trends in age-standardised diabetes prevalence by region between 1980 and 2008 for men (A) and women (B)
Webappendix pp 54ndash56 shows trends by subregion
High-income region of AustralasiaNorth America and western Europe
D i a b e t e s p r e v a l e n c e ( )
16
12
8
4
20
D i a b e t e s p r e v a l e n c e ( )
16
12
8
4
20
D i a b e t e s p r e v a l e n c e ( )
16
12
8
4
20
D i a b e t e s p r e v a l e n c e ( )
16
12
8
4
20
16
12
8
4
20
16
12
8
4
20
16
12
8
4
20
16
12
8
4
20
Central and eastern Europe region Sub-Saharan Africa region
Central Asia and north Africa andMiddle East region
South Asia region East Asia and southeast Asia region
Southern and tropical Latin Americaregion Central and Andean Latin America andCaribbean region High-income Asia-Pacific region
Oceania region World
Year Year
1985 1995 2005 1985 1995 2005
Year
1985 1995 2005
High-income region of AustralasiaNorth America and western Europe
Central and eastern Europe region Sub-Saharan Africa region
Central Asia and north Africa andMiddle East region
South Asia region East Asia and southeast Asia region
Southern and tropical Latin Americaregion Central and Andean Latin America andCaribbean region High-income Asia-Pacific region
Oceania region World
Year Year
1985 1995 2005 1985 1995 2005
Year
1985 1995 2005
A Men B Women
8102019 Studiu Diabet Lancet
httpslidepdfcomreaderfullstudiu-diabet-lancet 610
Articles
36 wwwthelancetcom
Vol 378 July 2 2011
Figure 983092 Change in country age-standardised mean FPG between 1980 and 2008 in relation to its uncertainty for men (A) and women (B)
The shaded areas roughly represent the following ranges of posterior probability (PP) of an estimated increase or decrease being a true increase or decrease PPgt0middot975 (A)0middot95ltPPlt0middot975 (B) 0middot75ltPPlt0middot95 (C) and PPlt0middot75 FPG=fasting plasma glucose
i s e d m e a n F P G ( m m o l L p e r d e c a d e )
C h a n g e i n a g e - s t a n d a r d i s e d m e a n F P G ( m m o l L p e r d e c a d e )
AustralasiaWestern EuropeNorth America high incomeCentral EuropeEastern EuropeCentral AfricaEast AfricaSouthern AfricaWest AfricaNorth Africa and Middle East
Central Asia
South AsiaAsia-Pacific high incomeEast AsiaSoutheast AsiaOceaniaCaribbeanAndean Latin AmericaCentral Latin AmericaSouthern Latin AmericaTropical Latin America
Uncertainty (posterior SD) of change in age-standardised mean FPG (mmolL per decade)
(D)
(C)
(B)
(A)
B Women
8102019 Studiu Diabet Lancet
httpslidepdfcomreaderfullstudiu-diabet-lancet 710
Articles
wwwthelancetcom
Vol 378 July 2 2011 37
FPG (5middot17 mmolL 4middot94ndash5middot39) followed by sub-Saharan
Africa and east and southeast Asia (figure 2) Oceaniahad the highest mean FPG and diabetes prevalence ofany region in 2008 for both men (6middot09 mmolL5middot73ndash6middot49 and 15middot5 11middot6ndash20middot1) and for women(6middot08 mmolL 5middot72ndash6middot46 and 15middot9 12middot1ndash20middot5) MeanFPG and diabetes prevalence were also high for bothsexes in south Asia Latin America and the Caribbeanand a region consisting of central Asia north Africa andthe Middle East (figure 2 and figure 3) Men in the high-income region consisting of Australasia North Americaand western Europe also had relatively high FPG anddiabetes prevalence (figure 2 and figure 3) In high-income subregions mean FPG and diabetes were lowerin Asia-Pacific and western Europe than in Australasia
and north America with the difference between thehighest and lowest means and prevalences about0middot4 mmolL and 4ndash5 percentage points respectively(webappendix pp 51ndash56)
With few exceptions countries with the highest FPGand diabetes prevalence in 2008 were in Oceania northAfrica and the Middle East and the Caribbean with age-standardised mean FPG 6middot5 mmolL or higher in theMarshall Islands Kiribati Saudi Arabia the Cook Islandsand Samoa in both sexes (figure appendix 1) age-standardised diabetes prevalence in these countriesranged 21ndash25 in men and 21ndash32 in women (figureappendix 2) Countries in southeast Asia east Africa andAndean Latin America had the lowest mean FPG in 2008(as low as 5 mmolL or less figure appendix 1) Of high-income countries mean FPG and diabetes were highestin the USA Greenland Malta New Zealand and Spainand lowest in the Netherlands and Austria for both sexesand in France for women (figure appendix 1) Mean FPGin these western European countries was lower than inJapan and South Korea despite having higher BMIs7
FPG increased or at best remained unchanged inalmost every region between 1980 and 2008 (figure 2)FPG increased the most in Oceania by 0middot22 mmolL perdecade (ndash0middot02 to 0middot47 posterior probability=0middot97) in menand 0middot32 mmolL per decade (0middot08ndash0middot55 posteriorprobability gt0middot99) in women This rise led to an estimated
increase in age-standardised diabetes prevalence of5middot9 percentage points for men and 7middot8 percentage pointsfor women in this region (figure 3) Large increases inmean FPG were also recorded in southern and tropicalLatin America and south Asia for men and in south Asiaand the combined region of central Asia north Africaand the Middle East for women (all gt0middot15 mmolL perdecade posterior probabilities ge0middot87) In men andwomen we recorded almost no change in mean FPG ineast and southeast Asia and in central and eastern Europeduring these 28 years (figure 2) Male FPG trend in sub-Saharan Africa was indistinguishable from no change(posterior probability=0middot69) but women had an increaseof 0middot13 mmolL per decade (ndash0middot07 to 0middot34 posteriorprobability=0middot91) In high-income subregions FPG
increased the least in western Europe by 0middot07 mmolL
per decade (ndash0middot08 to 0middot21 posterior probability=0middot82) inmen and by 0middot03 mmolL per decade (ndash0middot13 to 0middot18posterior probability=0middot63) in women which was statis-tically indistinguishable from no change Conversely inhigh-income North America FPG rose by 0middot18 mmolLper decade (0middot00ndash0middot36 posterior probability=0middot98) inmen and 0middot14 mmolL per decade (ndash0middot03 to 0middot31posterior probability=0middot94) in women
Apart from women in Singapore for whom mean FPGdecreased by 0middot21 mmolL per decade (ndash0middot06 to 0middot51posterior probability=0middot92) no country had a meaningfulfall in FPG the few countries with apparent decreaseshad posterior probabilities of 0middot80 or less and hence werestatistically indistinguishable from flat trends (figure 4)
Countries with flat trends were in east and southeastAsia sub-Saharan Africa Andean and central LatinAmerica high-income Asia-Pacific and especially forwomen in Europe (figure 4) Countries in Oceania andNorth Africa and the Middle East had the largest increasein mean FPG by 0middot5 mmolL per decade or more in theMarshall Islands Samoa Kiribati and Saudi Arabia
Our model did well in external predictive validity testsSpecifically the 95 uncertainty intervals of our modelpredictions included 95 of withheld study means forwomen and 96 for men (webappendix p 45) Our modelalso had good predictive validity in most regions and byyear of data gross domestic product and age groupWhen we excluded all data for some countries (ie createdthe appearance of no data when data were available) theuncertainty intervals of model predictions included 96of the female study means that were known but excludedand 98 of the male study means Although data weresparse early in our analysis period our model covered99 of withheld values from 1980 to 1995 suggestingthat our uncertainty estimates were slightly conservativewhen data were scarce
DiscussionOur systematic analysis shows that glycaemia anddiabetes are a rising global hazard with the number ofadults with diabetes having more than doubled over
nearly three decades Although population growth andageing are important contributors to this increase thereis also an important epidemiological component withage-standardised global mean FPG having increased by0middot07 mmolL per decade or more
Our estimate of 347 (314ndash382) million adults withdiabetes is higher than Shaw and colleaguesrsquo estimate of285 million for 2010 (panel)13 The differences betweenthe estimates could be explained by the inclusion andexclusion criteria and the number of studies useddifferent age ranges of estimates or different methodsto deal with missing data year of data rural and urbandata and national versus subnational and communitydata Recent narrative reviews have stated that diabetesis rising in Asia and Africa without addressing whether
8102019 Studiu Diabet Lancet
httpslidepdfcomreaderfullstudiu-diabet-lancet 810
Articles
38 wwwthelancetcom
Vol 378 July 2 2011
the data were representative whether age groups werethe same in the included studies and other aspects ofdata comparability2039ndash41 We screened all data sourcesused in these overviews and used additional sources
Although we generally recorded increasing mean FPGand diabetes prevalence our quantitative results are notcomparable with the previous reports because we hadused a larger number of studies and different methodsNotably with use of national studies from China TaiwanThailand Malaysia Cambodia and the Philippines inaddition to multiple subnational and community studieswe noted no increase in age-standardised diabetesprevalence in east and southeast Asia although ageingand population growth led to an increase in the numberof people with diabetes
The strengths and innovations of this study includeanalysis of trends the large amount of data accessed andused systematic conversion between different metrics ofglycaemia and definitions of diabetes application of a
Bayesian hierarchical model to estimate mean FPG
which included non-linear time trends and ageassociations and used national income urbanisationfood availability and BMI as covariates incorporation ofstudy coverage as offset and variance components andsystematic analysis and reporting of uncertainty Coverage-specific offsets and variances allowed our estimates to useall available data and to follow data from nationallyrepresentative studies more closely Coverage-specificvariance components were larger for less representativedata sources which led to larger uncertainty when we didnot have nationally representative data thus representingthe true availability of information
The main limitation of our study is that despiteextensive data seeking many country-years still did not
have data especially in the 1980s and in some low-income and middle-income countries The absence ofdata is reflected in wider uncertainty intervals Ourexternal predictive validity assessment showed that theestimates and their uncertainty intervals are validimportantly applications of our results should use thefull uncertainty intervals Further we noted substantialincomparability in metrics of glycaemia in publisheddata Specifically we had data for mean postprandialglucose mean HbA1c and diabetes prevalence using18 different definitions Although we systematicallyconverted between different glycaemia metrics theconversions led to increases in uncertainty intervalsSimilarly to estimate diabetes prevalence we relied onmean FPG as an intermediate step for conversionbetween different metrics and for handling of missingdata The association between mean and prevalencecould vary between countries beyond what is measuredby variables in webappendix p 31mdasheg because of vari-ations in quality of care Such variability is shown bylarger uncertainty in our prevalence estimates than theuncertainty of mean FPG The persistent incomparabilityof glycaemic metrics is partly because definitions forclinical purposes are the subject of continuous debateresearch and refinement Population-based surveillancehowever needs indicators that are easy to measure andare comparable across populations and over time
Although we incorporated information about studycoverage into our model and excluded studies based onrandom (non-fasting) blood glucose other qualityindicatorsmdashsuch as duration of fasting laboratorymethods calibration and other sources of interassayand intra-assay variabilitymdashwere not included in themodel potentially accounting for some of the uncertaintyin our estimates
As important as the global rise were the similaritiesand differences between regions and countries Trendsranged from nearly flat in some regions to a rise of0middot2ndash0middot3 mmolL per decade in Oceania This variation isundoubtedly partly attributable to regional BMI trends7 the correlation between change in BMI and FPG acrossthe 21 subregions was 0middot71 for women and 0middot57 for men
Panel Research in context
Systematic review
A few studies have examined global patterns of glycaemia and diabetes but have not
estimated past trends for all countries and regions Other studies have assessed trends in
specific countries or regions A recent publication estimated that there were 285 million
people with diabetes worldwide in 201013 but some of the data were from specific
occupational groups communities with high obesity prevalence or health-care facilities and
practitioners registries and self-reported diabetes Recent narrative reviews2039ndash41 have
stated that diabetes is rising in Asia and Africa without addressing incomparable age groups
in the studies included and other aspects of data comparability Previous studies (including
one by some members of our study group1) also had not distinguished between data that
are nationally representative and those that are subnational or from specific communities
We obtained data for the levels of different glycaemic metrics from the following sources
health examination surveys and epidemiological studies with anonymised data available to
the Collaborating Group members multicentre studies review of published articles andunpublished data sources identified through the WHO Global InfoBase Our final dataset
included 370 country-years with 2middot7 million participants We could not identify any
population-based data for 92 countries We had data for mean fasting and postprandial
glucose mean HbA1c and diabetes prevalence with use of 18 different definitions We
systematically converted between different glycaemic metrics based on data sources that
had measured multiple metrics
Interpretation
Our estimate of 347 (uncertainty interval 314ndash382) million adults with diabetes in 2008 is
higher than the previous 285 million estimate for 201013 The differences between the
estimates could be due to the inclusion and exclusion criteria and the number of studies
used different age ranges of estimates or different methods of handling missing data
differences in year of data rural and urban data and national versus subnational and
community data Although we generally found increasing mean fasting plasma glucose anddiabetes prevalence our quantitative results are not comparable with the previous reports
because we had used a larger number of studies and different methods Notably with use of
national studies from China Taiwan Thailand Malaysia Cambodia and the Philippines and
multiple subnational and community studies we recorded no increase in age-standardised
diabetes prevalence in east and southeast Asia although ageing and population growth led
to an increase in the number of people with diabetes in these regions
8102019 Studiu Diabet Lancet
httpslidepdfcomreaderfullstudiu-diabet-lancet 910
Articles
wwwthelancetcom
Vol 378 July 2 2011 39
However genetic factors associated with ethnic origin
fetal and early life nutritional status diet quality andphysical activity might also affect glycaemic values andtrends Notably men in south Asia had the secondsmallest change in BMI (almost zero) of the 21 subregions7 but the sixth highest rise in mean FPG women in thisregion had the fourth smallest BMI change (0middot4 kgmsup2per decade) but the sixth largest rise in FPG about thesame as in high-income North America where femaleBMI rose three times as much7
The global and regional trends in mean FPG differfrom those of other metabolic risksmdashnamely systolicblood pressure which decreased globally and in mostsubregions37 and total cholesterol which decreased inAustralasia Europe and North America but rose in east
and southeast Asia and Asia-Pacific leading to relativelyunchanged global mean42 Because high BMI is a riskfactor for all three metabolic indicators these differencesprobably arise from other determinants including dietarycomposition and medical treatment Specificallyalthough effective drugs to lower blood pressure andcholesterol are increasingly used for primary preventionof cardiovascular disease in high-income countries theuse of specific drugs for primary prevention and thetargets and intensity of glycaemic management are stillbeing investigated43 Therefore primary prevention ofdysglycaemia will need weight control physical activityand improved diet quality Such interventions are diffi cultto implement within populations and will not affectdiabetes incidence in the short term Therefore healthsystems in most countries will inevitably have to developprogrammes to improve detection and management ofdiabetes to slow progression to microvascular andmacrovascular complications
Contributors
GD and ME developed the study concept GD YL MR and CARundertook reviews of published studies and managed databases JKLMJC GMS YL Y-HK and members of Country Data Group analysedhealth examination survey and epidemiological study data MMF andCJP developed the Bayesian statistical model with input from GD andME MMF YL GMS JKL and GD analysed databases and preparedresults GD and ME wrote the first draft of the report Other members ofthe Writing and Global Analysis Group contributed to study designanalysis and writing of report ME GD and CJP oversaw the research
ME is the study guarantor for this report
Global Burden of Metabolic Risk Factors of Chronic Diseases Collaborating
Group (Blood Glucose)
Writing and Global Analysis Group Goodarz Danaei Mariel M FinucaneYuan Lu Gitanjali M Singh Melanie J Cowan Christopher J PaciorekJohn K Lin Farshad Farzadfar Young-Ho Khang Gretchen A StevensMayuree Rao Mohammad K Ali Leanne M Riley Carolyn A RobinsonMajid Ezzati These authors contributed equally to the research andmanuscript and are listed in alphabetical orderCountry Data Group Ziad Abdeen Wichai Aekplakorn Mustafa M AfifiEnrico Agabiti-Rosei Carlos A Aguilar Salinas Mohannad AlnsourRamachandran Ambady Carlo M Barbagallo Alberto BarceloacuteHenrique Barros Leonelo E Bautista Athanase BenetosPeter Bjerregaard Simona Bo Pascal Bovet Michael BursztynAntonio Cabrera de Leoacuten Maurizio Castellano Katia CastetbonNoureddine Chaouki Chien-Jen Chen Lily Chua Renata Ciacutefkovaacute
Anna Maria Corsi Elias Delgado Yasufumi Doi Alireza EsteghamatiCaroline H D Fall Jian-Gao Fan Catterina Ferreccio Leopold Fezeu
Eva L Fuller Simona Giampaoli Luis F GoacutemezRamiro Guerrero Carvajal William H Herman Victor M Herrera
Suzanne Ho Akhtar Hussain Nayu Ikeda Tazeen H JafarJost B Jonas Othman A Kadiki Ioannis Karalis Joanne KatzOmid Khalilzadeh Stefan Kiechl Pawel Kurjata Jeannette LeeJeannette Lee Stephen Lim TO Lim Cheng-Chieh Lin Xu LinHsien-Ho Lin Xiaoqing Liu Roberto Lorbeer Stefan MaStefania Maggi Dianna J Magliano Norma McFarlane-AndersonJuhani Miettola J Jaime Miranda Mostafa K Mohamed V MohanAli Mokdad Dante D Morales Iraj Nabipour Tomoko NakagamiVinay Nangia Hannelore Neuhauser Marianna Noale Altan OnatMyriam Oroacutestegui Demosthenes B Panagiotakos Valeria M A PassosCynthia Peacuterez Rafael Pichardo Hwee Pin Phua Pedro PlansQing Qiao Luiz R Ramos Sanjay Rampal Lekhraj RampalJosep Redon Luis Revilla Luis Rosero-Bixby Selim Y SanisogluMarcia Scazufca Beatriz D Schaan Cevad Sekuri Abdul S SheraZumin Shi Egleacute Silva Leon A Simons Stefan SoumlderbergVincenzo Solfrizzi Ahmet Soysal Aryeh D Stein Jochanan StessmanMark P Vanderpump Lucie Viet Peter Vollenweider Ningli Wang
Ya X Wang Sarwono Waspadji Johann Willeit Mark WoodwardLiang Xu Xiaoguang Yang Jin-Sang Yoon Zhijie Yu Jian ZhangLei Zhang
Conflicts of interest
CJP holds stock in Pfizer JKL holds stock in Johnson amp JohnsonME has chaired a session at the World Cardiology Congress which wassupported by the organiser All other authors declare that they have noconflicts of interest
Acknowledgments
This work was undertaken as a part of the Global Burden of DiseasesInjuries and Risk Factors study The results in this paper are preparedindependently of the final estimates of the Global Burden of DiseasesInjuries and Risk Factors study Partial funding was provided by WHOWe thank Mara Horwitz and Wenfan Yu for research assistance andAbigail Donner for research coordination MJC GAS and LMR are staffmembers of WHO The authors alone are responsible for the views
expressed in this publication and they do no necessarily represent thedecisions policy or views of WHO
References1 Danaei G Lawes CMM Vander Hoorn S Murray CJ Ezzati M
Global and regional mortality from ischaemic heart disease andstroke attributable to higher-than-optimum blood glucoseconcentration comparative risk assessment Lancet 2006 368 1651ndash59
2 Lawes CM Parag V Bennett DA et al Blood glucose and risk ofcardiovascular disease in the Asia Pacific region Diabetes Care 200427 2836ndash42
3 The DECODE study group on behalf of the European DiabetesEpidemiology Group Glucose tolerance and mortality comparisonof WHO and American Diabetes Association diagnostic criteriaLancet 1999 354 617ndash21
4 Nakagami T Hyperglycaemia and mortality from all causes andfrom cardiovascular disease in five populations of Asian origin
Diabetologia 2004 47 385ndash945 Khaw KT Wareham N Bingham S Luben R Welch A Day N
Association of hemoglobin A1c with cardiovascular disease andmortality in adults the European prospective investigation intocancer in Norfolk Ann Intern Med 2004 141 413ndash20
6 Klein R Hyperglycemia and microvascular and macrovasculardisease in diabetes Diabetes Care 1995 18 258ndash68
7 Finucane MM Stevens GA Cowan MJ et al on behalf of theGlobal Burden of Metabolic Risk Factors of Chronic DiseasesCollaborating Group (Body Mass Index) National regional andglobal trends in body-mass index since 1980 systematic analysisof health examination surveys and epidemiological studies with960 country-years and 9middot1 million participants Lancet 2011377 557ndash67
8 Abegunde DO Mathers CD Adam T Ortegon M Strong KThe burden and costs of chronic diseases in low-income andmiddle-income countries Lancet 2007 370 1929ndash38
9 Zimmet P Alberti KG Shaw J Global and societal implications
of the diabetes epidemic Nature 2001 414 782ndash87
10 Wild S Roglic G Green A Sicree R King H Global prevalenceof diabetes estimates for the year 2000 and projections for 2030
Diabetes Care 2004 27 1047ndash5311 King H Aubert RE Herman WH Global burden of diabetes
1995ndash2025 prevalence numerical estimates and projectionsDiabetes Care 1998 21 1414ndash31
12 Amos AF McCarty DJ Zimmet P The rising global burden ofdiabetes and its complications estimates and projections to theyear 2010 Diabet Med 1997 14 (suppl 5) S1ndash85
13 Shaw JE Sicree RA Zimmet PZ Global estimates of the prevalenceof diabetes for 2010 and 2030 Diabetes Res Clin Pract 2009 87 4ndash14
14 Nagata M Ninomiya T Doi Y et al Trends in the prevalence ofchronic kidney disease and its risk factors in a general Japanesepopulation the Hisayama Study Nephrol Dial Transplant 201025 2557ndash64
15 Berger B Stenstrom G Sundkvist G Incidence prevalenceand mortality of diabetes in a large population A report fromthe Skaraborg Diabetes Registry Diabetes Care 1999 22 773ndash78
16 Gatling W Budd S Walters D Mullee MA Goddard JR Hill RD
Evidence of an increasing prevalence of diagnosed diabetes mellitusin the Poole area from 1983 to 1996 Diabet Med 1998 15 1015ndash21
17 Dunstan DW Zimmet PZ Welborn TA et al The rising prevalenceof diabetes and impaired glucose tolerance the Australian DiabetesObesity and Lifestyle Study Diabetes Care 2002 25 829ndash34
18 Gregg EW Cheng YJ Cadwell BL et al Secular trends incardiovascular disease risk factors according to body mass indexin US adults JAMA 2005 293 1868ndash74
19 Lusignan S Sismanidis C Carey IM DeWilde S Richards NCook DG Trends in the prevalence and management of diagnosedtype 2 diabetes 1994ndash2001 in England and Wales BMC Fam Pract 2005 6 13
20 Chan JC Malik V Jia W et al Diabetes in Asia epidemiology riskfactors and pathophysiology JAMA 2009 301 2129ndash40
21 Venketasubramanian N Trends in cerebrovascular disease mortalityin Singapore 1970ndash1994 Int J Epidemiol 1998 27 15ndash19
22 Bovet P Romain S Shamlaye C et al Divergent fifteen-year trendsin traditional and cardiometabolic risk factors of cardiovascular
diseases in the Seychelles Cardiovasc Diabetol 2009 8 3423 Bjorkelund C Andersson-Hange D Andersson K et al Secular
trends in cardiovascular risk factors with a 36-year perspectiveobservations from 38- and 50-year-ol ds in the Population Study ofWomen in Gothenburg Scand J Prim Health Care 2008 26 140ndash46
24 Cowie CC Rust KF Ford ES et al Full accounting of diabetes andpre-diabetes in the US population in 1988ndash1994 and 2005ndash2006Diabetes Care 2009 32 287ndash94
25 Report of the expert committee on the diagnosis and classificationof diabetes mellitus Diabetes Care 2003 26 (suppl 1) S5ndash20
26 International Expert Committee International Expert Committeereport on the role of the A1C assay in the diagnosis of diabetesDiabetes Care 2009 32 1327ndash34
27 American Diabetes A Standards of medical care in diabetes 2011Diabetes Care 2011 34 (suppl 1) S11ndash61
28 Danaei G Friedman AB Oza S Murray CJ Ezzati M Diabetesprevalence and diagnosis in US states analysis of health surveys
Popul Health Metr 2009 7 1629 Gakidou E Mallinger L Abbott-Klafter J et al Managementof diabetes and associated cardiovascular risk factors in sevencountries a comparison of data from national health examinationsurveys Bull World Health Organ 2011 89 172ndash83
30 Gerstein HC Glucose a continuous risk factor for cardiovasculardisease Diabet Med 1997 14 (suppl 3) S25ndash31
31 Is fasting glucose suffi cient to define diabetes Epidemiological datafrom 20 European studies The DECODE-study group EuropeanDiabetes Epidemiology Group Diabetes EpidemiologyCollaborative analysis of Diagnostic Criteria in Europe Diabetologia 1999 42 647ndash54
32 Engelgau MM Thompson TJ Herman WH et al Comparisonof fasting and 2-hour glucose and HbA1c levels for diagnosingdiabetes Diagnostic criteria and performance revisitedDiabetes Care 1997 20 785ndash91
33 McCance DR Hanson RL Charles MA et al Comparison of testsfor glycated haemoglobin and fasting and two hour plasma glucoseconcentrations as diagnostic methods for diabetes BMJ 1994308 1323ndash28
34 Ohkubo Y Kishikawa H Araki E et al Intensive insulin therapyprevents the progression of diabetic microvascular complicationsin Japanese patients with non-insulin-dependent diabetes mellitusa randomized prospective 6-year study Diabetes Res Clin Pract 199528 103ndash17
35 Sacks DB Bruns DE Goldstein DE Maclaren NK McDonald JMParrott M Guidelines and recommendations for laboratory analysisin the diagnosis and management of diabetes mellitus Clin Chem 2002 48 436ndash72
36 Carstensen B Lindstrom J Sundvall J Borch-Johnsen KTuomilehto J Measurement of blood glucose comparison betweendifferent types of specimens Ann Clin Biochem 2008 45 140ndash48
37 Danaei G Finucane MM Lin JK et al on behalf of the GlobalBurden of Metabolic Risk Factors of Chronic Diseases CollaboratingGroup (Blood Pressure) National regional and global trends insystolic blood pressure since 1980 systematic analysis of healthexamination surveys and epidemiological studies with786 country-years and 5middot4 million participants Lancet 2011377 568ndash77
38 Ahmad O Boschi-Pinto C Lopez A Murray C Lozano R Inoue MAge standardization of rates a new WHO standard Geneva WorldHealth Organization 2001
39 Ramachandran A Ma RCW Snehalatha C Diabetes in Asia Lancet 2010 375 408ndash18
40 Mbanya JCN Motala AA Sobngwi E Assah FK Enoru ST Diabetesin sub-Saharan Africa Lancet 2010 375 2254ndash66
41 Abubakari AR Lauder W Jones MC Kirk A Agyemang CBhopal RS Prevalence and time trends in diabetes and physicalinactivity among adult West African populations the epidemic hasarrived Public Health 2009 123 602ndash14
42 Farzadfar F Finucane MM Danaei G et al on behalf of the GlobalBurden of Metabolic Risk Factors of Chronic Diseases CollaboratingGroup (Cholesterol) National regional and global trends in serumtotal cholesterol since 1980 systematic analysis of healthexamination surveys and epidemiological studies with321 country-years and 3middot0 million participants Lancet 2011 377 578ndash86
43 Skyler JS Bergenstal R Bonow RO et al Intensive glycemic controland the prevention of cardiovascular events implications of theACCORD ADVANCE and VA diabetes trials a position statement
of the American Diabetes Association and a scientific statement ofthe American College of Cardiology Foundation and the AmericanHeart Association Circulation 2009 119 351ndash57
8102019 Studiu Diabet Lancet
httpslidepdfcomreaderfullstudiu-diabet-lancet 910
Articles
wwwthelancetcom
Vol 378 July 2 2011 39
However genetic factors associated with ethnic origin
fetal and early life nutritional status diet quality andphysical activity might also affect glycaemic values andtrends Notably men in south Asia had the secondsmallest change in BMI (almost zero) of the 21 subregions7 but the sixth highest rise in mean FPG women in thisregion had the fourth smallest BMI change (0middot4 kgmsup2per decade) but the sixth largest rise in FPG about thesame as in high-income North America where femaleBMI rose three times as much7
The global and regional trends in mean FPG differfrom those of other metabolic risksmdashnamely systolicblood pressure which decreased globally and in mostsubregions37 and total cholesterol which decreased inAustralasia Europe and North America but rose in east
and southeast Asia and Asia-Pacific leading to relativelyunchanged global mean42 Because high BMI is a riskfactor for all three metabolic indicators these differencesprobably arise from other determinants including dietarycomposition and medical treatment Specificallyalthough effective drugs to lower blood pressure andcholesterol are increasingly used for primary preventionof cardiovascular disease in high-income countries theuse of specific drugs for primary prevention and thetargets and intensity of glycaemic management are stillbeing investigated43 Therefore primary prevention ofdysglycaemia will need weight control physical activityand improved diet quality Such interventions are diffi cultto implement within populations and will not affectdiabetes incidence in the short term Therefore healthsystems in most countries will inevitably have to developprogrammes to improve detection and management ofdiabetes to slow progression to microvascular andmacrovascular complications
Contributors
GD and ME developed the study concept GD YL MR and CARundertook reviews of published studies and managed databases JKLMJC GMS YL Y-HK and members of Country Data Group analysedhealth examination survey and epidemiological study data MMF andCJP developed the Bayesian statistical model with input from GD andME MMF YL GMS JKL and GD analysed databases and preparedresults GD and ME wrote the first draft of the report Other members ofthe Writing and Global Analysis Group contributed to study designanalysis and writing of report ME GD and CJP oversaw the research
ME is the study guarantor for this report
Global Burden of Metabolic Risk Factors of Chronic Diseases Collaborating
Group (Blood Glucose)
Writing and Global Analysis Group Goodarz Danaei Mariel M FinucaneYuan Lu Gitanjali M Singh Melanie J Cowan Christopher J PaciorekJohn K Lin Farshad Farzadfar Young-Ho Khang Gretchen A StevensMayuree Rao Mohammad K Ali Leanne M Riley Carolyn A RobinsonMajid Ezzati These authors contributed equally to the research andmanuscript and are listed in alphabetical orderCountry Data Group Ziad Abdeen Wichai Aekplakorn Mustafa M AfifiEnrico Agabiti-Rosei Carlos A Aguilar Salinas Mohannad AlnsourRamachandran Ambady Carlo M Barbagallo Alberto BarceloacuteHenrique Barros Leonelo E Bautista Athanase BenetosPeter Bjerregaard Simona Bo Pascal Bovet Michael BursztynAntonio Cabrera de Leoacuten Maurizio Castellano Katia CastetbonNoureddine Chaouki Chien-Jen Chen Lily Chua Renata Ciacutefkovaacute
Anna Maria Corsi Elias Delgado Yasufumi Doi Alireza EsteghamatiCaroline H D Fall Jian-Gao Fan Catterina Ferreccio Leopold Fezeu
Eva L Fuller Simona Giampaoli Luis F GoacutemezRamiro Guerrero Carvajal William H Herman Victor M Herrera
Suzanne Ho Akhtar Hussain Nayu Ikeda Tazeen H JafarJost B Jonas Othman A Kadiki Ioannis Karalis Joanne KatzOmid Khalilzadeh Stefan Kiechl Pawel Kurjata Jeannette LeeJeannette Lee Stephen Lim TO Lim Cheng-Chieh Lin Xu LinHsien-Ho Lin Xiaoqing Liu Roberto Lorbeer Stefan MaStefania Maggi Dianna J Magliano Norma McFarlane-AndersonJuhani Miettola J Jaime Miranda Mostafa K Mohamed V MohanAli Mokdad Dante D Morales Iraj Nabipour Tomoko NakagamiVinay Nangia Hannelore Neuhauser Marianna Noale Altan OnatMyriam Oroacutestegui Demosthenes B Panagiotakos Valeria M A PassosCynthia Peacuterez Rafael Pichardo Hwee Pin Phua Pedro PlansQing Qiao Luiz R Ramos Sanjay Rampal Lekhraj RampalJosep Redon Luis Revilla Luis Rosero-Bixby Selim Y SanisogluMarcia Scazufca Beatriz D Schaan Cevad Sekuri Abdul S SheraZumin Shi Egleacute Silva Leon A Simons Stefan SoumlderbergVincenzo Solfrizzi Ahmet Soysal Aryeh D Stein Jochanan StessmanMark P Vanderpump Lucie Viet Peter Vollenweider Ningli Wang
Ya X Wang Sarwono Waspadji Johann Willeit Mark WoodwardLiang Xu Xiaoguang Yang Jin-Sang Yoon Zhijie Yu Jian ZhangLei Zhang
Conflicts of interest
CJP holds stock in Pfizer JKL holds stock in Johnson amp JohnsonME has chaired a session at the World Cardiology Congress which wassupported by the organiser All other authors declare that they have noconflicts of interest
Acknowledgments
This work was undertaken as a part of the Global Burden of DiseasesInjuries and Risk Factors study The results in this paper are preparedindependently of the final estimates of the Global Burden of DiseasesInjuries and Risk Factors study Partial funding was provided by WHOWe thank Mara Horwitz and Wenfan Yu for research assistance andAbigail Donner for research coordination MJC GAS and LMR are staffmembers of WHO The authors alone are responsible for the views
expressed in this publication and they do no necessarily represent thedecisions policy or views of WHO
References1 Danaei G Lawes CMM Vander Hoorn S Murray CJ Ezzati M
Global and regional mortality from ischaemic heart disease andstroke attributable to higher-than-optimum blood glucoseconcentration comparative risk assessment Lancet 2006 368 1651ndash59
2 Lawes CM Parag V Bennett DA et al Blood glucose and risk ofcardiovascular disease in the Asia Pacific region Diabetes Care 200427 2836ndash42
3 The DECODE study group on behalf of the European DiabetesEpidemiology Group Glucose tolerance and mortality comparisonof WHO and American Diabetes Association diagnostic criteriaLancet 1999 354 617ndash21
4 Nakagami T Hyperglycaemia and mortality from all causes andfrom cardiovascular disease in five populations of Asian origin
Diabetologia 2004 47 385ndash945 Khaw KT Wareham N Bingham S Luben R Welch A Day N
Association of hemoglobin A1c with cardiovascular disease andmortality in adults the European prospective investigation intocancer in Norfolk Ann Intern Med 2004 141 413ndash20
6 Klein R Hyperglycemia and microvascular and macrovasculardisease in diabetes Diabetes Care 1995 18 258ndash68
7 Finucane MM Stevens GA Cowan MJ et al on behalf of theGlobal Burden of Metabolic Risk Factors of Chronic DiseasesCollaborating Group (Body Mass Index) National regional andglobal trends in body-mass index since 1980 systematic analysisof health examination surveys and epidemiological studies with960 country-years and 9middot1 million participants Lancet 2011377 557ndash67
8 Abegunde DO Mathers CD Adam T Ortegon M Strong KThe burden and costs of chronic diseases in low-income andmiddle-income countries Lancet 2007 370 1929ndash38
9 Zimmet P Alberti KG Shaw J Global and societal implications
of the diabetes epidemic Nature 2001 414 782ndash87
10 Wild S Roglic G Green A Sicree R King H Global prevalenceof diabetes estimates for the year 2000 and projections for 2030
Diabetes Care 2004 27 1047ndash5311 King H Aubert RE Herman WH Global burden of diabetes
1995ndash2025 prevalence numerical estimates and projectionsDiabetes Care 1998 21 1414ndash31
12 Amos AF McCarty DJ Zimmet P The rising global burden ofdiabetes and its complications estimates and projections to theyear 2010 Diabet Med 1997 14 (suppl 5) S1ndash85
13 Shaw JE Sicree RA Zimmet PZ Global estimates of the prevalenceof diabetes for 2010 and 2030 Diabetes Res Clin Pract 2009 87 4ndash14
14 Nagata M Ninomiya T Doi Y et al Trends in the prevalence ofchronic kidney disease and its risk factors in a general Japanesepopulation the Hisayama Study Nephrol Dial Transplant 201025 2557ndash64
15 Berger B Stenstrom G Sundkvist G Incidence prevalenceand mortality of diabetes in a large population A report fromthe Skaraborg Diabetes Registry Diabetes Care 1999 22 773ndash78
16 Gatling W Budd S Walters D Mullee MA Goddard JR Hill RD
Evidence of an increasing prevalence of diagnosed diabetes mellitusin the Poole area from 1983 to 1996 Diabet Med 1998 15 1015ndash21
17 Dunstan DW Zimmet PZ Welborn TA et al The rising prevalenceof diabetes and impaired glucose tolerance the Australian DiabetesObesity and Lifestyle Study Diabetes Care 2002 25 829ndash34
18 Gregg EW Cheng YJ Cadwell BL et al Secular trends incardiovascular disease risk factors according to body mass indexin US adults JAMA 2005 293 1868ndash74
19 Lusignan S Sismanidis C Carey IM DeWilde S Richards NCook DG Trends in the prevalence and management of diagnosedtype 2 diabetes 1994ndash2001 in England and Wales BMC Fam Pract 2005 6 13
20 Chan JC Malik V Jia W et al Diabetes in Asia epidemiology riskfactors and pathophysiology JAMA 2009 301 2129ndash40
21 Venketasubramanian N Trends in cerebrovascular disease mortalityin Singapore 1970ndash1994 Int J Epidemiol 1998 27 15ndash19
22 Bovet P Romain S Shamlaye C et al Divergent fifteen-year trendsin traditional and cardiometabolic risk factors of cardiovascular
diseases in the Seychelles Cardiovasc Diabetol 2009 8 3423 Bjorkelund C Andersson-Hange D Andersson K et al Secular
trends in cardiovascular risk factors with a 36-year perspectiveobservations from 38- and 50-year-ol ds in the Population Study ofWomen in Gothenburg Scand J Prim Health Care 2008 26 140ndash46
24 Cowie CC Rust KF Ford ES et al Full accounting of diabetes andpre-diabetes in the US population in 1988ndash1994 and 2005ndash2006Diabetes Care 2009 32 287ndash94
25 Report of the expert committee on the diagnosis and classificationof diabetes mellitus Diabetes Care 2003 26 (suppl 1) S5ndash20
26 International Expert Committee International Expert Committeereport on the role of the A1C assay in the diagnosis of diabetesDiabetes Care 2009 32 1327ndash34
27 American Diabetes A Standards of medical care in diabetes 2011Diabetes Care 2011 34 (suppl 1) S11ndash61
28 Danaei G Friedman AB Oza S Murray CJ Ezzati M Diabetesprevalence and diagnosis in US states analysis of health surveys
Popul Health Metr 2009 7 1629 Gakidou E Mallinger L Abbott-Klafter J et al Managementof diabetes and associated cardiovascular risk factors in sevencountries a comparison of data from national health examinationsurveys Bull World Health Organ 2011 89 172ndash83
30 Gerstein HC Glucose a continuous risk factor for cardiovasculardisease Diabet Med 1997 14 (suppl 3) S25ndash31
31 Is fasting glucose suffi cient to define diabetes Epidemiological datafrom 20 European studies The DECODE-study group EuropeanDiabetes Epidemiology Group Diabetes EpidemiologyCollaborative analysis of Diagnostic Criteria in Europe Diabetologia 1999 42 647ndash54
32 Engelgau MM Thompson TJ Herman WH et al Comparisonof fasting and 2-hour glucose and HbA1c levels for diagnosingdiabetes Diagnostic criteria and performance revisitedDiabetes Care 1997 20 785ndash91
33 McCance DR Hanson RL Charles MA et al Comparison of testsfor glycated haemoglobin and fasting and two hour plasma glucoseconcentrations as diagnostic methods for diabetes BMJ 1994308 1323ndash28
34 Ohkubo Y Kishikawa H Araki E et al Intensive insulin therapyprevents the progression of diabetic microvascular complicationsin Japanese patients with non-insulin-dependent diabetes mellitusa randomized prospective 6-year study Diabetes Res Clin Pract 199528 103ndash17
35 Sacks DB Bruns DE Goldstein DE Maclaren NK McDonald JMParrott M Guidelines and recommendations for laboratory analysisin the diagnosis and management of diabetes mellitus Clin Chem 2002 48 436ndash72
36 Carstensen B Lindstrom J Sundvall J Borch-Johnsen KTuomilehto J Measurement of blood glucose comparison betweendifferent types of specimens Ann Clin Biochem 2008 45 140ndash48
37 Danaei G Finucane MM Lin JK et al on behalf of the GlobalBurden of Metabolic Risk Factors of Chronic Diseases CollaboratingGroup (Blood Pressure) National regional and global trends insystolic blood pressure since 1980 systematic analysis of healthexamination surveys and epidemiological studies with786 country-years and 5middot4 million participants Lancet 2011377 568ndash77
38 Ahmad O Boschi-Pinto C Lopez A Murray C Lozano R Inoue MAge standardization of rates a new WHO standard Geneva WorldHealth Organization 2001
39 Ramachandran A Ma RCW Snehalatha C Diabetes in Asia Lancet 2010 375 408ndash18
40 Mbanya JCN Motala AA Sobngwi E Assah FK Enoru ST Diabetesin sub-Saharan Africa Lancet 2010 375 2254ndash66
41 Abubakari AR Lauder W Jones MC Kirk A Agyemang CBhopal RS Prevalence and time trends in diabetes and physicalinactivity among adult West African populations the epidemic hasarrived Public Health 2009 123 602ndash14
42 Farzadfar F Finucane MM Danaei G et al on behalf of the GlobalBurden of Metabolic Risk Factors of Chronic Diseases CollaboratingGroup (Cholesterol) National regional and global trends in serumtotal cholesterol since 1980 systematic analysis of healthexamination surveys and epidemiological studies with321 country-years and 3middot0 million participants Lancet 2011 377 578ndash86
43 Skyler JS Bergenstal R Bonow RO et al Intensive glycemic controland the prevention of cardiovascular events implications of theACCORD ADVANCE and VA diabetes trials a position statement
of the American Diabetes Association and a scientific statement ofthe American College of Cardiology Foundation and the AmericanHeart Association Circulation 2009 119 351ndash57