114
Study Committee’s Final Report DRAFT 2 – (10.23.2015) Mark‐Up Version Showing Changes From Draft 1

Study Committee’s Final Report
DRAFT 2 – (10.23.2015)
Mark‐Up Version Showing Changes From Draft 1

DRAFT 2 Community Facilities Study Final Report
Study Committee’s Final Report
DRAFT 2 – (10.23.2015)
Letter of Transmittal from Chair and Vice Chair
Executive Summary (revisions in progress)
List of Recommendations
Chapter 1 – Introduction and Background
1. Introduction and Snapshot of Arlington Today
2. Community Facilities Study
Charge
Community Facilities Committee and Resident Forum
Process
Communication efforts
3. Prior “strategic” studies
4. Other, overlapping studies underway
5. County and APS Improvements
Chapter 2 – Public Facility Basics
1. Demographic Forecasts and Projections
2. Facility Inventory and Projected Needs
3. Revenues and Capital Funding
Chapter 3 – Strategic Community Challenges
1. A Scarcity of Land for Public Facilities
2. Dealing with Changing Demographics
3. A Threatened Commercial Tax Base
4. Strategic Facility Planning and Priority Setting
5. Revamping the Community Dialogue
Chapter 4 – Next Steps
Appendices
Draft 2 - Page 2-MU

DRAFT 2 Community Facilities Study Final Report
Executive Summary
(Revisions in progress)
Draft 2 - Page 3-MU

DRAFT 2 Community Facilities Study Final Report
Recommendations:
1. Make maximum use (and reuse) of the facilities we have, ensuring that existing space is efficiently
used and that new space is adaptable for future purposes.
2. Encourage joint or shared use of facilities, taking into account the operating characteristics of any
existing use, such as open space.
3. Build up, under and over rather than out to use land most efficiently.
4. Create “new” land by building over right‐of‐way and on top of structures such as parking garages.
5. Collaborate with other jurisdictions to review whether opportunities exist for both facility and
service sharing.
6. Establish a land acquisition fund to position the County to acquire parcels when they become
available.
7. Improve forecast and projection methods (Phase 2 consultant work):
Analysis of student generation factors (SGF) by different housing characteristics, including
trends between 2010 and 2015;
Comprehensive demographic analysis of County population by age cohort;
Cohort component demographic model for County population forecasts;
Long‐term (6‐10 years) student population projection model; and
Trend reporting and best practices.
8. Improve cohort data research, particularly for those 65 and older and use demographic factors to
help define future facility needs.
9. Develop strategies to retain the millennial population, specifically increasing the availability of
“starter” housing (i.e. entry‐level homeownership), child care, and pre‐school.
10. Evaluate and enhance wrap around services coordinating school and after‐school needs.
11. Step up marketing efforts to attract commercial office tenants.
12. Add an economic impact statement to project Staff Reports to provide an analysis of both costs (e.g.
the projected service demands and other costs to the community) and benefits (e.g. the taxes and
other economic benefits) likely to be generated by a proposed project.
13. Require a letter from the Economic Development Commission to the County Board regarding the
economic impacts and benefits of each development project.
Draft 2 - Page 4-MU
DRAFT 2 Community Facilities Study Final Report
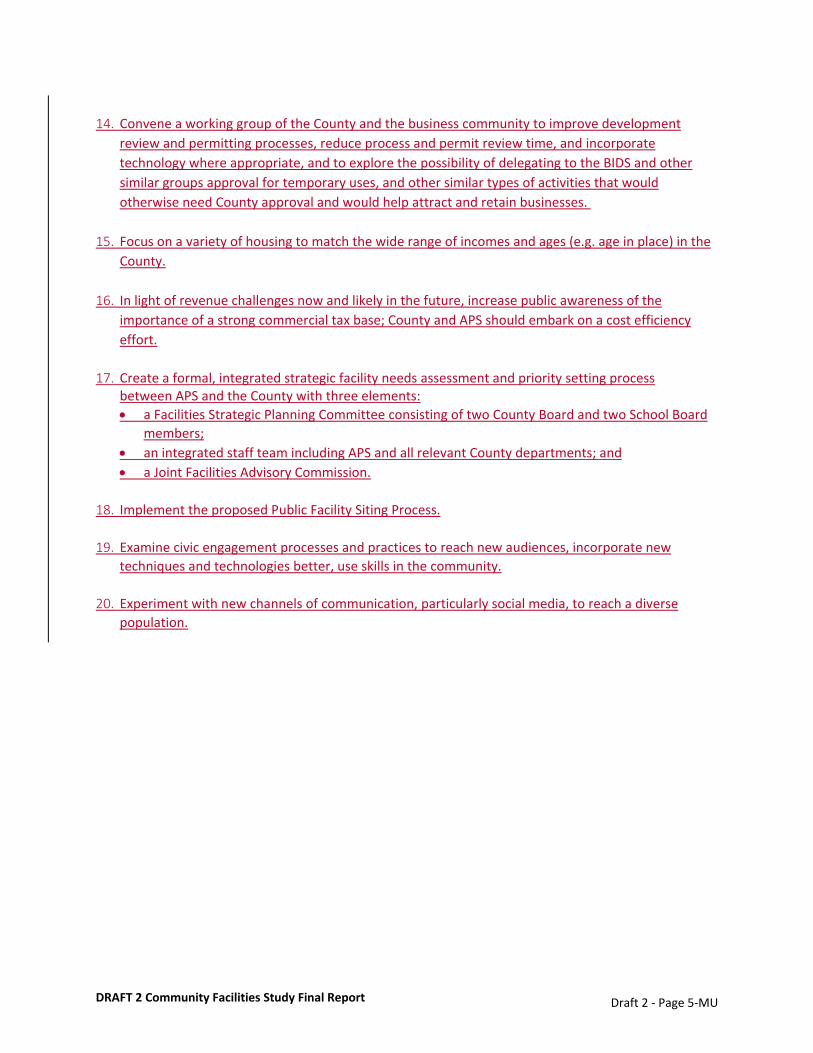
14. Convene a working group of the County and the business community to improve development
review and permitting processes, reduce process and permit review time, and incorporate
technology where appropriate, and to explore the possibility of delegating to the BIDS and other
similar groups approval for temporary uses, and other similar types of activities that would
otherwise need County approval and would help attract and retain businesses.
15. Focus on a variety of housing to match the wide range of incomes and ages (e.g. age in place) in the
County.
16. In light of revenue challenges now and likely in the future, increase public awareness of the importance of a strong commercial tax base; County and APS should embark on a cost efficiency
effort.
17. Create a formal, integrated strategic facility needs assessment and priority setting process between APS and the County with three elements:
a Facilities Strategic Planning Committee consisting of two County Board and two School Board
members;
an integrated staff team including APS and all relevant County departments; and
a Joint Facilities Advisory Commission.
18. Implement the proposed Public Facility Siting Process.
19. Examine civic engagement processes and practices to reach new audiences, incorporate new
techniques and technologies better, use skills in the community.
20. Experiment with new channels of communication, particularly social media, to reach a diverse
population.
Draft 2 - Page 5-MU
Chapter 1 – Introduction and Background
Chapter 1 – Introduction and Background
Introduction
Arlington County has experienced a steady surge in development and population growth since the early
1980s with remarkable changes along the Rosslyn‐Ballston, Jefferson‐Davis, and Columbia Pike transit
corridors. Over the last ten years, Arlington’s residential neighborhoods have also been changing as
land values escalate and as widespread rebuilding and renovations replace and expand older homes.
This tremendous growth—albeit largely planned over many decades in partnership with the
community—has created pressures on the County’s government and school facilities. At the same time,
a weakened office market, shifts in the Federal government’s operations within the region, land
limitations within Arlington, and a more mobile, digitally connected community, have elevated new
concerns which will need to be carefully and thoughtfully accounted for as future facility planning
occurs.
Several recent facility projects and initiatives have raised questions and concerns about how
theArlington County (“County”) and Arlington Public Schools (“APS” or “Schools”) plan for and finance
new public facilities. In response, the Arlington County and School Boards jointly launched the
Community Facilities Study in January. The Boards envisioned that the Community Facilities Study
would bring the community together to discuss how public facilities are planned and funded, how the
County and Schools could increase collaboration, what mistakes have been made in the past and how to
learn from them, and what positive strategies could be developed to improve public processes and
communications.
The Study Committee established for this effort discussed these largecomplex issues as it met over the
course of the year. The Study Committee paid particular attention to Arlington’s economic
development outlook, changing demographics, and scarcity of land which are intertwined with facility
needs, planning, construction, and operations – all challenges facing Arlington in the years ahead and if
left unaddressed could threaten Arlington’s overall sustainability. as a community. As the process
unfolded, it became apparent that the entirewider Arlington community could benefit from broader
awareness and understanding of the complex issues each Board and staff are faced with to run an
effective, efficient, and transparent government and school system.
Snapshot of Arlington Today
Arlington County was originally part of the “10 miles square” parcel of land surveyed in 1791 to be the
Nation's Capital. At approximately 26 square miles, it is the geographically smallest self‐governing
county in the United States. Arlington maintains a rich variety of stable neighborhoods and quality
schools, and has received numerous awards for its smart growth policies and practices and its emphasis
on transit‐oriented development. Home to some of the most influential organizations in the world —
including the Pentagon — Arlington stands out as one of America's preeminent places to live, visit and
do business. Arlington has enjoyed remarkable achievements thanks to a history of smart decisions
rooted in community engagement.
Draft 2 - Page 6-MU
Chapter 1 – Introduction and Background
A community‐based vision helped Arlington protect neighborhood character while planning for the
expansion of Metro rail transit in the 1970s. This was a pivotal point in forming the compact, urban
environment we know today with:
attractive, walkable neighborhoods;
unbeatable transportation;
a superior school system;
a smart, creative workforce;
parks and recreation facilities nationally recognized for their quality and diversity;
lowest unemployment rates in the region;
exceptional financial management and consistent Triple‐AAA bond rating;
a high level of services and programs for businesses and residents; and strong partnerships across the region with nearby localities, universities, non‐profit service
providers, and the development community.
As of January 1, 2015, Arlington has an estimated population of 216,700, reflecting an increase of 4.4%
since 2010. The population is forecasted to reach over 283,000 people, living in over 140,000 housing
units by 2040 – an increase of approximately 36% and 33%, respectively. Reflective of the official
September 30, 2015 count, over 25,000 students are enrolled in Arlington Public Schools. While only
about 20% of Arlington households include children under the age of 18, APS has experienced annual
enrollment growth ranging from 2.8% to 5.2% since 2008. This report highlights how these and other
factors, including the current and future economic conditions, facility and land inventory, and public
engagement, should influence future discussions and decisions about all public facilities.
County and School Governance
Arlington operates under a “county manager plan of government”, which consists of a 5‐member
elected County Board with legislative authority, an appointed County Manager with administrative and
executive powers, an elected 5‐member School Board with authority over the school system, and an
appointed Superintendent of Schools. The County Board has taxing authority. It adopts a budget each
year for the entire County that sets the funding level for the Schools. The School Board adopts its own
budget but does not have the authority to levy taxes. A revenue sharing agreement, in place since FY
2001, guides discussions between the County Board and School Board in structuring the portions of the
revenue for each entity to meet and address the economic and resource demands. For FY 2017, APS is
expected to receive 46.5% of local tax revenues to address increasing school enrollment and other
increased costs. Each Board adopts its own Capital Improvement Plan on a biennial basis, although the
debt capacity for bonding capital facilities is shared between County and Schools because the rating
agencies consider and evaluate both bodies’ debt capacity comprehensively. The CIPs are approved on
the same cycle; the most current School and County CIPs (FY 2015‐2024) were adopted in June and July
2014, respectively. The School Board and County Board each establish and make policy decisions which
are administered by the Superintendent and the County Manager, respectively. The County and Schools
own and operate their land and facilities independently; however, the County Board has authority over
and land use and zoning decisions, with many public facilities requiring approval by special exception
use permit. In numerous cases, facilities (particularly sports and recreation facilities) are shared
Draft 2 - Page 7-MU

Chapter 1 – Introduction and Background
between County and Schools under a shared use or joint use agreement. The County and School Boards
have also developed Criteria for Consideration of Arlington County Facilities and Land in APS Capacity
Planning Process to formalize their commitment to efficiently share space resources where feasible.
Community Facilities Study
The Charge
In January 2015, the County Board and the School Board jointly appointed a 23 member citizen
committee to develop a resource and facilities strategic plan for the future for Arlington County.
Officially entitled the Arlington Community Facilities Study – A Plan for the Future, this Final Report
focuses on long‐term opportunities and challenges for the County government and its school system.
The Study Committee was charged with:
Examining and reconciling existing demographic forecasts for the County and Schools
Compiling an inventory of existing County and School physical assets and a projection of new
facility needs
Proposing criteria and a process for siting any new County or School facilities
Developing a forecast of County revenue trends by source under three alterative futures – high,
medium and low growth and an analysis of best practices in public facility finance
Identifying strategic community challenges that, if unaddressed, could threaten Arlington’s
overall sustainability
A great deal of the Committee’s time was spent on the last item above, concluding that the
identification and discussion of key challenges for the future would be the most significant contribution
the Committee could make.
As the Committee identified the key challenges it thoughtthat could impact the County’sCounty Board
and School Board’s ability to achieve itsthe goals and vision for high‐quality public facilities serving every
resident in the future, a set of process or systems improvements emerged as the preferred method to
meet and overcome those challenges. (See Appendix 1 for full Charge).
Committee and Resident Forum
Through the Charge, the two boards established a 23‐member Committee representing a mix of civic
and professional experience to meet the task, some having been more active with Schools, others in
County advisory boards and commissions. The study’s reach and exposure into the community was
significantly expanded through the use of a novel technique called the Resident Forum. At the outset of
the Study, the County and School Boards contacted civic associations, PTAs, non‐profit groups, business
organizations, tenant groups, and other community organizations and asked each one to designate a
representative from its group to serve as a member of the Resident Forum. Many did so, providing a
direct communications link for the groups they represented. In addition, individuals could become
members of the Resident Forum simply by signing up. The Resident Forum was composed of more than
Draft 2 - Page 8-MU

Chapter 1 – Introduction and Background
240 people.250 people and represented over 52 of the County’s civic associations. Over 100 other
organizations were kept informed of the Study through an additional subscriber list following this effort.
A multi‐disciplined team of staff from both the County and APS assisted with this process, working
closely with the Study Committee Chair and Vice‐Chair.
Community Facilities Study Process
The Charge outlined a study that would run through 2015 with a final report being prepared and
presented by the Committee to the two Boards at the end of the year. The Committee met twice a
month. One meeting per month typically included break out discussions between Committee members
and members of the Resident Forum to gather reactions to the topics then under discussion.
The first several months of the study were designed to educate the Committee and other participants
on the County’s revenues, the regional and local economic situation, the County’s and Schools’ current
demographic picture and future growth forecasts and projections, the facility and land inventories, and
capital facility funding. County and APS staff members, consultants, and other professionals in the
Washington, D.C. region prepared the educational presentations. Each topic was typically covered over
the course of two meetings. The first meeting provided an overview of the topic, and allowed time for
questions and answers by the participants. The second meeting was a chance for participants, including
the Resident Forum, to clarify their understanding of the topic, and to share their feedback. Table
discussions focused three or four guiding questions (e.g. What future challenges do you see to
Arlington’s basic economic model of reliance on the commercial sector for 50 % of its real estate taxes?).
Committee members facilitated the small group discussions among the Resident Forum and captured
the feedback.
As educational sessions progressed, the Committee’s and Resident Forum’s focus shifted to challenges
that could impact facility planning in the future and solutions to overcome them. Subcommittees were
established to dig more deeply into four topics identified by the Committee: Demographics, Facilities,
Economic Sustainability and Facility Siting. The compiled feedback from the Resident Forum table
discussions were used by each of the subcommittees.
The Study Committee held an open house in June to welcome in and share information about the study
and information learned thus far with the general public as well as to collect feedback on a list of
challenges the Committee thought would be facing Arlington in the future. Over 100 people attended
the open house and over 70 people signed in to the promotional online chat for this event with the
Chairs of the Study Committee. The Committee also shared information with the public at the County
Fair in August.
The meeting process was generally designed with educational sessions occurring at the initial meetings
to give baseline information for all participants on the County’s revenues, the regional and local
economic situation, the County’s and Schools’ current demographic picture and future growth forecasts
and projections, the facility and land inventories, and capital facility funding. As educational sessions
progressed, the Committee’s and Resident Forum’s focus shifted to challenges that could impact facility
planning in the future and solutions to overcome them.
Draft 2 - Page 9-MU

Chapter 1 – Introduction and Background
The Charge to the Committee singled out one item, a process for the siting of public facilities, for a
September report to the two Boards. A Siting Subcommittee and the full Committee, with input from
the Resident Forum, spent considerable time on this issue and recommended a detailed process to be
used when either Board wished to find a location for an identified need or determine the appropriate
use or uses for an identified site. The Committee’s full Report on that item is set forth in Chapter 2 and
the Appendix of this Report.
This Final Report represents the consensus view of the Committee with considerable input from the
Resident Forum. The Charge to the Committee called for a number of specific reports and reviews as
spelled outmentioned above. These have been completed and are set out in the detail in Chapter 2 and
in several Appendices. All of the educational presentations from the Community Facilities Study
meetings are available in a companion document to this report and are available online [compilation
pending].
Communication Efforts
This effort was intended to reach the broadest sense of the community beyond any one particular
subset of the population or geographical area. To meet this challenge, a robust communications plan
was deployed and several new techniques were tested. In the end, communication material about the
effort reached many people in the community.
The Chair and Committee members made numerous presentations to community, non‐profit, and
business groups during the process, along with progress reports to each Board, which led to heightened
community awareness of the study and the issues being discussed such as the changing demographics
and improvements to future public facility siting. Beyond the traditional communication measures of e‐
mail and the internet, other digital tools were used including
messages shared through the APS’ School Talk, that reach over 36,000 subscribers via phone,
email and text messages;
Twitter,(@ArlingtonVA, @planArlingtonVA, and @APSVirginia) and Facebook, (Plan Arlington
VA and Arlington Public Schools);
live video feeds, and
an online chat. with over 70 participants, to promote an open house event in June 2015.
Updates on the study were also included in this year’s editions of The Citizen, mailed to every household
in the County. As a way to disseminate and archive the educational presentations, video recordings of
these sessions are posted online.; additionally, summaries of several meetings were prepared that could
be easily shared with neighborhood groups and uploaded to non‐County websites and listserves. The
presentations have been compiled and will be archived [pending]. A civic engagement toolkit was also
prepared giving each Committee member a compiled set of resources to aid them with their outreach to
civic groups, PTA’s and other community organizations.
Prior “Strategic” Studies
In the mid‐1980s, the County Board established a commission of community representatives to study
the future vision of Arlington County. The group was charged with identifying challenges to the
Draft 2 - Page 10-MU

Chapter 1 – Introduction and Background
attainment of that vision and to develop recommendations and strategies that could help leverage
achievement of the type of community envisioned for the year 2000 and beyond. The “Future of
Arlington – the Year 2000 and Beyond” report documented the findings and recommendations. This
report laid out many issues that also face Arlington today. Then, school enrollment was declining and
development was not happening at a fast enough pace. The population was changing and the County
government was not quite sure how it would meet the future demands. The community’s report
highlighted numerous ideas that should be at the forefront of planning in the years to come and it
articulated the Committee’scommission’s hope that its work would inspire others to take more interest
in community planning and other initiatives to improve Arlington in the 21st Century. In 2000, the
County Board chartered a new group to assess the progress made by the County since the 1986 study.
The Commissioncommission evaluated accomplishment of the recommendations made in the 1986
report and found that substantial progress had been made on the majority of the recommendations. In
addition, the Commissiongroup sought comments from other commissions, boards, advisory groups and
individuals to hear their views on the state of the County. Using that input, the group developed the
County’s Vision Statement.
Other, Overlapping Studies Underway [section to be revised as other studies progress]
When the County Board and School Board established the Community Facilities Study, several other
County and School initiatives were already in the pipeline or were underway. The two Boards
recognizeddecided that those processes would have toshould continue simultaneously with this study
on their own respective tracks. Although many of thesethe issues being examined with the specific
initiatives overlap with those being considered in the Community Facilities Study, the Study Committee
did not delve into or duplicate the specific topics or recommendations being discussed as part of those
studies. The Community Facilities Study Committee members and staff team and committee members
involved in all projects have remained informed about each respective process. The following projects
were underway concurrent with the Community Facilities Study:
Affordable Housing Master Plan: The County Board initiated the Affordable Housing Study in 2012 to
evaluate existing policies, assess current programs and resources, and identify needs and gaps in
provisions for affordable housing – housing for households with low and moderate income levels,
generally at or below 60% of the Area Median Income (AMI). Sixty percent of AMI today is $64,480 for
a household size of four. This body of work would culminate with adoption of a new, 11th element of
the County’s Comprehensive Plan. In partnership with staff, the County Manager appointed a 19‐
member working group to share the community’s affordable housing vision and provide guidance on the
proposed goals and recommendations. In September, 2015, this body of work culminated with the
adoption of a new, 11th element of the County’s Comprehensive Plan. In the past, the County’s policies
for affordable housing were guided by goals and targets developed in collaboration with the Citizen
Advisory Commission on Housing. The new plan proposes three goals that focus on housing supply,
access, and sustainability. A companion document to the new master plan, the implementation
framework, includes information on new and existing strategies—such as financial assistance, tools for
construction, land acquisition, building rehabilitation, land use regulations and incentives, and housing
Draft 2 - Page 11-MU
Chapter 1 – Introduction and Background
programs to assist low‐income and at‐risk populations—that could be used separately or in combination
to achieve the goals of the plan.
Public Spaces Master Plan: A process to update the Public Spaces Master Plan, last updated and
adopted in 2005, was started in 2015 by the Department of Parks and Recreation. (DPR). This element
of the County’s Comprehensive Plan guides the public space system at the highest level and provides
goals and strategies for the future for the full breadth of public spaces, including all of the parks, natural
resources and recreational needs that make up that system. Other supporting plans and policies, such
as sector plans, joint use agreements, and park master plans, all stem from this overarching vision and
policy document. As with all updates to elements of the Comprehensive Plan, a community
participation plan will engage the public and seek feedback on the stated goals and objectives, current
and future facility needs, priorities, and implementation strategies. The County Manager established an
advisory committee to work closely with staff through this process on the civic engagement activities
and communication plans and to provide feedback on analysis and recommendations. The process,
expected to be completed at the end of 2016, will culminate with the adoption of an updated plan to
guide policies, projects, land acquisition for park and open space needs, and other strategies for the
next 10 years and to identify other, longer‐term goals and initiatives. The Plan is updated approximately
every 10 years.
Lubber Run Community Center: Built in 1956, this community center is the oldest in the Arlington
inventory. The facility does not meet ADA accessibility standards and does not meet the needs for
indoor space and outdoor amenities. Funding to replace the center was included in the County’s 2015‐
2024 CIP, although initially identified in the FY1999‐FY2000 CIP. The new center will provide a full
complement of recreational, social and learning activities for all age groups. The Department of Parks
and Recreation (DPR)DPR along with the Department of Environmental Services (DES) are leading this
effort, which involves an extensive planning process and community collaboration. The conceptual
planning and community engagement is expected to take place through 2016, including a review
process with the Public Facilities Review Committee (PFRC) and building construction is anticipated from
2017 to 2019.
Fire Station #8 Siting Process: The County embarked on a process earlier this year to determine a future
location for Fire Station #8, currently located on Lee Highway west of Glebe Road. Meetings with the
public are occurring to discuss this project., and a new task force has been established to review
candidate sites and make a recommendation on a preferred location and type of facility by March 2016.
Funding for the relocation and construction of a new facility was included in the 2015‐2024 CIP. The
County identified this need previously to improve emergency responses for neighborhoods that are
currently outside of the County’s preferred four‐minute response time radius. Once a site for the fire
station is determined by the County Board, a master planning process will be undertaken with a review
process through the Public Facilities Review Committee (PFRC).
Draft 2 - Page 12-MU

Chapter 1 – Introduction and Background
More Seats For Students ProgramInitiative: Stemming from the last CIP adopted by the School Board in
2014, the Schools facility staff are working on several fronts to increase capacity for a growing student
body at all three educational levels: elementary seats in the southern part of the County, and middle
school seats in the northern part of the County, and to be achieved in the near term; and, high school
seats to be achieved later in the 10‐year planning horizon. These initiatives include the following:
Stratford Middle School: At its December 18, 2014 meeting, the School Board voted to renovate
and build an addition at the Stratford School site to establish a new neighborhood middle school
with 1,000 seats. Stratford currently houses the Stratford Program and the H‐B Woodlawn
Program. The School Board also voted to construct a new school at the Wilson School site,
which would accommodate the relocated H‐B Woodlawn and Stratford programs. The Building
Level Planning Committee (BLPC) process and the PFRC processes are evaluating the proposed
renovation of and addition to the Stratford School building. The BLPC and PFRC processes are
both in the conceptualconcept design stage and major topics such as building placement, site
access and circulation, parking, and historic preservation are under discussion. The project
budget includes 1,000 seats, however there is consideration being given to accommodating
1,300 seats at this site in the future.. The School Board is expected to consider selectionapproval
of a conceptualthe concept design at its September 24 public hearingin November 2015.
Wilson School: As noted above, the School Board voted to build a new secondary school with
up to 775 seats at the Wilson School site. This proposed school will house the H‐B Woodlawn
and Stratford programs currently located in the Stratford School. This site was part of the area
studied by the County as part of the Western Rosslyn Area Planning Study, which culminated
with a County Board‐adopted area plan. in July 2015. The extensive public facilities in this small
geography – the future Wilson School, along with its associated outside open spaces, a new
Rosslyn Highlands Park, and a new Fire Station #10 – will make this a community hub along the
Wilson Boulevard corridor. At this time, APS is continuing the BLPC and PFRC processes to
prepare and review preliminary designs. The School Board is expected to consider approval of
the concept design in November 2015.
South Arlington Working Group: : In May 2015, the School BoardAPS launched a process that
responded to evaluate and analyze site options forthe School Board’s goal of opening a new,
725‐seat neighborhood elementary school in the southern portion of South Arlington. A
working, preferably by the fall of 2019. The group was formed to assistcharged with analyzing
site options and providing input on related program moves with the School Board as it
determines a preferred site for the planned 725‐seat school by December 2015. To meet the
increasing school enrollment, this new school is targeted for completion by September 2019.
overall goals of addressing crowding and enhancing instructional opportunities in South
Arlington elementary schools The working group has benefitted from the discussions occurring
as part of the Community Facilities Study in particular those related to the siting of new public
facilities. Once a site is determined by the School Board, and if County owned approved by the
Draft 2 - Page 13-MU

Chapter 1 – Introduction and Background
County Board, the project would shift to the BLPC and PFRC processes, similar to those noted
above.
The School Board established the structure of the Building Level Planning Committee (BLPC) was
established by the School Board to assist the Facilities and Operations staff and to advise the School
Board on each major capital construction/renewalrenovation project. Building Level Planning
Committees work collaboratively with Design and Construction Services of the Facilities and Operations
Department of the Arlington Public Schools to planA separate BLPC is established for each major
renewal and newcapital construction projects/renovation project.
The Public Facilities Review Committee (PFRC) was established by the County Board as a mechanism for
advisory commissions and committees to have timely input on the development of County facility and
schoolsSchools projects prior to public hearings. Its mission is to ensure that the highest quality of land
use planning, design, transportation planning and other important community aspects are incorporated
into civic projects. PFRC is a standing committee that meets as needed to review each project.
Recent Accomplishments
County and APS Improvements
As the Community Facilities Study progressed and County and School staff increased their level of
collaboration, each organization took steps to increase transparency, share information, and improve
facility planning efforts. Some of the accomplishmentschanges that have already been completed or are
in processmade as a result of this study are described below.listed in Appendix X.
Schools and County CollaborationSchools are entering a second phase of work with the
consultant team that reviewed the school projection and population forecast methodologies as
part of the Community Facilities Study. This second phase will test out proposed refinements to
the methodologies. This work is expected to wrap up after the Community Facilities Study is
complete, and the results will be shared with the County Board, School Board, and the public.
County staff have assembled a detailed database of housing units with a variety of additional
housing characteristics and have shared this data with Schools staff. Schools staff will use this
data to monitor and analyze school enrollment trends for different housing characteristics. The
consultant team will perform an initial analysis and provide recommendations for future process
improvements for enrollment projections.
The County and Schools have completed a Memorandum of Understanding that will allow
Schools staff to share aggregated student data with County staff for planning purposes while
protecting individual student privacy.
The County and Schools have developed a timeline for consistently exchanging housing,
development, and demographic data on an annual basis.
The County updated the data files used in the APS student information system to determine
school boundaries by address.
Draft 2 - Page 14-MU
Chapter 1 – Introduction and Background
Schools will provide County staff with estimates of the number of students that will be
generated by Site Plan, Use Permit, and Form Based Code applications.
Increasing Transparency
Schools are preparing an Annual APS Projections Report that will provided details about
projections. The report will incorporate “Enrollment over Time” which was requested by the
Study Committee. In preparation for this first report, a draft of using the 2014 projections is
included as an appendix to this document [pending].
Schools are preparing to move to a new web hosting site that will go live for the 2016‐17 school
year. Over the course of the next year, APS will align the website resources with the Annual
projections report.
The County has created a web page that details its process for forecasting the County’s
population and employment.
Other Accomplishments
At the recommendation of the consultant team, the APS Director of Facilities Planning attended
the Population Association of America Annual Meeting earlier this spring.
The APS Department of Facilities and Operations has also hired additional staff to increase its
capacity to project student enrollment and plan for new facilities.
The Department of Community Planning, Housing and Development launched initiatives to
provide more efficient planning and permitting review processes.
The Arlington Economic Development office was allocated additional funding in the FY 2016
Budget for marketing and promotional purposes to reduce office vacancy levels.
The Arlington County Zoning Ordinance was amended in 2015 to lengthen the duration of short‐
term indoor and outdoor events and activities.
Draft 2 - Page 15-MU
Chapter 2 – Public Facility Basics
Chapter 2 – Public Facility Basics
To set the stage for the Committee’s discussion of challenges facing Arlington in the future and its ability
to meet the community’s public facility needs in Chapter 3, this chapter reviews the basic elements that
guide the planning, funding, construction and operations for Arlington’s public facilities, and addresses
the specific deliverables set out in the Charge for this study.
Demographic forecasts and projections
The facility inventory, planned improvements, and projected needs
Revenue and capital funding programs – a look at future revenues and best practices in public
facility finance, and
Siting public facilities
Draft 2 - Page 16-MU

Chapter 2 – Demographic Forecasts and Projections
Demographic Forecasts and Projections
The stated purpose of the Community Facilities Study is to “build a consensus framework regarding
future revenue and facility needs” in the context of Arlington’s projected economic and demographic
growth. The Study Committee is specifically charged with “examining and, to the extent necessary,
reconciling existing demographic and economic forecasts for 5, 10, and 20 years out to produce a single
set of forecasts for both the County and Schools.” The Study Committee is particularly interested in
issues related to generational changes and collaboration between the County and Schools on population
forecasts and school projections. Appendix 2 is aThis report’s companion document providesing more
detailed information on Arlington’s Demographics, Forecasts, and Projections.
Demographics and Recent Trends
National and Regional Context1
The Study Committee received a presentation from Dr. Lisa Sturtevant, Vice President of Research at the
National Housing Conference, on key national and regional demographic trends and how these trends
may affect Arlington. Dr. Sturtevant discussed how the recession and recovery have affected different
generational groups. New household formation among the millennial generation (born 1982 to 2000)
has lagged but is beginning to pick up. Within the region, millennials were driving the growth in
Arlington and Washington D.C., but recent trends indicate that this population may be shifting to
Fairfax, Montgomery, and Prince Georges Counties. The vast majority of baby boomers (born 1946 to
1964) are currently living in single family homes in the suburbs. Dr. Sturtevant expects that as this
generation leaves the workforce, many will downsize to smaller homes, opening the suburban single
family homes to millennials as they form families.
Arlington’s Population and Housing2
As of January 1, 2015, Arlington had an estimated population of 216,700, reflecting an increase of 4.4%
since 2010. On average, the County’s population has grown about 1% per year since 2000. Figure X
shows changes in the population’s breakdown by race and ethnicity between 2000 and 2010. The Asian
population increased by 22%, and the Non‐Hispanic White population increased by 16%, and the %
during this time period. The Hispanic/Latino population decreased by 11% during this time period. %,
and the Black or African American population decreased by less than 1%.
1 Presentation on Regional Economic and Demographic Indicators, March 11, 2015, CFS Meeting 2 Data and Statistics in this section come from the 2015 PROFILE (Urban Design and Research Section, Arlington County Department of Community Planning, Housing and Development) and County staff presentations at the March 11 and 25, 2015, CFS Meetings.
Draft 2 - Page 17-MU
Chapter 2 – Demographic Forecasts and Projections
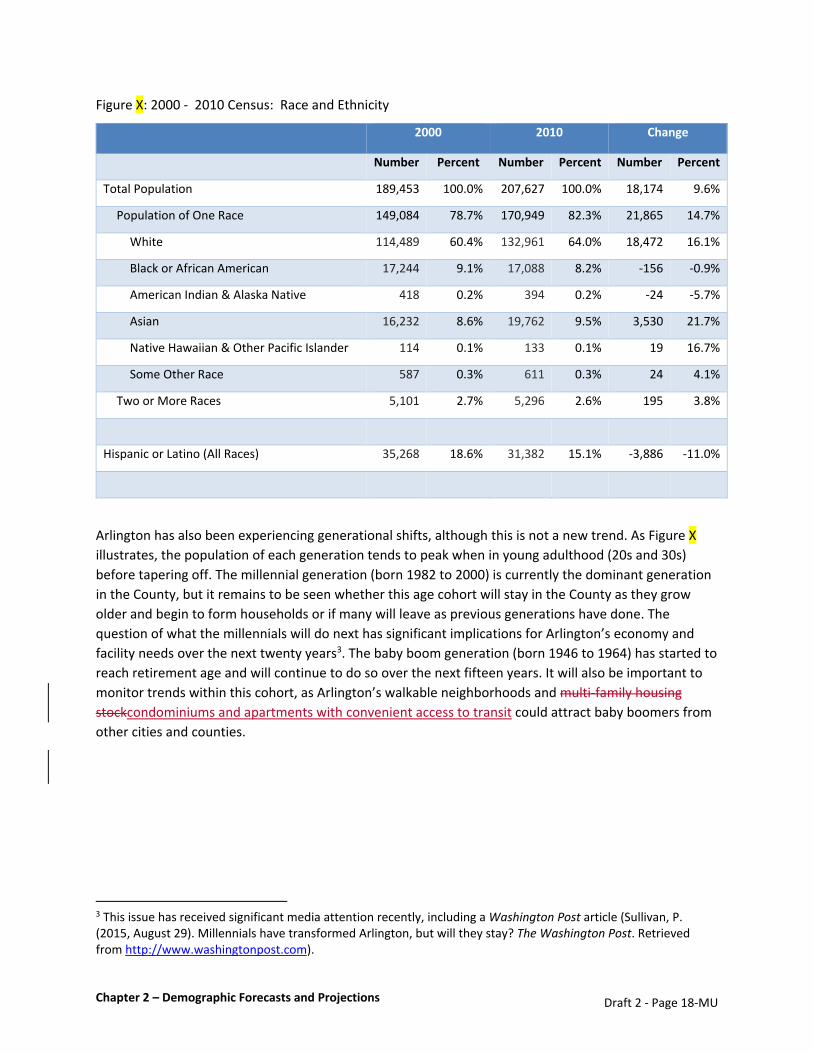
Figure X: 2000 ‐ 2010 Census: Race and Ethnicity
2000 2010 Change
Number Percent Number Percent Number Percent
Total Population 189,453 100.0% 207,627 100.0% 18,174 9.6%
Population of One Race 149,084 78.7% 170,949 82.3% 21,865 14.7%
White 114,489 60.4% 132,961 64.0% 18,472 16.1%
Black or African American 17,244 9.1% 17,088 8.2% ‐156 ‐0.9%
American Indian & Alaska Native 418 0.2% 394 0.2% ‐24 ‐5.7%
Asian 16,232 8.6% 19,762 9.5% 3,530 21.7%
Native Hawaiian & Other Pacific Islander 114 0.1% 133 0.1% 19 16.7%
Some Other Race 587 0.3% 611 0.3% 24 4.1%
Two or More Races 5,101 2.7% 5,296 2.6% 195 3.8%
Hispanic or Latino (All Races) 35,268 18.6% 31,382 15.1% ‐3,886 ‐11.0%
Arlington has also been experiencing generational shifts, although this is not a new trend. As Figure X
illustrates, the population of each generation tends to peak when in young adulthood (20s and 30s)
before tapering off. The millennial generation (born 1982 to 2000) is currently the dominant generation
in the County, but it remains to be seen whether this age cohort will stay in the County as they grow
older and begin to form households or if many will leave as previous generations have done. The
question of what the millennials will do next has significant implications for Arlington’s economy and
facility needs over the next twenty years3. The baby boom generation (born 1946 to 1964) has started to
reach retirement age and will continue to do so over the next fifteen years. It will also be important to
monitor trends within this cohort, as Arlington’s walkable neighborhoods and multi‐family housing
stockcondominiums and apartments with convenient access to transit could attract baby boomers from
other cities and counties.
3 This issue has received significant media attention recently, including a Washington Post article (Sullivan, P. (2015, August 29). Millennials have transformed Arlington, but will they stay? The Washington Post. Retrieved from http://www.washingtonpost.com).
Draft 2 - Page 18-MU

Chapter 2 – Demographic Forecasts and Projections
Figure X: Arlington Population by Generation, 1980 – 2010
Other recent trends in Arlington’s population and housing:
The average household size for single family homes has increased since 2000. Single family
owner‐occupied housing increased by 0.3 persons per household, and single family renter‐
occupied housing increased by 0.6 persons per household. Household sizes for other housing
types remained relatively stable.
The fastest growing age cohorts between 2010 and 2013 since 2010 arewere 35 to 44, Over 65,
and Under 5.
The estimated percentage of households with children under age 18 in 2013 was 20.5%. This
percentage has remained relatively consistent since 2000 (19.3%).
64% of Arlington’s housing supply is multi‐family, and 94% of the net new housing built over the
last five years is also multi‐family.
The County’s single family neighborhoods are changing, as older houses are torn down and
replaced with new ones and existing houses are expanded through additions. These trends are
significant as the majority of school enrollment growth since 2005 has been students living in
single family detached housing.
0
10,000
20,000
30,000
40,000
50,000
60,000
70,000
80,000
1980 1990 2000 2010
Pre 1946 Baby‐Boomers Generation X Millennials
25‐44 years
19‐35 years 10‐28 years
Draft 2 - Page 19-MU

Chapter 2 – Demographic Forecasts and Projections
Real estate assessments for the average Arlington residence have also changed significantly,
from $202,770 in 2000 (about $280,000 in 2015 dollars) to $579,800 in 2015.
Since 2000, the percentage of Arlington households with incomes over $200,000 has increased
significantly (see Figure X)). Note that the Consumer Price Index increased by approximately
35% between 2000 and 2013, meaning that $100,000 in the year 2000 is equivalent to
approximately $135,000 in 2013 dollars.
Figure X: Arlington Household Income, 2000 ‐ 2013
Arlington’s School Enrollment4
Arlington Public Schools enrollment has seen major changes over the last 50 years. The timeline below
addresses some major milestones in fall enrollment.
In 1963 enrollment peaked with 26,927 students.
From 1964‐1967 enrollment remained above 26,000.
In 1968 enrollment decreased and over the next 20 years, enrollment fell by an average of 3%
each year.
1988 enrollment hit a low of 14,344 students.
Over the next 14 years enrollment climbed steadily, growing on average by 2% each year, to a
total of 19,140 in 2002.
4 Data and Statistics in this section come from the APS staff presentations at the March 11 and 25 and October 14, 2015, CFS Meetings.
0.0%
2.0%
4.0%
6.0%
8.0%
10.0%
12.0%
14.0%
16.0%
18.0%
20.0%
Less than
$10,000
$10,000‐$14,999
$15,000‐$19,999
$20,000‐$24,999
$25,000‐$29,999
$30,000‐$34,999
$35,000‐$39,999
$40,000‐$44,999
$45,000‐$49,999
$50,000‐$59,999
$60,000‐$74,999
$75,000‐$99,999
$100,000‐$124,999
$125,000‐$149,999
$150,000‐$199,999
$200,000 or more
2013 2000
Draft 2 - Page 20-MU
Chapter 2 – Demographic Forecasts and Projections
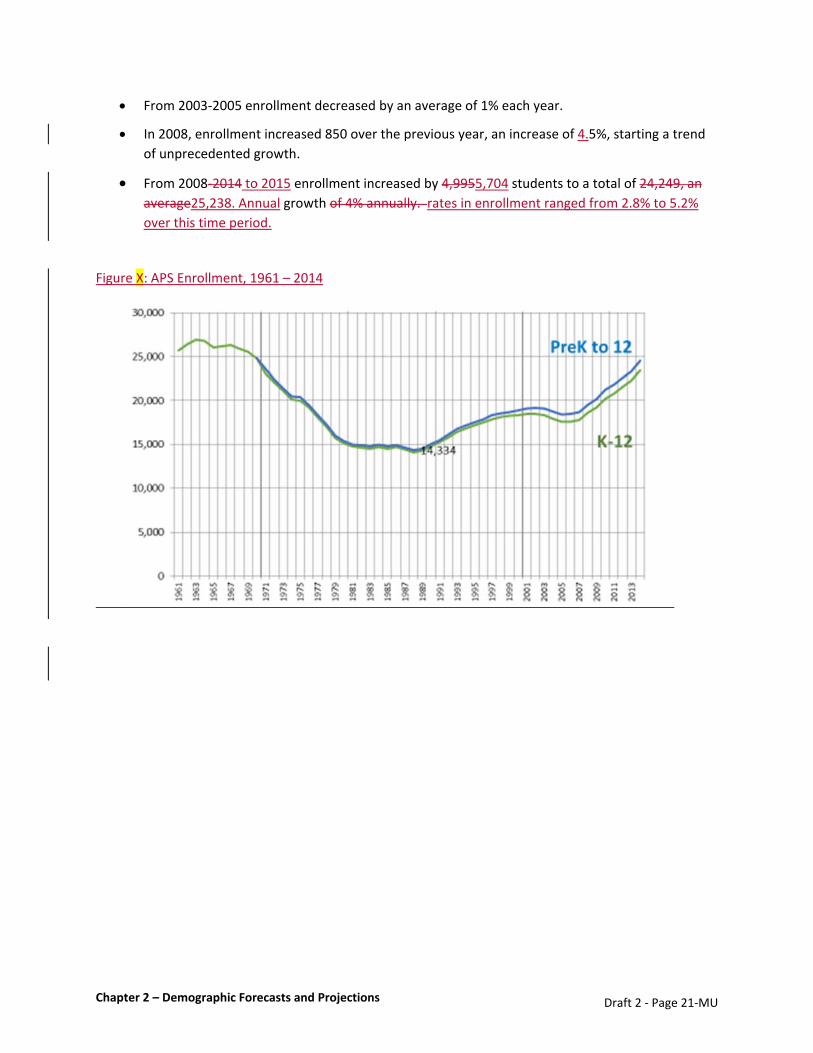
From 2003‐2005 enrollment decreased by an average of 1% each year.
In 2008, enrollment increased 850 over the previous year, an increase of 4.5%, starting a trend
of unprecedented growth.
From 2008‐2014 to 2015 enrollment increased by 4,9955,704 students to a total of 24,249, an
average25,238. Annual growth of 4% annually. rates in enrollment ranged from 2.8% to 5.2%
over this time period.
Figure X: APS Enrollment, 1961 – 2014
Draft 2 - Page 21-MU

Chapter 2 – Demographic Forecasts and Projections
Figure X: Annual Change in APS Enrollment, 2001 ‐ 2015
Year Total Enrollment, PreK‐12
% Change over Previous Year
September 2015 25,238 +2.9%
September 2014 24,529 +5.2%
September 2013 23,316 +3.1%
September 2012 22,613 +3.5%
September 2011 21,841 +2.8%
September 2010 21,241 +5.0%
September 2009 20,233 +3.6%
September 2008 19,534 +4.5%
September 2007 18,684 +1.3%
September 2006 18,451 +0.2%
September 2005 18,411 ‐1.8%
September 2004 18,744 ‐2.0%
September 2003 19,120 ‐0.1%
September 2002 19,140 +0.2%
September 2001 19,097 +1.1%
The decline in school enrollment starting in late 1960s resulted in consolidation and reorganization of a
number of APS schools and programs. In 1975 Schools, APS closed Madison Elementary School, the first
closure due to shrinking enrollment. In the following years, six more elementary schools and two junior
high schools closed. Some of the closed schools were turned over to the County government (e.g.,
Madison, Fairlington). Some of the schools that closed due to shrinking enrollment, were reopened as
schools when enrollment increased in the 1990s (e.g., Hoffman‐Boston, Gunston).
School Enrollment by Housing Type5
In the 2013‐14 school year, more than half of the 22,136 students enrolled in APS lived in single family
homes. Twenty‐two percent of students lived in garden apartments (walk‐up apartment buildings), 10%
lived in apartment buildings with elevators, 7% lived in condos (any type) and 6% lived in a duplex or a
townhome.
5 Data and Statistics in this section come from the APS staff presentations at the March 11 and 25, 2015, CFS Meetings.
Draft 2 - Page 22-MU

Chapter 2 – Demographic Forecasts and Projections
Figure X Sept. 2013: APS K‐12 Enrollment by Housing Type, September 2013
As part of the projection process, APS computes a Student Generation Factor (SGF) to estimate the
number of students that will be generated by future residential development approved by Arlington
County. The SGF is a mathematical representation of the relationship between the number of students
enrolled at APS on September 30th for a given year and the number of housing units in Arlington
County. The SGF is calculated for different housing types (e.g., single family detached, townhouse,
rental garden apartments). For the projection process, the SGF for each housing type is used to
estimate the future student yield for housing units that are approved but not yet built.
In fall of 2013, the SGF for single family detached houses was 0.42. This means that for every 100 single
family detached houses in Arlington, 42 students attended APS.
Over the past decade, there has been a shift in the housing type generating the most students. In 2004,
duplexes had the highest SGF; today single family homes have the highest SGF. The SGF for multifamily
apartment and condo units is relatively low, but since 2004 student generation has been increasing for
most of these housing types. Because
Over the past decade, student generation factors have increased for all housing types except duplexes
and elevator condominiums. This increase is especially pronounced among single family detached
housing, which accounted for 57% of student growth between 2005 and 2013 even though these houses
were only 13% of the net housing growth over the same time period. However, because 94% of the net
new housing built over the last five years is in multi‐family units, staff will need to closely monitor future
changes in the SGF by these housing typesfor apartments and condominiums.
Single Family
Detached 55%
Duplex 4%
Apt. Garden 22%
Townhouse 2%
Condo ‐ Garden 5% Apt.
Elevator 10%
Condo ‐ Elevator
2%
Draft 2 - Page 23-MU

Chapter 2 – Demographic Forecasts and Projections
Table Figure X. : APS K‐12 Student Generation Factors by Housing Type, 2005 and 2013
Housing Type 2005 APS
Students
2005 County‐wide Units
2005 SGF 2013 APS
Students
2013 County‐wide Units
2013 SGF
Change in Students, 2005 ‐ 2013
Single Family Detached
9,807 27,422 0.36 12,256 28,909 0.42 2,449
Duplex 1,015 2,242 0.45 859 2,261 0.38 ‐156
Townhouse 348 3,639 0.10 537 4,063 0.13 189
Total Single Family 11,170 33,303 0.34 13,652 35,233 0.39 2,482
Apartment – Garden 4,123 16,745 0.25 4,751 16,236 0.29 628
Condo – Garden 632 9,465 0.07 1,000 11,134 0.09 368
Apartment – Elevator
1,507 24,743 0.06 2,212 28,024 0.08 705
Condo – Elevator 427 10,748 0.04 521 15,690 0.03 94
Total Multi‐Family 6,689 61,701 0.11 8,484 71,084 0.12 1,795
School enrollment is nearing to levels last seen in the 1960s and is expected to grow by another 7,800
students over the next decade. The significant increases that started in 2008 have made it difficult for
APS to increase capacity to keep pace with enrollment.
Forecasts and Projections6
The terms forecast and projection are both calculations of future conditions with one important
distinction. A projection applies statistical techniques to extrapolate current trends. A forecast is a
projection that accounts for policy decisions. Arlington’s predicted school enrollment numbers are
projections because they use current enrollment and recent trends to determine future enrollment.
Arlington’s predicted population and employment numbers are forecasts because projections based on
current data and trends are modified to account for the County’s General Land Use Plan, an adopted
policy document that guides decisions on future growth.
Arlington County produces 30 year forecasts of population, households, housing units, and employment.
The County forecasts future development based on the County’s plans and policies. Factors, such as
average people per household, are applied to future development to population, housing units,
households, and employment. These forecasts are provided to the Metropolitan Washington Council of
6 Forecasts and projections in this section come from the County and APS staff presentations at the March 11, 2015, CFS Meeting.
Draft 2 - Page 24-MU

Chapter 2 – Demographic Forecasts and Projections
Governments and are required by the Clean Air Act. The primary purpose of the County’s forecasts is to
provide inputs for regional transportation modeling, but they are also used by the public and private
sectors for a variety of activities, including planning for public facilities. The forecasts are updated ason
an annual basis to incorporate major land use plans are approved by the County Board, typically on an
annual basis. Figure X shows the County’s most recent population and employment forecasts, to the
year 2040.
Figure X: Arlington Population and Employment Forecasts (Preliminary MWCOG Round 8.4)
Arlington Public Schools produce 10 year projections of student enrollment. It uses a grade progression
ratio method, which is the methodology used by most school districts in the United States. Grade
progression ratio projects the future student population as current students advance from one grade to
the next. Schools’ projections are used to generate budget costs, determine staffing levels, and predict
future school facility needs. The projections are updated twice per year. Figure X shows Schools’ student
enrollment projections through the 2024‐2025 school year.
150,000
175,000
200,000
225,000
250,000
275,000
300,000
325,000
2010 2015 2020 2025 2030 2035 2040
EmploymentPopulation
Draft 2 - Page 25-MU

Chapter 2 – Demographic Forecasts and Projections
Figure X: Arlington Public Schools 10 year Student Enrollment projections (Fall 2014)
At the initial Community Facilities Study meetings, Study Committee and Resident Forum members
expressed concern that the County and Schools are using different projection and forecast numbers for
their planning efforts. This is partly true because the County and Schools are projecting and forecasting
different things for different purposes. The County forecasts future development and the total County
population. Schools project a subset of the total population, children attending public schools. However,
the County and Schools do use the same housing development data as part of their methodology. Figure
X details the different inputs used by the County and Schools to generate their unique forecast and
projection outputs.
Figure X: Comparison of County Forecast and APS Enrollment Projection Methodologies
Draft 2 - Page 26-MU
Chapter 2 – Demographic Forecasts and Projections
CHANGE “UNDER 18” IN GRAPHICS TO “SCHOOL AGE”
The significant growth in school enrollment in recent years, combined with projections that the pace of
growth will continue over the next decade, led to concerns within the community about the accuracy of
the County’s and Schools’ forecasts and projections. The County and Schools brought in a team of
consultants, Statistical Forecasting and RLS Demographics, to review and evaluate the County’s and
Schools’ methodologies7. The consultants concluded that the forecast and projection methodologies
employed by the County and Schools are valid and appropriate for Arlington. The consultants also
determined that two different datasets and methodologies are necessary to meet different purposes.
While the consultants validated the forecast and projection methodologies, they did recommend
additional steps that could be taken to further improve accuracy, including the following:
Developing annual reports and improving the web site (Schools) and comprehensively
documenting the forecast methodology (County).
The County and Schools could refineRefining school enrollment projections by collecting and
analyzing housing data such as unit type, number of bedrooms, and length of homeownership.
Monitoring emerging trends in multi‐family housing will be important to projectand potential
changes in student generation rates.
Supplementing the County’s forecasts with a cohort‐component and demographic analysis,
which could help predict future births and students by focusing on the County’s population of
women of child‐bearing age and fertility rates.
The County and Schools generally agreed with the consultants’ recommendations, and they are in the
process of implementing the short term recommendations, such as improving transparency and
accessibility of information. This in‐progress or completed work is described in Appendix 2. For the
longer term recommendations, the County and Schools are entering a second phase of work with the
consultants that will test out proposed refinements to the methodologies. That work is expected to
wrap up after the Community Facilities Study is complete. The results of this second phase will be
shared with the County Board, School Board, and the public.
7 Statistical Forecasting LLC and RLS Demographics Inc. (2015). A Review of Projection Methodologies for the Arlington County Government and Arlington Public Schools. Retrieved from http://www.arlingtonva.us/
Draft 2 - Page 27-MU

Chapter 2 – Facility Inventory and Projected Needs
Facility Inventory and Projected Needs
The Committee was charged with identifying Arlington’s key facility assets (an inventory of existing County and School assets) and future needs in the next 5, 10, and 20 years based on demographic trends.
For the purposes of this report, a community facility is defined as land, buildings or infrastructure that is or will be owned, operated or leased by Arlington County or Arlington Public Schools, or that is otherwise developed or managed by them in partnership with a private or non‐profit entity, to provide community services and/or to support a specific County or School function. Community facilities are developed to support a wide range of services and functions which usually fall into one or more of the following general areas:
Administration
Human Services
Libraries
Operations and Storage
Parking
Parks, Recreation, and Cultural
Public Safety
Schools and Education
Transportation
Utilities and Stormwater
The Study Group Committee felt it was important to define “community facilities” to provide boundaries
for the needs assessment and facility prioritization efforts. As defined for this study, affordable housing
would only be considered a community facility when it is a joint use on publicly‐owned land such as
Arlington Mill Residences and Arlington Mill Community Center.
The Committee also recognizes that public facilities are provided by the Federal and State government, as well as interjurisdictional organizations such as NOVA Parks and the Washington Metropolitan Area Transit Authority (Metro). Private and non‐profit organizations in Arlington also provide essential services to the public, such as health care, but these privately‐operated facilities are not considered part of the Community Facilities Study.
Facility Inventory Overview
Inventory Overview
Although Arlington’s history can be traced back to the late 1700s when it was originally part of the 10‐mile square surveyed for the Nation’s Capital, Arlington County’s substantive development began in the early 1900s and grew more rapidly in the 1940s and 1950s with single family neighborhoods, apartment complexes, and commercial development to support the booming Federal government workforce. As the population began to grow, schools, community centers, fire stations, fleet maintenance facilities, and parks along stream valleys and railroad rights‐of‐way were funded and constructed to meet the essential community needs. Numerous facilities dating to those early days still exist today and remain in use. As the population grew steadily through the 1960s, additional public facilities were constructed.
While the County and Schools have since reconstructed facilities and built additions and new facilities to expand capacity and meet essential and discretionary needs, minor and major renovation projects are stretching the useful life of many buildings. The County and Schools are faced each year with systematically determining whether to renovate or reconstruct its aging facilities. In recent years, renovations and maintenance of existing County facilities have been a priority for the County Board,
Draft 2 - Page 28-MU
Chapter 2 – Facility Inventory and Projected Needs
while the School Board has started to invest in new construction to best meet the needs of the student population. See below for discussion of facility projects currently included in the County and APS Capital Improvement Plans.
Appendix 3 provides andan inventory orof facilities operated by the County and/or Schools. Most facilities are owned by either the County or Schools, which maintain separate real estate holdings. However, some facilities are leased. In some instances, multiple facilities are located on the same property or building, such as the Thomas Jefferson Middle School and Community Center or the Aurora Hills Branch Library and Community Center. The public facilities are generally distributed as follows:
Arlington County Facilities
• 8 libraries • 24 recreation/cultural centers • 13 human services facilities • 10 fire stations • 4 administrative offices and/or complexes • 23 facilities for County operations and 20 facilities for County storage • 8 parking garages • Over 100 County parks (see Public Open Space for further discussion)
Approximately 1,000 lane miles of roadways and associated streetlights, traffic signals, and parking meters
Sidewalks and street trees
Bicycle facilities (lanes, cycle tracks, parking, Capital Bikeshare stations)
Transit facilities, including 244 bus shelters
Utilities including water mains, sanitary sewers, storm sewers, fire hydrants, stormwater management facilities, and the ConnectArlington fiber‐optic network
Arlington Public Schools Facilities
• 23 elementary schools • 5 middle schools • 3 high schools • 4 facilities that house one or more instructional programs: H‐B Woodlawn/Stratford, Reed,
Career Center, Langston • Other facilities: Education Center, Planetarium, Facilities Warehouse, Outdoor Lab, Syphax
Education Center, and the Marshall Building
Facilities serving the public are generally evenly distributed around the County, making them convenient destinations within neighborhoods. Most of these facilities, built at a time when land was more readily available in the County, are single purpose, providing a discreet core function. Although Thomas Jefferson is an early example of a joint facility, the County and Schools have explored joint use facilities more regularly in the past few years. Joint use partnerships have occurred between the County and Schools as well as partnerships among different County departments or with private entities to gain more land and operational efficiencies. The Westover‐Reed library and school; the Shirlington Library and ShirlingtonSignature Theater; and the Arlington Mill Community Center and Arlington Mill Residences are examples of public facilities that use public land creatively and offer multiple uses. The Arlington Mill Residences is a project built by a non‐profit entity through a long term land lease on public land, with features such as underground parking shared with the County. Virtually all schools are
Draft 2 - Page 29-MU

Chapter 2 – Facility Inventory and Projected Needs
shared use facilities, with the community having access to and use of fields and school rooms outside of core instructional times.
In addition to the facilities that are most obvious to the general public, substantial infrastructure investments and a core set of facilities – those supporting the County’s and Schools’ “back of house” needs – are required to operate the public facilities as well as sustain the needs of residents, employees, and visitors in Arlington on a daily basis. The water pollution control plant, the street maintenance fleet storage and maintenance yards, bus storage, transit facilities and bus shelters, police and fire training facilities, among others, are examples of these facilities which typically go unnoticed because the County delivers service every day including clean drinking water, waste water treatment, reliable transit service, well‐lit and navigable streets, refuse and recycling collection, school bus transportation, and public safety and emergency services. These facilities have storage and maintenance needs that are land‐intensive, and often the operations can require activity day and night, involve noisy machinery, and visibly expose storage sheds, heavy equipment, and construction and building stockpiles. All communities have these needs. Arlington is no different. However, with limited land area in total and very little vacant land expanding these back of house facilities to keep pace with a growing population has become increasingly difficult.
Land
Arlington County occupies approximately 26 square miles, making it one of the smallest counties in the nation. That land is divided as:
14.4 square miles in private ownership;
6.0 square miles in public rights‐of‐way;
3.5 square miles owned by other governmental entities; and
only 2.2 square miles accounting for County and School owned land.
Of the 2.2 square miles, approximately 62 percent is occupied with County parks, 25 percent occupied by Schools, and 12 percent occupied by other County services, such as fire stations, libraries, and the back of house facilities at the Trades Center complex.
Draft 2 - Page 30-MU
Chapter 2 – Facility Inventory and Projected Needs
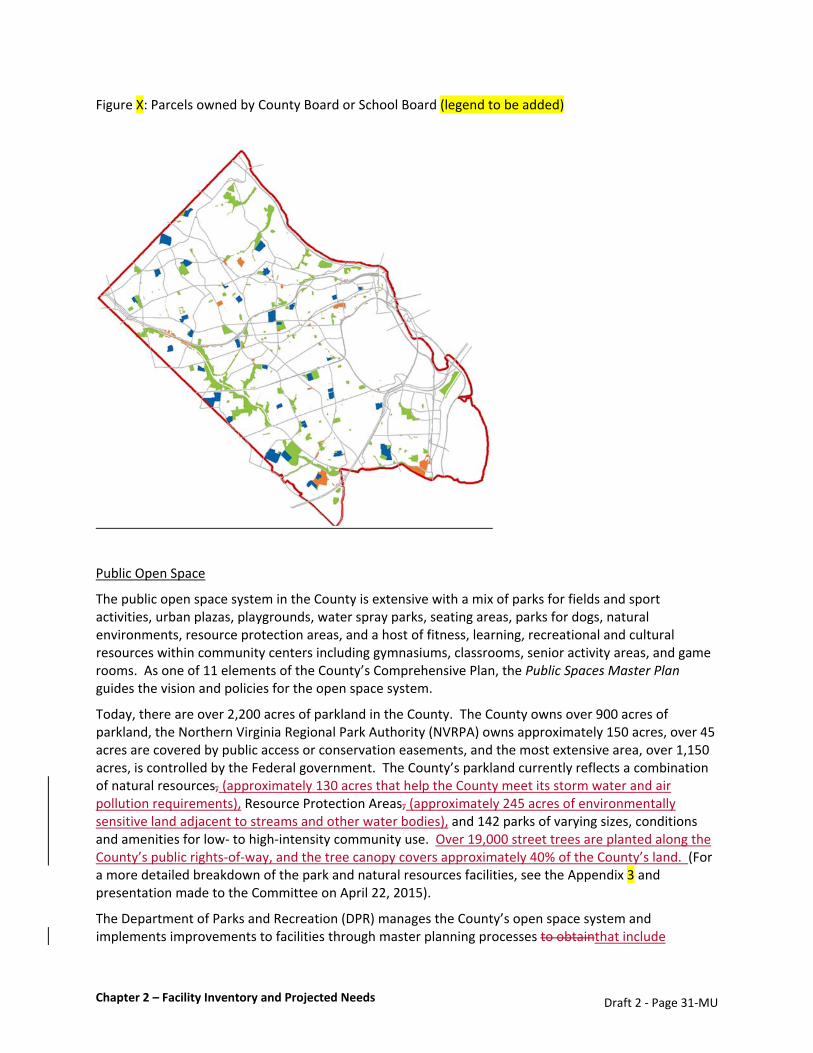
Figure X: Parcels owned by County Board or School Board (legend to be added)
Public Open Space
The public open space system in the County is extensive with a mix of parks for fields and sport activities, urban plazas, playgrounds, water spray parks, seating areas, parks for dogs, natural environments, resource protection areas, and a host of fitness, learning, recreational and cultural resources within community centers including gymnasiums, classrooms, senior activity areas, and game rooms. As one of 11 elements of the County’s Comprehensive Plan, the Public Spaces Master Plan guides the vision and policies for the open space system.
Today, there are over 2,200 acres of parkland in the County. The County owns over 900 acres of parkland, the Northern Virginia Regional Park Authority (NVRPA) owns approximately 150 acres, over 45 acres are covered by public access or conservation easements, and the most extensive area, over 1,150 acres, is controlled by the Federal government. The County’s parkland currently reflects a combination of natural resources, (approximately 130 acres that help the County meet its storm water and air pollution requirements), Resource Protection Areas, (approximately 245 acres of environmentally sensitive land adjacent to streams and other water bodies), and 142 parks of varying sizes, conditions and amenities for low‐ to high‐intensity community use. Over 19,000 street trees are planted along the County’s public rights‐of‐way, and the tree canopy covers approximately 40% of the County’s land. (For a more detailed breakdown of the park and natural resources facilities, see the Appendix 3 and presentation made to the Committee on April 22, 2015).
The Department of Parks and Recreation (DPR) manages the County’s open space system and implements improvements to facilities through master planning processes to obtainthat include
Draft 2 - Page 31-MU

Chapter 2 – Facility Inventory and Projected Needs
community input and . These master plans seek to maximize the public’s use and enjoyment of theCounty parks. for both active recreation use and passive activities in natural habitats. On a less frequent basis, the County acquires private property to add to the open space supply and these. These spaces are often small lots (less than 1 acre in size) adjacent to existing parks or natural areas. However, sincePrivate development also provides new parks and improvements to existing parks through the site plan process. Since 1995, the County has added over 15 acres combined to Fort Bennett Park and Fort C.F. Smith Park and over 30 acres to create Long Bridge Park, a sports and recreation destination at the northern end of Crystal City. Although parkland acquisitions have occurred, the funding for acquisition has been reduced since 2009, on average $2.6 million per cycle, from an average of $8 million per cycle between 1996 and 2008.
While this supply of open space is extensive, many parks are heavily used and often reserved for particular groups and leagues making it difficult for drop‐in enjoyment by the broader community. Recent data has shown an 11 percent increase in facility reservations from FY 2013 to FY 2014. Class registrations were up 34 percent and youth sports were up 33 percent between FY 2011 and FY 2014. Through its management of the County’s open space system, however, DPR assesses park conditions and usage, as well as collects user demands through routine community surveys, in order to improve facilities and programming as well as expand access for the broader community.
The programming and operation units of DPR have taken steps to keep pace with this increased demand through use of multi‐purpose fields, synthetic fields and lighting to extend hours and reduce maintenance, and sharing spaces with private schools. However, in some cases special requests for field use have been declined and program registrations have been limited. Another way capacity has increased to meet the demands is through collaborative agreements between the County and Schools. The County and Schools have five joint use facilities (i.e., combined school and community centers such as Gunston Middle School/Community Center) and additional shared use facilities (i.e., fields on school properties for after‐hour community use) that expand the community’s use of open space and similarly fulfills the students’ needs for sports teams, recess, physical activity classes, and scholastic teams.
Although there are success stories from sharing facility resources, today these experiences have placed pressure on the open space system as Arlington’s population has steadily increased. and forecasted to reach over 280,000 people by 2040. As a result, the needs, future planning and land acquisition for parks, open space, cultural and recreational facilities are one of the primary discussion topics raised by community members in all civic engagement arenas. The Community Facilities Study Committee discussed future needs based onalso noted the changing demographicsdemographic profile and reiterated the need for more concerted effort to strategically plan for open space acquisition (see Chapter 3 for more information), but it also). The Committee recognized that these issues would be examined in more detail as part of the process to update the Public Spaces Master Plan. (PSMP). As part of the PSMP process, it is expected that ideas will be discussed to determine appropriate considerations and/or metrics that can be used in the future to plan for and acquire land to meet the growing community’s open space needs.
Projected Facility Needs
Planned and Projected County Facilities
The County’s Capital Improvement Plan (CIP) for fiscal years 2015 to 2024, a document which outlines immediate and emerging capital projects, includes three major renovation projects, two new facilities and a myriad of public space improvement projects:
Draft 2 - Page 32-MU
Chapter 2 – Facility Inventory and Projected Needs
Replacement and expansion of the salt storage facility along 26th Street North;
Replacement of the Lubber Run Community Facility, originally built in 1956, with a new, improved and larger facility;
Expansion of employee parking in the Trades Center complex.
Construction of a new fire station #8 to serve the northern part of the County;
Construction of a new Arlington Transit (ART) bus maintenance and storage facility to meet some of the existing supply and routes;
Reconstruction of four parks;
Master planning processes for five parks; and
Installation of three new synthetic turf fields.
Looking ahead as the planning process begins for the biennial CIP update (FY 2017‐ – 2026), the County expects to prioritize additional transportation facilities, fire stations, storage areas, and additional improvements for core infrastructure facilities in order to meet the forecasted population and employment growth, the County’s goals for high‐performing and expanding transit service, and the demand for document archival and storage needs. It is anticipated that the following facilities will be needed in the near future and could require thirteen to eighteen acres of land to meet the need:
Additional ART buses, as the County expands this service and takes over routes currently operated by WMATA; and associated storage and maintenance facilities to meet the expected 50% growth by 2020;
Transit parking and maintenance facilities for the transit service ultimately selected for the Crystal City and Columbia Pike corridors;
One new fire station and three relocated facilities to ensure that all neighborhoods meet the emergency response time levels; and
Increased storage for a multitude of County operations, particularly for police services and capacity in the Trades Center complex.
Planned and Projected School Facilities
As noted in this report’s section on Demographic Forecasts and Projections, APS’ enrollment increased by nearly 5,000 students between 2008 and 2014. Enrollment is projected to increase by an additional 7,800 students through 2024. The Schools’ adopted CIP (FY 2015 – 2024) includes the following construction or renovation projects that will add seats for students:
Construction of Discovery Elementary School (630 seats) (completed and opened September 2015)
Interior renovations at Washington‐Lee High School to expand student capacity (300 seats) (expected completion Fall 2015)
Building renovation and additions (241 seats expansion) at McKinley Elementary School (expected completion September 2016)
Building renovation and additions (136 seats expansion) at Abingdon Elementary School (expected completion September 2017)
Building renovation and addition at Stratford Middle School (1,000 seats) (expected completion September 2019)
Construction of Wilson School for H‐B Woodlawn and Stratford programs (775 seats) (expected completion September 2019)
Draft 2 - Page 33-MU
Chapter 2 – Facility Inventory and Projected Needs
Even with the expected completion of the CIP projects listed above, APS is projecting enrollments that exceed school capacity. The inventory of schools in Appendix 3 compares projected capacity and enrollment for the year 2019. The recently adopted Arlington Facilities and Student Accommodation Plan (AFSAP) identifies additional school and supporting service needs to meet this growing demand. Planning discussions have started or will start soon on the following projects:
A new elementary school in the southern part of Arlington (see South Arlington Working Group in Chapter 1)
Interior renovations at other secondary schools to gain additional capacity
Conversion of the Career Center school to a capacity generating high school, one that provides comprehensive learning
Placement of relocatables (temporary classrooms on school campuses) to fill short‐term needs
Additional capacity for bus parking and associated staff parking
Long‐Term Needs
Beyond these anticipated needs, the Committee recommends that a strategic planning framework be established that would institutionalize a process for identifying future public facility needs and respond to changing demographic and economic conditions. See Chapter 3 for more informationIn addition, as the Public Spaces Master Plan update process gets underway, it is expected that additional open space needs will be identified through that process which will have to be prioritized with other County public facility projects. See Chapter 3 for more discussion.
Draft 2 - Page 34-MU
Chapter 2 – Revenues and Capital Funding
Revenues and Capital Funding – a look at future revenues and best practices in public facility finance
Revenue Overview
The two Boards tasked the Committee with examining future revenue projections based on an analysis
of trends in commercial and residential real estate values as well as best estimates of other taxes, fines,
fees, federal and state aid. Before looking into the future, the Committee gained a basic understanding
of the current revenue situation.
At a macro level, Arlington’s sound financial practices facilitate service delivery and provide taxpayer
benefits. These financial practices are set in policies adopted by the County Board and include
maintaining ourthe triple‐AAA credit rating, fully funding pension and retiree benefits, managing debt at
a moderate level, and maintaining strong reserve levels.
Arlington’s proximity to the nation’s capital, balanced economy, smart growth planning, and highly
educated workforce help produce Arlington’s growth in revenues. Northern Virginia’s and Arlington’s
strong employment and solid real estate market are the foundation for steady incremental growth in
the County’s major revenue streams. While legal and policy limitations impact taxing capacity, Arlington
has implemented all but one tax – admissions tax – that we havethe County has the authority for, which
creates a diverse tax base.
Within ourthe largest revenue source – real estate property taxes – ourArlington’s unique balance
between residential and commercial assessments provides fiscal and service delivery benefits. Recent
increases in commercial vacancy rates have resulted in small shifts in the tax burden. A continuation or
worsening of this trend could impact residential tax bills or force the County to make decisions on
decreasing services. Therefore, it is critical that Arlington continue its efforts to support economic
development and the retention of ourthe commercial base.
Best Practices in Financial Management
The County’s financial and debt management policies guide the County’s capital investments, debt
issuance and long‐term financial management. The policies are generally based on bond rating agency
guidance and criteria for highly rated jurisdictions and best practices in local government finance.
Significant factors in ourachieving stability and growth, Arlington’s sound financial practices include:
Triple‐AaaAAA bond ratings:
o Arlington is one of approximately 39 counties in the United States to be awarded a triple
Aaa/AAA/AAA credit rating. In May 2015, the three primary rating agencies all
reaffirmed thethis highest credit rating attainable for jurisdictions. Ratings issued by
Fitch, Inc. (AAA), Moody’s Investors Service (Aaa), and Standard & Poor’s (AAA) validate
that Arlington’s financial position is outstanding, and it reflects the strong debt position,
stable tax base, and sound financial position.
o Maintaining this highest level of credit rating ensures that Arlington’s debt costs remain
at the lowest possible level. This in turn makes funding available for other uses.
Draft 2 - Page 35-MU
Chapter 2 – Revenues and Capital Funding
Strong reserve levels: o Operating Reserve: This reserve is set at no less than five percent of the General Fund
budget. Appropriations from the Operating Reserve may only be made by a vote of the
County Board to meet a critical, unpredictable financial need. Any draw on the
operating reserve will be replenished within the subsequent three fiscal years.
o Self‐insurance Reserve: This reserve is equivalent to approximately one to two months’
claim payments based on a five‐year rolling average.
o Economic & Revenue Stabilization Contingent: This contingent can address revenue
declines and local or regional economic stress. Use of contingent monies will only be
used at the recommendation of the County Manager and approval by the County Board.
The minimum amount of the contingent will be $3 million and will be revisited annually
as part of the budget process. Any draw on the economic & revenue stabilization
contingent will be replenished within the subsequent two fiscal years.
o General Fund General Contingent: This contingent is to be used to cover unforeseen
expense items or new projects initiated after a fiscal year has begun. Funding may be
allocated from this contingent only with County Board approval.
Fully funded pension
o By policy, the County fully funds its pension using an actuarially accepted method of
funding.
Funding plans in place for retiree healthcare
o By policy, the County fully funds retiree healthcare using an actuarially accepted method
of funding.
Moderate debt limits & reinvestment in infrastructure
o The County prudently uses debt instruments, including general obligation bonds,
revenue bonds, industrial development authority (IDA) revenue bonds, and master lease
financing in order to provide re‐investment in public infrastructure and to meet other
public purposes, including inter‐generational tax equity in capital investment. More
information on these funding sources is provided in Appendix 4.
o The County adheres to the debt affordability criteria adopted by the County Board,
which maintains moderate debt levels.
Adhering to these best practices in financial management, together with ourthe diversification of
revenue create, creates stability and allowallows Arlington to maintain a high level of infrastructure
investments and operating service delivery. Even during difficult economic times when many other
jurisdictions are struggling, the County does not have to divert resources from service delivery to
maintain oura solid foundation – including oura fully funded pension and maintenance of and
investment in ourthe infrastructure. Thus, we’vethe County has been able to maintain high levels of
service delivery and meet County and Schools policies including:
Low class sizes and the highest per pupil spending among districts in the region (according to the
Washington Area Boards of Education, WABE guide);
Low class sizes;
Streets maintained by the County instead of the State resulting in higher levels of service
including bike infrastructure;
Draft 2 - Page 36-MU
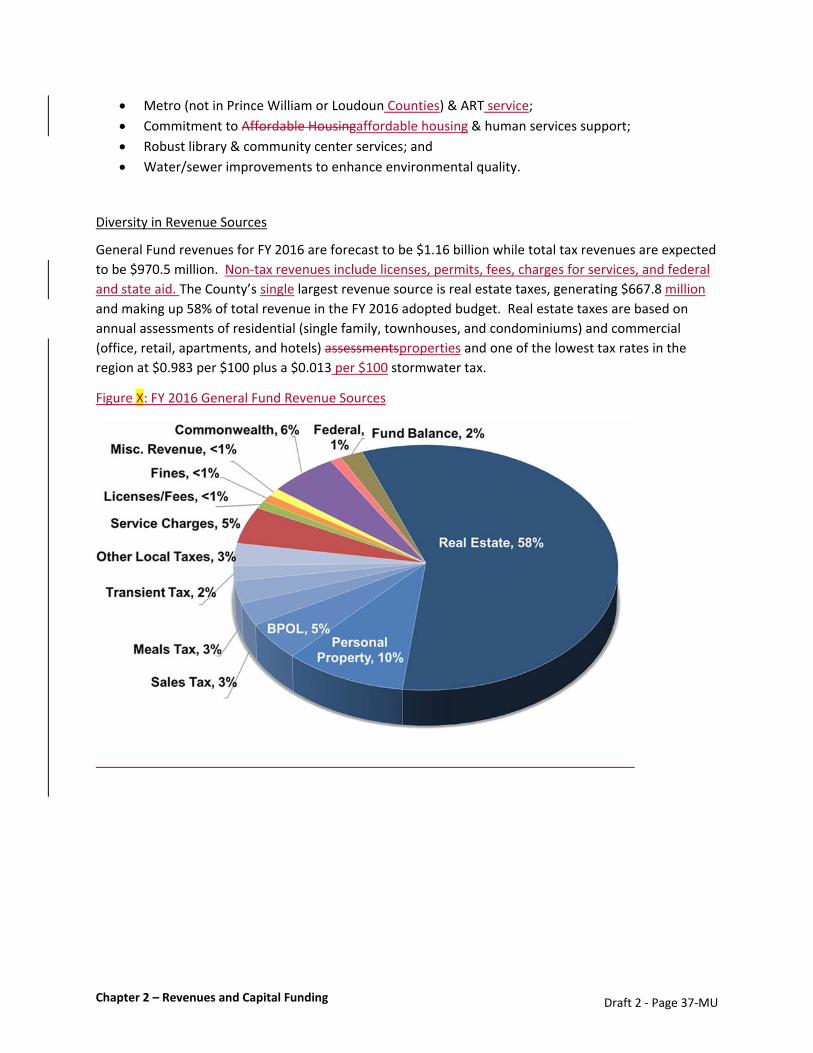
Chapter 2 – Revenues and Capital Funding
Metro (not in Prince William or Loudoun Counties) & ART service;
Commitment to Affordable Housingaffordable housing & human services support;
Robust library & community center services; and
Water/sewer improvements to enhance environmental quality.
Diversity in Revenue Sources
General Fund revenues for FY 2016 are forecast to be $1.16 billion while total tax revenues are expected
to be $970.5 million. Non‐tax revenues include licenses, permits, fees, charges for services, and federal
and state aid. The County’s single largest revenue source is real estate taxes, generating $667.8 million
and making up 58% of total revenue in the FY 2016 adopted budget. Real estate taxes are based on
annual assessments of residential (single family, townhouses, and condominiums) and commercial
(office, retail, apartments, and hotels) assessmentsproperties and one of the lowest tax rates in the
region at $0.983 per $100 plus a $0.013 per $100 stormwater tax.
Figure X: FY 2016 General Fund Revenue Sources
Draft 2 - Page 37-MU

Chapter 2 – Revenues and Capital Funding
Figure X: FY 2016 Local Tax Sources
Within the real estate revenue, the split between commercial and residential property assessments has
historically been about 50/50. Within this revenue source, ourThe unique balance between residential
and commercial assessments provides fiscal and service delivery benefits. The split between
commercial and residential properties has been about 50/50. This even split between residential and
commercial assessments is one of the most compelling and unique aspects of Arlington’s financial
structure., and it provides fiscal and service delivery benefits. In the Northern Virginia region, only
Alexandria is somewhat close to this split with 57% residential; other Northern Virginia jurisdictions’
residential assessments make up at least 70% of total assessments. Alexandria, like Arlington, has a
significant portion of its tax base made up of both office development and apartments, which both
contribute to the commercial assessments, unlike the neighboring jurisdictions with primarily single‐
family residential neighborhoods.
Single family houses and townhouses make up nearly three‐quarters of residential assessments with the
balance being condominiums. On the commercial side, apartments and office buildings each make up
approximately 40% of total commercial assessments while hotels and general commercial (primarily
retail) are the remaining. With the recent trend of increasing office vacancies, the office has slowly
decreased as a percentage of total assessments while strength in the apartment sector has increased its
share of the total commercial base (see appendix for charts showing these trends).
Draft 2 - Page 38-MU

Chapter 2 – Revenues and Capital Funding
Figure X: Residential Portion of Total Tax Base for Northern Virginia Jurisdictions, 2008 ‐ 2014
From an historical perspective, this balance of land uses in Arlington was developed intentionally and
has been maintained over many decades after being developed intentionally. The decision to run Metro
through the Rosslyn‐Ballston corridor resulted in mixedand Jefferson‐Davis corridors and the planned
land use patterns along these transit corridors have helped to diversify the tax base while still preserving
low density neighborhoods. outside the corridors.
The success of the 50/50 split has a direct impact by easing the tax burden on the residential tax payer –
homeowner – particularly when compared to ourthe Northern Virginia neighboring jurisdictions – and
impacts the services that Arlington provides. Arlington’s residential tax base is composed of all
ownership units with single family houses, townhouses, and condos. The commercial tax base includes
office, apartment, hotel, and general commercial (primarily retail) uses. Figure X breaks down the
current tax base by its different residential and commercial components.
Draft 2 - Page 39-MU

Chapter 2 – Revenues and Capital Funding
Figure X: CY 2015 Real Estate Assessments by Category
However, recent Recent office vacancy trends have resulted in small shifts in the tax burden; the current
office vacancy rate of 21.7% is twice the norm.20.8% is twice the norm. With these trends, the office
portion of total assessments has slowly decreased while strength in the apartment sector has increased
its share of the total. Figure X shows how the apartment portion of total assessments increased from
14% in CY 2001 to 21% in CY 2015 while other commercial (office, hotel and retail) has decreased from
37% to 28% of total assessments over the same time period.
Draft 2 - Page 40-MU
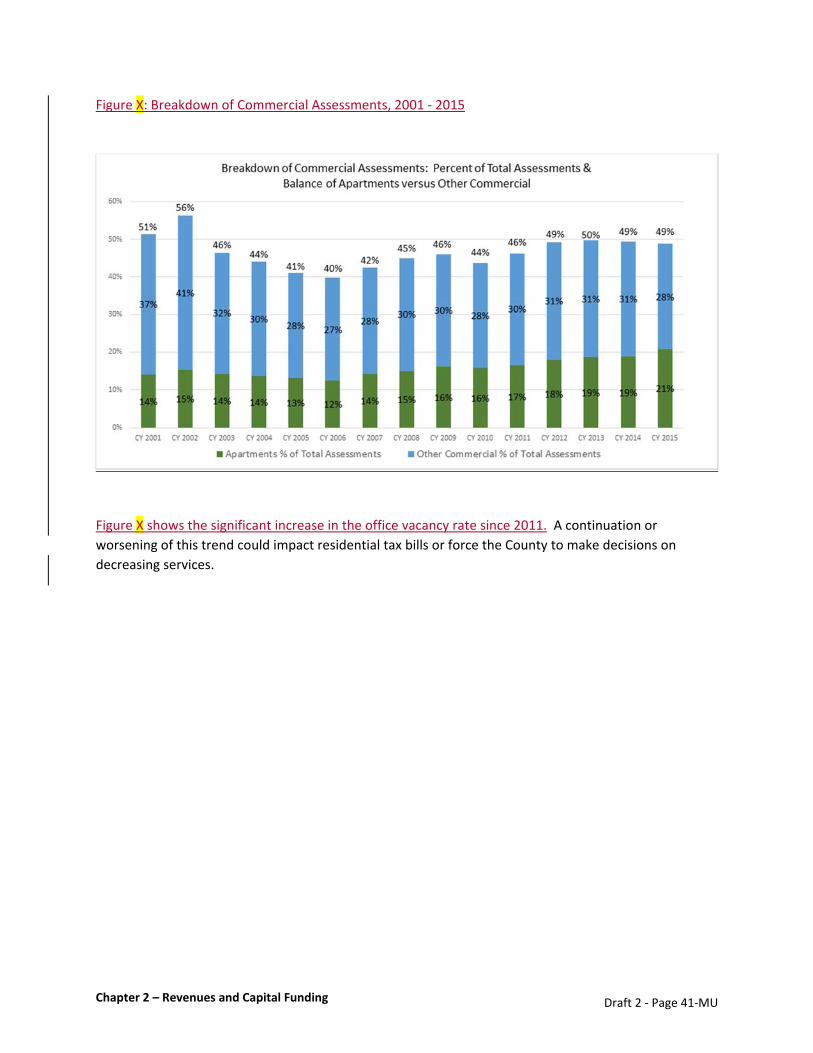
Chapter 2 – Revenues and Capital Funding
Figure X: Breakdown of Commercial Assessments, 2001 ‐ 2015
Figure X shows the significant increase in the office vacancy rate since 2011. A continuation or
worsening of this trend could impact residential tax bills or force the County to make decisions on
decreasing services.
Draft 2 - Page 41-MU
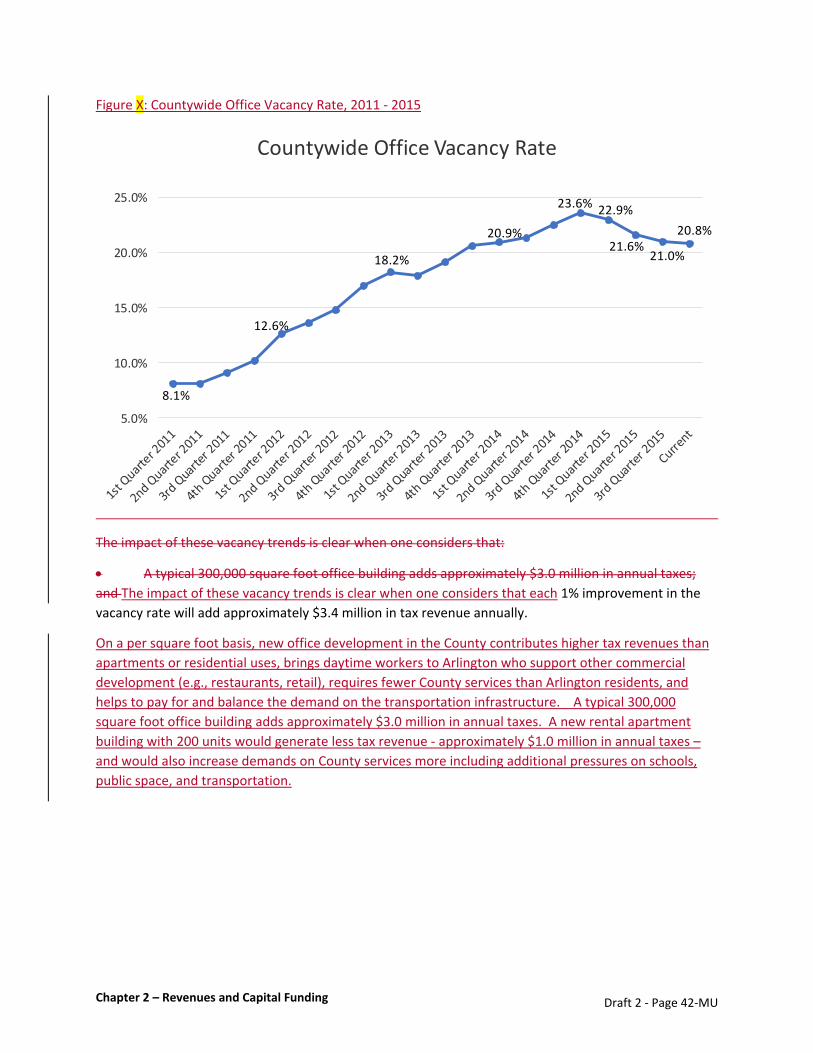
Chapter 2 – Revenues and Capital Funding
Figure X: Countywide Office Vacancy Rate, 2011 ‐ 2015
The impact of these vacancy trends is clear when one considers that:
A typical 300,000 square foot office building adds approximately $3.0 million in annual taxes;
and The impact of these vacancy trends is clear when one considers that each 1% improvement in the
vacancy rate will add approximately $3.4 million in tax revenue annually.
On a per square foot basis, new office development in the County contributes higher tax revenues than
apartments or residential uses, brings daytime workers to Arlington who support other commercial
development (e.g., restaurants, retail), requires fewer County services than Arlington residents, and
helps to pay for and balance the demand on the transportation infrastructure. A typical 300,000
square foot office building adds approximately $3.0 million in annual taxes. A new rental apartment
building with 200 units would generate less tax revenue ‐ approximately $1.0 million in annual taxes –
and would also increase demands on County services more including additional pressures on schools,
public space, and transportation.
8.1%
12.6%
18.2%
20.9%
23.6% 22.9%
21.6%21.0%
20.8%
5.0%
10.0%
15.0%
20.0%
25.0%
Countywide Office Vacancy Rate
Draft 2 - Page 42-MU
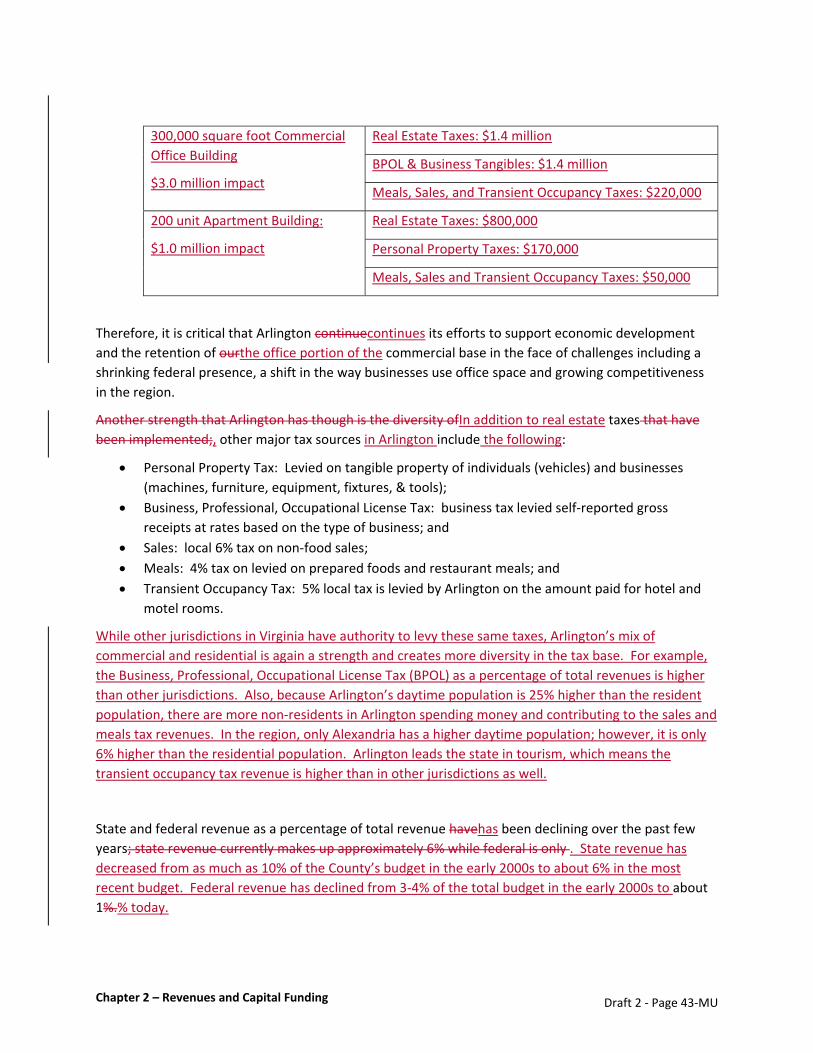
Chapter 2 – Revenues and Capital Funding
300,000 square foot Commercial
Office Building
$3.0 million impact
Real Estate Taxes: $1.4 million
BPOL & Business Tangibles: $1.4 million
Meals, Sales, and Transient Occupancy Taxes: $220,000
200 unit Apartment Building:
$1.0 million impact
Real Estate Taxes: $800,000
Personal Property Taxes: $170,000
Meals, Sales and Transient Occupancy Taxes: $50,000
Therefore, it is critical that Arlington continuecontinues its efforts to support economic development
and the retention of ourthe office portion of the commercial base in the face of challenges including a
shrinking federal presence, a shift in the way businesses use office space and growing competitiveness
in the region.
Another strength that Arlington has though is the diversity ofIn addition to real estate taxes that have
been implemented;, other major tax sources in Arlington include the following:
Personal Property Tax: Levied on tangible property of individuals (vehicles) and businesses
(machines, furniture, equipment, fixtures, & tools);
Business, Professional, Occupational License Tax: business tax levied self‐reported gross
receipts at rates based on the type of business; and
Sales: local 6% tax on non‐food sales;
Meals: 4% tax on levied on prepared foods and restaurant meals; and
Transient Occupancy Tax: 5% local tax is levied by Arlington on the amount paid for hotel and
motel rooms.
While other jurisdictions in Virginia have authority to levy these same taxes, Arlington’s mix of
commercial and residential is again a strength and creates more diversity in the tax base. For example,
the Business, Professional, Occupational License Tax (BPOL) as a percentage of total revenues is higher
than other jurisdictions. Also, because Arlington’s daytime population is 25% higher than the resident
population, there are more non‐residents in Arlington spending money and contributing to the sales and
meals tax revenues. In the region, only Alexandria has a higher daytime population; however, it is only
6% higher than the residential population. Arlington leads the state in tourism, which means the
transient occupancy tax revenue is higher than in other jurisdictions as well.
State and federal revenue as a percentage of total revenue havehas been declining over the past few
years; state revenue currently makes up approximately 6% while federal is only . State revenue has
decreased from as much as 10% of the County’s budget in the early 2000s to about 6% in the most
recent budget. Federal revenue has declined from 3‐4% of the total budget in the early 2000s to about
1%.% today.
Draft 2 - Page 43-MU

Chapter 2 – Revenues and Capital Funding
Revenue Sharing with Arlington Public Schools
The County and Schools entered into a cooperative effort in FY 2001 to design a revenue sharing
agreement as a way to fairly and appropriately apportion revenue for budget development purposes.
Over the succeeding years the structure and revenue sharing calculations were adjusted to reflect the
changing economic and resource demands of both the County and Schools. Since FY 2002, various
adjustments were made for enrollment, funding retiree healthcare (OPEB), maintenance capital,
affordable housing, and other County and School priority initiatives.
During CY 2014, the County Board and School Board worked collaboratively to structure revenue sharing
principles that provide a framework for sharing local tax revenues in a predictable and flexible way. In
January 2015, both Boards adopted principles that emphasize the community priority of high quality
education and utilizing community resources in a balanced and fiscally responsible way.
The agreement outlines four main principles:
1) Revenue sharing provides a transparent, predictable, and flexible framework for developing the
County and School budgets.
2) The planning for the next budget year will begin with the revenue sharing allocation adopted for
the current fiscal year and that any critical needs identified by the Schools, including enrollment
growth, will be considered as a top funding priority.
3) One‐time funding (shortfalls or gains) will be shared between the County and Schools based on
the current year’s allocated tax revenue percentage. One‐time funds from bond premiums will
be allocated to either the County or Schools based on the bonds issued and will be used solely
for capital projects.
4) Funds available from the close‐out of the fiscal year will be used to contribute to the County’s
required operating reserve based on the revenue sharing percentage for that fiscal year and APS
will also contribute to a limited joint infrastructure reserve fund to meet the infrastructure
needs with school expansions and new school construction.
These principles will beare the basis for budget development and will be a starting point for
collaborative funding discussions as both entities begin to develop their proposed budgets each year for
their respective board. In the FY 2016 adopted transfer is $451,866,545 — $451,637,045 in ongoing
funding and $229,500 in one‐time funding — a 2.6 percent increase over the FY 2015 adopted budget.
The revenue sharing percentage is currently 46.5% of ongoing local tax revenues.
Forecasting
The charge for the Community Facilities study was to prepare a 20‐year forecast. Because forecasting
for this timeframe is not reliable, this is not something that Arlington does. The County is consistent
with its local peers and prepareprepares a five‐year forecast, which is updated every budget and CIP
cycle. This long‐term strategic financial planning typically presents two scenarios based on current
Draft 2 - Page 44-MU

Chapter 2 – Revenues and Capital Funding
policies and services to demonstrate the impact of different economic assumptions on ourthe financial
future.
For the Community Facilities Study, a forecast of County revenue was developed with three alternative
economic growth scenarios – medium/baseline, high, and low growth. The assumptions driving these
forecast scenarios included:
Medium/Baseline High Growth Low Growth
Residential Market Stable, averaging 3%
growth
Strong for 2‐3 years (4‐
6%), then stabilizing to
3%
Rapid slowdown – 1.5%
to 2.0%
Office & related tax
sources
Flat or declining
through FY 2019 as
vacancy rates are
worked through; then
steady recovery
Recovery occurs more
quickly – stabilized
without further losses
by FY 2018
Protracted recovery
with additional losses
Other tax sources
(sales, meals)
Slow, steady growth –
1.5% to 3.0%
Accelerated growth –
2‐3%
No growth or slight
declines
Average tax revenue
growth over 5 years 2.5% 3.3% 1.0%
Annual Budget gaps $0.9M to $32.3M Up to $23.7M $36.9M to $43.3M
Overall, near term budget gaps are expected to be manageable for a continuing services budget but
revenue growth is not expected to be robust enough to fully fund County and Schools expenditure
pressures. However, forecasts will change with economic shifts, policy choices, and demand for
services.
Key Takeaways on Revenues
In summary, Arlington’s taxing capacity is impacted by legal and policy limitations. Despite these
limitations, the County’s balance between residential and commercial assessments is unique and
provides fiscal and service delivery benefits. The County’s sound financial practices facilitate service
delivery and provide taxpayer benefits.
In the coming years, it is expected that real estate assessments will see some growth with residential
growth normalizing as office assessments recover. Under the baseline revenue forecast scenario, near
term budget gaps are expected to be manageable for continuing services. However, even with the
forecasted recovery in assessments, revenue growth is not expected to be robust enough to fully fund
County and Schools expenditure pressures, and meeting increasing demands for expanded services will
take time. These forecasts will continue to be revised, particularly if shifts in the commercial tax base
continue.
Draft 2 - Page 45-MU

Chapter 2 – Revenues and Capital Funding
Legal and policy limitations impact taxing capacity.
Arlington’s balance between residential and commercial assessments is unique and provides
fiscal and service delivery benefits.
Arlington’s sound financial practices facilitate service delivery and provide taxpayer benefits
Expectation that real estate assessments will see some growth with residential growth
normalizing as office assessments recover.
Revenue growth is not expected to be robust enough to fully fund County and Schools
expenditure pressures.
Under baseline scenario, near term budget gaps are expected to be manageable for continuing
services.
Forecasts will change.
See Appendix 4 for additional Revenue data.
Best Practices in Public Facility Finance
Overview
In the study’s charge, the Committee is asked to identify “Arlington’s key facility assets and needs ‐
County and Schools 5, 10 and 20 years out” using an inventory of existing County and School facilities as
well as “Develop the criteria for prioritizing projects in the CIP.” The Committee’s goal is to “build a
consensus framework regarding future revenue and facility needs that will inform County and School
Board decision‐making related to meeting the community's requirements for additional school, fire
station, vehicle storage sites and other facility needs...” In reaching this goal, key questions asked by the
Committee included “What are our facility needs for schools, fire stations, recreation, and transportation
vehicle and other storage?” as well as “How do we pay for these needs?”
The County’s and Schools’ Capital Improvement Plan (CIP) isPlans (CIPs) are responsive to this request by
laying out a ten‐year plan of capital needs of the community and a ten‐year funding plan to achieve
those needs. The CIP is one of the most significant planning processes for the County and Schools and
not only identifies the immediate needs but also seeks to capture longer‐term capital needs in all areas
of infrastructure. It balances maintenance of the existing infrastructure with new investments, all driven
by service delivery demands, and it is flexible to adjust to changing priorities and external factors. The
CIP is financially sustainable and adheres to financial and debt management policies to ensure that the
County maintains its triple‐AaaAAA bond ratings.
Draft 2 - Page 46-MU
Chapter 2 – Revenues and Capital Funding
Debt Management
The CIP adheres to the debt capacity guidelines formally in place since 2002 and re‐confirmed by the
County Board in July 2014. The County’s debt capacity ratios measure affordability against key “wealth”
indicators of the County and are very similar to other triple‐Aaa’sAAAs in the region. Because the rating
agencies consider County and Schools as a single entity for debt capacity, these guidelines are used by
both organizations. These are considered best practicepractices in public finance and serve as guidance
for debt affordability, an essential practice by the bond rating agencies.
1. The ratio of net tax‐supported debt service to general expenditures should not exceed ten
percent, within the ten‐year projection.
2. The ratio of net tax‐supported debt to full market value should not exceed three percent,
within the ten‐year projection.
3. The ratio of net tax‐supported debt to income should not exceed six percent, within the ten‐
year projection.
4. Growth in debt service should be sustainable and consistent with the projected growth of
revenues. Debt service growth over the ten year projection should not exceed the average
ten year historical revenue growth.
5. The term and amortization structure of County debt will be based on an analysis of the
useful life of the asset(s) being financed and the variability of the supporting revenue
stream. The County will attempt to maximize the rapidity of principal repayment where
possible. In no case will debt maturity exceed the useful life of the project.
6. The County will refund debt when it is in the best financial interest of the County to do so.
When a refunding is undertaken to generate interest rate cost savings, the minimum
aggregate present value savings will be three percent of the refunded bond principal
amount.
Arlington County’s CIP Development and Criteria
CapitalArlington County’s capital projects originate from a variety of sources. County Board appointed
commissions, advisory groups, and task forces typically advise the Board or develop long‐term plans that
recommend certain types of improvements. In some cases, individual residents request improvements
to their streets, playgrounds or other County facilities. Neighborhood associations and business groups
may also suggest projects and work areas. Some projects are initiated by adopted County master plans,
such as the Transportation Master Plan or the Storm Water Master Plan. It is an iterative process that
starts with the most recently adopted CIP and factors in many updates. These factors include economic
and revenue projections impacting debt capacity, updates of existing maintenance capital condition and
inventory assessments, commercial development activity, construction market conditions, external
impacts of regional partnerships, federal and state regulatory changes, population changes or service
delivery demands and even opportunistic events.
Given that there are always more project proposals submitted than can be funded in a given year,
various criteria are used to assist in prioritizing capital projects. These criteria include a test for
immediate safety, legislative, or judicial requirements, the project’s ability to be implemented in the
timeline proposed, linkages to other approved and funded projects, linkages to an approved County
Draft 2 - Page 47-MU
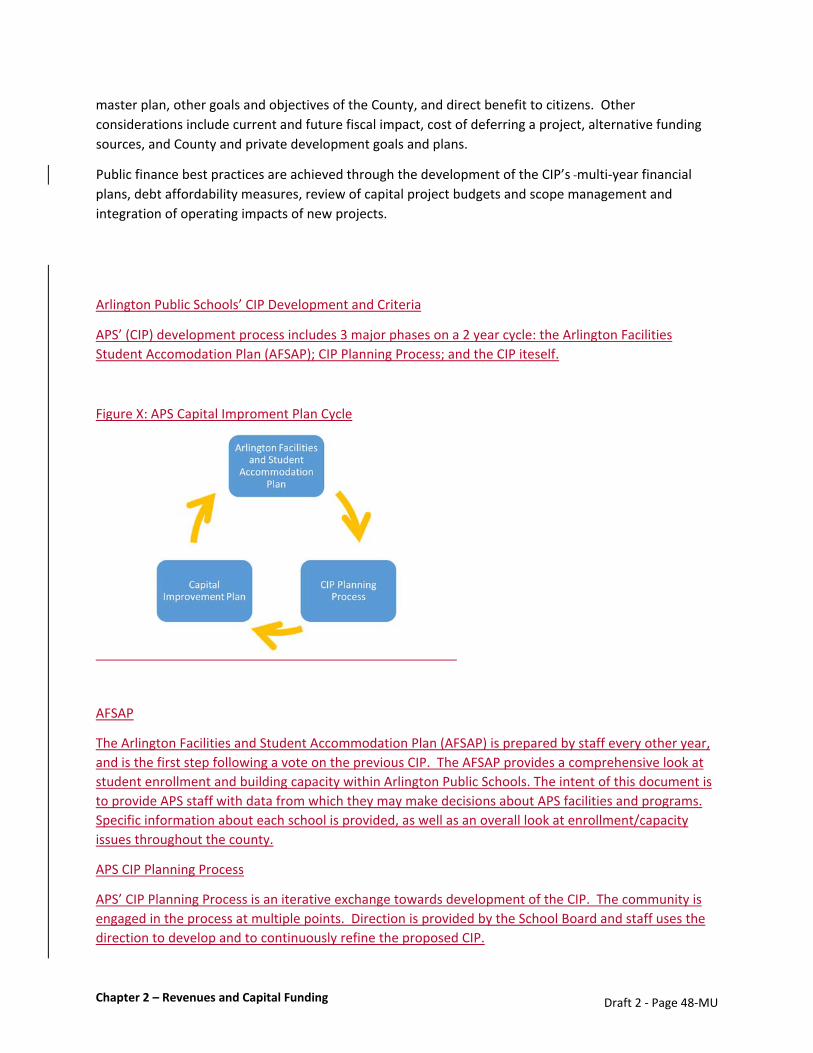
Chapter 2 – Revenues and Capital Funding
master plan, other goals and objectives of the County, and direct benefit to citizens. Other
considerations include current and future fiscal impact, cost of deferring a project, alternative funding
sources, and County and private development goals and plans.
Public finance best practices are achieved through the development of the CIP’s multi‐year financial
plans, debt affordability measures, review of capital project budgets and scope management and
integration of operating impacts of new projects.
Arlington Public Schools’ CIP Development and Criteria
APS’ (CIP) development process includes 3 major phases on a 2 year cycle: the Arlington Facilities
Student Accomodation Plan (AFSAP); CIP Planning Process; and the CIP iteself.
Figure X: APS Capital Improment Plan Cycle
AFSAP
The Arlington Facilities and Student Accommodation Plan (AFSAP) is prepared by staff every other year,
and is the first step following a vote on the previous CIP. The AFSAP provides a comprehensive look at
student enrollment and building capacity within Arlington Public Schools. The intent of this document is
to provide APS staff with data from which they may make decisions about APS facilities and programs.
Specific information about each school is provided, as well as an overall look at enrollment/capacity
issues throughout the county.
APS CIP Planning Process
APS’ CIP Planning Process is an iterative exchange towards development of the CIP. The community is
engaged in the process at multiple points. Direction is provided by the School Board and staff uses the
direction to develop and to continuously refine the proposed CIP.
Draft 2 - Page 48-MU
Chapter 2 – Revenues and Capital Funding
1. The School Board uses the AFSAP to develop a framework for the CIP, and affirms or adjusts the
recommendations in the AFSAP. Using the CIP framework, staff
explore options using community input and
develop debt capacity projections for 10 year planning horizons.
present preliminiary options and debt capacity projections are presented to theSchool Board
2. The School Board uses the information to provide directions on next steps. Staff
develops options based on the direction. Site analysis studies address
o Costs and impact on debt capacity
o Timeline
o Number of seats provided
o Opportunities and challenges
o Alignment with design principles
Presents site analysis studies to the community for feedback
Analyzes feedback and developes recommendations
3. The Superintendent proposes CIP to the School Board
4. The School Board holds public hearings to obtain community input on the Superintendent’s
proposed CIP
5. The School Board adopts the CIP.
Various groups are engaged throught the CIP planning process including
Advisory Council on School Facilities and Capital Programs (FAC)
Individual school communities
Citizen groups
Civic associations
Broader community
County staff
APS teaching and administrative staff
Investments in Service Delivery
The FY 2015‐FY 2024 capital plan maintains plans adopted by the County and Schools maintain County
and School assets, furthers thefurther economic competitiveness, and continuescontinue the County’s
history of financial sustainability by funding investments in service delivery in line with the community’s
values including:
Livable neighborhoods: neighborhood conservation, paving, safe routes to schools, complete
streets, BikeArlington, and WalkArlington;
Safe community: fire stations and apparatus, public safety technology, records management
systems;
Draft 2 - Page 49-MU

Chapter 2 – Revenues and Capital Funding
Helping those in need: homeless services center and Mary Marshall Assisted Living Center;
Core infrastructure: water and sewer infrastructure and stormwater management;
Economic competitiveness: ConnectArlington/intelligent transportation systems;
Robust quality of life: parks and open space, playgrounds, community centers, bike trails, and
fields; and,
Quality school infrastructure for optimal learning environment.
CIP Needs
The FY 2015‐FY2024 CIP investmentFY 2024 CIP’s investments in Arlington’s physical assets total $3.2
billion. A breakdown of how Arlington spends CIP funds is graphically represented belowin Figure X.
The biggest allocation, 49%, is dedicated to transportation, Metro, street paving and transit projects1.
The second largest investment, 17%, is planned for schools. Core infrastructure projects such as utilities
and stormwater comprise 13% of the plan while 8% is budgeted for public and government facilities, 6%
is budgeted for parks and recreation, and the remainder is budgeted for information technology, public
safety and other capital improvements.
CIP Needs in $000s
1 The FY 2015‐2024 CIP was adopted before the decision to halt the Streetcar program.
Program FY 15-24 % of Total
Transportation 863,353 27%
Crystal City & Columbia Pike Transit 485,552 15%
Metro 210,650 7%
Parks and Recreation 183,182 6%
Public/Government Facilities 243,648 8%
Information Technology & Public Safety 146,665 5%
Regional Partnerships & Contingencies 45,942 1% Comm Conservation & Economic Devel 97,148 3% Subtotal County Capital 2,276,140Water and Sewer Infrastructure 317,734 10%
Stormwater Management 61,280 2% Total County Capital 2,655,154
Schools Capital 534,054 17% Total CIP Program 3,189,208 100%
Draft 2 - Page 50-MU
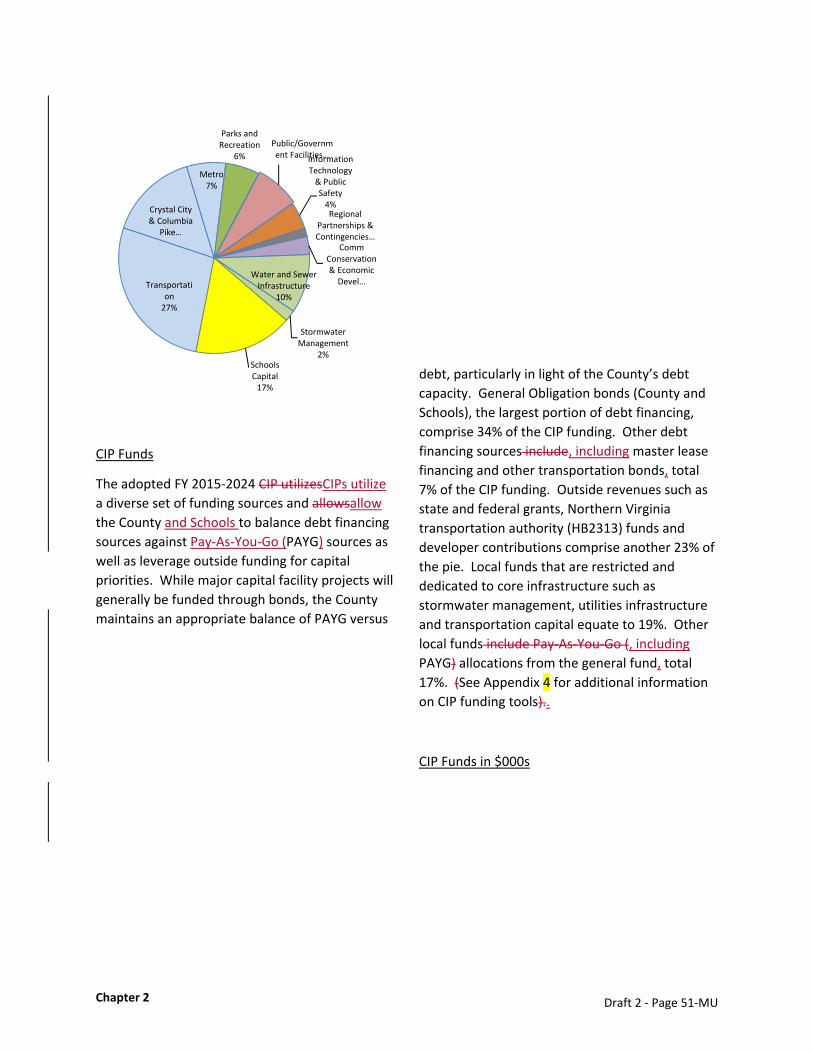
Chapter 2
CIP Funds
The adopted FY 2015‐2024 CIP utilizesCIPs utilize
a diverse set of funding sources and allowsallow
the County and Schools to balance debt financing
sources against Pay‐As‐You‐Go (PAYG) sources as
well as leverage outside funding for capital
priorities. While major capital facility projects will
generally be funded through bonds, the County
maintains an appropriate balance of PAYG versus
debt, particularly in light of the County’s debt
capacity. General Obligation bonds (County and
Schools), the largest portion of debt financing,
comprise 34% of the CIP funding. Other debt
financing sources include, including master lease
financing and other transportation bonds, total
7% of the CIP funding. Outside revenues such as
state and federal grants, Northern Virginia
transportation authority (HB2313) funds and
developer contributions comprise another 23% of
the pie. Local funds that are restricted and
dedicated to core infrastructure such as
stormwater management, utilities infrastructure
and transportation capital equate to 19%. Other
local funds include Pay‐As‐You‐Go (, including
PAYG) allocations from the general fund, total
17%. (See Appendix 4 for additional information
on CIP funding tools)..
CIP Funds in $000s
Transportation27%
Crystal City & Columbia
Pike …
Metro7%
Parks and Recreation
6%
Public/Government Facilities…Information
Technology & Public Safety4%Regional
Partnerships & Contingencies…
Comm Conservation & Economic Devel…
Water and Sewer Infrastructure
10%
Stormwater Management
2%Schools Capital17%
Draft 2 - Page 51-MU
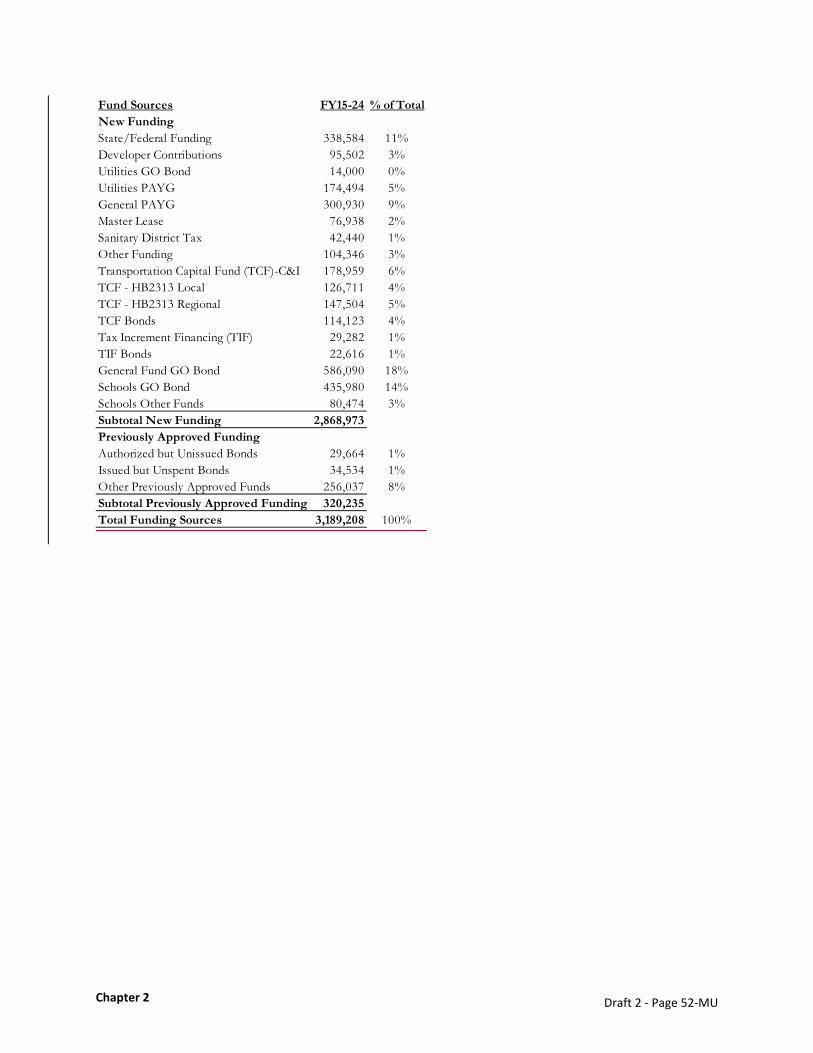
Chapter 2
Fund Sources FY15-24 % of TotalNew FundingState/Federal Funding 338,584 11%Developer Contributions 95,502 3%Utilities GO Bond 14,000 0%Utilities PAYG 174,494 5%General PAYG 300,930 9%Master Lease 76,938 2%Sanitary District Tax 42,440 1%Other Funding 104,346 3%Transportation Capital Fund (TCF)-C&I 178,959 6%TCF - HB2313 Local 126,711 4%TCF - HB2313 Regional 147,504 5%TCF Bonds 114,123 4%Tax Increment Financing (TIF) 29,282 1%TIF Bonds 22,616 1%General Fund GO Bond 586,090 18%Schools GO Bond 435,980 14%Schools Other Funds 80,474 3%Subtotal New Funding 2,868,973Previously Approved FundingAuthorized but Unissued Bonds 29,664 1%Issued but Unspent Bonds 34,534 1%Other Previously Approved Funds 256,037 8%Subtotal Previously Approved Funding 320,235Total Funding Sources 3,189,208 100%
Draft 2 - Page 52-MU

Chapter 2
Key Takeaways on Public Facility Finance
The County and Schools CIPs strive to balance between reinvestment versus new projects. They cover the entire spectrum of County and School infrastructure, facilities, and technology and are largely based on service delivery demands. The CIPs are also flexible, responding to changing priorities and external factors. Finally, the CIPs are financially sustainable. They are based on debt ratios that are moderate and consistent with triple‐AAA bond rating standards, and the County’s debt levels are balanced against other operating budget needs.
The CIP strives to balance between reinvestment vs. new projects The CIP covers the entire spectrum of County infrastructure, facilities, and technology and is
largely based on service delivery demands The CIP is flexible, responding to changing priorities & external factors The CIP is financially sustainable
o Debt ratios are moderate and consistent with triple‐AAA bond rating standards o Debt levels are balanced against other operating budget needs
See Appendix 4 for additional information on public facility financing.
State/Federal Funding11%
Developer Contributions
3%
Utilities GO Bond0%
Utilities PAYG5%
General PAYG9%
Master Lease2%
Sanitary District Tax
1%
Other Funding3%
Transportation Capital Fund (TCF)‐
C&I6%
TCF ‐ HB2313 Local4%
TCF ‐ HB2313 Regional
5% TCF Bonds4%
Tax Increment Financing (TIF)
1%TIF Bonds
1%
General Fund GO Bond18%
Schools GO Bond14%
Schools Other Funds3%
Authorized but Unissued Bonds1%
Issued but Unspent Bonds1%
Other Previously Approved Funds8%
Draft 2 - Page 53-MU
Chapter 3 – Strategic Community Challenges
Chapter 3 – Strategic Community Challenges
Note: Due to extensive editing, changes from Draft 1 have not been provided. The Draft 1 version of this
Chapter is available on the CFS website: http://commissions.arlingtonva.us/community‐facilities‐
study/documents/
The heart of the Community Facilities Study was to identify strategic community challenges that could, if
left unaddressed, threaten Arlington’s overall sustainability as a community. Following informational
sessions on demographics and forecasting, revenues and County economics, and planning policy and
process, the Committee defined five main challenges for the County and the community:
1. A scarcity of land for public facilities;
2. Dealing with changing demographics;
3. A threatened commercial tax base;
4. Strategic facility planning and priority setting; and
5. The need to revamp community dialogue
Committee members readily concluded that land is scarcer than funds, and that changing demographics
must inform the facility prioritizing process, particularly with regard to school facilities since APS must
provide a seat for any student who comes to school. The Committee also found that there is no
effective way to prioritize facility needs currently incorporated into the facility planning process or
Capital Improvement Plan, or to have community conversations about priorities.
The five challenges are linked‐‐but not prioritized‐‐and reflect some of the pressures of an evolving,
developed community. While it is obvious that not all possible solutions are entirely within the
County’s control, the Study Committee concluded that focus on the challenges and their solutions by
elected leadership and the community at large is necessary to ensure the future of the community. For
this reason, the Study Committee urges elected officials to keep these challenges and ideas at the
forefront of their efforts on behalf of the community.
A Scarcity of Land for Public Facilities1
Land is Arlington’s scarcest resource. As previously noted, the County operates a variety of facilities
including libraries, fire stations, the Trades Center, and recreation and community centers on County‐
owned land. Additional facilities such as the DHS offices and Courthouse Plaza operate in leased space.
APS operates elementary, middle and high schools and additional facilities (Education Center,
Planetarium and the APS portion of the Trades Center) as well as programs in leased space. Combined,
the County and APS own 2.2 square miles2 which houses schools, parks and all County facilities. Sixty‐
two percent of the 2.2 square miles are occupied by County parks—including natural areas best left
undisturbed‐‐and 26 percent by Schools.
1 Data and statistics cited in this section came from the CFS presentation of April 22, 2015. 2 Road right‐of‐way occupies six square miles, other government land occupies 3.5 square miles and private property occupies 14.4 square miles.
Draft 2 - Page 54-MU
Chapter 3 – Strategic Community Challenges
While many examples of joint and shared use are already in operation, these principles are not yet
institutionalized practices. Though many facilities house a single use, longstanding partnerships between
APS and the County help maximize facility use and provide numerous examples of shared use facilities
(e.g. DPR classes in APS gyms, fields and school classrooms) and joint use facilities (e.g. Jefferson Middle
School and Community Center) which are governed by a Memorandum of Understanding. Even with
these efforts in place, continued growth in demand results in waiting lists for classes and sports
programs, and fields scheduled beyond recommended standards. Urgent school capacity needs are
being addressed through use of relocatables, which may reduce limited recreation space on school sites,
interior renovations, additions and new school construction on the Williamsburg Middle School campus
and at Wilson School. School capacity issues led APS to charter the South Arlington Working Group
which will soon make a recommendation on a new elementary school site. In addition, the APS CIP
includes funds to evolve the Career Center into a capacity generating high school.
The County’s planned growth will increase demands for schools, public services, all types of open space,3 recreational opportunities and critical but less visible “back of house” activities like fire stations and ART bus storage—all within the 26 square miles of the County. For example, the ART and school bus fleet will increase with expanded routes; these vehicles need several acres for storage, staging and maintenance. The County needs to build one new fire station and relocate three to improve response times and support projected population growth. Thirteen – eighteen acres of land in two‐acre minimum parcels are needed to expand County services plus additional land for similar APS services.
Meeting the challenge of land for future facility needs requires a multi‐pronged strategy and a
recognition that existing uses, such as open space, serve current public needs and must be taken into
account if new uses are proposed to be added to a site:
making better use of existing facilities,
looking for opportunities to “create” more land, including over rights‐of‐way (e.g. the I‐66
parking deck and Gateway Park) and new facilities like garage structures (e.g. Washington Caps
practice rink); and
building up, over and underground to reduce building footprints and preserve open space..
Facilities need to be adaptable to new uses, joint uses and shared uses wherever possible. It is well
understood that land availability is a significant challenge as the County continues to grow. Acquisition is
increasingly expensive and opportunities vary from year to year. County land acquisition funds are
considerably less in recent years (an average of $2.6 million since 2009) than in the 1996‐2008 funding
cycles where it averaged $8 million per cycle. As a result, and excluding Long Bridge Park, the County
has not been able to acquire much new open space. Establishing a land acquisition fund would allow
3 The Public Spaces Master Plan update now underway will look at public space policies, needs and
priorities, and develop an open space classification system, identify future open space needs and
develop standards tailored to Arlington.
Draft 2 - Page 55-MU

Chapter 3 – Strategic Community Challenges
the County to compete more effectively when key properties become available. Well‐located sites like
the 16‐acre Buck property on North Quincy Street are rare opportunities.
Recommendations:
1. Make maximum use (and reuse) of the facilities we have, ensuring that existing space is
efficiently used and that new space is adaptable for future purposes.
2. Encourage joint or shared use of facilities, taking into account the operating characteristics
of any existing use, such as open space.
3. Build up, under and over rather than out to use land most efficiently.
4. Create “new” land by building over right‐of‐way and on top of structures such as parking
garages.
5. Collaborate with other jurisdictions to review whether opportunities exist for both facility
and service sharing.
6. Establish a land acquisition fund to position the County to acquire parcels when they
become available.
Dealing with Changing Demographics4
The County’s demographic profile has been changing over the last 15 years, putting pressure on all
levels of the school system as well as open space, recreation and fire services. The fastest growing age
cohorts in Arlington between 2010 and 2013 were 35‐44 year olds, 0 – 5 year olds and those 65 years
and older. Each of these groups has unique as well as shared service needs now and in the future.
Perhaps the most significant demographic change in the County in recent decades arises from APS
enrollment growth, which is projected to continue over the next decade. Much of this growth will come
from the 0 – 5 year olds; the ratio of kindergarten enrollment to births increased from 55% in 2005 to
75% in 2014. Enrollment has increased steadily since the 1990’s, growing 1 – 2% per year through the
mid 2000’s. Between 2008 and September 2015, enrollment grew between 2.8% and 5.2% per year.
APS projects school enrollment to exceed 30,000 students by 2024. This rapidly rising enrollment means
APS will continue to need additional facilities to meet the educational needs of students.
Changes in household size also can be an indicator of projected increases in school enrollment. Between
2000 and 2013 the average household size increased in both owner and renter occupied single family
homes. The same is true for renter occupied multi‐family housing. Most growth in the student
population comes from single ‐family houses.
4 The data and statistics used in this section were taken from the CFS presentations on March 11, 2015 and “Profile 2015,” Department of Community Planning, Housing & Development
Draft 2 - Page 56-MU
Chapter 3 – Strategic Community Challenges
Millennials (born 1982‐2000, approximately 15 ‐ 33 years old) are the dominant generation in the
County today. Much has been written about this age group but it is as yet unclear whether this group
will remain in urban areas like Arlington as they look to buy houses and start families or if they will
follow the path of many Baby Boomers to the suburbs. Residents age 18 to 34—the age group typically
forming their own households—is the most mobile segment of the County population. Keeping
millennials in the County is critical for the labor force and will require affordable home ownership
opportunities, child care and pre‐school options. While the number of single family houses affordable
to those with moderate incomes may be inadequate, the County has over 23,000 condominiums which
may serve as starter home ownership options for some. With a 2015 average assessed value of
$380,000, these units are considered affordable for middle income households.
The 65+ age cohort‐‐one of the fastest growing in the County—has grown an estimated 12% between
2010 and 2013. This age group is expected to have higher incomes, and is more likely to be working than
in the past. Better health than previous generations will support increased demand for recreation,
leisure activities and public transportation. Residents in this age group are most likely to live in the
same house as the previous year. Although the media draws attention to evolving trends among this
age group (e.g. downsizing from single‐family houses to condos), there is no reliable source of
information on the needs and resources of this group, making it difficult to plan for their future needs.
Similarly, it is expected that the 85+ age cohort will have increased needs for assistance, such as housing
options and transportation, and increased care options, and information is needed on this age group as
well.
Increasing income disparity reduces diversity in the community. In 2000, the largest share of County
households earned $75,000 ‐ $99,999 (approximately $100,000 ‐ $135,000 in 2013 dollars). In 2013, the
largest share of households had incomes of $200,000 or more. The estimated 2015 median household
income for the County is $106,400. But, historical housing patterns have led to wide variations in
median income from neighborhood to neighborhood in the County, especially between large parts of
North Arlington and South Arlington.
Prior to the mid‐1990s, single family homes were affordable to many middle class families and
thousands of garden apartments, which were built initially in the decades immediately before and after
World War II, existed throughout Arlington. These affordable homes and affordable rentals offered
starter housing to generations of Arlingtonians. Unfortunately, a large percentage of this historic
affordable housing has been lost over the last three decades to the economic pressures of rising rents
and the conversion to condominiums, and was hastened by the spike in housing prices due to the
County’s growing reputation for good schools and accessible public transportation.
These developments were brought about by the County’s adoption of land use plans encouraging
additional density through smart growth and transit‐oriented development, as well as mixed‐use
development along the Metro corridors. This has resulted in the concentration of available affordable
housing in fewer and fewer neighborhoods, further increasing income disparity in the County. This
disparity has to be recognized and addressed. The Arlington County Board’s Columbia Pike
Neighborhoods Area Plan and the recently adopted Affordable Housing Master Plan are steps in the
right directions and will add additional diversity of housing in all parts of the County. The Committee
Draft 2 - Page 57-MU
Chapter 3 – Strategic Community Challenges
believes that future County plans should set policies and goals to improve economic diversity of the
housing supply and specifically consider impacts on schools and communities in setting such policies.
Currently, APS, DPR and a number of non‐profit organizations provide after school programming for
students who need additional assistance, including students from low‐income households. Examples of
these programs include Extended Day, homework clubs, and enrichment classes. These wrap around
programs may not be widely known throughout the community. Service providers should coordinate
with each other to comprehensively assess these programs with the goal of ensuring that all children
and families who could benefit from them are aware of what is offered and identifying and addressing
service gaps.
Using County plans and policies as a base, the County forecasts a 31 percent increase in population by
2040; employment is projected to grow 38 percent.5 Such significant growth will surely increase
demands for all types of services and facilities and will necessitate the need for finer‐grained data to
inform future public facility planning.
Recommendations:
7. Improve forecast and projection methods (Phase 2 consultant work):
Analysis of student generation factors (SGF) by different housing characteristics,
including trends between 2010 and 2015;
Comprehensive demographic analysis of County population by age cohort;
Cohort component demographic model for County population forecasts;
Long‐term (6‐10 years) student population projection model; and
Trend reporting and best practices.
8. Improve cohort data research, particularly for those 65 and older and use demographic
factors to help define future facility needs.
9. Develop strategies to retain the millennial population, specifically increasing the availability
of “starter” housing (i.e. entry‐level homeownership), child care, and pre‐school.
10. Evaluate and enhance wrap around services coordinating school and after‐school needs.
A Threatened Commercial Tax Base6
As previously noted, Arlington’s tax base is unique compared to neighboring communities with a 50/50
split between commercial (office, retail, multi‐family residential, hotel) and residential development.
This compares with a 75 percent residential – 25 percent commercial split in Fairfax County, a 70/30
5 These forecasts are developed in five‐year increments for 30 years through the Metropolitan Washington Council of Government’s regional Cooperative Forecasting program which is a requirement of the Clean Air Act. This information was presented to the CFS at the March 11, 2015 meeting. 6 The data cited in this section was presented to the CFS at the February 11 and February 25, 2015 meetings.
Draft 2 - Page 58-MU
Chapter 3 – Strategic Community Challenges
split in Loudoun County and a 57/43 percent split in the City of Alexandria. Today, $27.5 billion of a total
$57.5 billion in assessed land and improvements value is located in the Metro corridors, which is 11% of
total land in the County. The County’s triple‐AAA bond rating reflects the inherent strengths of this
unique tax base, strong financial reserves, a fully funded pension system and moderate debt limits. The
large percentage of the tax base attributable to commercial uses has helped keep real estate taxes
relatively low for many years in comparison to neighboring communities; the land area (largely in the
transit corridors) available for high density development remains virtually the same since the County
adopted the first General Land Use Plan in 1961.
Arlington has long enjoyed a healthy tax base that made it possible to fund a nationally ranked school
system and a robust array of programs and services while maintaining a relatively low real estate tax
rate. However, as the County and the Washington Region seek to recover from the recession there are
a number of indicators that the 50/50 tax base split cannot be taken for granted in the future. While all
types of development pay real estate taxes, the non‐residential portion of the tax base is struggling.
The Importance of a Healthy Office Market
While the federal government and its contractors continue to occupy nearly 50 percent of Arlington’s
office space, the federal presence has shrunk in the County by 2.4 million square feet of office space
since 2011. Federal procurement dropped in the last three years; Arlington has lost 4,700 federal jobs
since 2010. The effects of BRAC and sequestration continue to be felt with no assurance from the
Congress that the latter will not be repeated.
As of October 2015, Arlington’s office vacancy rate is 20.8 percent, double the historical average of 10
percent (“County and Schools Reaffirm Revenue‐Sharing Principles”, Press Release, October 15, 2015).
To reduce the vacancy rate to 10 percent, 4.4 million square feet of currently vacant office space would
need to be occupied.
Further indications of change in the office market are revealed in the way business uses office space. In
the last decade, technology, cost of occupancy, commuting challenges and the work preferences of an
increasingly younger workforce have resulted in reduced office space allocated per employee in both
the private and public sectors. Technology facilitates alternative work schedules and locations. Both
Deloitte and Accenture, located in Rosslyn and Ballston respectively, “hotel” far more employees than
they house in their offices on any given day.
An examination of recent development approvals and projects under construction show a clear market
preference for residential development over office development, which has implications for schools,
parks and other services. According to Profile 2015 and the Quarterly Development Updates published
by the County’s Planning Division, from January 2014 – June 2015, 2,465 multi‐family residential units
were approved. The “WeLive” project in Crystal City was the second approval of an office building
conversion to a residential building.
Growing competitiveness in the region is changing the relative desirability of the Arlington office
market. New development in NOMA, Bethesda, Downtown and Capital Riverfront all compete for
tenants. The 2014 opening of the Silver Line makes Reston, Tysons, and points west more accessible
and facilitates creation of strong employment centers in those submarkets.
Draft 2 - Page 59-MU

Chapter 3 – Strategic Community Challenges
In recognition of this new competition, and the economic impact of the high office vacancy rate, the
County Board added new resources to the Economic Development budget‐‐$600,000 and 5 FTEs for
business development and $300,000 for marketing‐‐in the FY 2016 budget.
Ease of Doing Business with the County
Arlington has long prided itself on robust public input processes for all types of County and School
issues. Even with the detailed guidance of adopted plans and policies, however, the length of
community review processes for private development projects often stretches to years rather than
months. Though valued by the community, these lengthy processes are at odds with the business
community’s preference for speed and predictability, and also can limit participation from residents who
cannot commit significant time to community processes (See Revamping the Community Dialogue,
below).
Over the last several years there have been a number of efforts to help both large and small businesses
in the County with a variety of issues including permitting, code requirements, signage and regulatory
costs. Despite these efforts and the creation of an ombudsperson to mediate issues, negative
perceptions persist. Over the last few months, the Department of Community Planning, Housing and
Development (DCPHD) conducted a customer satisfaction survey and is taking steps to improve
customer service, reduce site plan process and construction permit review times, improve technology
for permitting and plan review, and increase consistency. Over 150 attended a Development Forum on
these process improvements on September 10, and it is expected that additional events will be held to
provide progress updates.
As noted above, the County faces stronger competition from neighbors in Tysons, D.C. and Alexandria.
Proximity to downtown may not be as valuable as it once was. Businesses and developers may become
less willing to make concessions to Arlington if attractive alternatives (i.e., lower rents, incentives) are
reasonably close by. It is in the community’s interest to take a solution‐oriented, proactive approach to
developing and revising processes to facilitate development that is consistent with the County’s adopted
plans and policies.
Housing and Affordability Issues
A third threat to the economic sustainability of the County stems from a lack of affordable rental
housing and rising house prices. The County has used both zoning tools and financial resources to
address affordable rental housing issues, allocating approximately $55 million7 in affordable housing
support, administration and tenant assistance in FY 2014. For those earning below 60 percent of the
Area Median Income (AMI), the County, in partnership with non‐profits, provides options in the form of
affordable units (Committed Affordable units or CAFs) and rent assistance. For those earning more than
120 percent AMI, the market provides many rental and home ownership options. Recognizing that the
Affordable Housing Master Plan process was well underway, the Study Committee did not look at
affordable housing issues for those earning below 60 percent AMI. Instead, the Study Committee
focused on housing as a contributing factor to the overall economic health of the community. The
7 “Tools for Affordable Housing in Arlington”, Arlington County, Department of Community Planning, Housing and Development, Planning Division, ” undated
Draft 2 - Page 60-MU

Chapter 3 – Strategic Community Challenges
public sector workforce, particularly those in entry level positions, and many employees in the types of
jobs being created by the private sector during the recent recovery from recession earn less than 60
percent AMI.
Thousands of millennials—the largest age group in the County‐‐have come to Arlington for great jobs,
transportation and an excellent quality of life. They, along with many others, stay for these reasons and
the excellent school system when they start families. Despite the large number of single‐family houses,
townhouses and condominiums, many leave the County because they are unable to find an affordable
home ownership opportunity. As reported in the Washington Business Journal (on‐line edition, October
12, 2015), Arlington house prices rose 6.6 percent over a year ago ($565,000), compared to an annual
average gain of 1.7 percent for the close‐in Metro area. Demolitions of older single‐family houses
continue at a record pace, further reducing the stock of affordable “starter houses.” New multi‐family
units are largely one‐bedroom rental units which typically don’t appeal to families; the condominium
stock, though large, may not satisfy preferences for traditional single‐family lifestyles and fee simple
ownership. As house prices rise, the ownership challenge is particularly great for those earning between
60 percent and 120 percent AMI. Loss of the millennial population worsens the economic stratification
in the County and is directly related to the County’s attractiveness to employers.
On the rental side, the continued loss of market rate affordable units through rent increases,
redevelopment and renovations has put pressure on the rental supply. Rents continue to rise faster
than wages. Two in five rental households in the County spend more than 30 percent of their income on
rent. Even with the addition of thousands of mostly one bedroom rental units in the last decade, high
demand for rental housing resulted in an average monthly rent of $1,834 in 2014. Millennials, seniors
and those earning 60 percent to 120 percent AMI are particularly affected by these trends.
Recommendations:
11. Step up marketing efforts to attract commercial office tenants.
12. Add an economic impact statement to project Staff Reports to provide an analysis of both
costs (e.g. the projected service demands and other costs to the community) and benefits
(e.g. the taxes and other economic benefits) likely to be generated by a proposed project.
13. Require a letter from the Economic Development Commission to the County Board
regarding the economic impacts and benefits of each development project.
14. Convene a working group of the County and the business community to improve
development review and permitting processes, reduce process and permit review time, and
incorporate technology where appropriate, and to explore the possibility of delegating to
the BIDS and other similar groups approval for temporary uses, and other similar types of
activities that would otherwise need County approval and would help attract and retain
businesses.
15. Focus on a variety of housing to match the wide range of incomes and ages (e.g. age in
place) in the County.
Draft 2 - Page 61-MU
Chapter 3 – Strategic Community Challenges
16. In light of revenue challenges now and likely in the future, increase public awareness of the importance of a strong commercial tax base; County and APS should embark on a cost
efficiency effort
Strategic Facility Planning and Priority Setting
The Comprehensive Plan
The General Land Use Plan (GLUP), one element of the County’s Comprehensive Plan, is required by the
Code of Virginia. It establishes the overall character, extent and location of various land uses and
communicates County policy to citizens, the business community and others (General Land Use Plan
booklet, December 2011). It and the other ten Comprehensive Plan elements8, provide an essential
framework for decision‐makers. Sector Plans, Area Plans and Revitalization Plans provide more detailed
policy guidance for specific areas of the County and also are developed with extensive citizen
participation. Since their original adoption, the GLUP and other Plan elements have been continuously
updated.
Despite a long history of comprehensive planning in the County, Comprehensive Plan elements are
developed separately on different time cycles. Plans are developed and updated through an extensive
community process that incorporates public input throughout the process. However, no clear process
exists to reconcile competing objectives between Comprehensive Plan elements (or between Area plans
and Plan elements) or to comprehensively (e.g. in a Plan element) address community facility needs
such as libraries, public safety, technology and storage. As a result, these Plan elements may contain
conflicting ideas which have neither been reconciled nor prioritized. When this occurs, community
interests are pitted against each other, often playing out in community review of a public facility (i.e. a
school or recreational facility) or a site plan project. This results in a “win – lose” scenario and
undermines trust in the community process. Further, Comprehensive Plan elements often calculate
projected growth quantitatively (e.g. number of new residential units/ square feet of commercial space)
with insufficient attention to the characteristics of future residents and workers which may create new
and different demands for County facilities and services.
Capital Improvement Planning
The Capital Improvement Plan (CIP) is one of the critical supporting documents to the Comprehensive
Plan. The CIP is a ten‐year plan for investment in Arlington’s physical assets. The CIP covers all types of
infrastructure and is balanced between maintenance of existing infrastructure and new investments.
The combined total for both the County and APS CIPs is $3.2 billion with transportation, schools and
water and sewer infrastructure the largest expenditure categories. The CIP is developed on a biennial
8 Adopted Plan elements include the Affordable Housing Master Plan, the Chesapeake Bay Preservation Ordinance and Plan; the Community Energy Plan, the General Land Use Plan; the Master Transportation Plan (including eight subelements); the Public Spaces Master Plan (including three subelements); the Historic Preservation Master Plan; the Recycling Program Implementation Plan; the Sanitary Sewer System Master Plan; the Storm Water Master Plan; and the Water Distribution System Master Plan. General Land Use Plan Booklet, December 2011
Draft 2 - Page 62-MU
Chapter 3 – Strategic Community Challenges
basis with the most recent adopted CIP as the starting point. Among the factors considered in
developing the CIP are:
Updated economic and revenue projections impacting debt capacity
Commercial development activity
Construction market conditions impacting project cost estimates
Project cost estimates change due to design changes, site conditions, etc.
Board direction on specific projects or initiatives
External impacts of regional partnerships (e.g. WMATA)
Federal and state regulatory changes
Population changes (e.g. enrollment) or service delivery demands
Opportunistic events such as land acquisition
Currently, facility needs are prioritized primarily through the County and APS Capital Improvement Plan
(CIP) processes which are developed separately. County CIP planning begins with the previously
adopted 10‐year CIP; APS uses the Arlington Facilities and Student Accommodation Plan (AFSAP) as their
starting point. The AFSAP takes a comprehensive look at enrollment and capacity using current and
projected enrollments by school and grade. The AFSAP identifies decision points around the need and
location for new seats and redistribution of students or programs. APS works with its Advisory Council
on School Facilities and Capital Programs (FAC) and Budget Advisory Council (BAC) throughout the year
and has a number of check‐ins with the community on draft School CIP proposals to obtain comment.
The County does not have a similar committee to FAC, however, it develops the draft CIP internally
through many months of review, presentations and discussions and ranks each project using criteria
such as health / safety issue, legal mandate, protect / preserve a capital asset, project readiness, cost‐
savings benefit and essential component of a larger project. The County also receives input from many
Commissions (e.g., Parks and Recreation Commission, Transportation Commission, Planning
Commission, etc). The County Board holds multiple work sessions and a public hearing on the draft CIP
prior to adopting it.
COUNTY CIP PROCESS and TIMELINE
Draft 2 - Page 63-MU
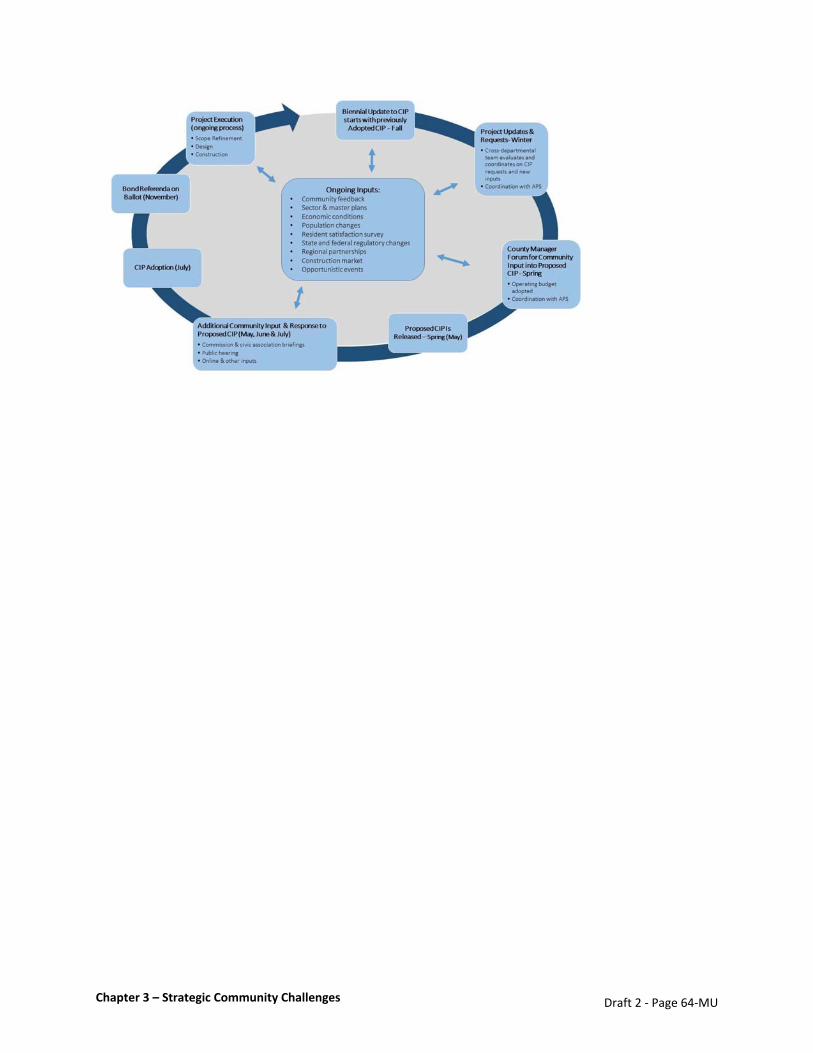
Chapter 3 – Strategic Community Challenges
Draft 2 - Page 64-MU

Chapter 3 – Strategic Community Challenges
APS CIP PROCESS and TIMELINE
Setting Priorities for Community Facilities
For the purposes of this report, a community facility is defined as land, buildings or infrastructure that is
or will be owned, operated or leased by Arlington County or Arlington Public Schools, or that is
otherwise developed or managed by them in partnership with a private or non‐profit entity, to provide
community services and/or to support a wide range of services and functions which usually fall into one
or more of the following general areas:
Administration
Human Services
Libraries
Operations and Storage
Parking
Parks, Recreation, and Cultural
Public Safety
Schools and Education
Transportation
Utilities and Stormwater
The Study Group felt it was important to define “community facilities” to provide boundaries for the
needs assessment and facility prioritization efforts. As defined for this study, affordable housing would
only be considered a community facility when it is a joint use on publicly‐owned land such as Arlington
Mill Residences and Arlington Mill Community Center.
The Committee also recognizes that public facilities are provided by the Federal and State government,
as well as interjurisdictional organizations such as NOVA Parks and the Washington Metropolitan Area
Draft 2 - Page 65-MU

Chapter 3 – Strategic Community Challenges
Transit Authority (METRO). Private and non‐profit organizations in Arlington also provide essential
services to the public, such as health care, but these privately‐operated facilities are not considered part
of the Community Facilities Study.
The issue of the County and the Schools setting priorities for future funding and construction of public
facilities has been a topic of discussion in all four of the Subcommittees. Neither the Comprehensive
Plan, nor the County and School CIPs provide clear guidance on how projects are prioritized for inclusion
in a CIP or for design or funding. This is particularly critical given that the competition for land and
financial resources between school and other facility needs will only worsen with increased demand due
to population growth and a shifting economic base. The Study Committee raised a number of concerns
about the manner in which County and School community facility needs are identified, prioritized and
funded. These concerns include a lack of knowledge by the community about what is needed and how
specific projects are determined, missed opportunities to use land more efficiently, and that the County
and APS CIPs are not designed to strategically guide long‐term plans for public facilities. They concluded
that a priority setting process must be devised as a foundation for the proposed siting process (see
below) and to improve utility of the CIP.
The priority setting process is designed to achieve four goals:
Institutionalize better coordination between Schools and County and among the several
County departments including development of criteria for prioritizing facility needs
Improve the opportunity for public participation and input into the early stages of facility
planning
Bring together the information about ongoing demographic and economic changes in the
County and Schools with the early planning and thinking about future facilities.
Identify long‐range strategic issues and their implications for facility needs and provide a
basis for prioritizing candidates for inclusion in a future update of the CIP.
Structure for Setting Priorities
The Study Committee recommends that a three‐level structure be used to create closer alignment
between the County and School’s capital planning efforts and better community understanding of the
full range of community facility needs including maintenance of existing facilities. Together, they
would establish the initial list of public facility priorities, maintain an updated facility priority list and
seek public comment on those priorities. The structure would consist of the Facility Strategic Planning
Committee, a joint County/APS Staff Team and a citizen commission, the County Facility Advisory
Committee.
The Study Committee recommends the establishment of a County Board and School Board Facility
Strategic Planning Committee comprised of two County Board and two School Board Members (with a
rotating Chair). This committee would be tasked with achieving improved coordination and
collaboration across County and School projects. Through regular meetings during the year (3‐4 times
per year), this Committee of the Boards would monitor and provide strategic guidance on public facility
planning and funding processes. This guidance would be provided to staff and the full Boards for their
Draft 2 - Page 66-MU

Chapter 3 – Strategic Community Challenges
ultimate deliberations and decision‐making about budgets, the CIP, and specific projects and would
occur through:
annual briefings on changing demographics, development projects, and real estate market performance, and other factors that may impact the County’s population and economic growth;
review of future facility needs, and for Schools, the general geography of future needs;
development of key strategies and aspirational themes that influence long‐term public facility planning;
review of current projects and schedules offering guidance on project adjustments (i.e.
timing changes, confirming or endorsing project details) should the need arise,
including guidance on potential formal actions needed by each Board;
evaluation of project scope and analysis for emerging facility project proposals (as part of the Needs Assessment and CIP Funding Process outlined below) and trade‐offs including consideration of co‐located facilities;
review of priority options; and
input from staff, a commission‐based working group, and the community.
A Joint County/APS Staff Team chaired by a designated senior person from the County Manager’s office
and including key facilities planning staff from APS and County departments would support the Facility
Strategic Planning Committee. The staff person designated to lead the effort must be senior enough to
provide direction and leadership to the rest of the team and be charged with taking a longer strategic
view of needs. The longer term, strategic view of needs—in conjunction with a recognition and
understanding of immediate priorities—are critical to ensuring a balanced view of capital needs.
The Joint County/APS Staff Team would have responsibility to:
develop, for consideration by the Facility Strategic Planning Committee and the community,
criteria/considerations for assessing and prioritizing facility needs, including maintenance of
existing facilities;
coordinate/collaborate County and School projects, seeking partnerships where possible;
monitor preparation and implementation of CIP;
monitor development, demographic, and economic data and organize briefings for the Facility Strategic Planning Committee;
oversee community civic engagement and communications related to public facilities; and,
coordinate a new commission‐based working group focused on community facilities.
Community involvement would be primarily achieved through a newly created Joint Facilities
Advisory Commission (JFAC) which would seek input from the public as well as Commissions such
as the Planning, Transportation and Housing Commissions. It is expected that JFAC members would
be jointly appointed by the County Board and the School Board, similar to the appointment of the
Community Facility Study Committee. JFAC would be responsible for developing and annually
updating/validating the criteria used to assess immediate, mid‐term and long‐term facility needs
within categories of public facilities. The Commission would seek public input on these criteria as
well as the project lists which would be derived from Plan elements, Sector and Area Plans and the
adopted CIPs.
Draft 2 - Page 67-MU

Chapter 3 – Strategic Community Challenges
To be effective, this group should be composed of residents with civic participation experience
rather than drawn (e.g., as liaisons or representatives) from existing commissions; membership
should be diverse in terms of age, culture and County geography; and at least some members
should have experience in planning, public finance, design and construction. The JFAC would seek
input from commissions annually on respective public facility recommendations. Opportunities for
broad citizen input would be developed for both the priority setting process and development of
the CIP.
Public Facility Needs Assessment
In developing the initial master list of projected future needs, the staff committee and CFAC would
review those facilities currently in the approved CIP, adopted Plan elements, and supporting
documents of the Comprehensive Plan including sector and area plans that are adopted for different
areas of the County. Some of the public facilities identified in plans are incorporated into the CIP
while others are not included or are intended to be provided through private development projects.
Finally, the needs assessment would also need to include facility needs not yet in plans identified by
departments with input from service providers and others. The master list would be updated
annually.
The Study Committee recognizes that facility needs are driven by demographics and concludes that
developing a consolidated list of County and School public facility needs is an essential input to the
facility prioritization process. A number of questions should be considered in determining specific
community facility needs, including the types of facilities needed for a growing population with
changing demographics, the types of needs that require facilities to be distributed through the
County or centralized, and the timing of needs Appendix 5 includes a list of questions to be
considered when assessing facility needs. Opportunities for community input would be devised for
this stage of the process.
Analysis
Once a need has been identified, staff may develop alternatives for how the need could be
addressed. Options may range from building expansion, relocation of a program, a change in service
level, to new construction. Options for new construction may entail rebuilding at an existing site or
may require a new site, which would trigger the Siting Process (see description below). The analysis
would also incorporate policy guidance from the Facility Strategic Planning Committee, such as
opportunities for co‐location. Once a recommendation for meeting a need is developed, the
preferred option is eligible for inclusion in the CIP. This step would include an enhanced level of public
participation with opportunities for community input.
CIP Funding Prioritization Process
Prioritization of facility needs is a crucial step that will guide the development of a CIP. The list of public
facility needs should be evaluated as to how the need could be addressed; options could vary widely
depending on priority and available funding. Fiscal considerations are a significant factor in determining
which projects would be included in the 10‐ year CIP. Generally, projects in the near term CIP funding
years (i.e., years 1‐4) will have progressed through prior CIP cycles. Projects identified for out‐year
funding (i.e., years 5‐10) would be informed by the needs assessment and related analysis. The School
Draft 2 - Page 68-MU
Chapter 3 – Strategic Community Challenges
Board and County Board would each adopt their respective CIPs. Unfunded projects remaining on the
needs assessment list would be reviewed again in future cycles.
The Study Committee felt strongly that JFAC should develop considerations for the different types of
facilities to assist the JFAC and staff in developing project priority recommendations for consideration by
the Facility Strategic Planning Committee and discussion with the community. Examples of these criteria
are included in Appendix 5; the considerations could be weighted for a number of factors including the
target population. This step would include an enhanced level of public participation with opportunities
for community input.
Siting Principles and Process
One of the primary tasks of the Community Facilities Study is to propose “criteria and a process for siting
any new County or School facilities or adding new or expanded uses to existing facilities or sites.” With
limited land, limited financial resources and many facility projects in the queue, the Study Committee,
with input from the Resident Forum, developed siting principles and a four‐stage siting process that
improves upon current practices (Appendix 6). The siting process is intended to function as a project
management tool to make siting decisions efficiently and, effectively, and with ample community input.
The Study Committee is recommending the following six principles to guide all siting processes,
recommendations, and decisions.
1. Be as transparent as possible: share information broadly and communicate regularly.
2. Time and funding are limited: undertake siting processes in a timely and cost‐conscious manner.
3. Use resources efficiently: explore multiple‐use facilities and designs that could be adaptable
over time.
4. Balance County‐wide and local needs.
5. Guide discussions and decisions with established plans, policies and goals.
6. Distribute facilities equitably across the County as much as possible.
The recommended siting process consists of four phases. In Phase 1, the project scope for the identified
use and process will be established. This phase will determine siting requirements and considerations, a
framework for how sites will be evaluated, the civic engagement process and communications plan, and
the timeline for reaching a decision. In Phase 2, potential sites will be identified, evaluated, and refined
to two or three options for further consideration. In Phase 3, design studies and analysis will be
developed for the refined list of site options identified from Phase 2. The evaluation of these sites will
inform the recommendation of a preferred option. In Phase 4, the County Board and/or School Board
will consider the recommendation and confirm a final approach.
The siting process is intended to be flexible enough that it can be adapted to a variety of situations. It
would primarily be used in situations when a known facility need requires a site, such as determining the
location of a new school. The process could also be modified for situations when new use(s) will be
determined for a known site has become available for development.
Draft 2 - Page 69-MU

Chapter 3 – Strategic Community Challenges
For more information on the Study Committee’s proposed siting principles and process, refer to
Appendix 6.
Recommendations:
17. Create a formal, integrated strategic facility needs assessment and priority setting process between APS and the County with three elements:
A Facilities Strategic Planning Committee consisting of two County Board and two
School Board members;
An integrated staff team including APS and all relevant County departments; and
A Joint Facilities Advisory Commission
18. Implement the proposed Public Facility Siting Process
Revamping the Community Dialogue
Arlington has always taken great pride in the level of civic participation in community matters. Both the
County and APS have many advisory commissions and standing committees, and appoint special task
forces and working groups to evaluate and make recommendations on specific matters. At the
neighborhood and school level, 50+ civic associations and nearly three dozen PTAs provide a forum for
participation, share information, respond to issues, and provide input and guidance to elected officials
and commissions. But, as Study Committee members noted, community processes require extensive
time commitments and typically rely on in‐person attendance for input. Reaching renters, the elderly
and other groups remains challenging for those managing community processes.
While these opportunities to participate in the civic life of the community are open to all, changing
community demographics, economic pressures and competition for non‐work time has resulted in fewer
participants in all but the most controversial community processes. The County and Schools have made
great progress in using technology to push information to the community. Project websites that
maintain schedules, documents and announcements for major studies and community processes,
targeted emails, Twitter, and other forms of social media make it possible for interested parties to keep
in touch with project status. Technology simplifies information sharing, but pushing out information is
not a replacement for dialogue. Furthermore, technology is not uniformly available to all in the
community for a variety of reasons including cost. As a result, some segments of the community (e.g.
the elderly and lower income residents) are under‐represented in public processes and decision‐making.
Process techniques have evolved as well, but they can require considerable time commitments. The
Community Facilities Study benefitted from the input of the Resident Forum, citizens who volunteered
to participate in the Study as individuals or representatives of civic associations, PTA’s and other
community groups. This model could be useful for other projects. Gallery walks, open houses,
community forums and walking tours help achieve more effective two‐way civic engagement; however,
they are most appealing to those with the time to participate.
The challenge of meaningful civic engagement is not unique to Arlington.
Draft 2 - Page 70-MU

Chapter 3 – Strategic Community Challenges
Study Committee members, all with lengthy experience in County and/or School commissions and
working groups, expressed concern that community processes have become less effective for a number
of reasons:
Participation requires significant amounts of volunteer and staff time, thus limiting who can
participate;
The same people tend to be active in multiple areas of civic life, which can lead to burn‐out over
time and doesn’t allow for wider perspectives;
A significant amount of information is pushed out through various means, but opportunities for
meaningful discussion and comment are too few, and it is not always clear that public input is
truly heard; and
Many community processes require participants to come to the County or Schools as opposed
to where people live or in convenient or transit‐accessible locations.
Study Committee members expressed the desire for methods that make participation easier, earlier and
more complete information sharing, clear and meaningful opportunities for public input, and use of
both existing structures such as civic associations and PTAs and new groups that represent other
segments of the community. They concluded that a review of civic engagement practices is necessary to
ensure that the County engages all segments of the community, develops citizen leaders, provides
information transparently and engages the public early in any process. .
Recommendations:
19. Examine civic engagement processes and practices to reach new audiences, incorporate
new techniques and technologies better, use skills in the community.
20. Experiment with new channels of communication, particularly social media, to reach a
diverse population.
Draft 2 - Page 71-MU

Chapter 4 – Next Steps
Chapter 4 – Next Steps
Note: This chapter is all new text compared with Draft 1.
The intent of this chapter is to bring together in a single place the recommendations that need to be
undertaken to implement the findings and recommendations of the Community Facilities Study
Committee. Some of these recommendations are already underway or have been incorporated into
business practices; others can be implemented quickly (short‐term=6 ‐ 12 months), including adoption
of several policy recommendations, while others have multiple elements to be completed and will take
more time (mid‐term= 1 – 3 years, long term =3 ‐ 5 years). The text shown in italics provides additional
information on the suggested next steps, and timing, needed to implement the Committee’s
recommendations. In addition there are topics suggested for further study that are related to the Study
Committee’s work but outside the scope of the Study Charge.
Recommendations
1. Make maximum use (and reuse) of the public facilities we have, ensuring that existing space is
efficiently used and that new space is adaptable for future purposes. (Short‐term policy
recommendation)
2. Encourage joint or shared use of facilities, taking into account the operating characteristics of
any existing use, such as open space. (Short‐term policy recommendation)
3. Build up, under and over rather than out to use land most efficiently. (Short‐term policy
recommendation)
4. Create “new” land by building over right‐of‐way and on top of structures such as parking
garages. (Short‐term policy recommendation)
Implementing recommendations 1‐4 will require that those involved in facilities planning in the
County, APS and the community approach those efforts with a broader perspective than just
considering the primary use of the site. The County Board and School Board should adopt these
recommendations and direct staff to incorporate them into facilities planning efforts
immediately after.
5. Collaboration with other jurisdictions to review whether opportunities exist for both facility and
service sharing. (Ongoing) Arlington has a long history of regional collaboration and many examples of shared services (e.g., with the City of Falls Church). Recognizing that revenue and land challenges exist and are likely to continue, it is appropriate to collaborate with other jurisdictions to seek additional opportunities for increased collaboration and sharing arrangements, for both facilities and services, and to exchange information about best practices.
6. Establish a land acquisition fund to position the County to acquire parcels when they become
available. (Mid‐term)
Draft 2 - Page 72-MU

Chapter 4 – Next Steps
7. Improve Forecast and Projection Methods (Work is underway; the results will be implemented
when the work is completed)
The first phase of consultant work on the County’s population/employment forecasts and APS’
student projections included both short and long term recommendations. The second phase is
now underway and includes the following tasks, all of which are intended to further improve
forecast and projection methods:
Analysis of student generation factors (SGF) by different housing characteristics,
including trends between 2010 and 2015;
Comprehensive demographic analysis of County population by age cohort;
Cohort‐component demographic model for County population forecasts;
Long‐term (6‐10 years) student population projection model; and
Trend reporting and best practices.
8. Improve Cohort Data Research, particularly for those 65 and older and use demographic factors
to help define future facility needs (This research is being undertaken as part of #7. The results
can be implemented when the work is completed.)
Defining future needs for any age group requires better data than is available in
non‐Census years, including projections by age cohort. This information is
particularly lacking for those aged 65 and older. In conjunction with additional work
on population projections and school enrollment forecasts, County and APS staff is
working with consultants to complete a comprehensive demographic analysis of
County population by age cohort.
9. Develop strategies to retain the millennial population, specifically increasing the availability of
“starter” housing (i.e. entry‐level homeownership), child care, and pre‐school. (Mid‐term)
10. Evaluate and enhance the wrap around services coordinating school and after‐school needs for children and families. (Mid‐term)
11. Step up marketing efforts to attract commercial office tenants. (Underway)
12. Add an economic impact statement to project Staff Reports to provide an analysis of both costs
(e.g. the projected service demands and other costs to the community) and benefits (e.g. the
taxes and other economic benefits) likely to be generated by a proposed project. (Short‐term)
13. Require a letter from the Economic Development Commission to the County Board regarding
the economic impacts and benefits of each development project. (Short‐term)
14. Convene a working group of the County and the business community to improve development
review and permitting processes, reduce process and permit review time, and incorporate
technology where appropriate, and to explore the possibility of delegating to the BIDS and other
similar groups approval for temporary uses, and other similar types of activities that would
otherwise need County approval and would help attract and retain businesses. (Short‐term)
Draft 2 - Page 73-MU
Chapter 4 – Next Steps
15. Focus on a variety of housing to match the wide range of incomes and ages (e.g. age in place) in
the County. (Underway, especially through implementation of the Affordable Housing Master
Plan)
16. In light of revenue challenges now and likely in the future, increase public awareness of the importance of a strong commercial tax base. Both the County and APS should embark on an
effort to focus on cost efficiency.(Short‐term)
Among the questions that could be studied are the following:
Are we making full use of available technology?
Are we relying more than necessary on ‘bricks and mortar’ locations for service
delivery?
Could equivalent results be achieved with a lower expenditure per student?
17. Create a formal, integrated strategic facility needs assessment and priority setting process between APS and the County with three elements:
a Facilities Strategic Planning Committee consisting of two County Board and two
School Board members;
an integrated staff team including APS and all relevant County departments; and
a Joint Facilities Advisory Commission (Short‐term)
Creation of the Facility Strategic Planning Committee is the central recommendation of the
Community Facility Study. It is intended that this group, together with the Joint County/APS staff
team and the Joint Facility Advisory Committee, will:
improve coordination and collaboration between the County and APS;
establish and implement a process to identify facility needs early;
raise awareness of needs with the community and provide opportunities for input;
monitor demographic and economic data to influence decision making; and
strategize alternative solutions before the CIP funding prioritization and specific
siting processes begin.
18. Implement the Siting Process (Short‐term)
The new Siting Process is one of the key products of the Study Committee’s work. The Siting
Process will be most effective once the prioritization of facility needs is completed. To
implement the process, key County and School staff should be trained on the new siting
process. Commissions involved in facility siting also should be briefed on the process and their
role in siting new facilities. The siting process should be evaluated periodically to assess
whether the process is achieving intended outcomes.
19. Examine civic engagement processes and practices to reach new audiences, incorporate new
techniques and technologies better, use skills in the community. (Mid‐term)
Members of the Study Committee expressed an interest in an examination of citizen
participation and civic engagement practices in the County, and there was support from Study
Committee and Resident Forum members for finding new ways to use the large number of civic
Draft 2 - Page 74-MU

Chapter 4 – Next Steps
leaders who have developed skills though experience in civic associations and school
organizations. Among the issues/concerns to be addressed are:
time commitment required for participation in a County or School community
process;
transparent and timely information sharing;
meeting‐focused nature of processes; and
insufficient opportunities for meaningful discussion and dialogue.
20. Experiment with new channels of communication, particularly social media, to reach a
diverse population. (Ongoing)
Additional Considerations
In the course of this Study, additional topics related to the future vision of Arlington County were raised that were outside of the scope of the charge. The Committee did not discuss these in great detail, but recommends that these emerging topics be explored further by the County Board and School Board. Examination of these topics could further impact planning for public facilities and may provide better clarity on the County’s vision for the future.
Review of County Vision [description pending]
Understanding the Consequences of Growth [description pending]
Review BLPC and PFRC processes [description pending]
Draft 2 - Page 75-MU
Appendices
Appendices
1. Community Facilities Study Charge and Committee Members
2. County and APS Improvements
3. Facility Inventory
4. CIP Funding Tools
5. Priority Setting Framework: Guiding Questions and Needs Assessment Criteria
6. Proposed Siting Principles and Process
7. Resident Forum Feedback
Draft 2 - Page 76-MU

Appendix 1 – Community Facilities Study Charge and Committee Members
Appendix 1: Community Facilities Study Charge and Committee Members
Arlington Community Facilities Study ‐ A Plan for the Future
January 23, 2015
PURPOSE
Build a consensus framework regarding future revenue and facility needs that will inform County and
School Board decision‐making related to meeting the community's requirements for additional school,
fire station, vehicle storage sites and other facility needs in the context of Arlington's and the region's
projected 5, 10 and 20 year economic and demographic growth.
KEY QUESTIONS
What are our facility needs for schools, fire stations, recreation, and transportation vehicle
and other storage?
How do we pay for these needs?
What principles and criteria should we use to help us decide where to locate them?
In the context of changing demographics and economics, what opportunities and challenges
are there in our aging affordable and workforce multi‐family housing stock?
What do changes in the Federal government presence and the residential and private
commercial marketplace mean for County revenues?
CHARGE
The Study Committee is charged with:
1. Examining and, to the extent necessary, reconciling existing demographic and economic
forecasts for 5, 10, and 20 years out to produce a single set of forecasts for both the County
and Schools.
2. Identifying strategic community challenges that, if unaddressed, could threaten Arlington's
overall sustainability (for example, significant school population growth, threats to our
revenue base and any resulting operating budget challenges, constraints on borrowing,
continuing losses of affordable and workforce housing, growing transportation facility
demands (roads, transit, etc.), aging infrastructure, growing use of and demand for park and
recreational facilities, growing needs for County services based on demographic trends).
a. Developing a detailed description of each challenge
b. Identifying the constraints and barriers to addressing identified challenges.
c. Developing alternative strategies to address identified challenges. Consideration should
be given to finding more efficient ways to use existing facilities and sites, co‐ location of
appropriate uses, and temporary or permanent use of private space.
Draft 2 - Page 77-MU
Appendix 1 – Community Facilities Study Charge and Committee Members
3. Identifying Arlington’s key facility assets and needs ‐ County and Schools 5, 10 and 20 years
out. This should be based upon an inventory of existing County and School physical assets.
4. Reviewing likely revenue projections, by source, for the next 20 years. This should be based on
an analysis of trends in commercial and residential real estate values, as well as best estimates
of federal and state aid. This part of the study should include a sensitivity analysis that
presents three alternative futures – high, medium, and low growth
5. Proposing criteria and a process for siting any new County or School facilities or adding new
or expanded uses to existing facilities or sites.
Study Committee
A Chair and Vice Chair will lead the Study Committee. Total additional membership shall be no greater
than 22 Arlington residents and business owners. They, along with the Chair and Vice‐ chair, will be
appointed by the County Board and the School Board.
Two County Board members and two School Board members will serve as liaisons to the Study
Committee.
The Study Committee will have dedicated technical and communication staff support or consultants
provided by the County and the school system.
Resident Forum
A Resident Forum open to all interested Arlingtonians will be established to aid the Study Committee
in its work and provide the broadest possible community input to the Study Committee's
recommendations. Any Arlington resident/employee/business owner is welcome to participate.
Existing community groups (e.g civic associations, PTAs, not‐for‐profit organizations, condo
associations) will be invited to send a participant and identify an alternate to the Forum. The Resident
Forum will meet at least monthly with the Study Committee.
The Study Committee shall conduct a number of public education sessions with the Resident Forum
designed to engage the broader community to key ideas and challenges associated with the Charge.
Should the Study Committee establish working groups or subcommittees, membership may be drawn
from the Resident Forum. As the work of the Study Committee moves to considering
recommendations, the Resident Forum will serve as a sounding board.
Outreach
Outreach using multiple communication platforms and techniques in varied settings will be conducted
across Arlington throughout the study. The Study Committee will seek to partner with existing
organizations to maximize opportunities to share information and seek input.
Resources to support expert speakers, develop videos or other records of the proceedings, and
communicate findings or support meetings in appropriate languages will be reasonably available.
Products and Timeline
The Study Committee shall report to the two boards in September 2015 and November 2015. Over
the course of its work, the Study Committee will produce materials that are designed to guide the
community's consideration of the key questions. Such materials could include:
Draft 2 - Page 78-MU
Appendix 1 – Community Facilities Study Charge and Committee Members
a. A report on demographic and economic forecasts, including an appendix that clearly
presents the methodology and data sources.
b. A draft report that details key challenges facing Arlington.
c. An inventory of existing County and School physical assets and property and a
projection of new facility needs based on demographic trends.
d. A forecast of County revenue trends under a range of scenarios at 5, 10, and 20 years
out.
e. An analysis of best practices in public facility finance as applied to Arlington County
In order to inform the development of the 2017‐2026 CIPs, proposed criteria and a related process for
siting any new County or School facilities or adding new uses to existing facilities or sites will be
presented in September 2015 along with any additional information the Study Committee wishes to
provide the two Boards.
The Study Committee's Final report should be presented in November 2015 and may include
recommendations for next‐step public processes, as necessary, to develop targeted policy
recommendations related to any aspect of the charge.
Following receipt of each of the two reports, the County Board and School Board will determine
appropriate next steps which will likely include commission reviews, work sessions, and/or public
hearings before taking any actions deemed necessary.
Resources
1975 Citizen Newsletter
2011 Memorandum of Understanding between County Board and School Board on use of
County Held Land for Public Education purposes
2014 Arlington County Profile
2015 Affordable Housing Study report
2015 Public Spaces Master Plan Update process and land Inventory 2015‐2024 Arlington County and
Arlington Public School CIPs
2015 Arlington Public Schools Annual Facilities and Student Accommodation Plan (AFSAP)
APS website ‐ More Seats for More Students
Arlington County Website ‐ Public Facilities Review Committee projects, links to the Comprehensive
Plan and its elements
Metropolitan Washington Council of Governments' Round 8.2 Forecasts for Arlington and the Region
Arlington County GLUP Booklet and Map
Draft 2 - Page 79-MU
Appendix 1 – Community Facilities Study Charge and Committee Members
Community Facilities Study Committee Members
John Milliken, Chair
Ginger Brown, Vice‐Chair
Economic Sustainability Subcommittee
John Milliken
Moira Forbes
Alan Howze
Greg Greeley
Bryant Monroe
Kate Roche
Demographics Subcommittee
Ginger Brown
Jason Rylander
Toby Smith
Jackie Snelling
Anne Steen
Gabriela Uro
Facilities Subcommittee
John Milliken
Christer Ahl
Hans Bauman
Sal D’Itrii
Saundra Green
Kelly King
Kathleen McSweeney
Kirit Mookerjee
Siting Principles Subcommittee
Ginger Brown
Tyra Banks
Carolina Espinal
Lynn Pollock
Tannia Talento
Staff Team
Consultant
Susan Bell
County Staff1
Gabriela Acurio, County Manager’s Office
Robert Brosnan (former staff)
Claude Williamson, CPHD
Jennifer Smith, CPHD
Matthew Ladd, CPHD
Jessica Margarit, CPHD
Elizabeth Hardy, CPHD
Andrew D’huyvetter, CPHD
Joel Franklin, CPHD
Alex Iams, AED
Lynn Porfiri, County Manager’s Office
George May, DES
Lisa Maher, DES
Erik Beach, DPR
Irena Lazic, DPR
Bethany Heim, DPR
Arlington Public Schools Staff
Lisa Stengle, APS Planning & Evaluation
John Chadwick, APS Facilities
Scott Prisco, APS Facilities
Lionel White, APS Facilities
Meg Tuccillo, APS Facilities
1 AED: Arlington Economic Development; CMO:
County Manager’s Office; CPHD: Community Planning, Housing & Development; DES: Department
of Environmental Services; DPR: Department of Parks & Recreation
Draft 2 - Page 80-MU

Appendix 2 – County and APS Improvements
Appendix 2: County and APS Improvements (section previously in Chapter 1 in Draft 1) Schools and County Collaboration
County and Schools senior staff members have increased their collaborative efforts to discuss
issues pertaining to future projects among themselves and with community groups such as the
Advisory Council on School Facilities and Capital Programs (FAC) and South Arlington Working
Group.
County and Schools are entering a second phase of work with the consultant team that
reviewed the school projection and population forecast methodologies as part of the
Community Facilities Study. This second phase will test out proposed refinements to the
methodologies. This work is expected to wrap up after the Community Facilities Study is
complete, and the results will be shared with the County Board, School Board, and the public.
County staff have assembled a detailed database of housing units with a variety of additional
housing characteristics and have shared this data with Schools staff. Schools staff will use this
data to monitor and analyze school enrollment trends for different housing characteristics. The
consultant team will perform an initial analysis and provide recommendations for future process
improvements for enrollment projections.
The County and Schools have completed a Memorandum of Understanding that will allow
Schools staff to share aggregated student data with County staff for planning purposes while
protecting individual student privacy.
The County and Schools have developed a timeline for consistently exchanging housing,
development, and demographic data on an annual basis.
The County and Schools have collaborated on the “Find Your School” web application to help
APS staff and parents find their assigned neighborhood schools by searching for a prospective
street address.
Schools will provide County staff with estimates of the number of students that will be
generated by Site Plan, Use Permit, and Form Based Code applications.
Increasing Transparency
Schools will continue to publish and post the ten year enrollment projections to the APS website
annually. In addition, this fall, Schools will release its first Annual Projections Report to provide
greater detail and transparency around the projection process in a concise easy to read
document. The Annual Projections Report will incorporate “Enrollment over Time” which was
requested by the Study Committee. In preparation for this first report, a draft using the 2014
projections is included in Appendix X of this document.
Schools are preparing to move to a new web hosting site that will go live for the 2016‐17 school
year. Over the course of the next year, APS will align the website resources with the Annual
projections report.
The County has created a web page that details its process for forecasting the County’s
population and employment.
Draft 2 - Page 81-MU

Appendix 2 – County and APS Improvements
Other Accomplishments
At the recommendation of the consultant team, the APS Director of Facilities Planning attended
the Davis Demographic and Planning Annual conference Population Association of America
Annual Meeting earlier this spring to gain advanced training on: .
o demographic analysis, long‐range planning, and GIS software applications for K‐12
school districts, and
o redistricting, forecasting, and mapping software..
The APS Department of Facilities and Operations has hired additional staff to increase its
capacity to project student enrollment and plan for new facilities.
The Department of Community Planning, Housing and Development launched initiatives to
provide more efficient planning and permitting review processes.
The Arlington Economic Development office was allocated additional funding in the FY 2016
Budget for marketing and promotional purposes to reduce office vacancy levels.
The Arlington County Zoning Ordinance was amended in 2015 to lengthen the duration of short‐
term indoor and outdoor events and activities.
Appendix 2: Demographic Forecasts and Projections
Demographic Forecasts & Projections Companion document [to be inserted]
Draft 2 - Page 82-MU
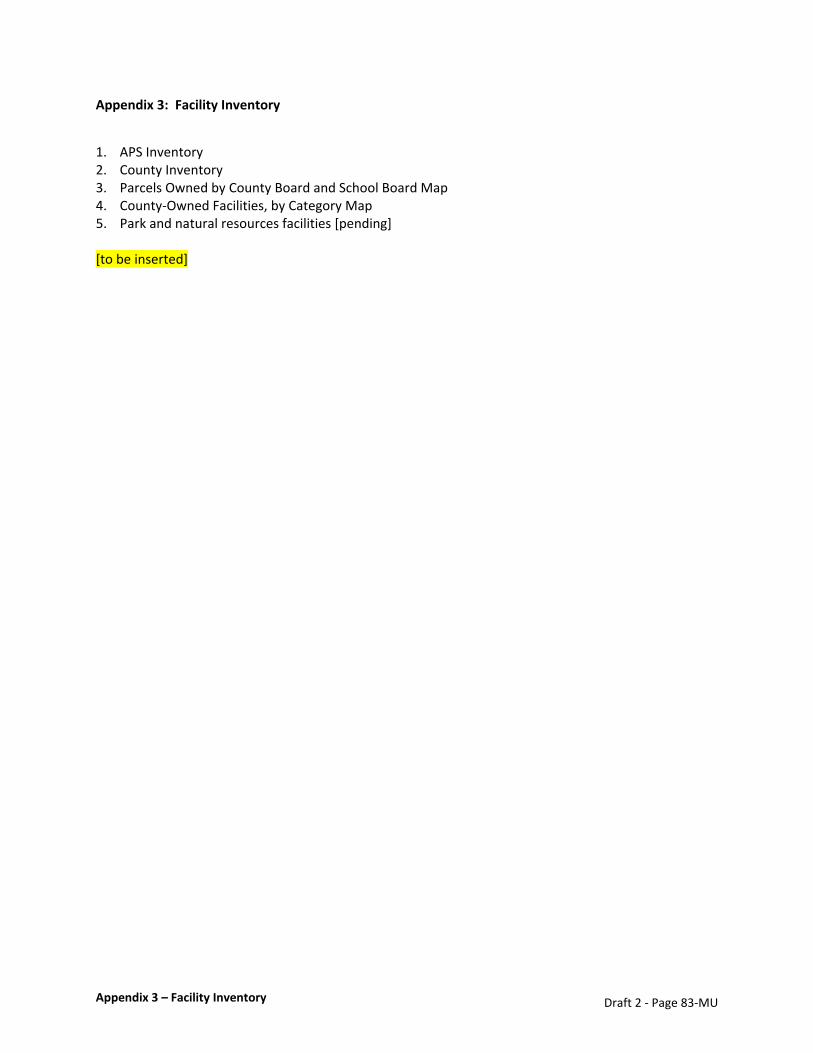
Appendix 3 – Facility Inventory
Appendix 3: Facility Inventory
1. APS Inventory 2. County Inventory 3. Parcels Owned by County Board and School Board Map 4. County‐Owned Facilities, by Category Map 5. Park and natural resources facilities [pending] [to be inserted]
Draft 2 - Page 83-MU

Appendix 4 – CIP Funding Sources
Appendix 4: Revenue ProjectionsCIP Funding Sources From revenue presentation
Slides 15‐23, 25‐29 [to be inserted]
From forecast presentation
Slides 9‐13 [to be inserted]
CIP Funding Sources Bonds are the primary financing source used by the County for major general government infrastructure since they are the lowest cost of capital available, given Arlington’s bond ratings. Bond financing refers to debt financing of projects. Arlington County most often sells general obligation
bonds. Bond financing is generated through the borrowing of funds (principal) at a cost (interest) through
the sale of municipal bonds. There are several types of bond financing:
General obligation bonds ‐ Arlington typically issues general obligation bonds, which must first be approved by the County’s voters and are secured by the full faith and credit of the County. Arlington’s practice is to schedule bond referenda for even‐numbered calendar years, which correspond to the bond sale in odd‐number fiscal years. General Obligation Bonds typically have a 20 year maturity and are limited by debt capacity guidelines.
Revenue and other types of bonds –Revenue bonds are typically secured solely by user fees or projected revenues and include no pledge from the General Fund. Revenue and other types of bonds (including those backed by the County’s subject to appropriation pledge) typically carry a higher interest rate than GO bonds and generally have debt service coverage and other financial restrictions.
Lease revenue or annual appropriation bonds – These types of bonds are secured by a “subject to appropriation” pledge by the County Board and do not require voter approval. (See “Lease‐purchase finance” below) They generally require the use of a third party to execute the lease transaction, such as the Industrial Development Authority (IDA), Virginia Resources Authority, or Virginia Municipal League / Virginia Association of Counties.
A multitude of other funding sources allow the County to balance its use of debt and pay‐as‐you‐go
sources.
Master Lease equipment purchase finance (or Master Lease) represents another source of capital
financing to acquire equipment, rolling stock, furniture and technology purchases that have useful lives
ranging from three to ten years. Master lease financing is very flexible, allowing the County to finance
projects with minimal transaction costs and on an “as needed” basis over the term of the master lease.
Because of the short‐term maturities of master lease financing, interest rates are typically lower than
rates on long‐term bonds. The County typically procures equipment using temporary funding sources,
and then draws funds from the master lease financing institution to reimburse the temporary sources.
Draft 2 - Page 84-MU

Appendix 4 – CIP Funding Sources
Pay‐As‐You‐Go (PAYG) comes from annual appropriations and is part of the adopted operating budget.
PAYG funding provides the greatest flexibility since it is not constrained by tax‐exempt bond
requirements and historically has funded maintenance capital projects, regional partnership programs
and other projects such as Neighborhood Conservation and Neighborhood Traffic Calming. Projects that
are typically smaller in scale as well as minor renovations are likely candidates for PAYG funding – as
long as the project has an expected useful life of at least 10 years or more.
The Transportation Capital Fund – Commercial & Industrial Tax is a source of funding authorized by the
General Assembly in 2007 enabling the County to levy an additional real estate tax on industrial and
commercial properties for transportation initiatives. In April 2008, the County Board adopted a tax of
$0.125 per $100 of assessed value for transportation projects. Proceeds of the tax are held in a separate
fund.
The Transportation Capital Fund – HB2313 Funds are revenues from the taxes and fees adopted by the
General Assembly in 2013 as part of HB 2313 and are distributed from the State to the Northern Virginia
Transportation Authority (NVTA). These include a 0.7% increase in the local sales tax, a 2% transient
occupancy tax, and a regional congestion fee of $0.15 per $100 added to the real estate recording tax.
The Northern Virginia Transportation Authority (NVTA) receives the proceeds of these new taxes, and
retains 70%, the HB2313 Regional portion, for funding of projects that are regional in nature. By law,
each locality’s long term benefit must be approximately equal to the proportion of the total fees and
taxes generated in the locality divided by the total of all fees and taxes received by NVTA. The NVTA
Board will approve projects for funding annually as part of its Six‐Year Program (SYP). The remaining
thirty percent, the HB2313 Local portion, of these new taxes and fees is returned on a pro rata basis to
the member localities based on the amount of revenue generated by the taxes and fees within the
locality. These funds are used for locally selected transportation projects and deposited into the
Transportation Capital Fund of the County along with the commercial & industrial tax.
The Crystal City – Potomac Yard – Pentagon City Tax Increment Financing Area was established in 2010
to support the infrastructure investment needed as part of the Crystal City Sector Plan as well as the
neighboring areas of Potomac Yard and Pentagon City. Tax increment financing (TIF) is a mechanism
used to support development and redevelopment by capturing the projected increase in property tax
revenues in the area and investing those related infrastructure improvements. Unlike a special district,
it is not an additional or new tax; rather, it redirects and segregates the increased property tax revenues
that would normally flow to the General Fund. The amount of tax increment revenue is determined by
setting a baseline assessed value of all property in the area on January 1, 2011 and in each subsequent
year, tracking the incremental increase in assessed values relative to the base year, and segregating the
incremental revenues in a separate fund. The County Board approved allocating 33 percent of the
incremental revenues to the Crystal City – Potomac Yard – Pentagon City area.
The Stormwater Management Fund relies on a source of funding adopted by the County Board in April
2008 to fund operating and capital costs to upgrade and expand the County’s stormwater drainage and
sewer infrastructure. The Board adopted a County‐wide sanitary district tax of $0.01 per $100 of
assessed value. This rate was raised to $0.013 in April 2010 and provides extra funds for capital
projects. The sanitary district tax could ultimately be used to support bond financing. Proceeds of this
tax are held in a separate fund.
Draft 2 - Page 85-MU
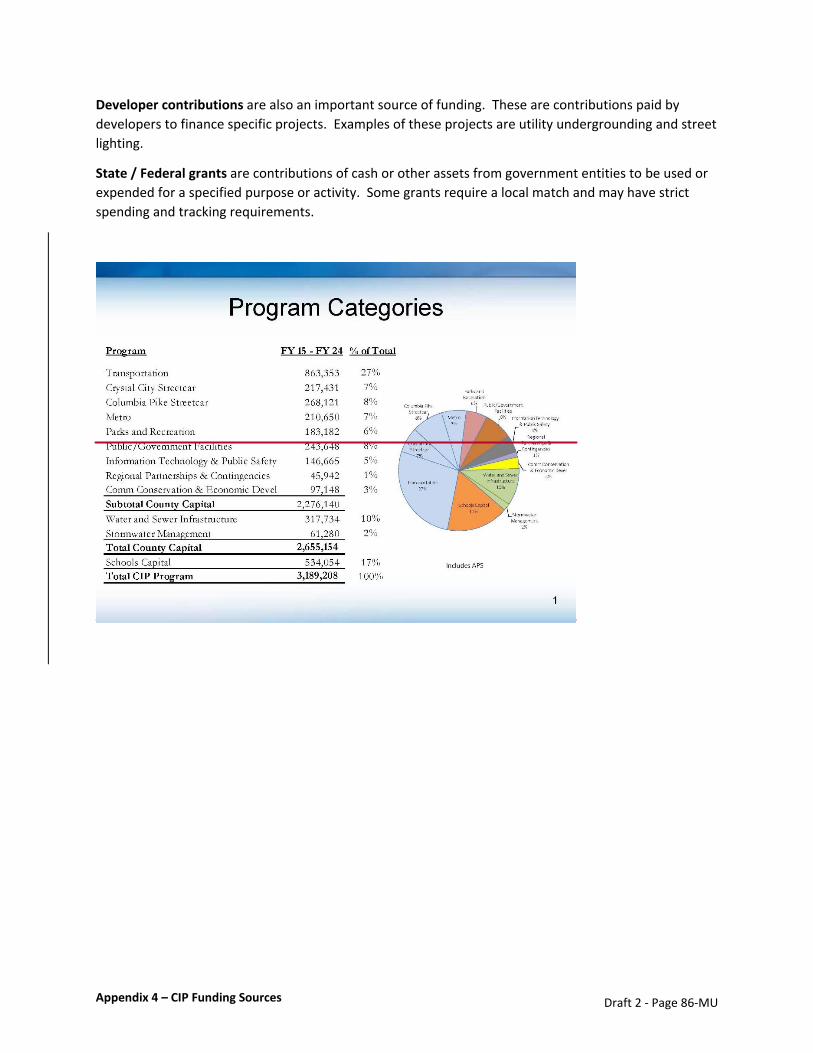
Appendix 4 – CIP Funding Sources
Developer contributions are also an important source of funding. These are contributions paid by
developers to finance specific projects. Examples of these projects are utility undergrounding and street
lighting.
State / Federal grants are contributions of cash or other assets from government entities to be used or
expended for a specified purpose or activity. Some grants require a local match and may have strict
spending and tracking requirements.
Draft 2 - Page 86-MU
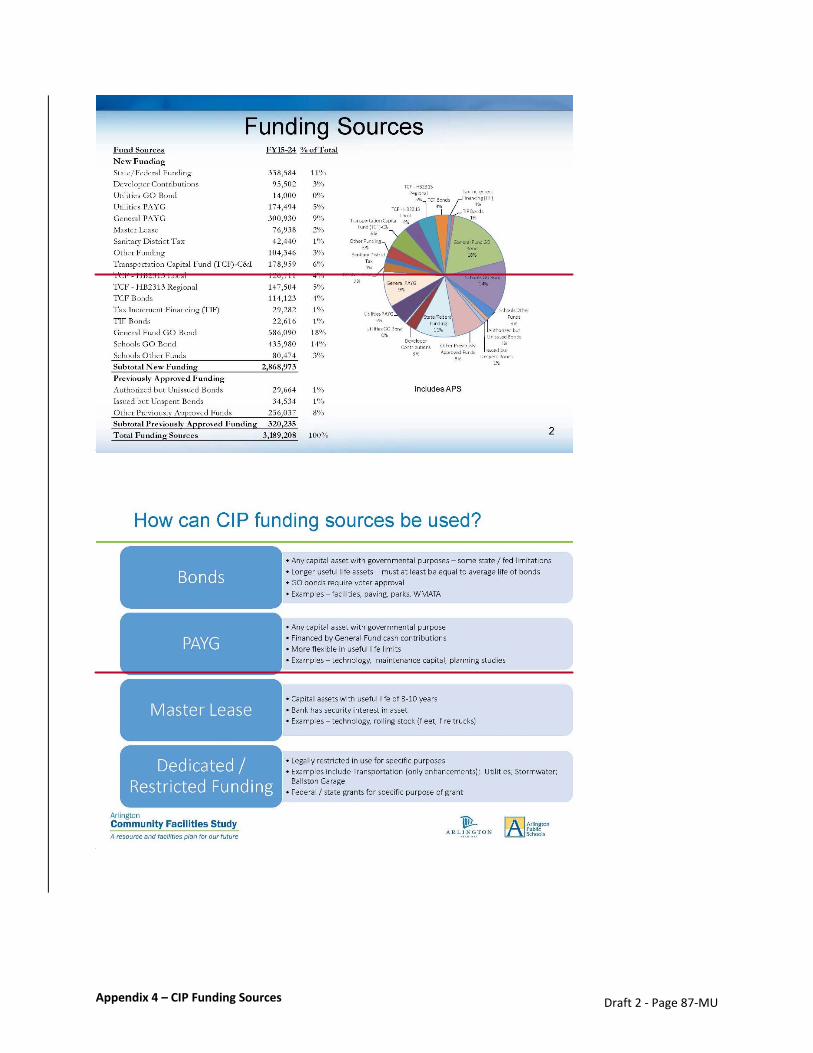
Appendix 4 – CIP Funding Sources
Draft 2 - Page 87-MU

Appendix 4 – CIP Funding Sources
Draft 2 - Page 88-MU

Appendix 4 – CIP Funding Sources
Draft 2 - Page 89-MU
Appendix 5 – Priority Setting Framework
Appendix 5: Priority Setting Framework: Guiding Questions and Needs Assessment Criteria
Proposed examples of questions to be considered in determining specific community facility needs
and the timing of their development
1. What types of facilities will need to be provided in light of Arlington’s expanding population and
changing demographics?
2. What criteria are relevant for assessing the needs for each type of facility?
3. How do we accurately assess the views and the interests of Arlington citizens in assessing
specific community facility needs?
4. Who needs to be involved in helping to assess the need for specific types of community
facilities? Which commissions? Which neighborhoods? Which citizens? How do we engage
them?
5. Do certain types of needs demand facilities which are geographically spread throughout the
county? Which facilities are these? Which facilities do not require such geographic distribution
throughout the county?
6. What are the specific predictions relating to expected increases and/or decreases in school aged
children at various grade levels? What do demographic forecasts tell us about the community
facilities we will need to meet their needs and the needs of other age groups?
7. How do we balance county and school facility needs so as to preserve diversity that
Arlingtonians have come to value and want to preserve?
8. How do we balance facility needs in one area of need against those in another given increasingly
constrained county budgets?
9. How immediate is a particular facility need? Can it be postponed or will postponing it only result
in a lack of an important facility needed to meet the full range of desired community services?
Draft examples of the types of criteria or considerations that might be considered by the staff working
group and proposed County Facilities Advisory Commission in the future in determining specific
facility needs:
Elementary, Middle and High Schools, Pre‐School; Child‐Care
When feasible, refer to VDOE’s Guidelines for School Facilities in Virginia’s Public Schools2
which address the following by school level:
o the size of a new school site
o minimum outside play areas
o classroom floor area
o location of elementary classrooms and
o space for other instruction needs (health and P.E., arts, etc.)
Any additional School Board policy guidance
2 http://www.doe.virginia.gov/support/facility_construction/building_regs_and_guidelines.shtml
Draft 2 - Page 90-MU

Appendix 5 – Priority Setting Framework
Neighborhood Parks
Walking distance to nearest park
Population density in the immediate area/neighborhood
Expected growth in population in a particular neighborhood/geographic area
Population age of surrounding area for relevant types of parks/recreation facilities if related to
specific age group (e.g. playgrounds, high‐rises that allow pets for dog parks)
Day time work population needs
Age/demographics of neighborhood residence
Current use statistics (such as time in use, waiting lists, density of use)
Public Libraries
Determine the estimated service population for each library and how the service population
might change over time
Assessment of increasing digital publication and its impact on library facility, equipment and
space needs
Assessment of library space needs (e.g. to accommodate its collection, reader seating and work
space, meeting rooms, staff workspace)
Assessment of how the increasing population and demographic changes will impact future
demand for specific library services and facilities
Use/demand for types of services;
Alternate delivery methods
Multi‐activity Indoor Country‐wide Recreation Center
Facility programing should be based on assessment of country‐wide indoor recreational needs
to include a community survey
Assessment of current county recreational recreation class demand and waiting lists
Assessment of opportunity to jointly serve and support current school based recreational
needs/activities
Assessment of expected future population growth/demographics
Assessment of existing recreational facility inventory in the County and in the region
density of population, use/demand, proximity, transportation/access for any specific service
centers (e.g. senior centers, cultural centers)
ART and School Bus Storage Facilities
Space and land
Number of buses for which storage is needed
Fire Stations
Overall coverage of existing fire stations
Draft 2 - Page 91-MU
Appendix 5 – Priority Setting Framework
Response time of 4 minutes or less
Level of demand for different functions and response time for different functions (e.g. fire vs
EMS)
response time plus time to hospital for total time from call to hospital arrival
Overlap of existing fire station response time of 4 minutes or less
Areas where response time is more than 4 minutes
Ability to meet increasing population growth by currently defined fire station planning areas
Clear understanding of existing fire and EMS demand
Assessment of high risk EMS areas; alternative responses and facility needs
Assessment of high risk fire areas (i.e. areas where fires could result in significant more damage)
Workload and overall demand analysis of existing fire stations and the planning areas they serve
County Equipment Storage Space
Geographic proximity of equipment, trucks, etc. to needed county services
Expected number of county vehicle, trucks, equipment, etc. for which storage space is needed
Community Meeting Space
Look to other community facilities where meeting spaces can be incorporated
Look for joint use opportunities that provide meeting space to meet the needs of specific
geographic areas
Summary: Setting priorities for the funding of public facilities in Arlington
The issue of the County and the Schools setting priorities for future funding and construction of
public facilities has been a topic of discussion in all of the Subcommittees.
The following is a recommendation that has grown out of those several separate discussions. It is
designed to achieve four goals:
Institutionalize better coordination between Schools and County and among the several
County departments including development of criteria for prioritizing facility needs
Improve the opportunity for public participation and input into the early stages of
facility planning
Bring together the information about ongoing demographic and economic changes in the
County and schools with the early planning and thinking about future facilities.
Identify long‐range strategic issues and their implications for facility needs and provide a
basis for prioritizing candidates for inclusion in a future update of the CIP.
Recommendation: Establish a Facility Strategic Planning Committee comprised of two County Board
and two School Board Members (with a rotating Chair) to set policy and give direction to a Joint
County/APS Staff Team chaired by a designated senior person from the County Manager’s office and
comprised of the key facilities planning staff from APS and County departments. The staff person
Draft 2 - Page 92-MU
Appendix 5 – Priority Setting Framework
designated to lead the effort must be senior enough to provide direction and leadership to the rest of
the team and be charged with taking a longer strategic view of needs. The longer term, strategic view
of needs—in conjunction with a recognition and understanding of immediate priorities—are critical to
ensuring a balanced view of capital needs.
The Facility Strategic Planning Committee would receive annual updates on demographic trends,
development market projections and other factors (including the natural aging of structures) that might
impact the need for future facilities.
Community involvement would be achieved through a County Advisory Commission similar to the
current APS FAC. It could meet jointly as needed with the FAC. Opportunities for broader
community input would be established.
In developing a master list of projected future needs, the four‐person Committee would review those
facilities currently including in the approved pipeline (e.g. the CIP) and also various adopted plans that
are part of the Comprehensive Plan, and supporting documents of the Comprehensive Plan including
sector and area plans that are adopted for different areas of the County.
The details of this recommendation would need to be worked out jointly by the County and APS, assuming
the two Boards wish to proceed. A more detailed working draft has been prepared (attached) and could
be included as an Appendix in the Final Report to further describe the DRAFT Needs Identification Process
and priority setting framework.
Draft 2 - Page 93-MU
Appendix 5 – Priority Setting Framework
Details: Priority Setting Framework for Public Facilities The Study Committee has raised several concerns about the manner in which County and School public
facility needs are currently identified, prioritized, and funded. These concerns include, among others, a
lack of knowledge by the community about what is needed and how specific projects are determined,
a perspective that opportunities have been missed to use land more efficiently, and that the County
and APS Capital Improvement Plans (CIPs) are not designed to strategically guide long‐ term plans for
public facilities. The following priority setting framework is intended to establish a:
Framework for a transparent process;
Clear basis and understanding for public facility needs;
Method for monitoring emerging trends/needs; and
Comprehensive planning approach.
The intent of this recommendation is to create closer alignment between the County and Schools’
capital planning efforts and a better community understanding of the full range of capital needs
including maintenance of existing facilities.
Recommendations:
Create a formalized and integrated framework at three levels: elected officials; joint
County and Schools staff; and community/commission, to achieve improved coordination
and collaboration.
Establish a process to identify needs early, raise awareness of needs with the community,
and strategize alternative solutions before the CIP funding prioritization and specific siting
processes begin.
Framework
Facility Strategic Planning Committee
At the highest level of the priority setting framework, a joint County Board and School Board Facility
Strategic Planning Committee should be established. This committee, comprised of 2 appointees from
each Board, would be tasked with institutionalizing improved coordination and collaboration across
County and School projects. Annual Chair rotation between County and School Board members would
be beneficial. Through regular meetings during the year (i.e. 3 – 4x/year), this Committee of the
Boards, would monitor and give strategic guidance on public facility planning and funding processes.
This would occur through:
o annual briefings on changing demographics, development projects, and real estate market
performance, among other factors that may impact the County’s population and economic
growth;
o review of future facility needs;
o development of key strategies and aspirational themes that influence long‐term public
facility planning;
o review of current projects and schedules offering guidance on project adjustments (i.e.
Draft 2 - Page 94-MU

Appendix 5 – Priority Setting Framework
timing changes, confirming or endorsing project details) should the need arise, including
guidance on potential formal actions needed by each Board;
o evaluation of project scope and analysis for emerging facility project proposals (as part of the
Needs Identification & CIP Funding Process outlined below) and trade‐offs including
consideration of co‐located facilities;
o review of priority options; and
o input from staff, a commission‐based working group, and the community.
Joint County and APS Staff Capital Improvement Team
Supporting the Facility Strategic Planning Committee, a Joint County/APS Staff team, chaired by a
senior staff member within the County Manager’s Office and comprised of the key facilities planning
staff from APS and County departments, would coordinate the County and APS CIP processes including
facility needs identification. This responsibility would be broad and would entail organizing the CIP
process and community engagement processes. Through regular interaction, this team would:
develop, for consideration by the Facility Strategic Planning Committee and the community,
criteria/a rubric/guidelines for prioritizing facility needs/ direction on how to do needs
assessment, including maintenance of existing facilities. Among the factors to consider would
be the relevant factors to assess needs for each type of facility and what the criteria are (i.e.
capacity, distance of travel, response times, geographic distribution of services, urgency of
need, legal requirements vs. guidelines/best practices
o coordinate/collaborate County and School projects, seeking partnerships where possible;
o monitor preparation and implementation of CIP;
o monitor development, demographic, and economic data and organize briefings for the
Joint CB/SB Facility Strategic Planning Committee;
o oversee community civic engagement and communications related to public facilities; and,
o coordinate a new commission‐based working group focused on community facilities.
Community Engagement
Two objectives are identified: a commission‐based working group and broad public involvement
throughout the priority setting process and development of the CIP.
A County advisory commission would be established with a role similar to the Schools’ Advisory Council
on School Facilities and Capital Programs (FAC). This group could meet jointly with the FAC to provide
input and guidance to the Facility Strategic Planning Committee on Countywide issues, such as
o key strategies and aspirational themes;
o facility needs
Draft 2 - Page 95-MU

Appendix 5 – Priority Setting Framework
o project analyses; and
o consistency with adopted County & School policies.
Secondly, the Arlington community would have opportunities to learn about facility needs and give
input on options to meet facility needs and funding prioritization.
Needs Identification & CIP Funding Process (“Phase 0”)
Four steps are envisioned as part of the Needs Identification and CIP Funding process to ensure there
is transparency in facility planning and to create opportunities for community input: Data input; Listing
of Needs; Analysis; and CIP Prioritization. The Needs Identification Process would occur prior to any
Siting Process. The community civic engagement process would allow for information sharing during
each step and for enhanced public involvement generally during Steps 2, 3 and 4.
Step 1 ‐ Data Input: Under direction by the Joint County and Schools Staff Facilities Team, each agency
or department would develop a list of needs based on input from service providers,
population/economic growth indicators, the current CIP, adopted policies and plans, and from County
Board & School Board priorities. A report identifying the inputs would be shared as background with
the public.
Step 2 ‐ List of Needs: A compiled list of needs would be prepared to address a long‐term horizon,
approximately 20 years. Needs would be identified by short‐, mid‐, and long‐term priority to
contextualize the anticipated timing. The list would also indicate whether the need aligns with
adopted policies and/or is included in the current CIP, and how the needs compare to the
criteria/rubric/guidelines. In cases where a need is geographically specific, a general location may be
given. This step would include an enhanced level of public participation with opportunities for
community input.
Step 3 ‐ Analysis: Once a need has been identified, staff may develop alternatives for how the need
could be addressed. Options may range from building expansion, relocation of a program, a change in
service level, to new construction. Options for new construction may entail rebuilding at an existing
site or may require a new site, which would trigger the Siting Process. The analysis would also
incorporate policy guidance from the Facility Strategic Planning Committee, such as opportunities for
co‐location. Once a recommendation for meeting a need is developed, the preferred option is eligible
for inclusion in the CIP. This step would include an enhanced level of public participation with
opportunities for community input.
Draft 2 - Page 96-MU

Appendix 5 – Priority Setting Framework
Step 4 ‐ CIP Funding Prioritization Process: As part of the funding prioritization process, fiscal
considerations are a significant factor in determining which projects would be included in the 10‐ year
CIP. Generally, projects in the near term CIP funding years (i.e. years 1‐4) have progressed through
prior CIP cycles. Projects identified for out‐year funding (i.e. years 5‐10) would come from the short‐
and mid‐term priority needs list from steps 2 and 3 above. The School Board and County Board would
each adopt their respective CIPs. Unfunded projects remaining on the List of Needs would be reviewed
again in future cycles. This step would include an enhanced level of public participation with
opportunities for community input.
Draft 2 - Page 97-MU
Appendix 6 – Proposed Siting Principles and Process
Appendix 6: Proposed Siting Principles and Process Revisions for CFS Report, Draft 2 October 23, 2015 Background When the County Board and School Board established the Community Facilities Study in January 2015, they tasked the Study Committee to propose “criteria and a process for siting any new County or School facilities or adding new or expanded uses to existing facilities or sites.” While many facility siting decisions made in Arlington over the last twenty years have led to successful outcomes, public facility projects are becoming more complex as the County’s population grows and available land and resources become more limited. Previous siting processes from the 1990s that guided decisions on County government facilities have become less relevant and are no longer applied consistently. There is also growing recognition of the need for creative designs and collaborative approaches to accommodate new facilities in harmony with existing programs, public spaces and natural resources. To address these issues, the Study Committee, with input from the Resident Forum, has developed siting principles and a siting process that improves upon current practices. The siting process is intended to function as a project management tool to make siting decisions efficiently, effectively, and with ample community input. While many of the steps and siting considerations included in the Study Committee’s recommendations are not new, this document sets forth for the first time a common set of principles and a process that can be employed by both the County and Schools. This process places a strong emphasis on civic engagement and communication with a broadly defined public. As future decisions about community facilities may be complex, those decisions at the staff and elected official levels should be made with transparency and with opportunities for public participation. When to use the siting process The siting process is intended to be used for County and School facility projects that require a physical location, either due to relocation or the construction of a new facility. The process could also be adapted to determine the preferred use or uses for a known site that is available for development (referred to as the use determination process). The County Board, School Board, County Manager, and/or School Superintendent will initiate a siting process for a specific project on a case‐by‐case basis. When determining whether the siting process will be used, decision‐makers should take into account the nature of the facility need, the size and scale of the facilities or sites under consideration, and the relative impact of the likely outcomes on the Arlington community. As this approach is anticipated to be require significant resources, particularly in terms of time and cost, it will be important to balance the level of investment in a siting process with the use of other established processes when determining when to utilize it. It is envisioned that the siting process would typically apply in the following situations:
Constructing a new County or School facility
Relocating an existing County or School facility to a new site
Draft 2 - Page 98-MU
Appendix 6 – Proposed Siting Principles and Process
Adding new uses to an existing facility or replacement facility
Determining the appropriate uses for County or School land (use determination process) The siting process would typically not apply in the following situations. However, some of these examples would be guided by other public processes, such as a use permit application or a Public Facility Review Committee process.
Renovating an existing facility with no change in use (e.g., maintenance capital programs)
Expanding an existing facility or replacing with a larger facility on the same site with no change in use, including adding relocatable classrooms to a school
Relocating uses within the County Trades Center
Increasing capacity for County or School operations within existing buildings
Relocating County/Schools office functions to a different office building
Relocating programs or services to leased space, especially when public disclosure of negotiations would adversely affect the County’s or Schools’ bargaining position; however, leased space could be an option for a siting a facility as part of a larger siting process
Establishing a temporary facility or short term use that is in operation for three years or less
Constructing or relocating a facility or public space when the location is clearly identified in a detailed long range plan, such as a Sector Plan or Comprehensive Plan element
Determining the appropriate uses for County or School land when the site is addressed in detail in a long range plan, such as a Sector Plan or Comprehensive Plan element, or when an alternate planning process (e.g., Sector Plan, Phased Development Site Plan) has been identified for the site
Even in cases where the siting process is not applied, County and/or Schools staff are encouraged to follow the phases and steps outlined in this approach, as appropriate, with community engagement at the “inform” level of the public participation spectrum. See Community's role in the siting process. The decision to apply the siting process to a particular project should be made as early as possible after a facility need is identified to allow the process to be built into the project schedule and to ensure that the adequate staffing resources will be available. If it is determined that the siting process does not apply to a specific situation or that another process should be followed instead, that decision should be communicated to the public. It is anticipated that most siting processes would occur after a project has been identified in the County’s and/or Schools’ Capital Improvement Plan. The use determination process for an available public site could occur prior to a facility being identified in the Capital Improvement Plan. Identifying and prioritizing facility needs Prior to a siting process, it is critical that the County and Schools identify and prioritize their facility needs. Participants in a siting process will need to know the range of facility needs to make informed recommendations on multi‐use facilities or sites. The Community Facilities Study Committee’s final report, which will be presented to the County and School Boards in November 2015, will include recommendations for identifying and setting priorities for facility needs. These recommendations include a framework for setting public facility priorities and the establishment of a facility strategic planning committee consisting of County and School Board members, a citizen advisory commission, and a strategic staff planning group. While it is recognized that this work will not be completed in
Draft 2 - Page 99-MU
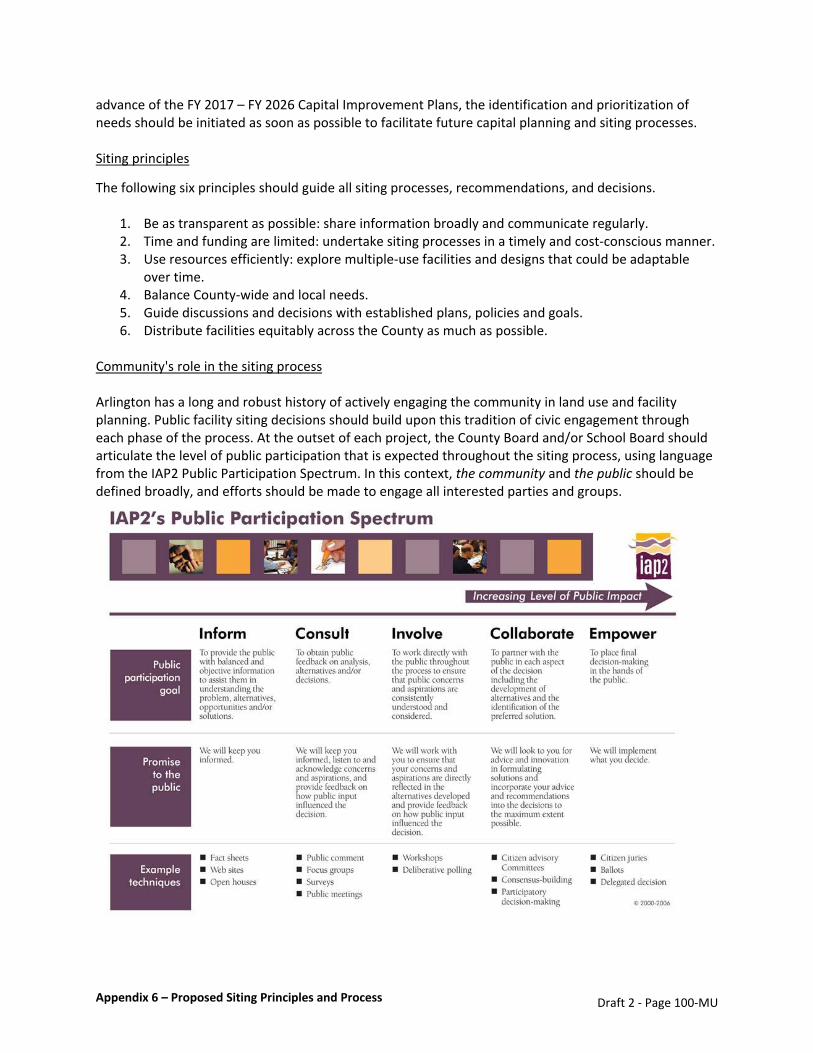
Appendix 6 – Proposed Siting Principles and Process
advance of the FY 2017 – FY 2026 Capital Improvement Plans, the identification and prioritization of needs should be initiated as soon as possible to facilitate future capital planning and siting processes. Siting principles
The following six principles should guide all siting processes, recommendations, and decisions.
1. Be as transparent as possible: share information broadly and communicate regularly. 2. Time and funding are limited: undertake siting processes in a timely and cost‐conscious manner. 3. Use resources efficiently: explore multiple‐use facilities and designs that could be adaptable
over time. 4. Balance County‐wide and local needs. 5. Guide discussions and decisions with established plans, policies and goals. 6. Distribute facilities equitably across the County as much as possible.
Community's role in the siting process Arlington has a long and robust history of actively engaging the community in land use and facility planning. Public facility siting decisions should build upon this tradition of civic engagement through each phase of the process. At the outset of each project, the County Board and/or School Board should articulate the level of public participation that is expected throughout the siting process, using language from the IAP2 Public Participation Spectrum. In this context, the community and the public should be defined broadly, and efforts should be made to engage all interested parties and groups.
Draft 2 - Page 100-MU

Appendix 6 – Proposed Siting Principles and Process
Since each individual process will be different, the level of public participation may vary to suit the scope
of the project. In general, County and/or Schools staff will facilitate siting processes and make
recommendations to the respective decision‐making body, taking into consideration input and feedback
collected through a civic engagement process in partnership with the community. Some steps of a
process may be led or conducted entirely by staff; other steps may be led by or conducted in
partnership with community members, as outlined in the evaluation framework that will be developed
for each process (see Phase 1 of the Siting Process). For more complex processes, an advisory group
consisting of interested community members with a defined charge could be the primary means of civic
engagement. This group could be an established advisory board or commission with knowledge and
expertise relevant to the project or an ad hoc working group appointed by the County Board, School
Board, County Manager, and/or Superintendent.
Ongoing opportunities for dialogue between staff and the community should be built into the process. Examples include, but are not limited to citizen working groups, established advisory boards and commissions, public forums, virtual meetings, and targeted outreach to community groups that would be affected by decisions but are not typically represented in public processes. Information sharing is a key component of civic engagement. The County and/or Schools should commit to transparency and consistency in communicating with residents. Public information and materials should be provided early and often and should be accessible to diverse groups through a variety of channels. This includes information about the process, opportunities to participate in the process, and any decisions made as the process progresses. These channels should include existing and new platforms for communication. While most information should be shared with the public, it is important to recognize that Virginia’s Freedom of Information Act allows the County and Schools to not disclose certain information that would be relevant to a siting process. One example is discussion about real estate transactions that would affect the County’s or Schools’ bargaining position or negotiating strategy. Reviewing and amending the siting process The siting process should be considered a living document. Initial uses of the process should be considered test cases, and participants in these early projects should consider and recommend process improvements to the County and School Boards. The recommended facility strategic planning committee, consisting of County and School Board members, should review the this document periodically to ensure it is effective in guiding decisions.
Draft 2 - Page 101-MU

Appendix 6 – Proposed Siting Principles and Process
Siting Process The framework for the facility siting process consists of four phases. This process narrative describes steps and outcomes for each phase. The phases are intended to be sequential. However, the steps within each phase are not intended to be linear. Multiple steps within a phase may take place concurrently, or steps may be iterative. This siting process can be adapted to a variety of situations. Depending on the specific circumstances of the facility project, some steps may be modified or eliminated. The process narrative generally describes the steps and outcomes for situations when a known facility requires a site. The description of each phase also includes recommendations for how the steps and outcomes could be modified for situations when new use(s) will be determined for a known site (use determination process).
The overall process for a specific project, including timelines for major milestones, should be communicated to the public as early as possible. A status report to the decision‐makers (County Board, School Board, County Manager, and/or School Superintendent) and to the community should be provided at the conclusion of each of Phases 1, 2 and 3. This status report could be a letter that summarizes the process steps, outcomes to date, key issues, and outstanding concerns. The siting process differentiates between identified uses and complementary uses. A siting process’s identified use is the public facility use that is most critical or has siting requirements (e.g., land area, zoning) that are the most difficult to meet. In some circumstances, the facility needs identification and prioritization process may determine that multiple uses should be sited together (e.g., a school and a community center) as a joint use facility. In these cases, the joint use facility should be considered the
Draft 2 - Page 102-MU

Appendix 6 – Proposed Siting Principles and Process
identified use. Complementary uses are uses that could be included with an identified use to maximize the efficient use of public land or to provide other colocation benefits, such as shared resources (e.g., staffing, finances, open space, parking). Complementary uses may include existing programs and uses on a potential site. Phase 1: Scope identified use and process Steps a. Demonstrate and communicate need for identified use – The need for the identified use will have
been established through a prior process of identifying and prioritizing facility needs. At the outset of the siting process, the County and/or Schools should communicate basic information and facts about why the facility is needed. If a use is being relocated, the rationale for needing a new site should also be demonstrated and communicated.
b. Identify civic engagement process and communications plan – The mechanism(s) for public participation in the siting process should be established early so that the community has an opportunity to provide input on the siting considerations, evaluation framework, and other steps in the process. This could occur by the decision‐making body adopting a charge or process outline that sets forth goals, a framework for community participation (i.e., who participates and what roles), decision‐making steps, and a timeline. The participants in the process may evolve throughout the phases as the sites or uses being considered are refined. The civic engagement process should make every effort to allow all interested citizens to participate prior to the County and/or School Board seeking public input in Phase 4 . For more complex processes, an advisory group consisting of interested community members with a defined charge could be the primary means of civic engagement. This group could be an established advisory board or commission with knowledge and expertise relevant to the project or an ad hoc working group appointed by the County Board, School Board, County Manager, and/or Superintendent. See Community's role in the siting process above. At a minimum, the following questions should be posed when developing the civic engagement process and communications plan.
i. What level of public participation is expected for each step in the process?
ii. How and when will community input be sought, and how will this input influence recommendations and decisions?
iii. What communities should be encouraged to participate in the siting process, and what are their roles in the process? How will the County and/or Schools reach out to groups that are not typically represented in public processes?
iv. What advisory groups and commissions should be encouraged to participate in the siting process, and what is their role?
v. How might the public participation process change throughout the phases as the site or use options under consideration are refined?
vi. Who will make recommendations to the decision‐makers at the end of Phase 3?
vii. How and when will information be shared with the broader community?
Draft 2 - Page 103-MU

Appendix 6 – Proposed Siting Principles and Process
c. Determine siting requirements – Siting requirements are the characteristics of a site that are required for the intended public facility to function. These requirements should be determined by the service provider and should be limited to the most critical requirements needed to meet service delivery standards. In some circumstances, one or more of the siting considerations described below could be a siting requirement (e.g., site availability).
d. Determine and prioritize siting considerations – Siting considerations are the characteristics of a site that are highly desired by the service provider and other stakeholders. It may not be possible to identify a site that addresses all of the siting considerations, so it may be necessary to prioritize the considerations. Siting considerations should be identified and prioritized in Phase 1. Analysis of the siting considerations will occur in Phases 2 and 3 as specified in the evaluation framework. In addition to the major siting principles that guide the process, all projects should consider the following:
i. Site suitability – Consider whether a site’s physical characteristics are appropriate for the proposed use.
ii. Facility function and impacts – Examples of impacts to be analyzed include economic, demographic/diversity, transportation, green space, environmental, and neighborhood‐specific. Additional impacts may be identified, and impact statements should be provided consistent with the level of analysis and based on the best information available.
iii. Location within the County – The location of facilities should be consistent with efficient, effective service delivery. When considering the equitable distribution of facilities, the analysis should recognize both positive and negative potential impacts on nearby communities and the County as a whole.
iv. Site availability – The selected site for a facility should be available at a cost that meets the project’s budget or with an explanation of why an additional expenditure is necessary. The site should also be available within a time frame that meets the service delivery need.
v. Cost and financing – Rough cost estimates can facilitate comparisons between multiple site options. More complex projects (e.g., co‐located facilities, public‐private partnerships) can increase costs but may provide additional benefits. If possible, consider the impacts of both capital and future operating expenses, including any costs for relocating or temporarily disrupting programs or uses that exist on the site. Also consider potential funding options.
vi. Existing conditions – Establish a baseline of existing conditions, including natural and historic resources; transportation/infrastructure; government or community programs and uses; land use context; adopted regulations, plans and policies; and legal restrictions on the use of the property. The existing level of services provided on a site should be maintained or increased either on‐site or at an appropriate alternative site.
vii. Opportunity cost – Consider the future opportunities for a site that would be given up if the site is selected for today’s facility need.
viii. Additional considerations – Considerations that are unique to a specific project or facility should be identified.
Draft 2 - Page 104-MU
Appendix 6 – Proposed Siting Principles and Process
e. Develop evaluation framework – The evaluation framework will determine how the siting requirements and considerations will be evaluated and who will evaluate them. As the process progresses from identifying potential sites, to refining those sites to a short list, to identifying a preferred site, different siting considerations would be applied. The framework may be revisited throughout the process as new information is learned. If the framework is revised during the process, any changes should be widely communicated. At a minimum, the following questions should be posed when developing the evaluation framework.
i. What is the problem that this siting process seeks to address?
ii. What are the critical siting requirements and broad siting considerations that will be used to evaluate sites in Phase 2?
iii. What are the more detailed siting considerations that will be used to evaluate sites in Phase 3? Theses siting considerations will typically require a finer level of analysis and more County/School resources than those used in Phase 2.
iv. Who will perform the evaluation in Phases 2 and 3?
v. How many options will be evaluated in phases 2 and 3?
vi. What communities would be affected by possible outcomes of a siting decision, how will the potential impacts on these communities be evaluated and communicated, and how will the affected communities be engaged in the process?
vii. What are the barriers that could make it difficult to reach a decision, and what can be done to avoid or move past them?
viii. What is the timeline for the completion of each phase?
f. Consider potential complementary uses and partnership opportunities – Potential complementary uses that have been identified through the needs identification and prioritization process should be considered for compatibility with the proposed identified use. Special consideration should be given to the colocation of County and School uses, which should be guided by previously adopted policies and agreements between the two Boards on jointly developing and using facilities. Private uses could also be considered; for example, a public‐private partnership could be utilized to help finance the construction of a public facility or to implement other County or School plans or policies. If a partnership is being pursued, additional participants and steps will likely be necessary throughout the process.
g. Outline project schedule and budget – A generalized schedule and budget for the facility project will influence the feasibility of different site and use options and should be communicated early in the process.
h. Develop siting process timeline – The timeline for reaching a siting decision should seek to reach a conclusion in a timely manner and should fit into the overall schedule for funding and constructing the facility project. This process timeline should also be communicated early in the process.
Draft 2 - Page 105-MU
Appendix 6 – Proposed Siting Principles and Process
Outcomes a. Common understanding of identified use and/or facility scope
b. Siting requirements and considerations
c. Evaluation framework
d. Potential complementary uses and partnership opportunities
e. Civic engagement process and communications plan
f. Facility project schedule and budget
g. Siting process timeline
h. Status report to decision‐makers and community
Adapting Phase 1 to Use Determination Process Phase 1 of a process for determining uses for a known site would be similar to the process described above with the following exceptions: a. Instead of demonstrating why a facility is needed, the County and/or Schools would demonstrate
why the property is available for a new use.
b. Instead of determining the siting requirements for an identified facility need, the known site would be analyzed to determine the significant characteristics of that site. This site analysis would be an outcome of Phase 1.
c. The evaluation framework would determine how use options that are compatible with the site will be prioritized and who will evaluate alternative use scenarios.
Phase 2: Identify potential sites
Steps a. Proceed with civic engagement process and communications plan – The civic engagement process
and communications plan developed in Phase 1 should be followed throughout the process.
b. List potential sites – Potential sites that appear to meet the siting requirements should be identified and communicated. Identification of sites should include community input. If sites that do not meet the requirements are eliminated from further consideration, such decisions should be shared with the public.
Draft 2 - Page 106-MU
Appendix 6 – Proposed Siting Principles and Process
c. Use evaluation framework to analyze sites at a broad level of detail – As indicated in the evaluation framework, potential sites should be analyzed at an appropriate level of detail to narrow the list of sites to two or three. This evaluation would likely include all of the siting requirements and those siting considerations that do not require detailed analysis such as design studies.
d. Explore feasibility of complementary uses and partnerships – Analyze the feasibility of potential complementary uses and partnership opportunities identified during Phase 1. This level of analysis should be more conceptual and should not consider the feasibility of specific sites.
e. Refine list of sites for further evaluation – Using the results of the analysis of potential sites, determine two or three sites that appear to best meet the siting requirements and considerations. These sites will continue to be evaluated in Phase 3.
f. Confirm and revise siting process timeline if necessary – Make every effort to keep the siting process on schedule. If additional time is needed, recognize the implications on the facility project’s overall schedule and the impacts on service delivery.
Outcomes
a. List of all sites considered, including those eliminated
b. Analysis report of the evaluation process and recommendation of two or three sites for further evaluation in Phase 3
c. Analysis report for complementary uses and partnership opportunities
d. Siting process timeline
e. Status report to decision‐makers and community
Adapting Phase 2 to Use Determination Process Phase 2 of a process for determining uses for a known site would be similar to the process described above with the following exceptions: a. Instead of identifying potential sites, the use determination process would list potential uses for the
site. Potential uses should be consistent with previously identified public facility and open space needs. The need for these potential uses should be demonstrated.
b. Basic site requirements for potential uses should be established to facilitate evaluation.
c. The phasing of uses on the site, considering short term and long term needs, should be considered.
d. A list of all uses considered for the site, included options eliminated from consideration, and a list of two or three use options for further evaluation will be outcomes of Phase 2. Use options could include one use or multiple uses
Draft 2 - Page 107-MU

Appendix 6 – Proposed Siting Principles and Process
Phase 3: Evaluate short list of sites Steps a. Proceed with civic engagement process and communications plan – The civic engagement process
and communications plan developed in Phase 1 should be followed throughout the process. Community members or groups with a specific interest in the sites chosen for detailed analysis should be notified and actively encouraged to participate in the process, if they are not already involved.
b. Develop design studies/analyses – The design studies for the two or three sites selected for further evaluation will illustrate potential site layouts. They should provide a sufficient level of detail to facilitate analysis of local impacts (e.g., transportation, green space) and to further evaluate the feasibility of complementary uses.
c. Use evaluation framework to analyze sites at a finer level of detail – As indicated in the evaluation framework, the two or three selected sites should be analyzed at a level of detail that allows a comparison of the potential impacts, costs, and benefits for each site.
d. Develop rough cost estimates – Order of magnitude cost estimates should be provided for the development of the sites selected for further evaluation. Additional cost estimates for alternative site layouts or use options could also be developed if necessary. Costs estimates should consider both capital and future operating expenses, including any costs for relocating or temporarily disrupting programs or uses that exist on the site. If complementary uses or partnerships are being considered, take into account potential cost savings. Opportunities for creative financing mechanisms could also be explored.
e. Refine and analyze potential complementary uses and partnerships – Determine the feasibility of complementary uses and partnerships for each site, building upon the Phase 2 analysis.
f. Confirm and revise siting process timeline if necessary – Make every effort to keep the siting process on schedule. If additional time is needed, recognize the implications on the facility project’s overall schedule and the impacts on service delivery.
g. Engage community prior to recommendations – A summary of the process and analysis should be provided to stakeholders and the broader community with opportunities for input on final recommendations. This could be accomplished through a community workshop or other civic engagement tools.
h. Recommend a preferred site, uses and/or partnerships – A final recommendation that takes into account the analysis and public input will be provided to the County Board and/or School Board. This recommendation should include a preferred site for the identified use, any recommendations on complementary uses and/or partnerships, and any additional guidance, such as steps to minimize impacts on site resources and existing uses. The recommendation may also include alternatives that could be supported if the preferred option cannot be implemented.
Draft 2 - Page 108-MU

Appendix 6 – Proposed Siting Principles and Process
Outcomes a. Analysis report for evaluated sites
b. Community review of analysis
c. Recommendation for preferred site
d. Recommendation for any complementary uses and/or partnerships
e. Additional guidance on site development, including steps to minimize impacts on site resources and existing uses
f. Siting process timeline
g. Status report to decision‐makers and community
Adapting Phase 3 to Use Determination Process Phase 3 of a process for determining uses for a known site would be similar to the process described above with the following exceptions: a. Design studies and analyses for two or three use options should be developed for the site.
b. The final recommendation will be the preferred use or uses for the site with alternative options that could be supported if the preferred option cannot be implemented.
Phase 4: County/School Board decision Steps a. Solicit public input on recommendations – The County Board and/or School Board will provide an
opportunity for public input on the final recommendations from Phase 3 prior to taking action.
b. Consider recommendations and act – The County Board and/or School Board will consider the recommendations from Phase 3, take action on the recommendations, and direct the County Manager and/or Superintendent on next steps.
c. Initiate development review process – After deciding to proceed with a site and use(s), the County Board and/or School Board will initiate the development review process for the project by providing guidance to the reviewing advisory group(s). Depending on the specific project being reviewed, these groups could include the Public Facilities Review Committee, the Site Plan Review Committee, the Long Range Planning Committee, and/or the Building Level Planning Committee.
Draft 2 - Page 109-MU

Appendix 6 – Proposed Siting Principles and Process
Outcomes a. Approach for site and use(s)
b. Guidance to advisory group(s) for development review
Draft 2 - Page 110-MU

Appendix 7 – A Summary of Resident Forum Table Discussions
Appendix 7: A Summary of Resident Forum Table Discussions (New Appendix for Draft 2)
CFS Meeting, February 25, 2015
Recurring Themes from Resident Forum Table Discussion on Economic Sustainability
10 groups, 71 participants
Question 1: What future challenges do you see to Arlington’s basic economic model of reliance on the commercial sector (office, multi‐family rental residential and retail) for 50 % of its real estate taxes?
The factors that help Arlington grow in the past have changed. Neighboring communities are
now more competitive; Metro now reaches beyond Arlington, and these areas often have newer
and more affordable office space.
Arlington needs to rethink how it attracts new businesses and keeps our existing businesses.
Commercial vacancies threaten the 50/50 split of residential/commercial tax rate.
The shortage of a range of affordable housing of all types may detract businesses who are
looking to locate near potential employees.
Arlington does not appear to have a vision for the future.
Question 2: If challenges exist, what steps or solutions should Arlington consider to address those challenges?
Develop a vision for the County
Use a variety of tools to attract and retain businesses, and shorten lengthy processes so that we
can maintain the 50/50 split.
Look for ways to retain a diverse community
Question 3: What constraints or barriers exist to taking those steps or solutions?
Is there a vision for Arlington’s population size? Arlington is changing, and there are diverse
expectations among residents.
Arlington way may need to be revisited.
Need to improve the way we allow for development, and how we work with businesses.
Draft 2 - Page 111-MU

Appendix 7 – A Summary of Resident Forum Table Discussions
CFS Meeting, March 25, 2015
Recurring Themes from Resident Forum Table Discussion on Demographics
10 groups, 53 participants
Question 1: Based on the demographic data that we have seen so far in the process, who are we as a County?
Arlington has transitioned from a suburb to an urban community.
Many of the groups expressed surprise at the information on income disparity and how different
this looked in north or south Arlington.
The county is full of millennials, seniors and families.
Question 2: How does the predicted change in the demographics determine the needs of the different neighborhoods and Arlington as a whole?
Neighborhoods have different needs, but some of the neighborhood priorities may not align
with what is in the best interest of the County as a whole.
The aging population will create a demand on basic and emergency services.
School capacity needs to be address with so many young families in the current population.
Question 3: Who do we want to be as a County, and what steps or solutions should we take to get there?
Inclusive of a diverse population.
Should we consider how big the population can or should grow? How much development we
want and need?
Affordable housing should be pursued across a broader geographic area.
Question 4: What constraints or barriers exist to taking those steps or solutions?
Too many decisions are made in response to a few individuals who have the time to voice their
issues, entitlement.
Affordability.
Community does not understand the financial difficulties that the county is facing; it may be
difficult to change expectations about the level of services and looking for cost efficiencies.
Management by County & Schools.
Draft 2 - Page 112-MU

Appendix 7 – A Summary of Resident Forum Table Discussions
CFS Meeting, May 13, 2015
Recurring Themes from Resident Forum Table Discussion on Siting Considerations
7 groups
Question 1: Drawing from your own experiences and from what you learned from the case studies, what should be carried forward for future siting efforts for county facilities and schools? What should be done differently?
1a: The study committee charge states, “consideration should be given to finding more efficient ways to use existing facilities and sites, colocation of appropriate uses, and temporary or permanent use of private space.” How should new uses be determined for existing facilities or sites to maximize county and school resources?
1b: Some of the case studies took many years to reach community consensus. How could a new siting process address needs that are time sensitive?
Involve stakeholders early, be transparent and avoid surprises.
Process need to define the tradeoffs that drive decision making.
New processes need to be applied to new properties coming on line (i.e. Buck property).
Compile a list of community needs that can be used to make informed decisions.
Multi‐functional facilities are a necessity.
County and schools need to work together.
Maintain green space.
Need to coordinate master planning for all public facilities.
Question 2. How should the facility needs of the county as a whole be balanced with concerns about a facility’s impacts on surrounding neighborhoods?
2a: What role should your community organization(s) have in the facility siting process? When and how should the community be engaged in siting decisions?
2b: The current system of planning for facilities seems to lead to a process where most people are reacting negatively to a proposal. What could be done to change this dynamic in the community process?
2c: What communication tools should the county and aps be using to get information out to everyone?
Better educating and marketing to the public.
Stakeholder need to include broader community. Neighborhood development often impacts
other parts of the county.
Distribute the burden around the county.
Communicate more often and publically.
Encourage co‐location of facilities.
Draft 2 - Page 113-MU
Appendix 7 – A Summary of Resident Forum Table Discussions
CFS Meeting, June 24, 2015
Recurring Themes from Resident Forum Table Discussion on Siting Process
5 groups
Question 1: Could this siting framework be adapted for most or all facility siting processes?
How do we ensure consideration of co‐location/multi‐use facilities? Must be captured in Phase
0.
School facility planning must be integrated with county facility planning, and need one
comprehensive plan rather than a multitude of plans.
Reverse the process to work for sites with no defined need.
Set aside funds for land acquisition.
Who gets to set the priorities and define the needs our a diverse county?
We need to educate the community about the needs.
Question 2: What should the community’s role be during Phases 1 – 4 of the siting process framework? Consider spectrum of public participation.
Community needs a role in Phase 0, setting priorities; ensures coordination of County and APS
priorities.
Perceived effect on community should determine who participates.
Process requires a clear charge then a continuing communication plan.
Draft 2 - Page 114-MU


![[536] S. Schindler: 'The Congressional Committee’s PE Initiative ... · 06-01-2019 · The Congressional Committee’s PE Initiative Confirms the USPTO’s 2019 PE-Guideline (almost)](https://static.documents.pub/doc/80x56/5e5b1c648d407915ae4e8fa7/536-s-schindler-the-congressional-committeeas-pe-initiative-06-01-2019.jpg)


