254
Study Core Report September 18, 2006
Study Core ReportSeptember 18, 2006
|| 2
Table of Contents Executive Summary……………………………….3 Capacity Forecasts……………………………80 Conclusions……………………………………166
Study Scope…………………………………………9 Methodology/Summary………………………81 Recommendations……………………………176
Safety Net Snap Shot………………………10 Community Clinics……………………………83 Appendix……………………………………………186
Current Demand………………………………29 Hospitals…………………………………………84 Methodology……………………………………187
Community Clinics……………………………32 ED Treatment Stations………………………88 Principles for the Safety Net
Hospital Utilization…………………………34 Trauma Centers………………………………91 Coordination Structure………………………191
ED Utilization…………………………… ……38 Physician/Nurse Supply……………………92 Best Practice Communities………………194
Trauma……………………………………………40 Demand Capacity Forecast UCSDMC Additional Findings……………197
County Comparisons…………………………42 Qualifiers…………………………………………96 San Diego IT Best Practice…………………207
Current Capacity………………………………47 Forecasted Payer Sources………………100 Capacity Challenges for Major
Map of Hospitals/Clinics…………………50 Gap Analysis…………………………………...109 Disasters…………………………………………210
Community Clinics………………………………51 What If?...........................................…...110 Safety Net Nationally & Statewide………218
Hospital Beds……………………………………52 Potential Hospital Closures……………...112 Immigrant Healthcare Use………………234
ED Treatment Stations…………………………57 Bed Gaps…………………………………...115 Future Trends for Healthcare…………..237
County Comparisons…………………………59 ED Treatment Station Gaps………...116
Diversion…………………………………………61 UCSDMC Inpatient Bed Move……………117
Physician/Nurse Supply……………………63 Medicare/Medi-Cal/Spending
Demand Forecasts………………………………71 Gaps…………………………………………………128
Methodology/Summary……………………72 Input From Stakeholders &
Community Clinics……………………………74 Consumers……………………………………….134
Hospital Discharges………………………….75 Characteristics of a Strong
ED Visits…………………………………………77 Healthcare Safety Net……………………142Trauma Admissions…………………………79 SWOT Analysis…………………………………148

|| 3
Executive Summary
|| 4
Executive Summary Study Overview
The San Diego County Healthcare Safety Net Study was jointly funded by The California Endowment and the County of San Diego
The study’s focus was to examine the long-term needs of the region’s healthcare safety net
As a result of this process, an estimate of the service and funding needs and gaps of the healthcare safety net, as well as the strengths, opportunities, weaknesses, and threats of meeting those needs, was developed
The Healthcare Safety Net in San Diego CountySan Diego County has an extensive network of community clinics, 19 acute care hospitals with emergency departments (EDs), and 6 trauma centers that serve the safety net
The number of uninsured and underinsured residents in San Diego County is likely to grow with some variation by region
|| 5
Executive Summary Current Demand on the Safety Net
Demand on the safety net providers has increased over the past 10 years. The number of community clinic visits, hospital discharges and ED visits have all increased steadily
While the total number of ED visits and hospital discharges has only grown modestly, the number of ED and hospital inpatient visits per hospital has increased more rapidly. Trauma center utilization (the number of trauma patient admissions per 1,000 population) has also increased at a steady rate
Current CapacityThe use of existing hospital beds has risen, which is also evidenced by the increasing number of discharges per bed and bed occupancy rate
The number of community clinics and ED stations have increased. San Diego County has the most community clinics per 100,000 residents in the state and a moderate number of ED visits per station
The actual number of physicians in the community is consistent with need but not all these physicians are available or will treat safety net patients. Nursing gaps do exist
|| 6
Executive Summary Future Demand on the Safety Net
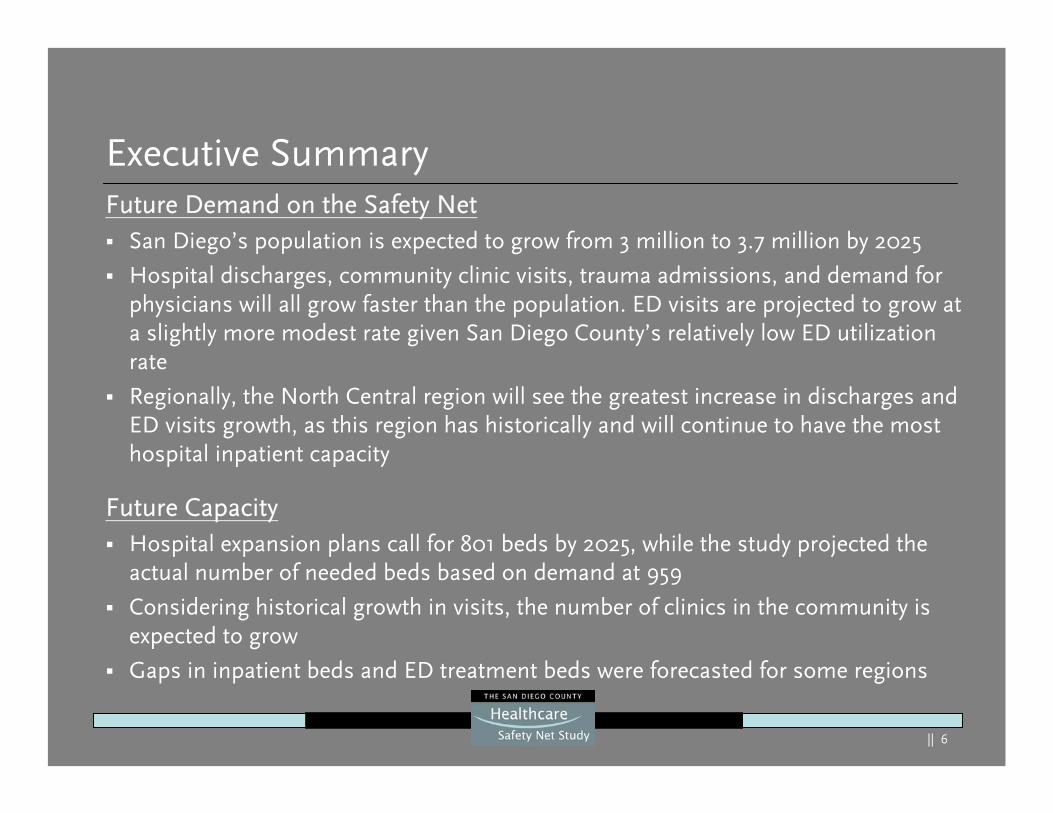
San Diego’s population is expected to grow from 3 million to 3.7 million by 2025
Hospital discharges, community clinic visits, trauma admissions, and demand for physicians will all grow faster than the population. ED visits are projected to grow at a slightly more modest rate given San Diego County’s relatively low ED utilization rate
Regionally, the North Central region will see the greatest increase in discharges and ED visits growth, as this region has historically and will continue to have the most hospital inpatient capacity
Future CapacityHospital expansion plans call for 801 beds by 2025, while the study projected the actual number of needed beds based on demand at 959
Considering historical growth in visits, the number of clinics in the community is expected to grow
Gaps in inpatient beds and ED treatment beds were forecasted for some regions
|| 7
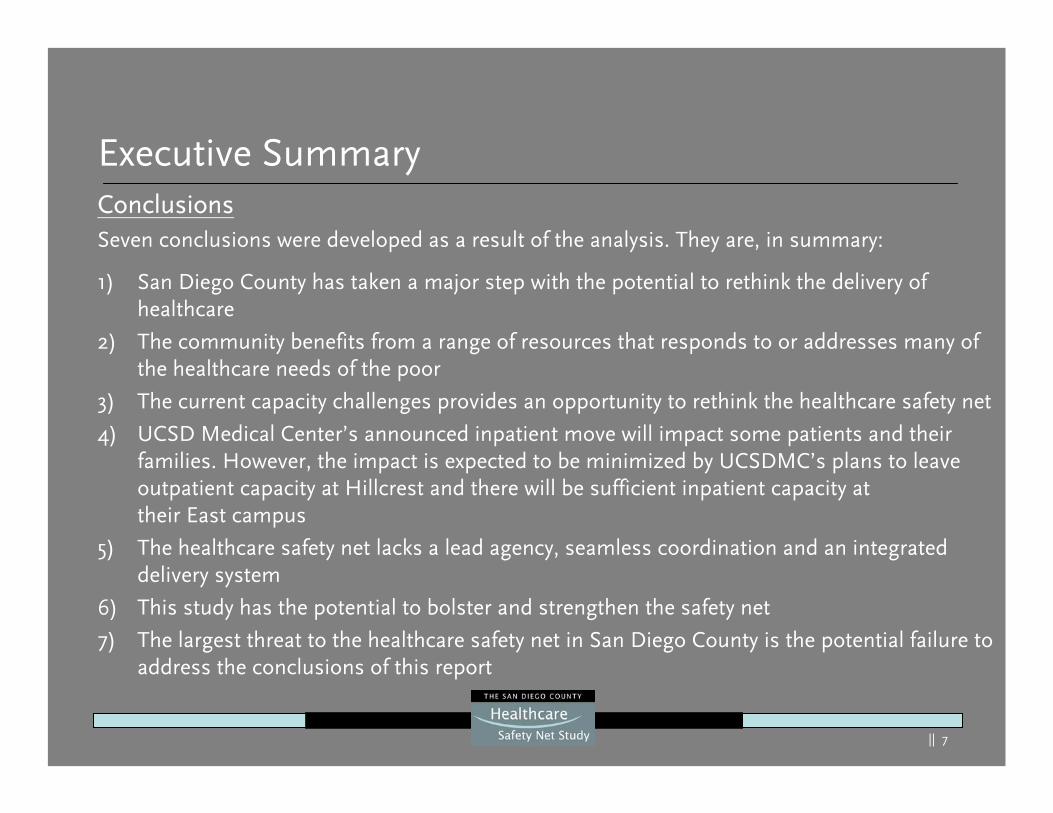
Executive Summary ConclusionsSeven conclusions were developed as a result of the analysis. They are, in summary:
1) San Diego County has taken a major step with the potential to rethink the delivery of healthcare
2) The community benefits from a range of resources that responds to or addresses many of the healthcare needs of the poor
3) The current capacity challenges provides an opportunity to rethink the healthcare safety net
4) UCSD Medical Center’s announced inpatient move will impact some patients and their families. However, the impact is expected to be minimized by UCSDMC’s plans to leave outpatient capacity at Hillcrest and there will be sufficient inpatient capacity attheir East campus
5) The healthcare safety net lacks a lead agency, seamless coordination and an integrated delivery system
6) This study has the potential to bolster and strengthen the safety net
7) The largest threat to the healthcare safety net in San Diego County is the potential failure to address the conclusions of this report
|| 8
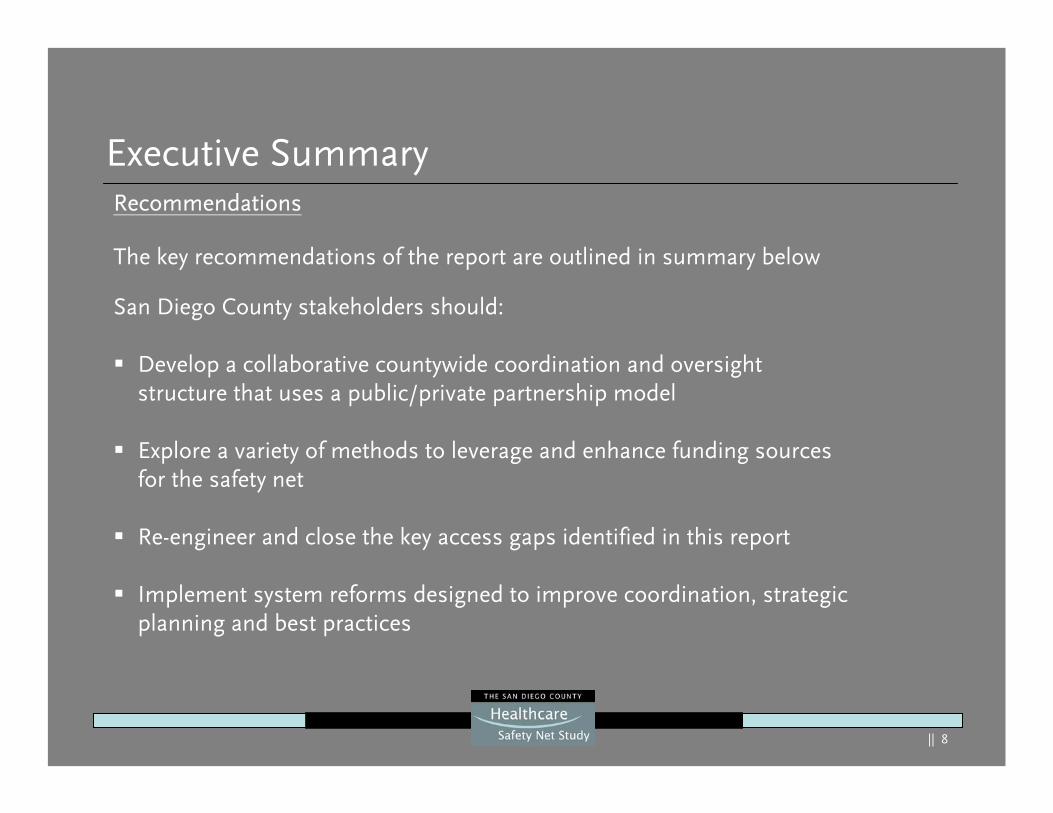
Executive Summary Recommendations
The key recommendations of the report are outlined in summary below
San Diego County stakeholders should:
Develop a collaborative countywide coordination and oversight structure that uses a public/private partnership model
Explore a variety of methods to leverage and enhance funding sources for the safety net
Re-engineer and close the key access gaps identified in this report
Implement system reforms designed to improve coordination, strategic planning and best practices
|| 9Draft. Work In Progress.
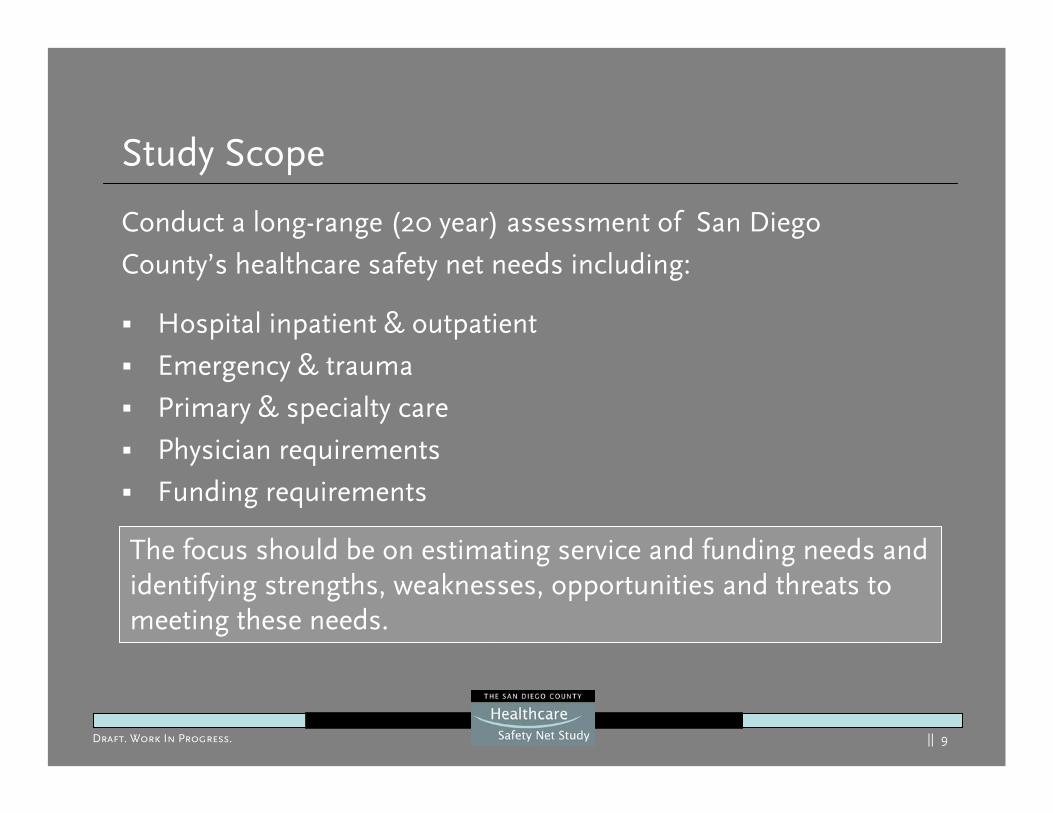
Study Scope
Conduct a long-range (20 year) assessment of San Diego
County’s healthcare safety net needs including:
Hospital inpatient & outpatient
Emergency & trauma
Primary & specialty care
Physician requirements
Funding requirements
The focus should be on estimating service and funding needs and identifying strengths, weaknesses, opportunities and threats to meeting these needs.
The focus should be on estimating service and funding needs and identifying strengths, weaknesses, opportunities and threats to meeting these needs.

|| 10
Safety Net Snapshot
|| 11
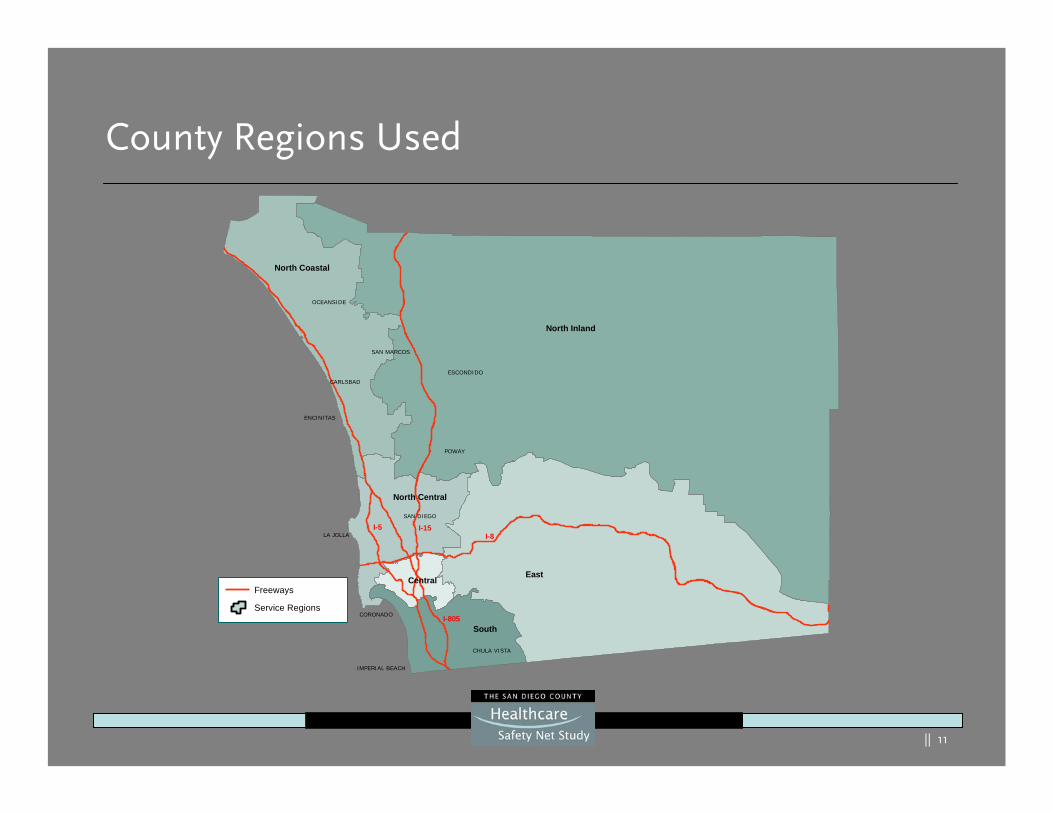
County Regions Used
North Coastal
North Inland
North Central
East
South
Central
I-15I-5I-8
I-805
SAN DIEGO
LA JOLLA
CARLSBAD
POWAY
OCEANSIDE
ENCINITAS
ESCONDIDO
CHULA VISTA
IMPERIAL BEACH
CORONADO
SAN MARCOS
®Freeways
Service Regions
|| 12
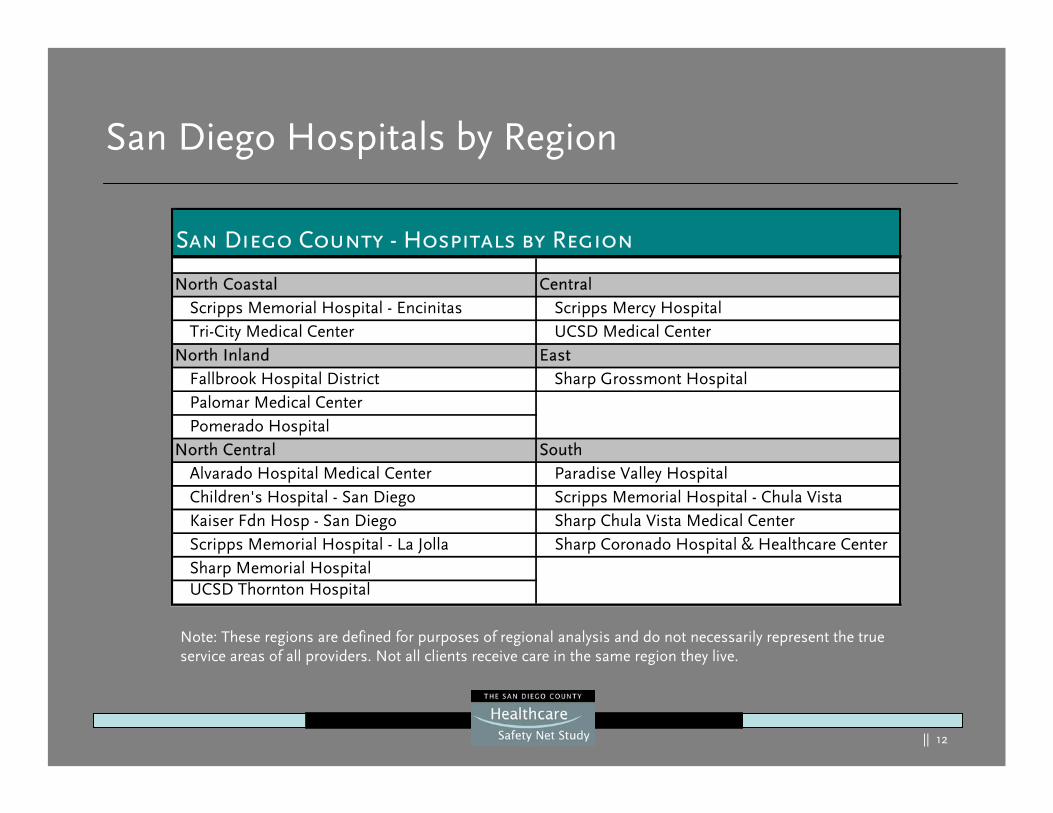
San Diego Hospitals by Region
North Coastal CentralScripps Memorial Hospital - Encinitas Scripps Mercy HospitalTri-City Medical Center UCSD Medical Center
North Inland EastFallbrook Hospital District Sharp Grossmont HospitalPalomar Medical CenterPomerado Hospital
North Central SouthAlvarado Hospital Medical Center Paradise Valley HospitalChildren's Hospital - San Diego Scripps Memorial Hospital - Chula VistaKaiser Fdn Hosp - San Diego Sharp Chula Vista Medical CenterScripps Memorial Hospital - La Jolla Sharp Coronado Hospital & Healthcare CenterSharp Memorial HospitalUCSD Thornton Hospital
San Diego County - Hospitals by Region
Note: These regions are defined for purposes of regional analysis and do not necessarily represent the true service areas of all providers. Not all clients receive care in the same region they live.
|| 13
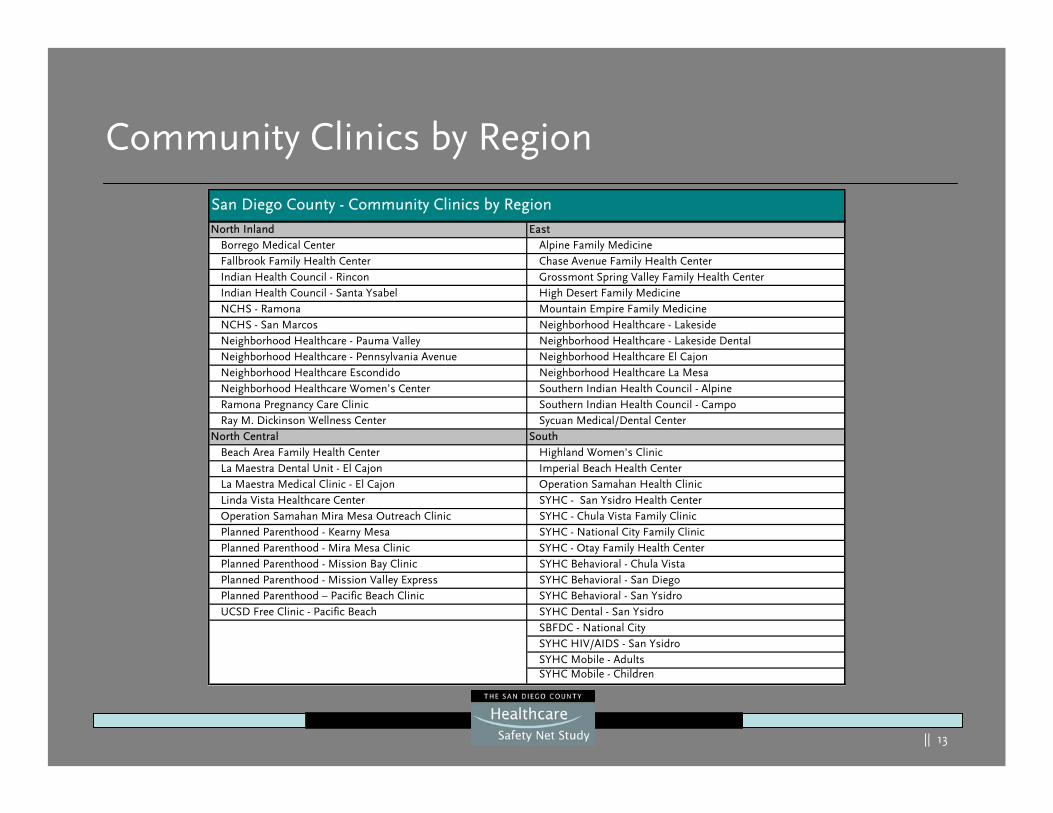
Community Clinics by Region
North Inland EastBorrego Medical Center Alpine Family MedicineFallbrook Family Health Center Chase Avenue Family Health CenterIndian Health Council - Rincon Grossmont Spring Valley Family Health CenterIndian Health Council - Santa Ysabel High Desert Family MedicineNCHS - Ramona Mountain Empire Family MedicineNCHS - San Marcos Neighborhood Healthcare - LakesideNeighborhood Healthcare - Pauma Valley Neighborhood Healthcare - Lakeside DentalNeighborhood Healthcare - Pennsylvania Avenue Neighborhood Healthcare El CajonNeighborhood Healthcare Escondido Neighborhood Healthcare La MesaNeighborhood Healthcare Women’s Center Southern Indian Health Council - AlpineRamona Pregnancy Care Clinic Southern Indian Health Council - CampoRay M. Dickinson Wellness Center Sycuan Medical/Dental Center
North Central SouthBeach Area Family Health Center Highland Women's ClinicLa Maestra Dental Unit - El Cajon Imperial Beach Health CenterLa Maestra Medical Clinic - El Cajon Operation Samahan Health ClinicLinda Vista Healthcare Center SYHC - San Ysidro Health CenterOperation Samahan Mira Mesa Outreach Clinic SYHC - Chula Vista Family ClinicPlanned Parenthood - Kearny Mesa SYHC - National City Family ClinicPlanned Parenthood - Mira Mesa Clinic SYHC - Otay Family Health CenterPlanned Parenthood - Mission Bay Clinic SYHC Behavioral - Chula VistaPlanned Parenthood - Mission Valley Express SYHC Behavioral - San DiegoPlanned Parenthood – Pacific Beach Clinic SYHC Behavioral - San YsidroUCSD Free Clinic - Pacific Beach SYHC Dental - San Ysidro
SBFDC - National CitySYHC HIV/AIDS - San YsidroSYHC Mobile - AdultsSYHC Mobile - Children
San Diego County - Community Clinics by Region
|| 14
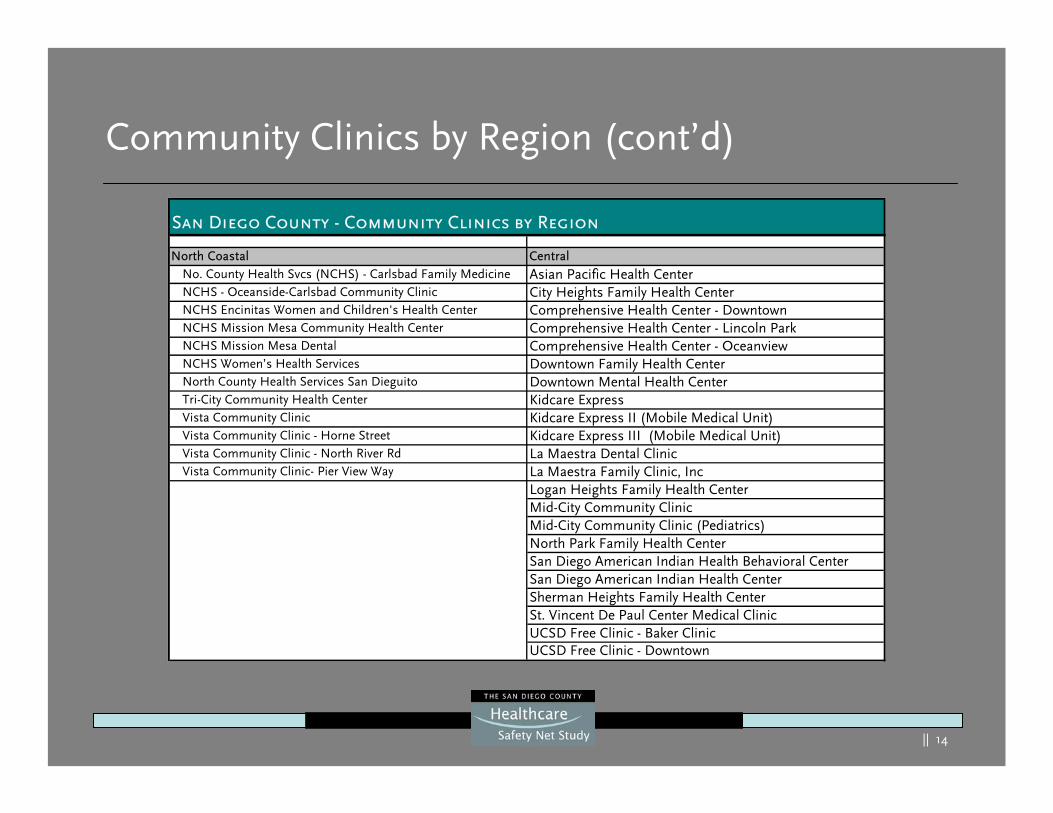
Community Clinics by Region (cont’d)
North Coastal CentralNo. County Health Svcs (NCHS) - Carlsbad Family Medicine Asian Pacific Health CenterNCHS - Oceanside-Carlsbad Community Clinic City Heights Family Health CenterNCHS Encinitas Women and Children's Health Center Comprehensive Health Center - DowntownNCHS Mission Mesa Community Health Center Comprehensive Health Center - Lincoln ParkNCHS Mission Mesa Dental Comprehensive Health Center - OceanviewNCHS Women’s Health Services Downtown Family Health CenterNorth County Health Services San Dieguito Downtown Mental Health CenterTri-City Community Health Center Kidcare ExpressVista Community Clinic Kidcare Express II (Mobile Medical Unit)Vista Community Clinic - Horne Street Kidcare Express III (Mobile Medical Unit)Vista Community Clinic - North River Rd La Maestra Dental ClinicVista Community Clinic- Pier View Way La Maestra Family Clinic, Inc
Logan Heights Family Health CenterMid-City Community ClinicMid-City Community Clinic (Pediatrics)North Park Family Health CenterSan Diego American Indian Health Behavioral CenterSan Diego American Indian Health CenterSherman Heights Family Health CenterSt. Vincent De Paul Center Medical ClinicUCSD Free Clinic - Baker ClinicUCSD Free Clinic - Downtown
San Diego County - Community Clinics by Region
|| 15
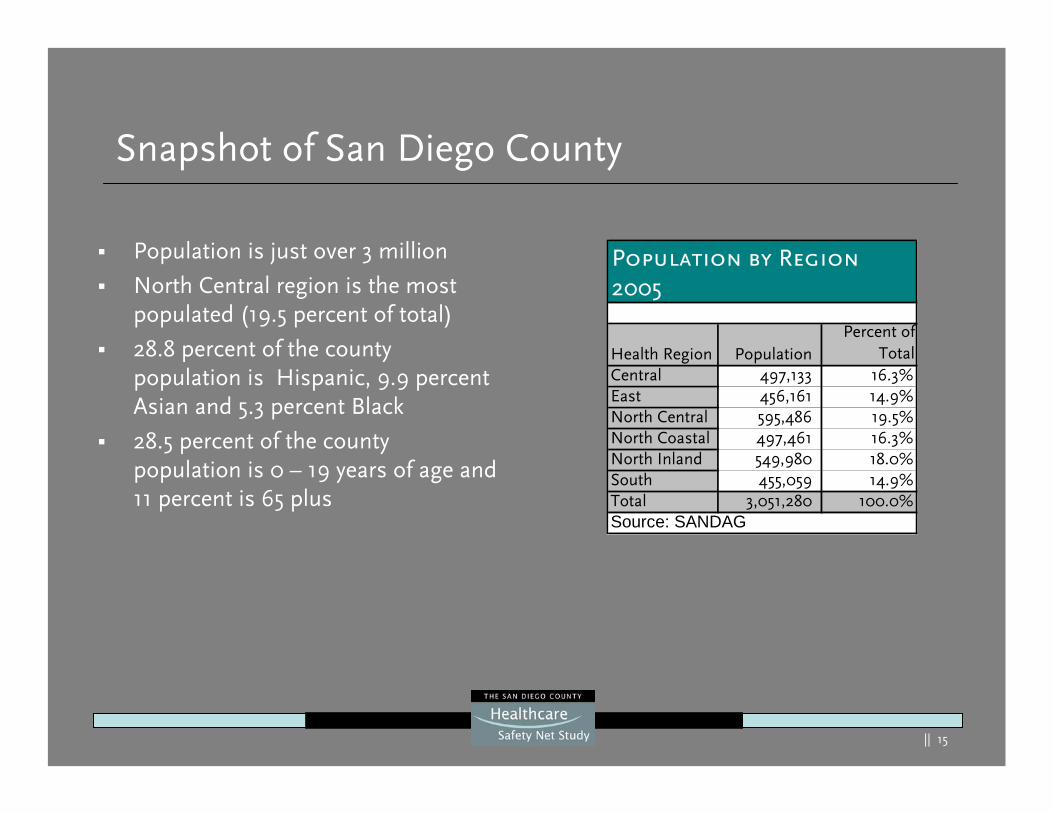
Snapshot of San Diego County
Population is just over 3 million
North Central region is the most populated (19.5 percent of total)
28.8 percent of the county population is Hispanic, 9.9 percent Asian and 5.3 percent Black
28.5 percent of the county population is 0 – 19 years of age and 11 percent is 65 plus
Health Region PopulationPercent of
TotalCentral 497,133 16.3%East 456,161 14.9%North Central 595,486 19.5%North Coastal 497,461 16.3%North Inland 549,980 18.0%South 455,059 14.9%Total 3,051,280 100.0%Source: SANDAG
Population by Region2005
|| 16
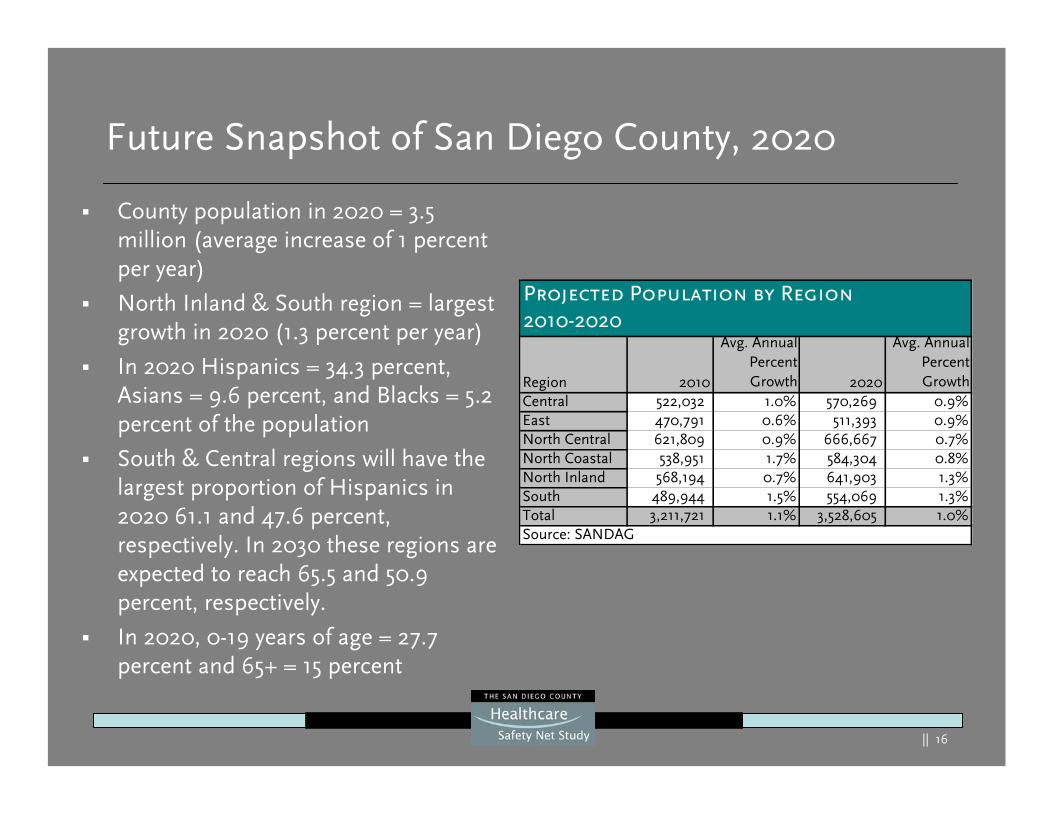
Future Snapshot of San Diego County, 2020
County population in 2020 = 3.5 million (average increase of 1 percent per year)
North Inland & South region = largest growth in 2020 (1.3 percent per year)
In 2020 Hispanics = 34.3 percent, Asians = 9.6 percent, and Blacks = 5.2 percent of the population
South & Central regions will have the largest proportion of Hispanics in 2020 61.1 and 47.6 percent, respectively. In 2030 these regions are expected to reach 65.5 and 50.9 percent, respectively.
In 2020, 0-19 years of age = 27.7 percent and 65+ = 15 percent
Region 2010
Avg. AnnualPercentGrowth 2020
Avg. AnnualPercentGrowth
Central 522,032 1.0% 570,269 0.9%East 470,791 0.6% 511,393 0.9%North Central 621,809 0.9% 666,667 0.7%North Coastal 538,951 1.7% 584,304 0.8%North Inland 568,194 0.7% 641,903 1.3%South 489,944 1.5% 554,069 1.3%Total 3,211,721 1.1% 3,528,605 1.0%Source: SANDAG
Projected Population by Region2010-2020
|| 17
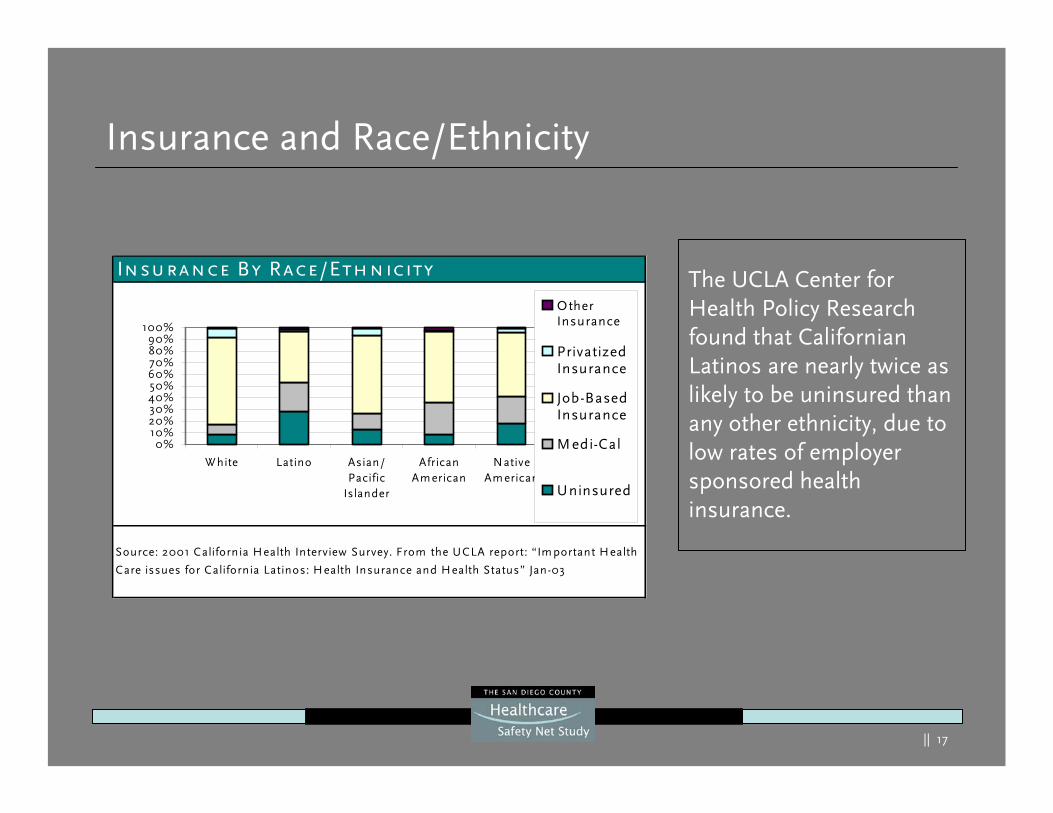
Insurance and Race/Ethnicity
The UCLA Center for Health Policy Research found that Californian Latinos are nearly twice as likely to be uninsured than any other ethnicity, due to low rates of employer sponsored health insurance.
Insurance By Race/Ethnicity
Source: 2001 California Health Interview Survey. From the UCLA report: “Im portant H ealth
Care issues for California Latinos: H ealth Insurance and Health Status” Jan-03
0%10%20%30%40%50%60%70%80%90%
100%
W hite Latino Asian/Pacific
Islander
AfricanAm erican
NativeAm erican
OtherInsurance
PrivatizedInsurance
Job-BasedInsurance
M edi-Cal
Uninsured
|| 18
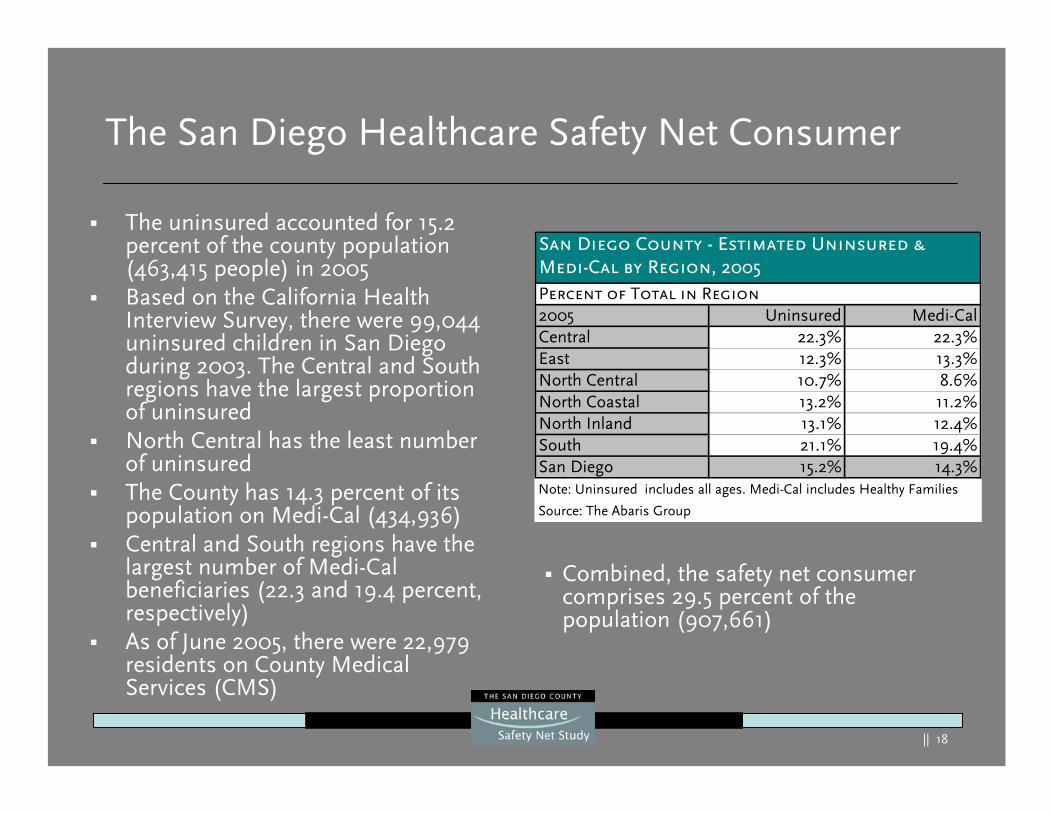
The San Diego Healthcare Safety Net Consumer
The uninsured accounted for 15.2 percent of the county population (463,415 people) in 2005Based on the California Health Interview Survey, there were 99,044 uninsured children in San Diego during 2003. The Central and South regions have the largest proportion of uninsuredNorth Central has the least number of uninsuredThe County has 14.3 percent of its population on Medi-Cal (434,936)Central and South regions have the largest number of Medi-Cal beneficiaries (22.3 and 19.4 percent, respectively)As of June 2005, there were 22,979 residents on County Medical Services (CMS)
Combined, the safety net consumer comprises 29.5 percent of the population (907,661)
Percent of Total in Region2005 Uninsured Medi-CalCentral 22.3% 22.3%East 12.3% 13.3%North Central 10.7% 8.6%North Coastal 13.2% 11.2%North Inland 13.1% 12.4%South 21.1% 19.4%San Diego 15.2% 14.3%
Source: The Abaris Group
Note: Uninsured includes all ages. Medi-Cal includes Healthy Families
San Diego County - Estimated Uninsured &Medi-Cal by Region, 2005
|| 19
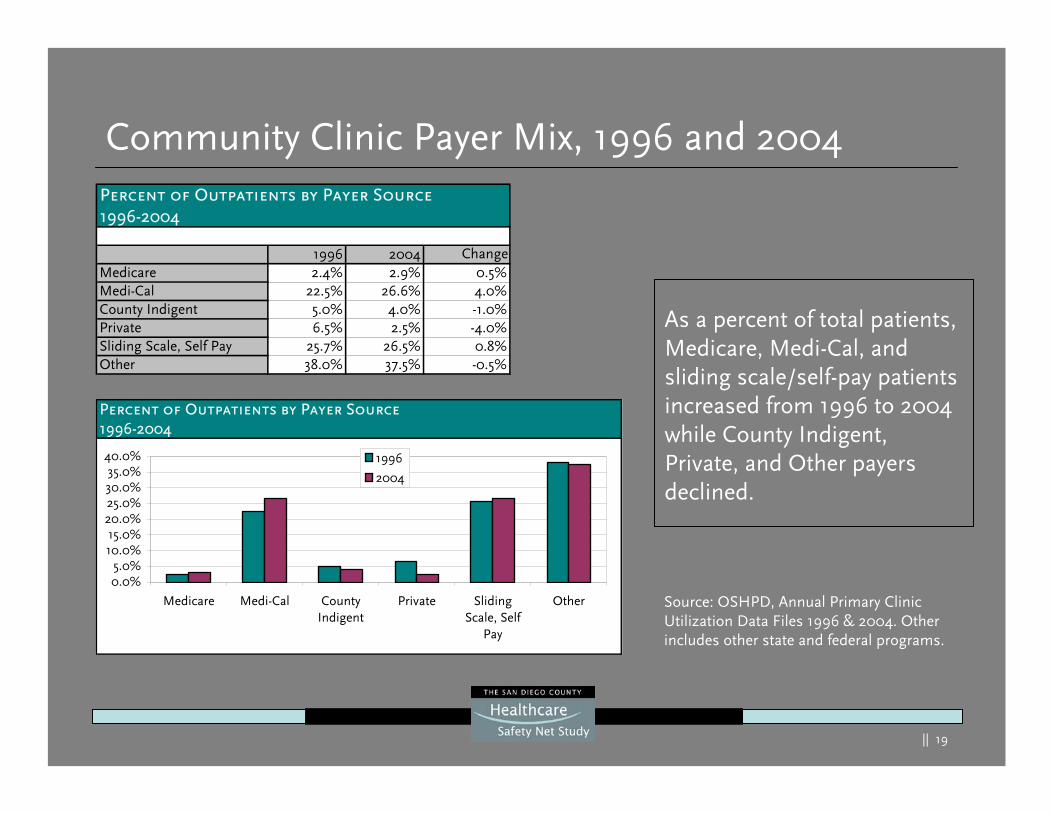
Community Clinic Payer Mix, 1996 and 2004
As a percent of total patients, Medicare, Medi-Cal, and sliding scale/self-pay patients increased from 1996 to 2004 while County Indigent, Private, and Other payers declined.
Source: OSHPD, Annual Primary Clinic Utilization Data Files 1996 & 2004. Other includes other state and federal programs.
Percent of Outpatients by Payer Source1996-2004
0.0%5.0%
10.0%15.0%
20.0%25.0%30.0%35.0%
40.0%
Medicare Medi-Cal CountyIndigent
Private SlidingScale, Self
Pay
Other
1996
2004
Percent of Outpatients by Payer Source1996-2004
1996 2004 ChangeMedicare 2.4% 2.9% 0.5%Medi-Cal 22.5% 26.6% 4.0%County Indigent 5.0% 4.0% -1.0%Private 6.5% 2.5% -4.0%Sliding Scale, Self Pay 25.7% 26.5% 0.8%Other 38.0% 37.5% -0.5%
|| 20
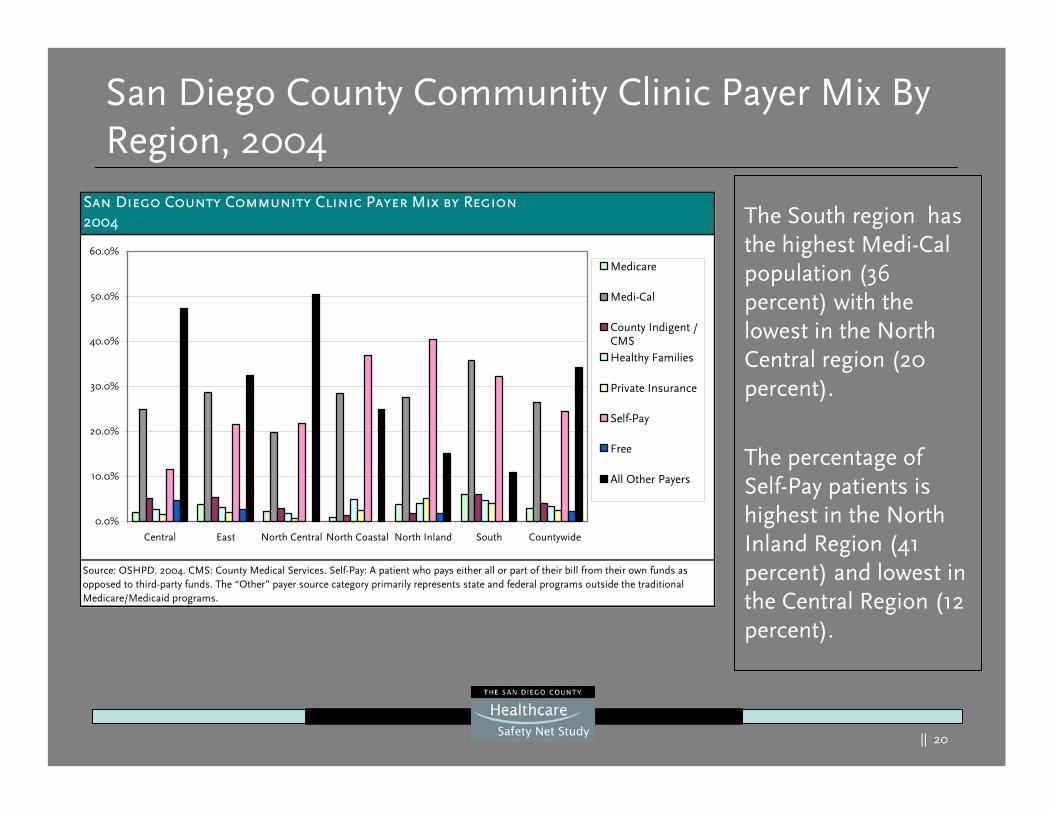
San Diego County Community Clinic Payer Mix By Region, 2004
The South region has the highest Medi-Cal population (36 percent) with the lowest in the North Central region (20 percent).
The percentage of Self-Pay patients is highest in the North Inland Region (41 percent) and lowest in the Central Region (12 percent).
San Diego County Community Clinic Payer Mix by Region2004
Source: OSHPD. 2004. CMS: County Medical Services. Self-Pay: A patient who pays either all or part of their bill from their own funds as opposed to third-party funds. The “Other” payer source category primarily represents state and federal programs outside the traditional Medicare/Medicaid programs.
0.0%
10.0%
20.0%
30.0%
40.0%
50.0%
60.0%
Central East North Central North Coastal North Inland South Countywide
Medicare
Medi-Cal
County Indigent /CMS Healthy Families
Private Insurance
Self-Pay
Free
All Other Payers
|| 21
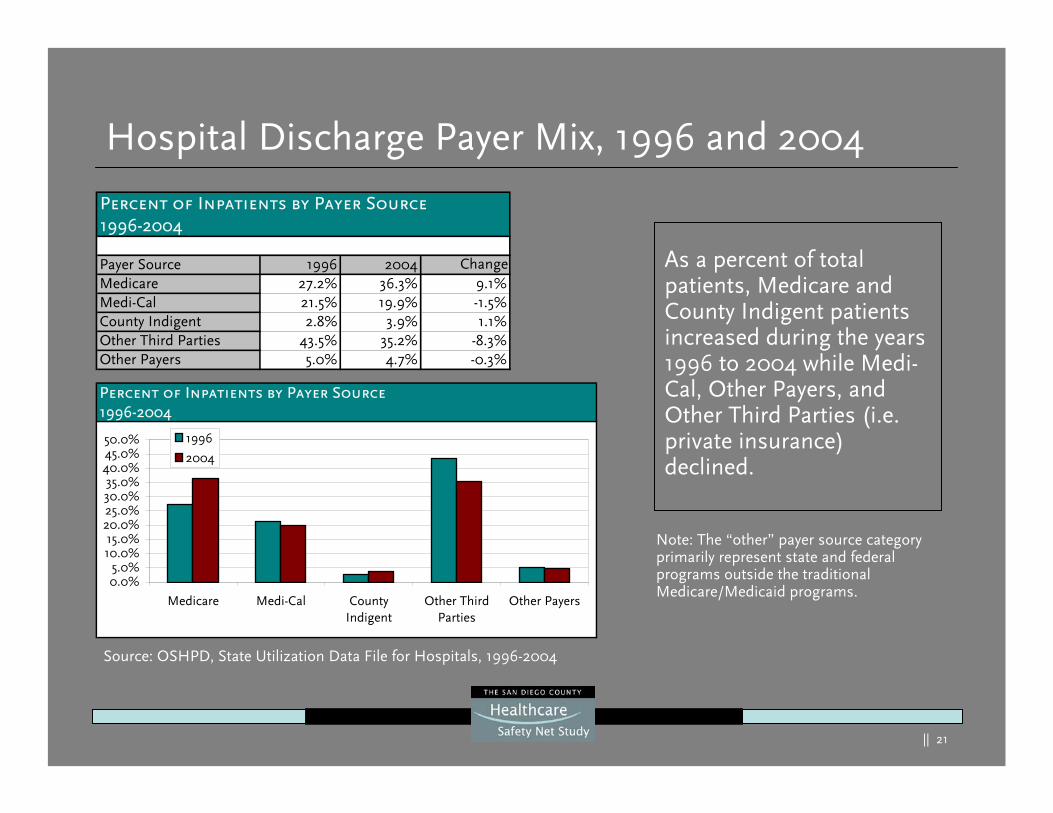
Hospital Discharge Payer Mix, 1996 and 2004
As a percent of total patients, Medicare and County Indigent patients increased during the years 1996 to 2004 while Medi-Cal, Other Payers, and Other Third Parties (i.e. private insurance) declined.
Percent of Inpatients by Payer Source1996-2004
Payer Source 1996 2004 ChangeMedicare 27.2% 36.3% 9.1%Medi-Cal 21.5% 19.9% -1.5%County Indigent 2.8% 3.9% 1.1%Other Third Parties 43.5% 35.2% -8.3%Other Payers 5.0% 4.7% -0.3%
Percent of Inpatients by Payer Source1996-2004
0.0%5.0%
10.0%15.0%
20.0%25.0%30.0%35.0%
40.0%45.0%50.0%
Medicare Medi-Cal CountyIndigent
Other ThirdParties
Other Payers
1996
2004
Source: OSHPD, State Utilization Data File for Hospitals, 1996-2004
Note: The “other” payer source category primarily represent state and federal programs outside the traditional Medicare/Medicaid programs.
|| 22
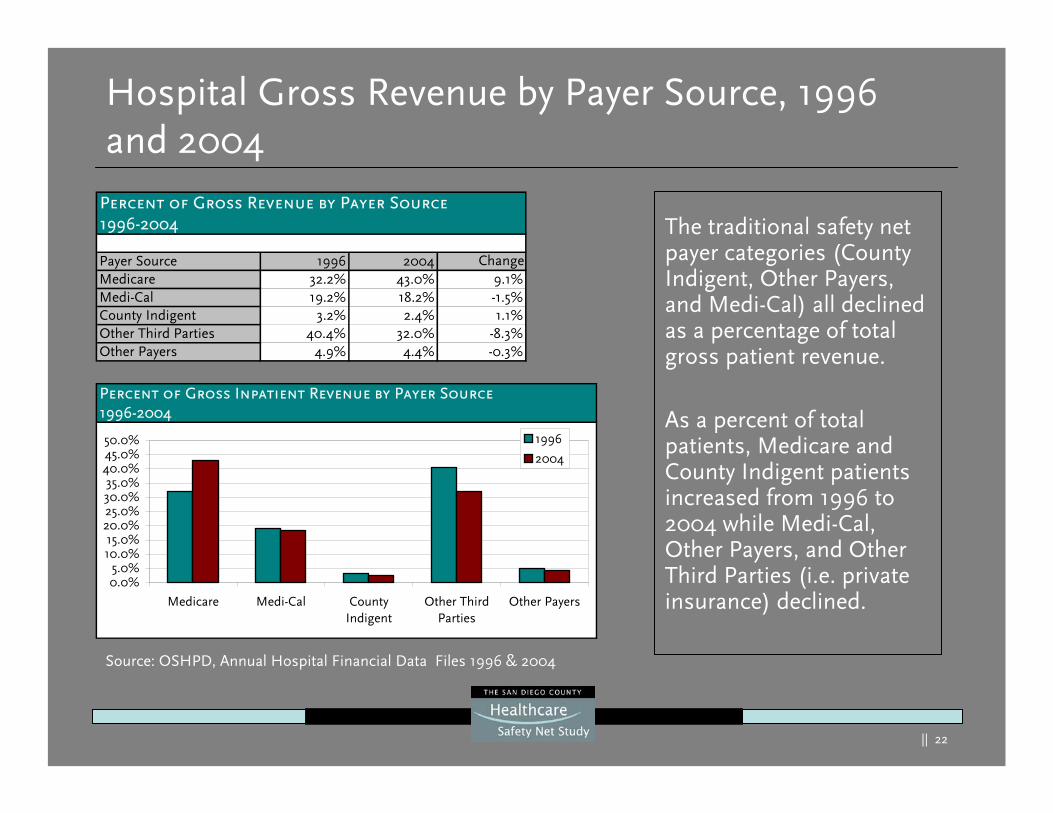
Hospital Gross Revenue by Payer Source, 1996 and 2004
The traditional safety net payer categories (County Indigent, Other Payers, and Medi-Cal) all declined as a percentage of total gross patient revenue.
As a percent of total patients, Medicare and County Indigent patients increased from 1996 to 2004 while Medi-Cal, Other Payers, and Other Third Parties (i.e. private insurance) declined.
Source: OSHPD, Annual Hospital Financial Data Files 1996 & 2004
Percent of Gross Revenue by Payer Source1996-2004
Payer Source 1996 2004 ChangeMedicare 32.2% 43.0% 9.1%Medi-Cal 19.2% 18.2% -1.5%County Indigent 3.2% 2.4% 1.1%Other Third Parties 40.4% 32.0% -8.3%Other Payers 4.9% 4.4% -0.3%
Percent of Gross Inpatient Revenue by Payer Source1996-2004
0.0%5.0%
10.0%15.0%
20.0%25.0%30.0%35.0%
40.0%45.0%50.0%
Medicare Medi-Cal CountyIndigent
Other ThirdParties
Other Payers
1996
2004
|| 23
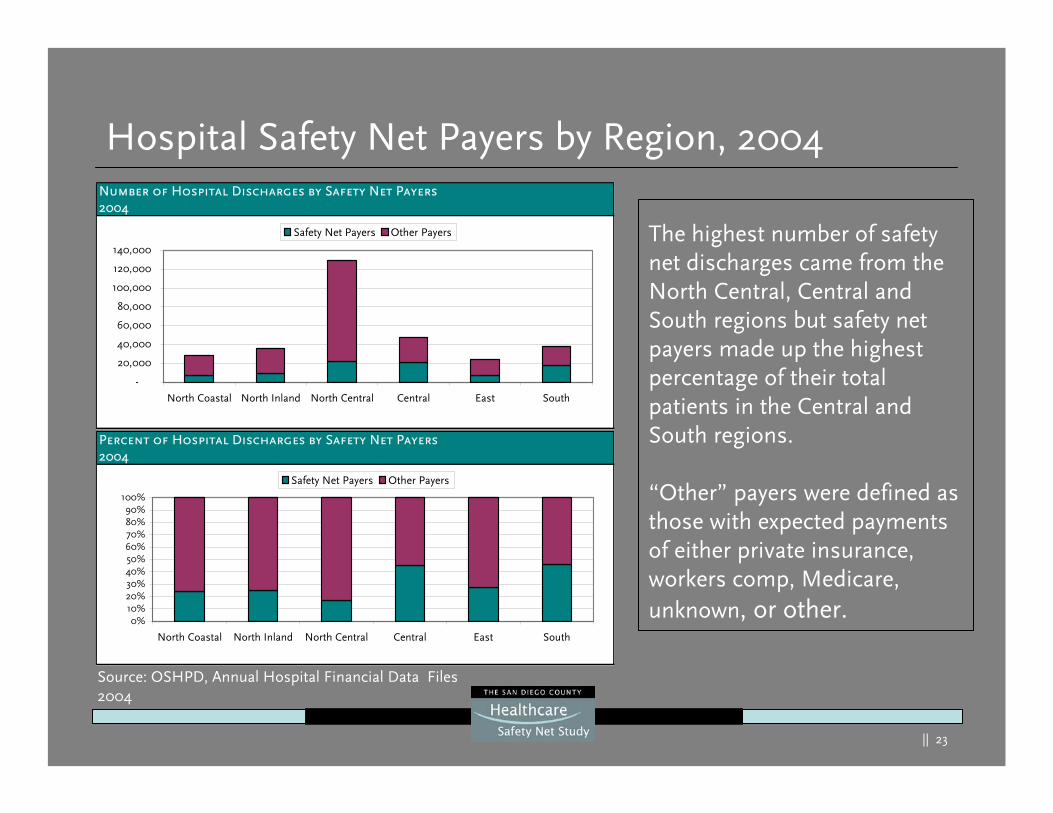
Hospital Safety Net Payers by Region, 2004
The highest number of safety net discharges came from the North Central, Central and South regions but safety net payers made up the highest percentage of their total patients in the Central and South regions.
“Other” payers were defined as those with expected payments of either private insurance, workers comp, Medicare, unknown, or other.
Percent of Hospital Discharges by Safety Net Payers2004
0%10%20%30%40%50%60%70%80%90%
100%
North Coastal North Inland North Central Central East South
Safety Net Payers Other Payers
Number of Hospital Discharges by Safety Net Payers2004
-
20,000
40,000
60,000
80,000
100,000
120,000
140,000
North Coastal North Inland North Central Central East South
Safety Net Payers Other Payers
Source: OSHPD, Annual Hospital Financial Data Files 2004
|| 24
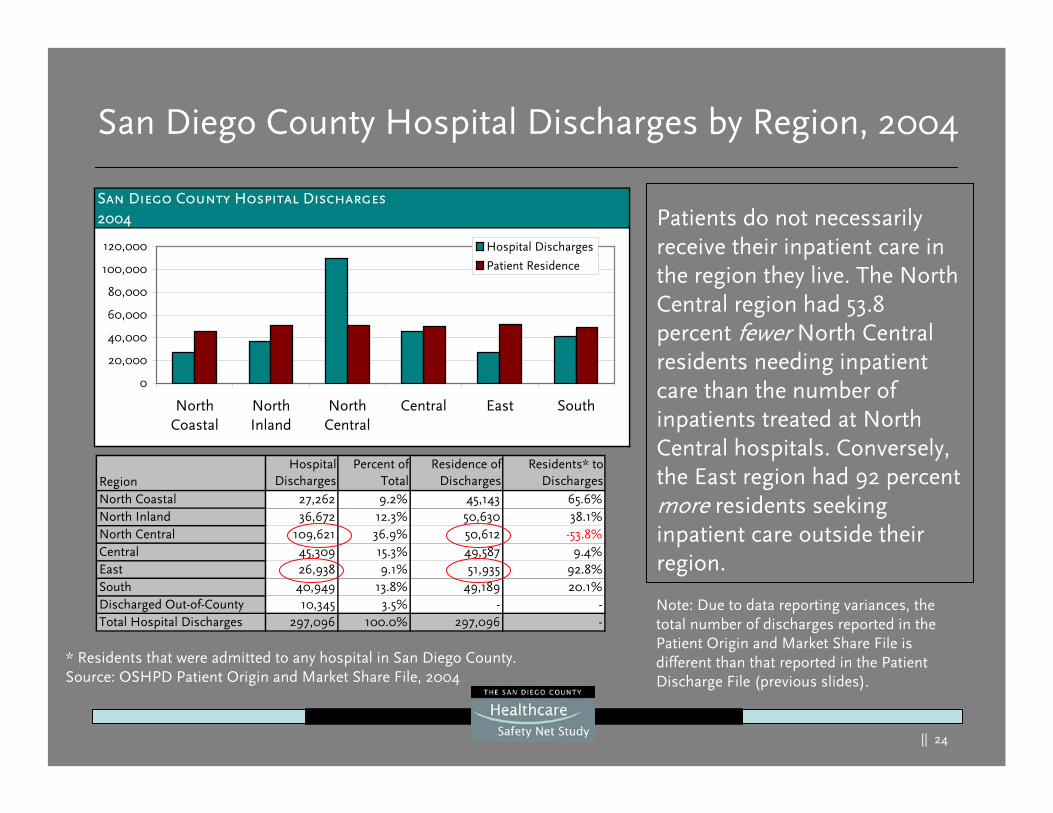
San Diego County Hospital Discharges by Region, 2004
Patients do not necessarily receive their inpatient care in the region they live. The North Central region had 53.8 percent fewer North Central residents needing inpatient care than the number of inpatients treated at North Central hospitals. Conversely, the East region had 92 percent more residents seeking inpatient care outside their region.
Note: Due to data reporting variances, the total number of discharges reported in the Patient Origin and Market Share File is different than that reported in the Patient Discharge File (previous slides).
San Diego County Hospital Discharges2004
0
20,000
40,000
60,000
80,000
100,000
120,000
NorthCoastal
NorthInland
NorthCentral
Central East South
Hospital Discharges
Patient Residence
* Residents that were admitted to any hospital in San Diego County.Source: OSHPD Patient Origin and Market Share File, 2004
RegionHospital
DischargesPercent of
TotalResidence of
DischargesResidents* to
DischargesNorth Coastal 27,262 9.2% 45,143 65.6%North Inland 36,672 12.3% 50,630 38.1%North Central 109,621 36.9% 50,612 -53.8%Central 45,309 15.3% 49,587 9.4%East 26,938 9.1% 51,935 92.8%South 40,949 13.8% 49,189 20.1%Discharged Out-of-County 10,345 3.5% - -Total Hospital Discharges 297,096 100.0% 297,096 -
|| 25
RegionHospital
DischargesPercent of
TotalPatient
ResidencePercent of
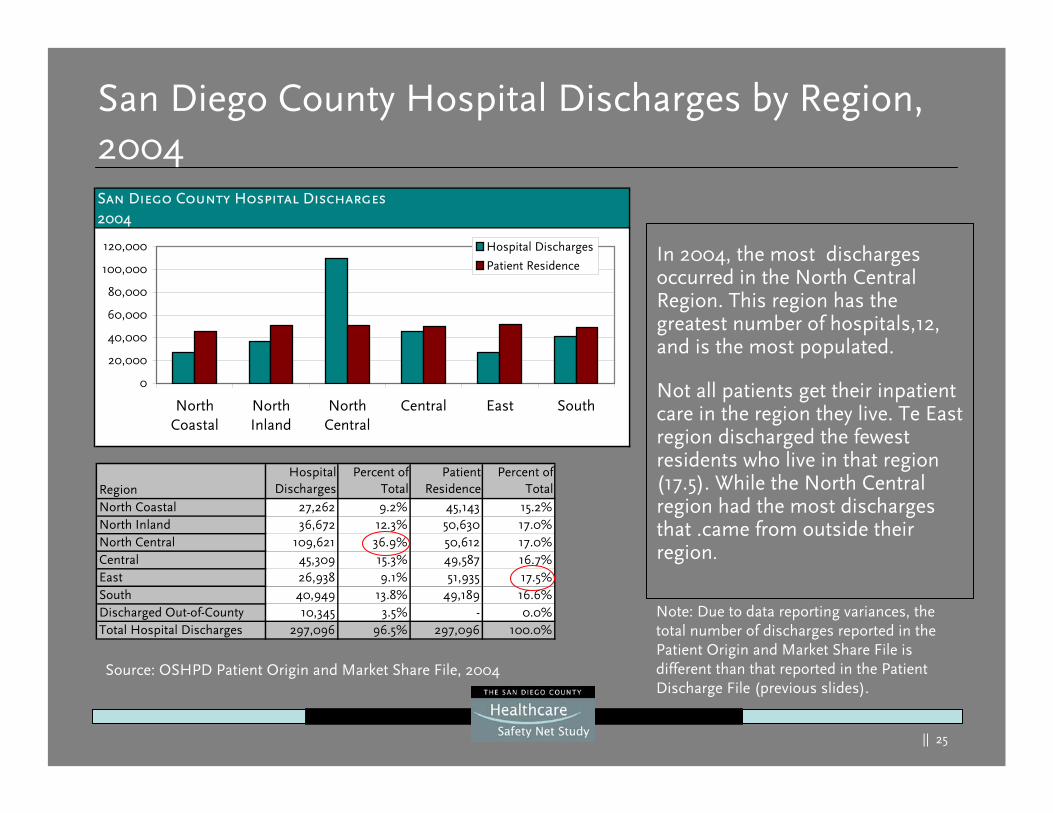
TotalNorth Coastal 27,262 9.2% 45,143 15.2%North Inland 36,672 12.3% 50,630 17.0%North Central 109,621 36.9% 50,612 17.0%Central 45,309 15.3% 49,587 16.7%East 26,938 9.1% 51,935 17.5%South 40,949 13.8% 49,189 16.6%Discharged Out-of-County 10,345 3.5% - 0.0%Total Hospital Discharges 297,096 96.5% 297,096 100.0%
San Diego County Hospital Discharges by Region, 2004
In 2004, the most discharges occurred in the North Central Region. This region has the greatest number of hospitals,12, and is the most populated.
Not all patients get their inpatient care in the region they live. Te East region discharged the fewest residents who live in that region (17.5). While the North Central region had the most discharges that .came from outside their region.
Note: Due to data reporting variances, the total number of discharges reported in the Patient Origin and Market Share File is different than that reported in the Patient Discharge File (previous slides).
San Diego County Hospital Discharges2004
0
20,000
40,000
60,000
80,000
100,000
120,000
NorthCoastal
NorthInland
NorthCentral
Central East South
Hospital Discharges
Patient Residence
Source: OSHPD Patient Origin and Market Share File, 2004
|| 26
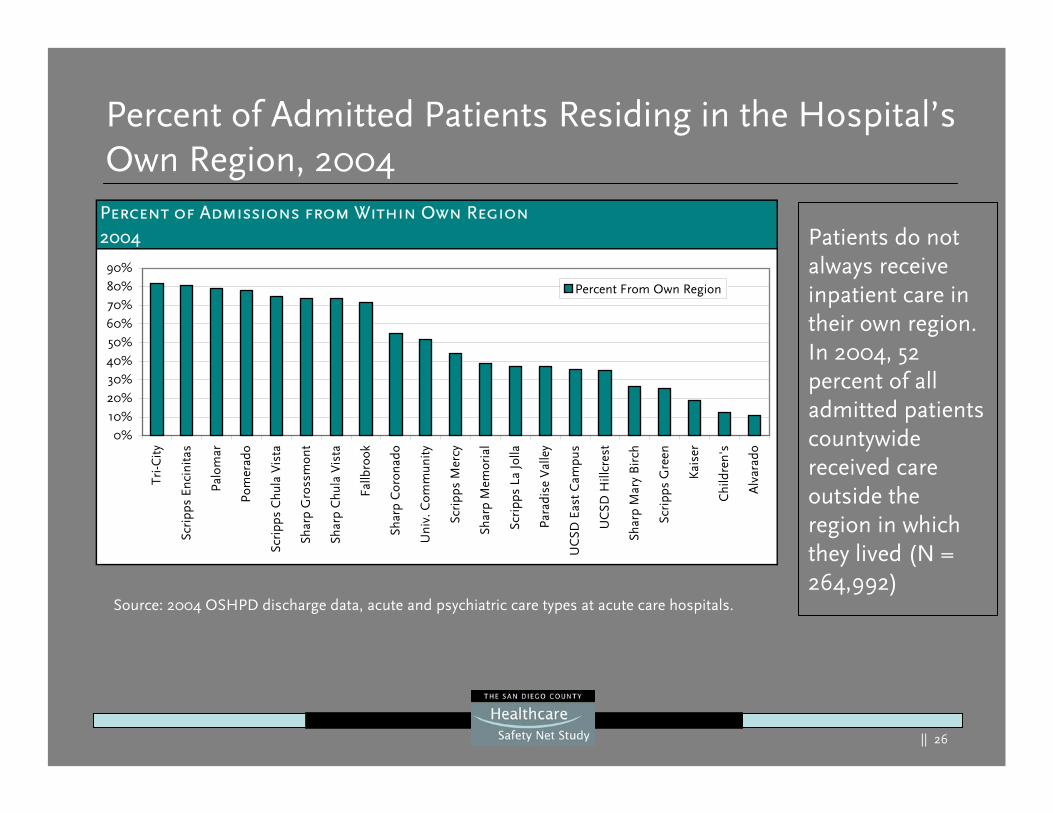
Percent of Admitted Patients Residing in the Hospital’s Own Region, 2004
Percent of Admissions from Within Own Region2004
0%10%20%30%40%50%60%70%80%90%
Tri-C
ity
Scri
pps
Enci
nita
s
Palo
mar
Pom
erad
o
Scri
pps
Chu
la V
ista
Shar
p G
ross
mon
t
Shar
p C
hula
Vis
ta
Fallb
rook
Shar
p C
oron
ado
Uni
v. C
omm
unity
Scri
pps
Mer
cy
Shar
p M
emor
ial
Scri
pps
La Jo
lla
Para
dise
Val
ley
UC
SD E
ast
Cam
pus
UC
SD H
illcr
est
Shar
p M
ary
Bir
ch
Scri
pps
Gre
en
Kai
ser
Chi
ldre
n's
Alv
arad
o
Percent From Own Region
Patients do not always receive inpatient care in their own region. In 2004, 52 percent of all admitted patients countywide received care outside the region in which they lived (N = 264,992)
Source: 2004 OSHPD discharge data, acute and psychiatric care types at acute care hospitals.
|| 27
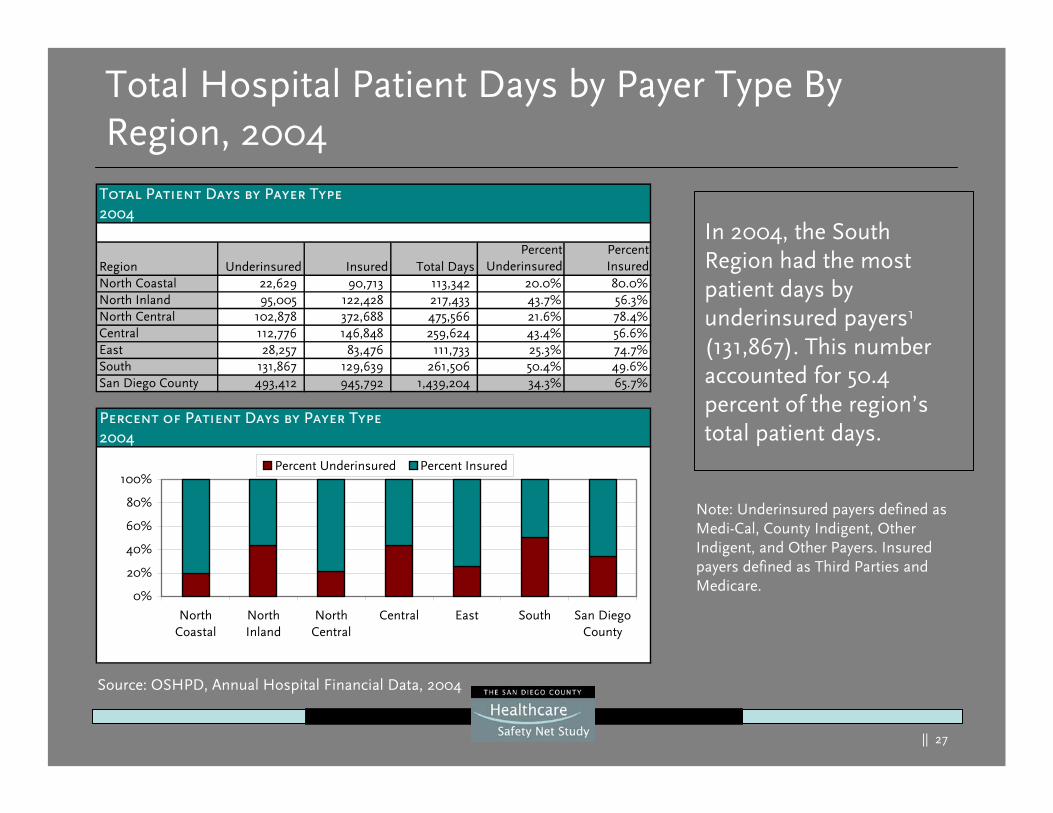
Total Hospital Patient Days by Payer Type By Region, 2004
In 2004, the South Region had the most patient days by underinsured payers1
(131,867). This number accounted for 50.4 percent of the region’s total patient days.
Total Patient Days by Payer Type2004
Region Underinsured Insured Total DaysPercent
UnderinsuredPercentInsured
North Coastal 22,629 90,713 113,342 20.0% 80.0%North Inland 95,005 122,428 217,433 43.7% 56.3%North Central 102,878 372,688 475,566 21.6% 78.4%Central 112,776 146,848 259,624 43.4% 56.6%East 28,257 83,476 111,733 25.3% 74.7%South 131,867 129,639 261,506 50.4% 49.6%San Diego County 493,412 945,792 1,439,204 34.3% 65.7%
Percent of Patient Days by Payer Type2004
0%
20%
40%
60%
80%
100%
NorthCoastal
NorthInland
NorthCentral
Central East South San DiegoCounty
Percent Underinsured Percent Insured
Source: OSHPD, Annual Hospital Financial Data, 2004
Note: Underinsured payers defined as Medi-Cal, County Indigent, Other Indigent, and Other Payers. Insured payers defined as Third Parties and Medicare.
|| 28
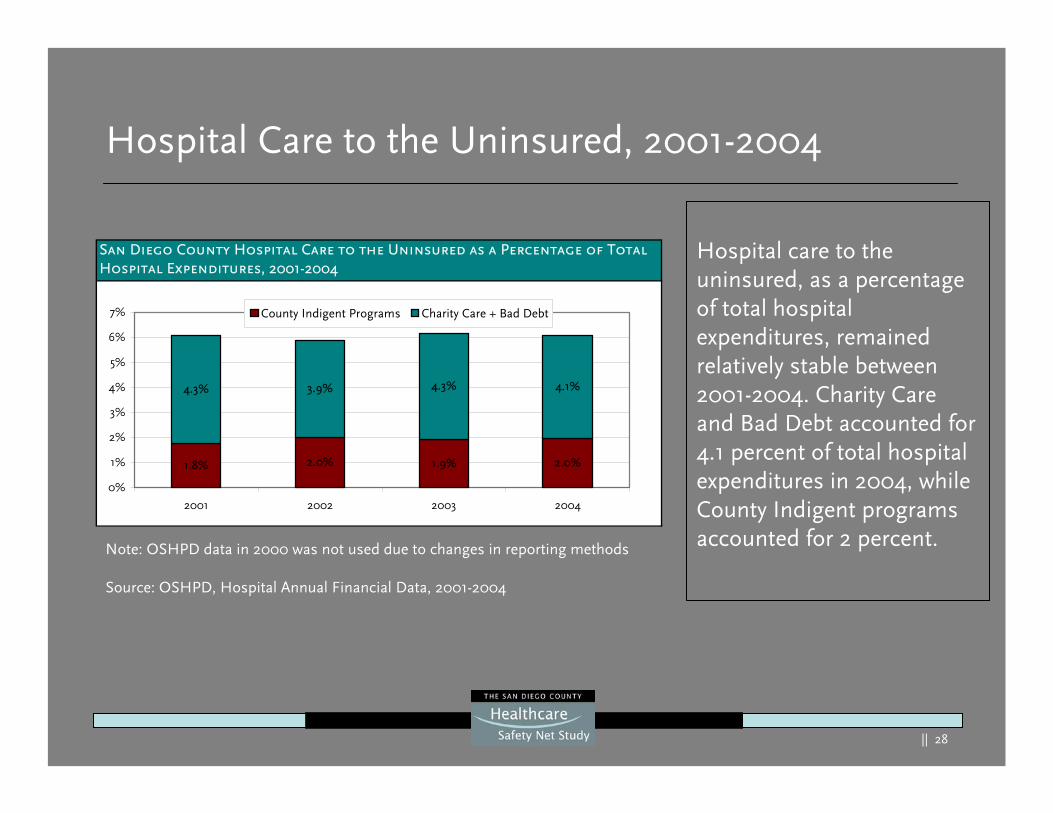
Hospital Care to the Uninsured, 2001-2004
Hospital care to the uninsured, as a percentage of total hospital expenditures, remained relatively stable between 2001-2004. Charity Care and Bad Debt accounted for 4.1 percent of total hospital expenditures in 2004, while County Indigent programs accounted for 2 percent.
San Diego County Hospital Care to the Uninsured as a Percentage of Total Hospital Expenditures, 2001-2004
1.8% 2.0% 1.9% 2.0%
4.3% 3.9% 4.3% 4.1%
0%
1%
2%
3%
4%
5%
6%
7%
2001 2002 2003 2004
County Indigent Programs Charity Care + Bad Debt
Note: OSHPD data in 2000 was not used due to changes in reporting methods
Source: OSHPD, Hospital Annual Financial Data, 2001-2004

|| 29
Current Demand
|| 30
Current Demand Summary
In San Diego County:Demand for healthcare and for the safety net consumer has continued to rise over the last several years:
– For the safety net:• Community clinics visits have increased steadily since 1996
averaging 3.3 percent growth per year• ED patient visits have continued to rise approximately 1.2 percent
per year
– For the safety net and hospitalized patients in general:• Total hospital discharges have grown modestly from 1995 to 2004
averaging 1.5 percent per year with some annual variations. However, total discharges by hospital have grown more dramatically, averaging 6.8 percent per year from 1995 to 2004
• Trauma patient admissions have risen on average 3.3 percent eachyear from 1996 to 2004
|| 31
Current Demand Summary
San Diego County has:
The second highest community clinic utilization rate (160 patients per 1,000 population) in California
A higher utilization rate for hospital discharges when compared to similar sized counties (94.7 discharges/1,000 population)
A low ED utilization rate (225 visits/1,000 population) when compared to California (275 visits/1,000 population) and the US (370 visit/1,000)
An increasing trauma utilization rate (2.9 to 3.3 from FY 1993 to 2005)
Note: Comparison counties were selected based on their relative comparative population size (Orange, population of 3,036,002; San Bernardino, population of 1,926,555; and Riverside, population of 1,849,844).
|| 32
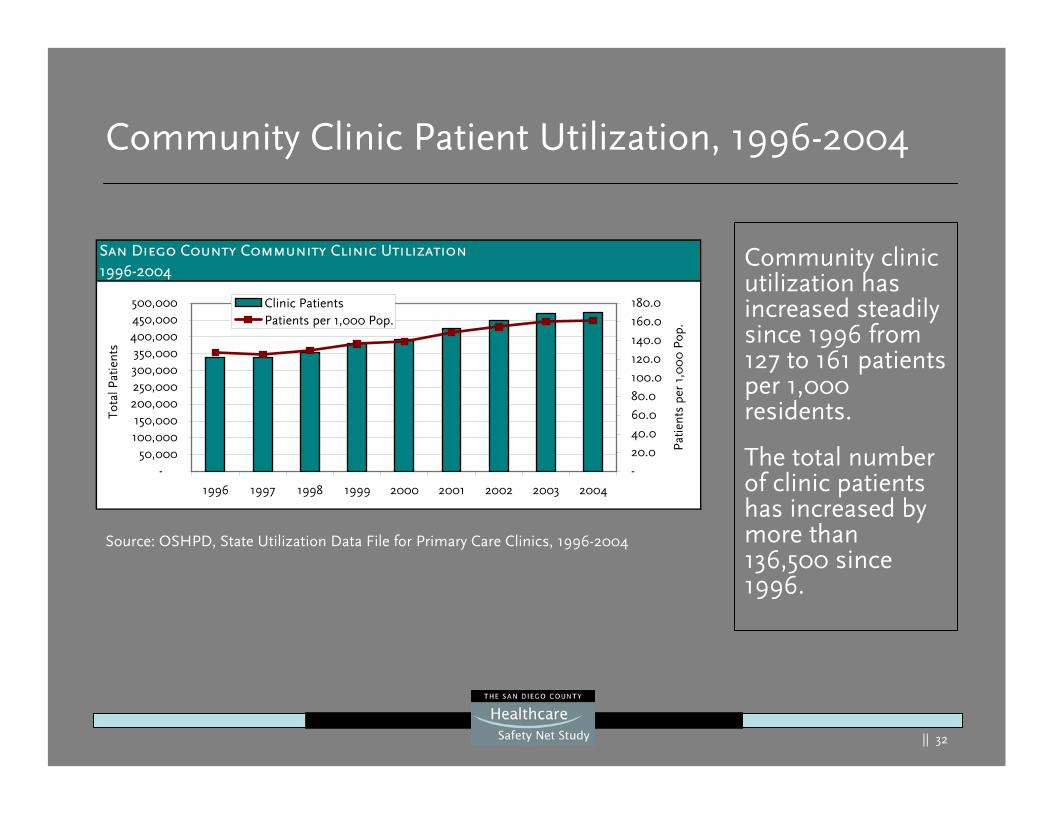
Community Clinic Patient Utilization, 1996-2004
Community clinic utilization has increased steadily since 1996 from 127 to 161 patients per 1,000 residents.
The total number of clinic patients has increased by more than 136,500 since 1996.
Source: OSHPD, State Utilization Data File for Primary Care Clinics, 1996-2004
San Diego County Community Clinic Utilization1996-2004
-50,000
100,000150,000
200,000250,000300,000350,000
400,000450,000500,000
1996 1997 1998 1999 2000 2001 2002 2003 2004
Tota
l Pat
ient
s
-
20.0
40.0
60.0
80.0
100.0
120.0
140.0
160.0
180.0
Pat
ient
s pe
r 1,
00
0 P
op.
Clinic PatientsPatients per 1,000 Pop.
|| 33
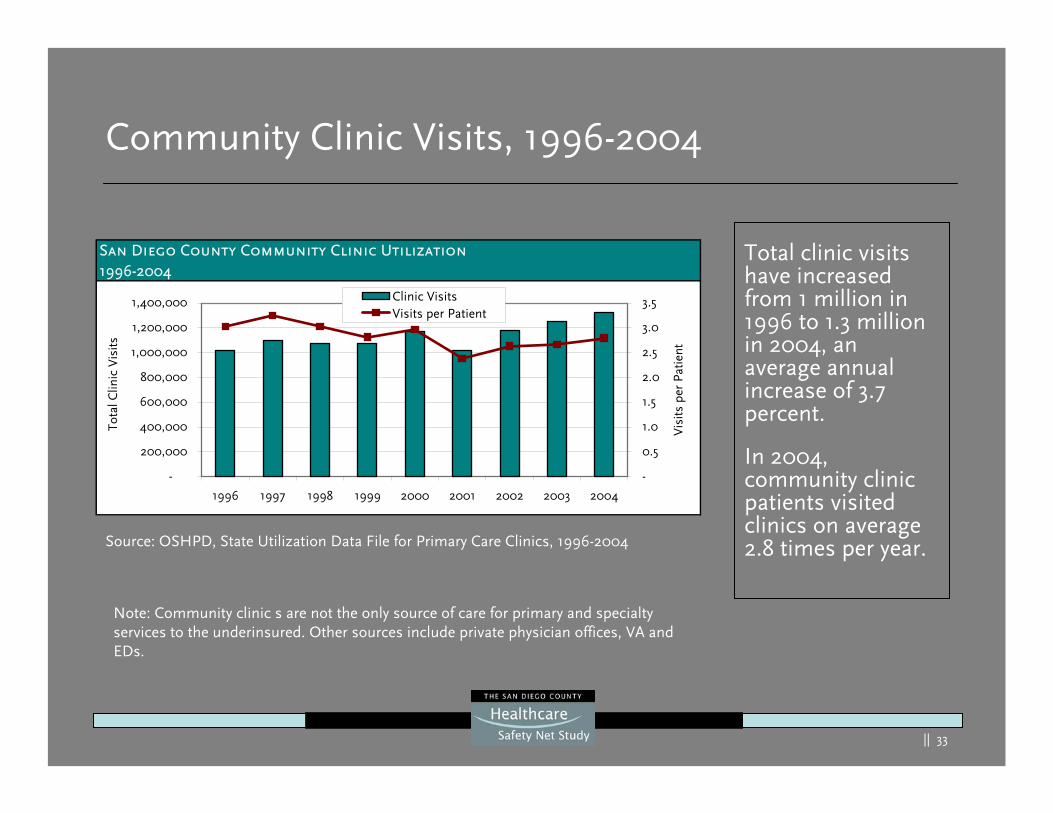
Community Clinic Visits, 1996-2004
Total clinic visits have increased from 1 million in 1996 to 1.3 million in 2004, an average annual increase of 3.7 percent.
In 2004, community clinic patients visited clinics on average 2.8 times per year.
San Diego County Community Clinic Utilization1996-2004
-
200,000
400,000
600,000
800,000
1,000,000
1,200,000
1,400,000
1996 1997 1998 1999 2000 2001 2002 2003 2004
Tota
l Clin
ic V
isits
-
0.5
1.0
1.5
2.0
2.5
3.0
3.5
Vis
its p
er P
atie
nt
Clinic VisitsVisits per Patient
Source: OSHPD, State Utilization Data File for Primary Care Clinics, 1996-2004
Note: Community clinic s are not the only source of care for primary and specialty services to the underinsured. Other sources include private physician offices, VA and EDs.
|| 34
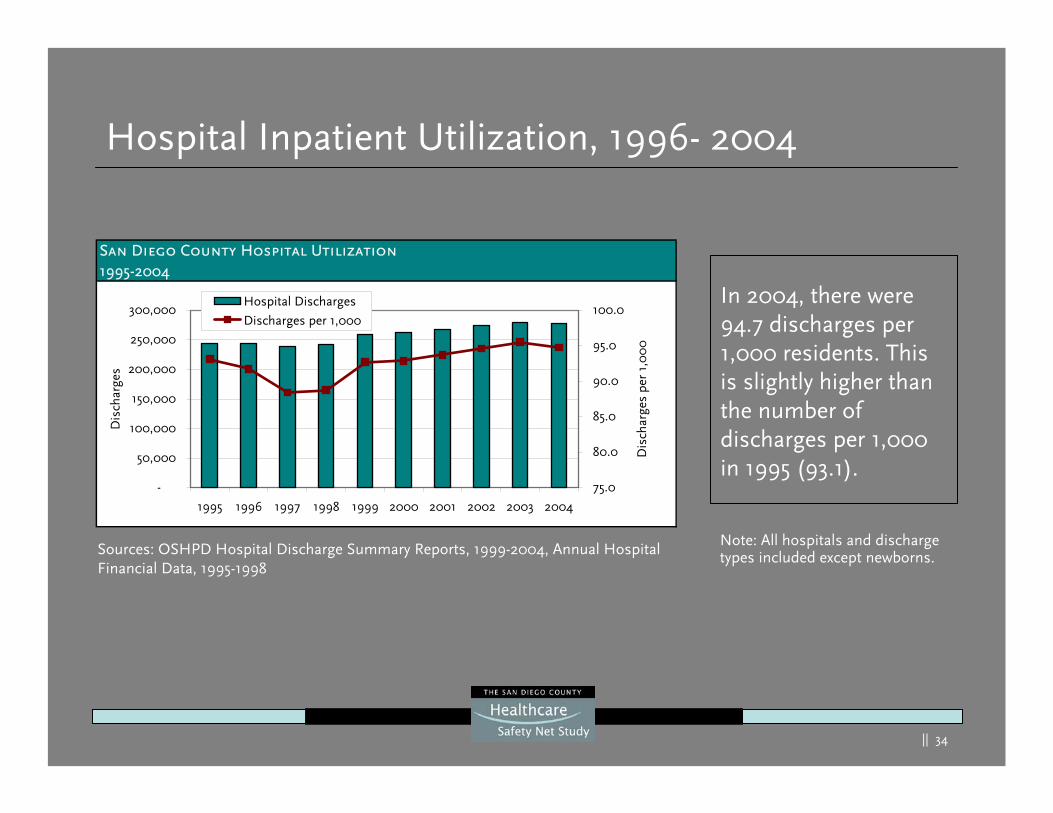
Hospital Inpatient Utilization, 1996- 2004
In 2004, there were 94.7 discharges per 1,000 residents. This is slightly higher than the number of discharges per 1,000 in 1995 (93.1).
San Diego County Hospital Utilization1995-2004
-
50,000
100,000
150,000
200,000
250,000
300,000
1995 1996 1997 1998 1999 2000 2001 2002 2003 2004
Dis
char
ges
75.0
80.0
85.0
90.0
95.0
100.0
Dis
char
ges
per
1,0
00
Hospital Discharges
Discharges per 1,000
Sources: OSHPD Hospital Discharge Summary Reports, 1999-2004, Annual Hospital Financial Data, 1995-1998
Note: All hospitals and discharge types included except newborns.
|| 35
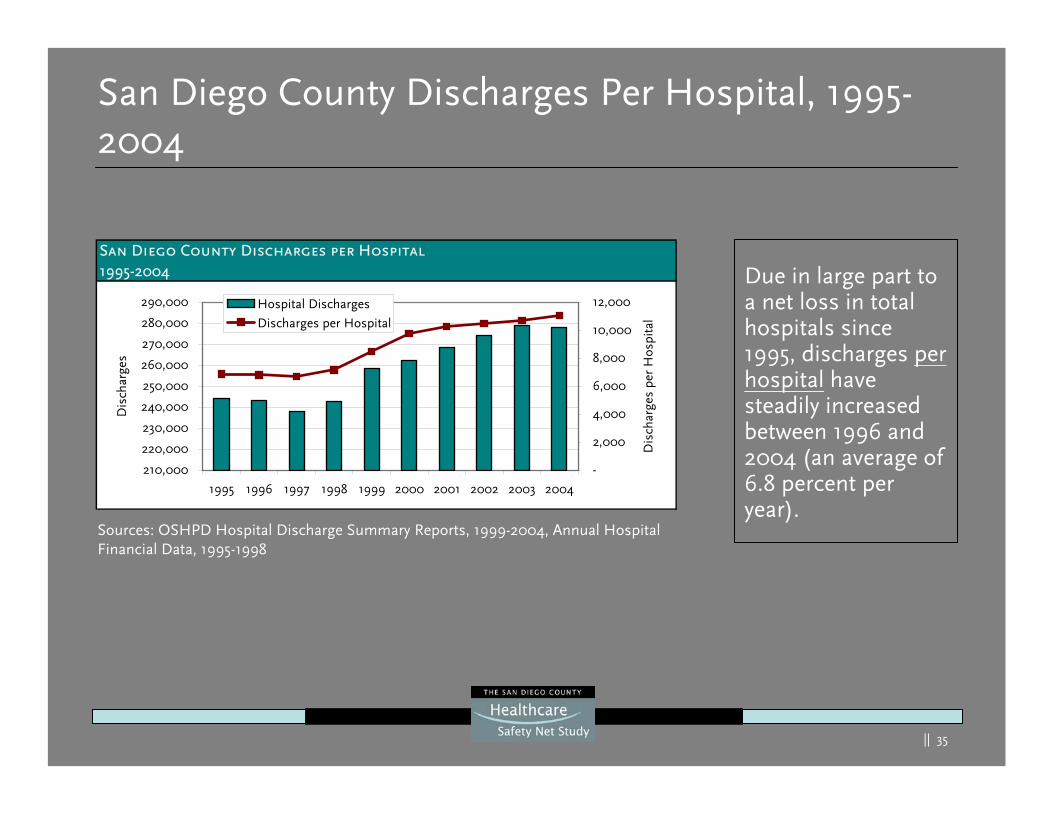
San Diego County Discharges Per Hospital, 1995-2004
Due in large part to a net loss in total hospitals since 1995, discharges per hospital have steadily increased between 1996 and 2004 (an average of 6.8 percent per year).
San Diego County Discharges per Hospital1995-2004
210,000
220,000
230,000
240,000
250,000
260,000
270,000
280,000
290,000
1995 1996 1997 1998 1999 2000 2001 2002 2003 2004
Dis
char
ges
-
2,000
4,000
6,000
8,000
10,000
12,000
Dis
char
ges
per
Hos
pita
l
Hospital Discharges
Discharges per Hospital
Sources: OSHPD Hospital Discharge Summary Reports, 1999-2004, Annual Hospital Financial Data, 1995-1998
|| 36
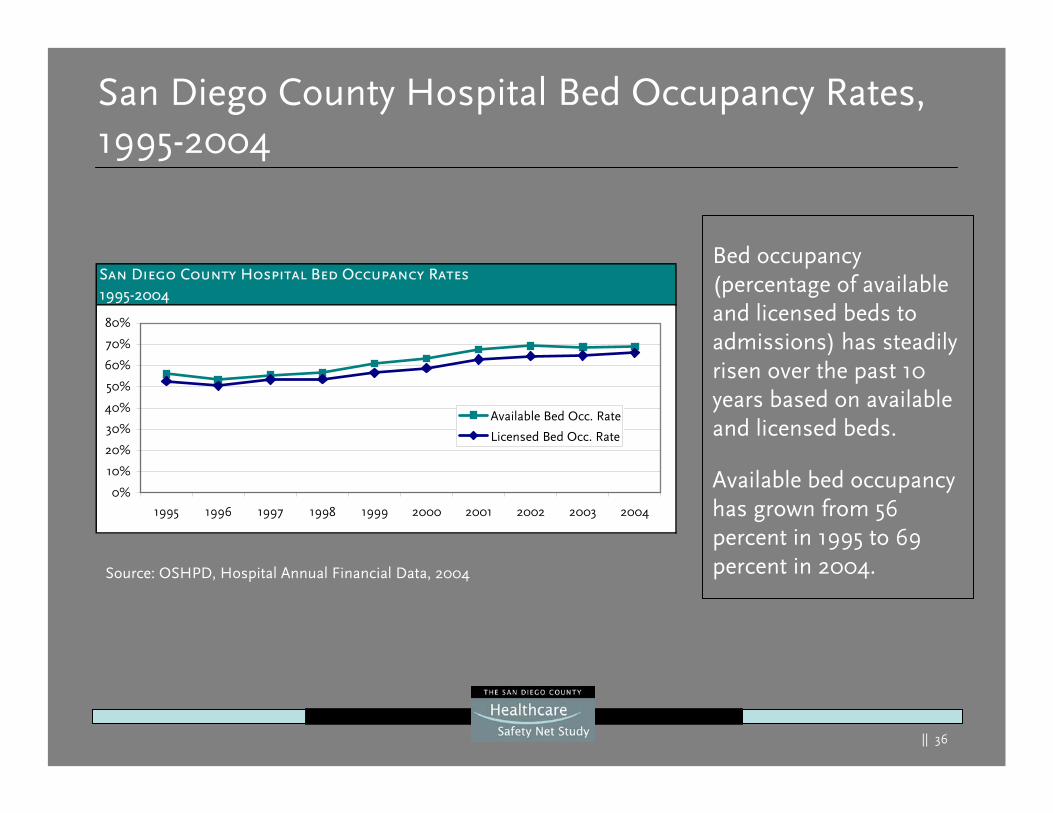
San Diego County Hospital Bed Occupancy Rates, 1995-2004
Bed occupancy (percentage of available and licensed beds to admissions) has steadily risen over the past 10 years based on available and licensed beds.
Available bed occupancy has grown from 56 percent in 1995 to 69 percent in 2004.Source: OSHPD, Hospital Annual Financial Data, 2004
San Diego County Hospital Bed Occupancy Rates1995-2004
0%
10%
20%
30%
40%
50%
60%
70%
80%
1995 1996 1997 1998 1999 2000 2001 2002 2003 2004
Available Bed Occ. Rate
Licensed Bed Occ. Rate
|| 37
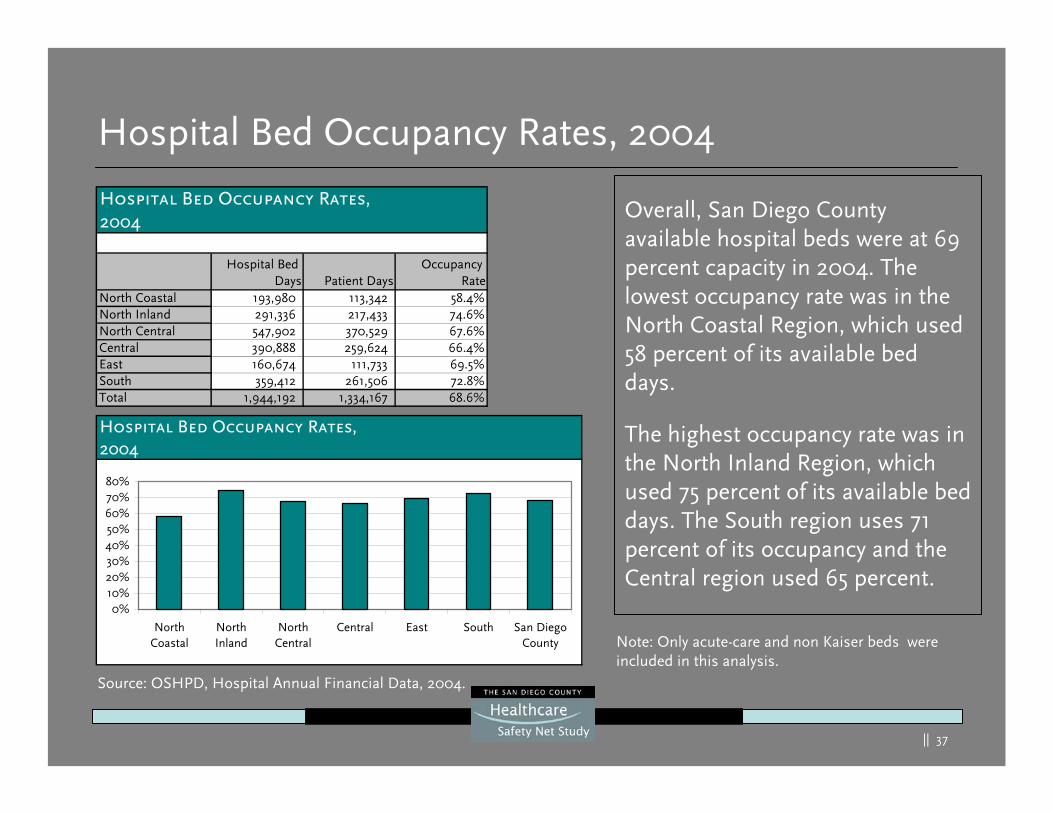
Hospital Bed Occupancy Rates, 2004
Overall, San Diego County available hospital beds were at 69 percent capacity in 2004. The lowest occupancy rate was in the North Coastal Region, which used 58 percent of its available bed days.
The highest occupancy rate was in the North Inland Region, which used 75 percent of its available bed days. The South region uses 71 percent of its occupancy and the Central region used 65 percent.
Note: Only acute-care and non Kaiser beds were included in this analysis.
Hospital Bed Occupancy Rates,2004
Hospital Bed Days Patient Days
Occupancy Rate
North Coastal 193,980 113,342 58.4%North Inland 291,336 217,433 74.6%North Central 547,902 370,529 67.6%Central 390,888 259,624 66.4%East 160,674 111,733 69.5%South 359,412 261,506 72.8%Total 1,944,192 1,334,167 68.6%
Hospital Bed Occupancy Rates,2004
0%10%20%30%40%50%60%70%80%
NorthCoastal
NorthInland
NorthCentral
Central East South San DiegoCounty
Source: OSHPD, Hospital Annual Financial Data, 2004.
|| 38
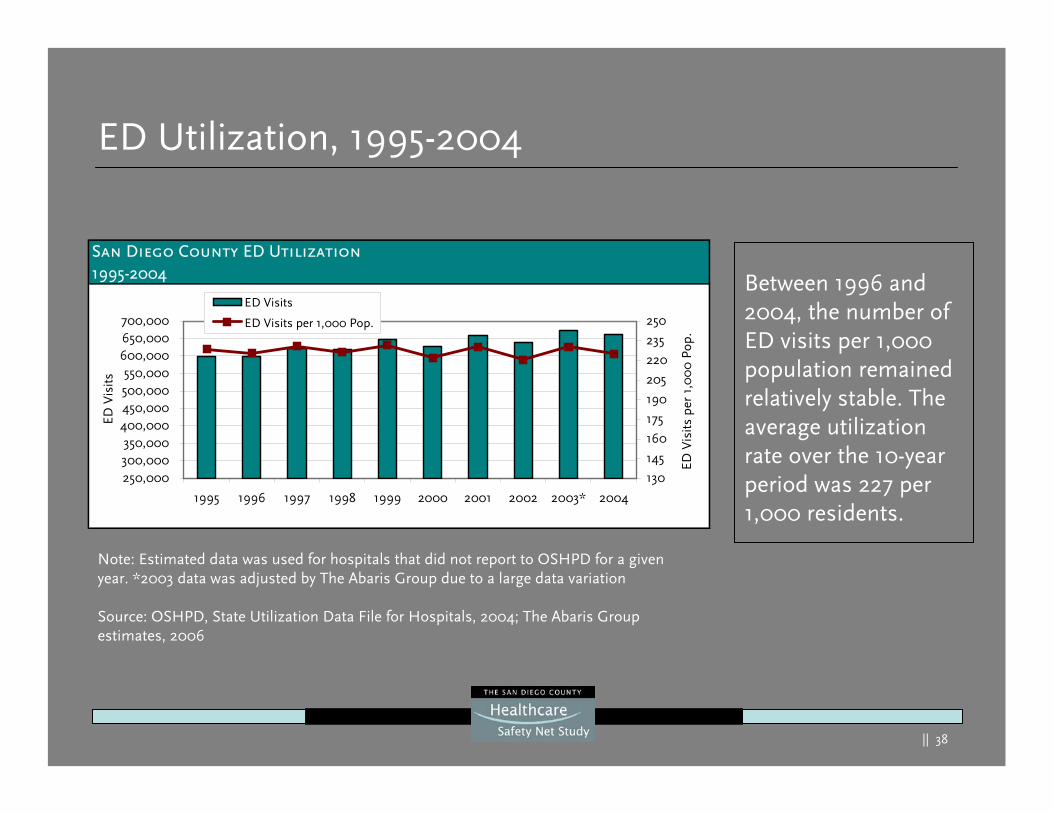
ED Utilization, 1995-2004
Between 1996 and 2004, the number of ED visits per 1,000 population remained relatively stable. The average utilization rate over the 10-year period was 227 per 1,000 residents.
Note: Estimated data was used for hospitals that did not report to OSHPD for a given year. *2003 data was adjusted by The Abaris Group due to a large data variation
Source: OSHPD, State Utilization Data File for Hospitals, 2004; The Abaris Group estimates, 2006
San Diego County ED Utilization1995-2004
250,000300,000350,000
400,000450,000500,000550,000
600,000650,000700,000
1995 1996 1997 1998 1999 2000 2001 2002 2003* 2004
ED V
isits
130
145
160
175
190
205
220
235
250
ED V
isits
per
1,0
00
Pop
.
ED Visits
ED Visits per 1,000 Pop.
|| 39
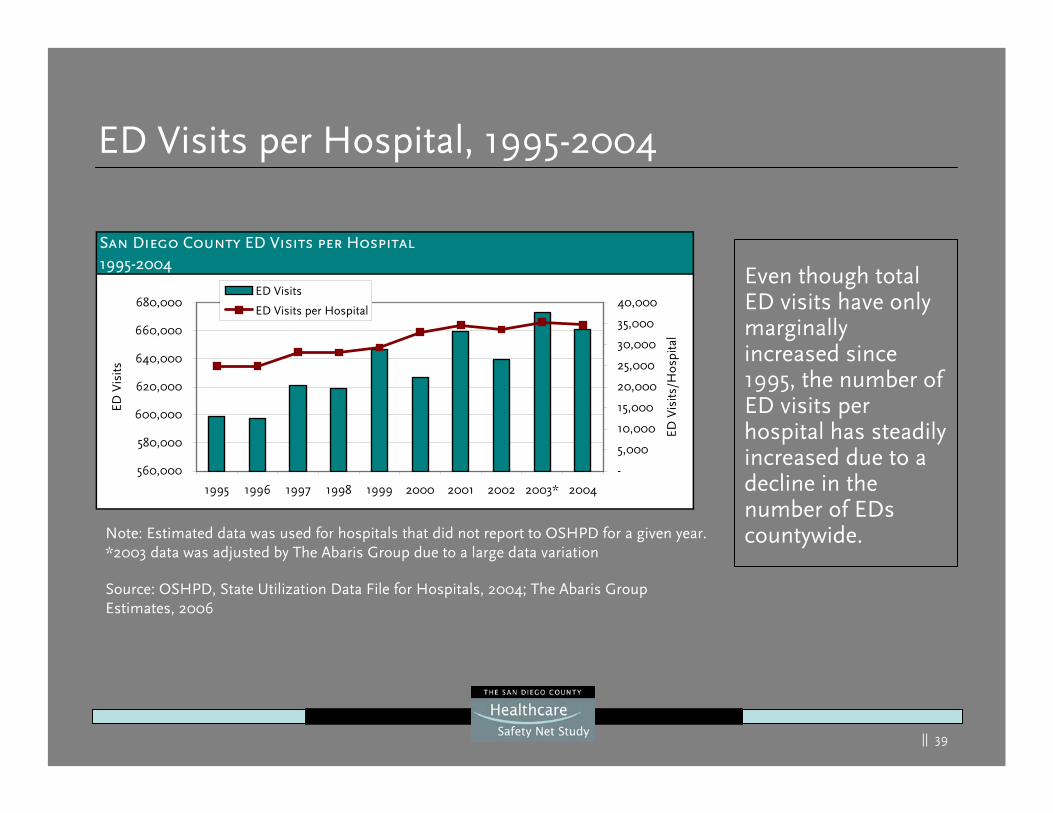
ED Visits per Hospital, 1995-2004
Even though total ED visits have only marginally increased since 1995, the number of ED visits per hospital has steadily increased due to a decline in the number of EDs countywide.Note: Estimated data was used for hospitals that did not report to OSHPD for a given year.
*2003 data was adjusted by The Abaris Group due to a large data variation
Source: OSHPD, State Utilization Data File for Hospitals, 2004; The Abaris Group Estimates, 2006
San Diego County ED Visits per Hospital1995-2004
560,000
580,000
600,000
620,000
640,000
660,000
680,000
1995 1996 1997 1998 1999 2000 2001 2002 2003* 2004
ED V
isits
-
5,000
10,000
15,000
20,000
25,000
30,000
35,000
40,000
ED V
isits
/Hos
pita
l
ED Visits
ED Visits per Hospital
|| 40
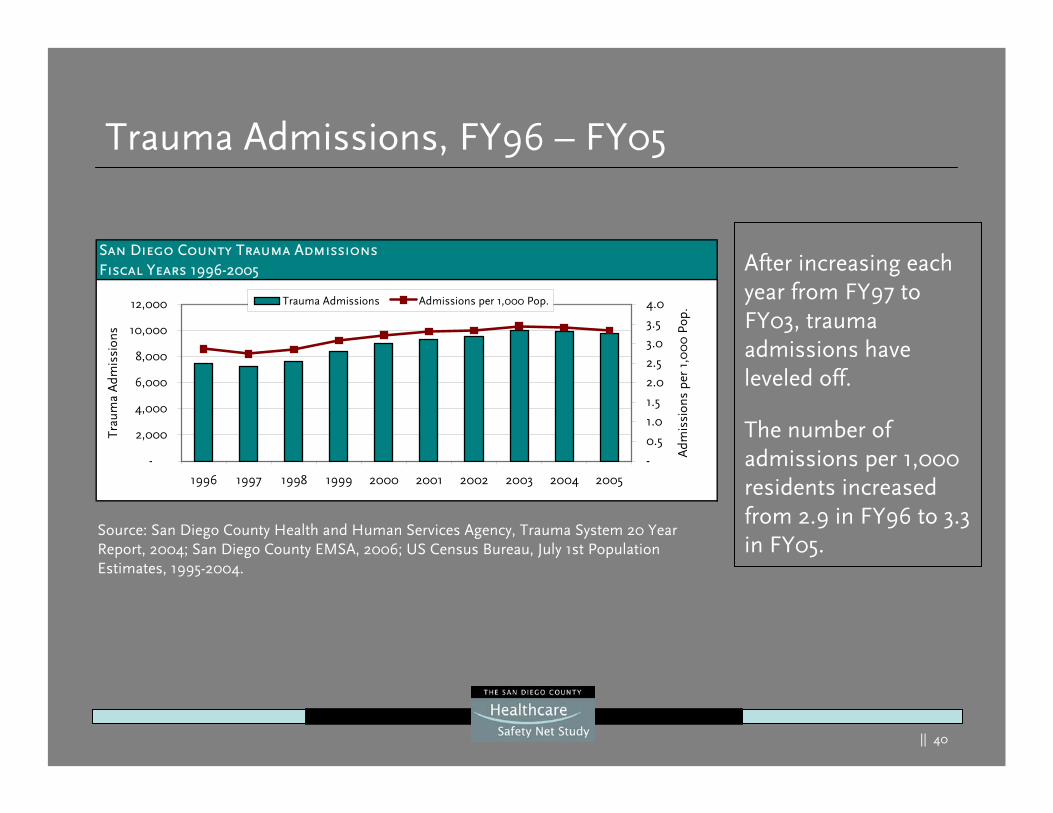
Trauma Admissions, FY96 – FY05
After increasing each year from FY97 to FY03, trauma admissions have leveled off.
The number of admissions per 1,000 residents increased from 2.9 in FY96 to 3.3 in FY05.
Source: San Diego County Health and Human Services Agency, Trauma System 20 Year Report, 2004; San Diego County EMSA, 2006; US Census Bureau, July 1st Population Estimates, 1995-2004.
San Diego County Trauma AdmissionsFiscal Years 1996-2005
-
2,000
4,000
6,000
8,000
10,000
12,000
1996 1997 1998 1999 2000 2001 2002 2003 2004 2005
Trau
ma
Adm
issi
ons
-
0.5
1.0
1.5
2.0
2.5
3.0
3.5
4.0
Adm
issi
ons
per
1,0
00
Pop
.Trauma Admissions Admissions per 1,000 Pop.
|| 41
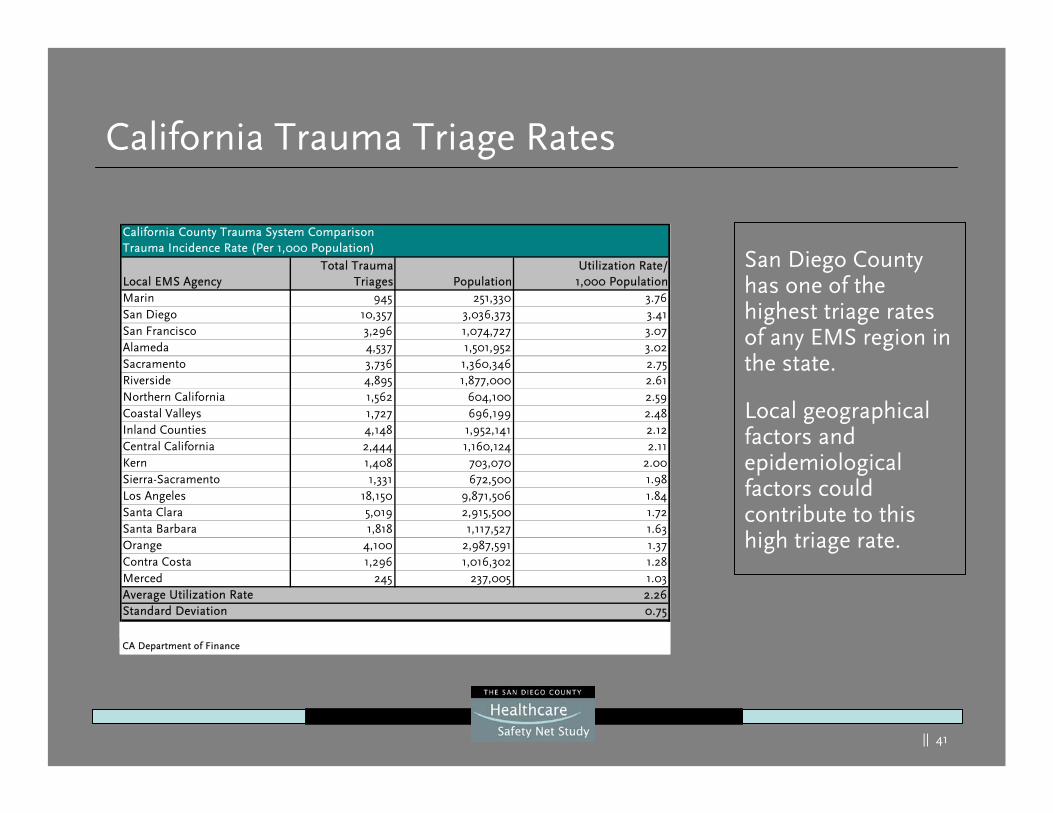
California Trauma Triage Rates
San Diego County has one of the highest triage rates of any EMS region in the state.
Local geographical factors and epidemiological factors could contribute to this high triage rate.
Marin 945 251,330 3.76San Diego 10,357 3,036,373 3.41San Francisco 3,296 1,074,727 3.07Alameda 4,537 1,501,952 3.02Sacramento 3,736 1,360,346 2.75Riverside 4,895 1,877,000 2.61Northern California 1,562 604,100 2.59Coastal Valleys 1,727 696,199 2.48Inland Counties 4,148 1,952,141 2.12Central California 2,444 1,160,124 2.11Kern 1,408 703,070 2.00Sierra-Sacramento 1,331 672,500 1.98Los Angeles 18,150 9,871,506 1.84Santa Clara 5,019 2,915,500 1.72Santa Barbara 1,818 1,117,527 1.63Orange 4,100 2,987,591 1.37Contra Costa 1,296 1,016,302 1.28Merced 245 237,005 1.03Average Utilization Rate 2.26Standard Deviation 0.75
California County Trauma System ComparisonTrauma Incidence Rate (Per 1,000 Population)
Local EMS AgencyTotal Trauma
Triages
CA Department of Finance
Source: 2005 The Abaris Group survey of Individual California local EMS agencies,
Utilization Rate/1,000 PopulationPopulation
|| 42
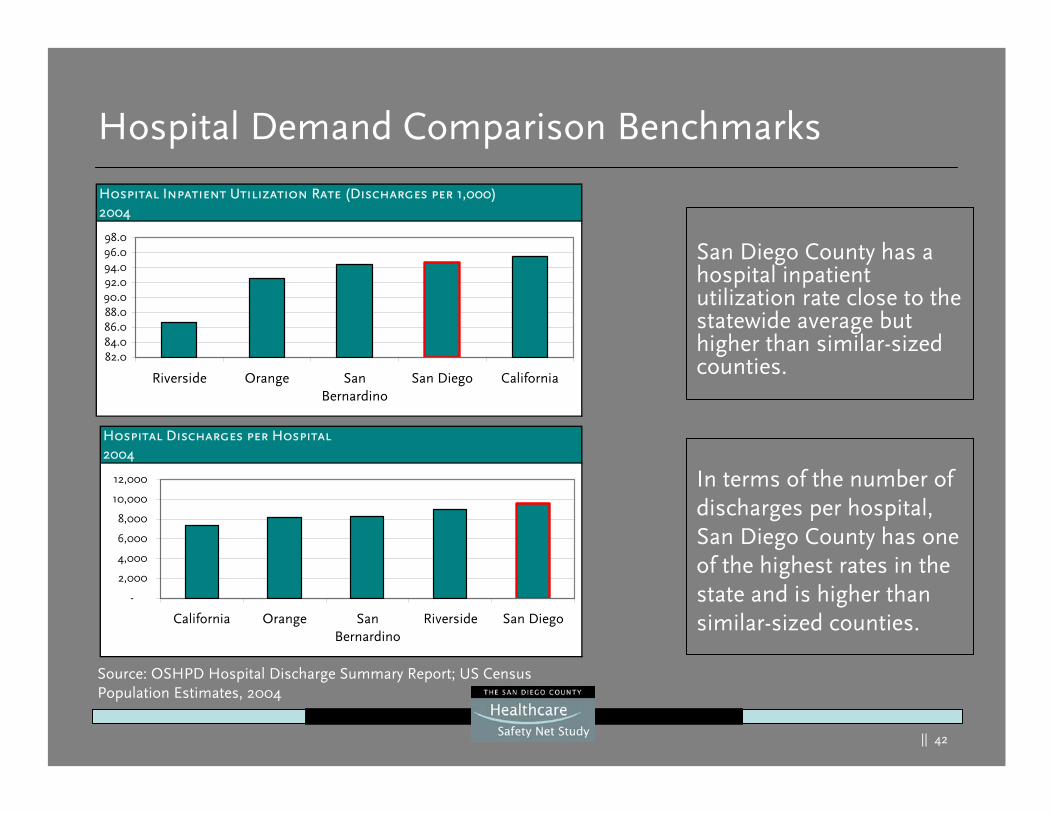
Hospital Demand Comparison Benchmarks
San Diego County has a hospital inpatient utilization rate close to the statewide average but higher than similar-sized counties.
In terms of the number of discharges per hospital, San Diego County has one of the highest rates in the state and is higher than similar-sized counties.
Source: OSHPD Hospital Discharge Summary Report; US Census Population Estimates, 2004
Hospital Inpatient Utilization Rate (Discharges per 1,000)2004
82.084.086.088.090.092.094.096.098.0
Riverside Orange SanBernardino
San Diego California
Hospital Discharges per Hospital2004
-
2,000
4,000
6,000
8,000
10,000
12,000
California Orange SanBernardino
Riverside San Diego
|| 43
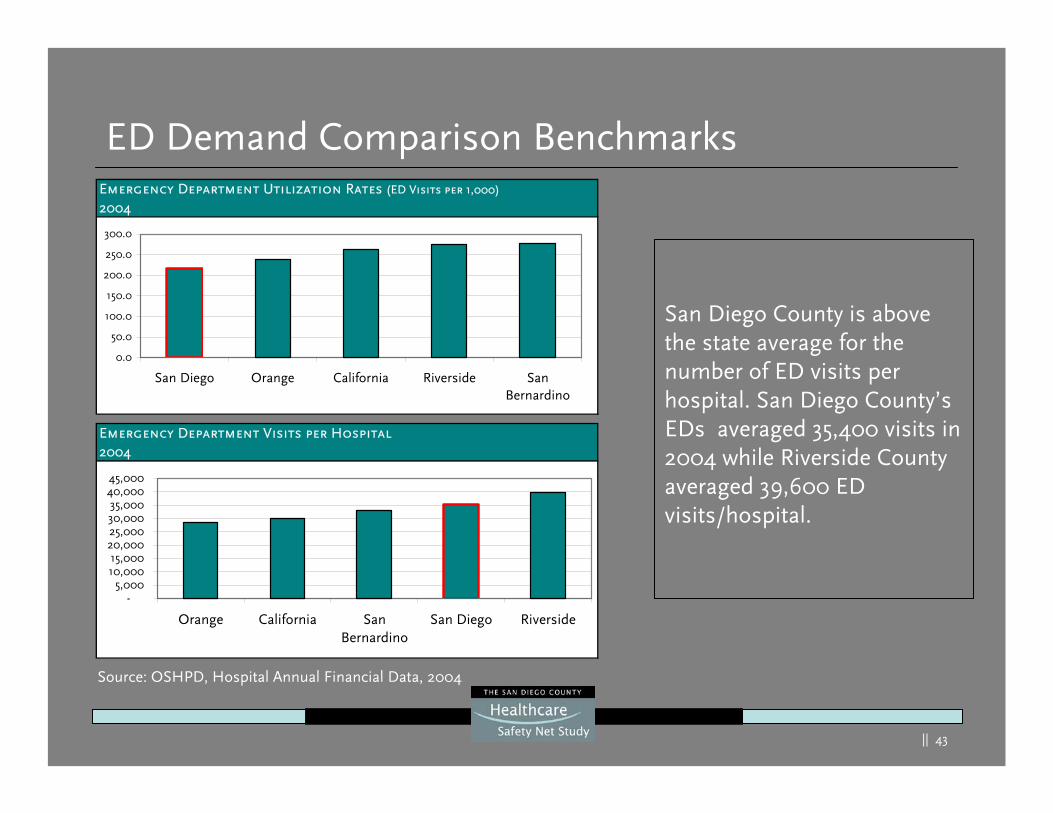
ED Demand Comparison Benchmarks
Source: OSHPD, Hospital Annual Financial Data, 2004
San Diego County is above the state average for the number of ED visits per hospital. San Diego County’s EDs averaged 35,400 visits in 2004 while Riverside County averaged 39,600 ED visits/hospital.
Emergency Department Visits per Hospital2004
-5,000
10,00015,000
20,00025,00030,00035,000
40,00045,000
Orange California SanBernardino
San Diego Riverside
Emergency Department Utilization Rates (ED Visits per 1,000)
2004
0.0
50.0
100.0
150.0
200.0
250.0
300.0
San Diego Orange California Riverside SanBernardino
|| 44
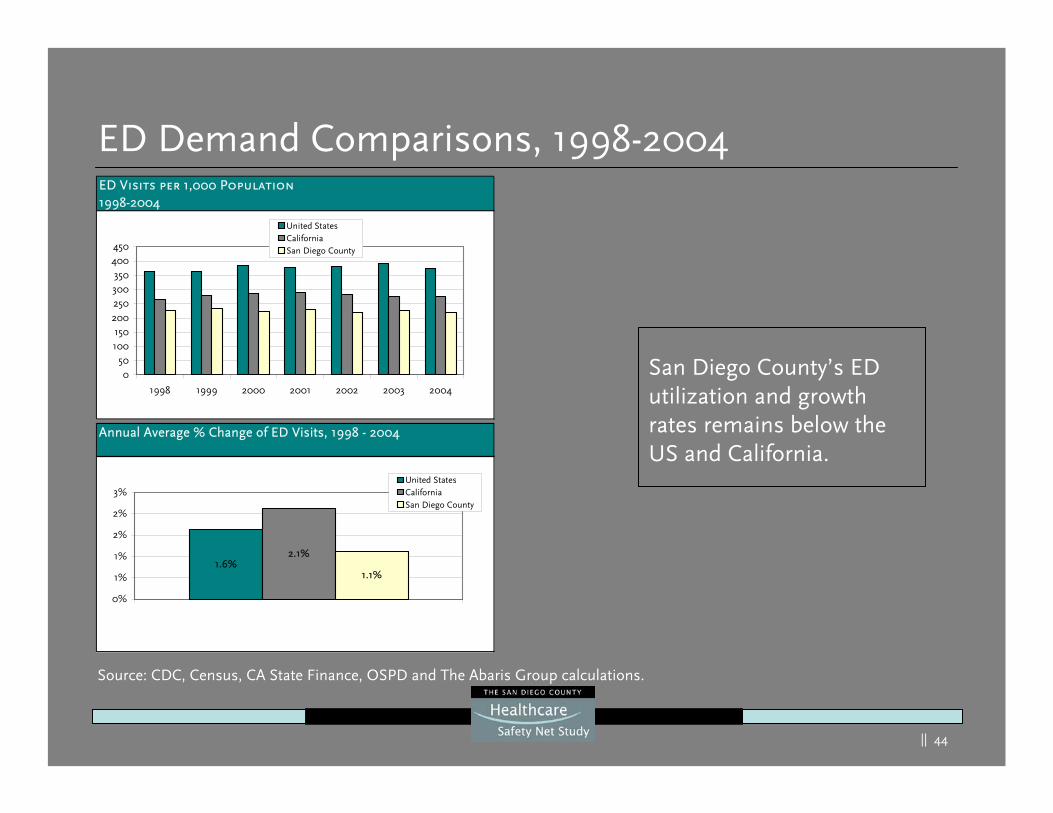
ED Demand Comparisons, 1998-2004ED Visits per 1,000 Population1998-2004
050
100150
200250300350
400450
1998 1999 2000 2001 2002 2003 2004
United StatesCaliforniaSan Diego County
Annual Average % Change of ED Visits, 1998 - 2004
1.6%2.1%
1.1%
0%
1%
1%
2%
2%
3%United StatesCaliforniaSan Diego County
San Diego County’s ED utilization and growth rates remains below the US and California.
Source: CDC, Census, CA State Finance, OSPD and The Abaris Group calculations.
|| 45
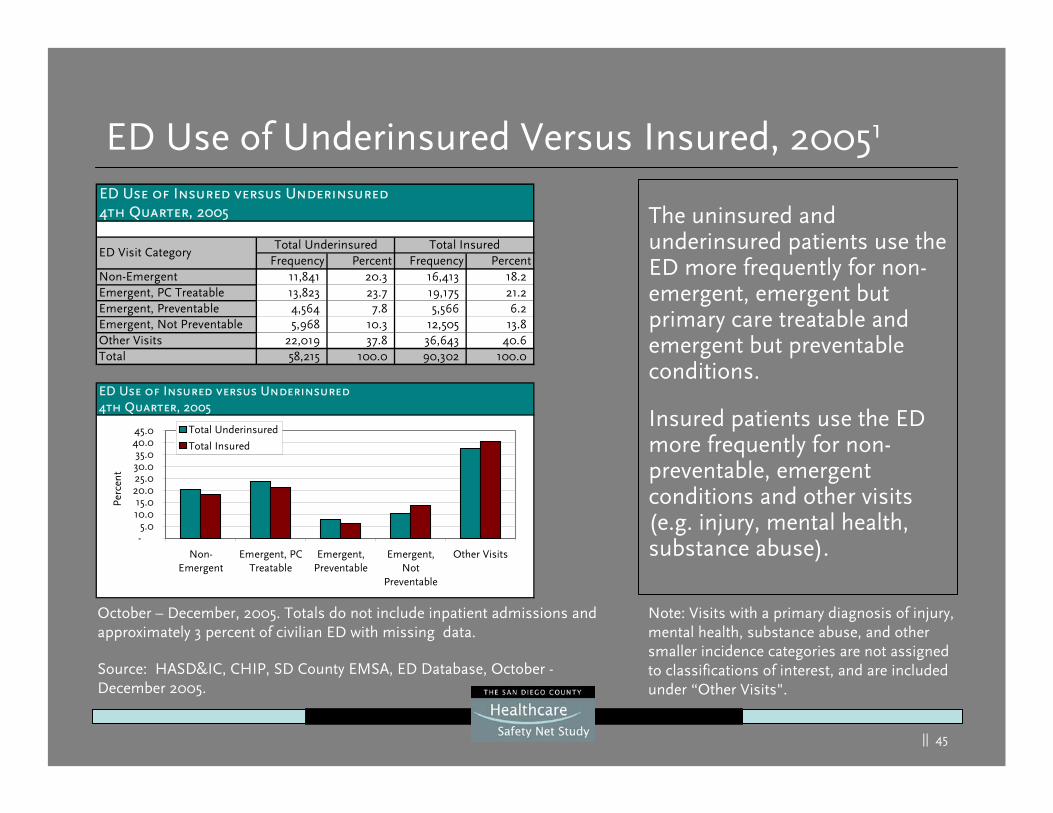
ED Use of Underinsured Versus Insured, 20051
ED Use of Insured versus Underinsured4th Quarter, 2005
Frequency Percent Frequency PercentNon-Emergent 11,841 20.3 16,413 18.2 Emergent, PC Treatable 13,823 23.7 19,175 21.2 Emergent, Preventable 4,564 7.8 5,566 6.2 Emergent, Not Preventable 5,968 10.3 12,505 13.8 Other Visits 22,019 37.8 36,643 40.6 Total 58,215 100.0 90,302 100.0
Total Underinsured Total InsuredED Visit Category
The uninsured and underinsured patients use the ED more frequently for non-emergent, emergent but primary care treatable and emergent but preventable conditions.
Insured patients use the ED more frequently for non-preventable, emergent conditions and other visits (e.g. injury, mental health, substance abuse).
Source: HASD&IC, CHIP, SD County EMSA, ED Database, October -December 2005.
October – December, 2005. Totals do not include inpatient admissions and approximately 3 percent of civilian ED with missing data.
ED Use of Insured versus Underinsured4th Quarter, 2005
-5.0
10.015.0
20.025.030.035.0
40.045.0
Non-Emergent
Emergent, PCTreatable
Emergent,Preventable
Emergent,Not
Preventable
Other Visits
Perc
ent
Total Underinsured
Total Insured
Note: Visits with a primary diagnosis of injury, mental health, substance abuse, and other smaller incidence categories are not assigned to classifications of interest, and are included under “Other Visits".
|| 46
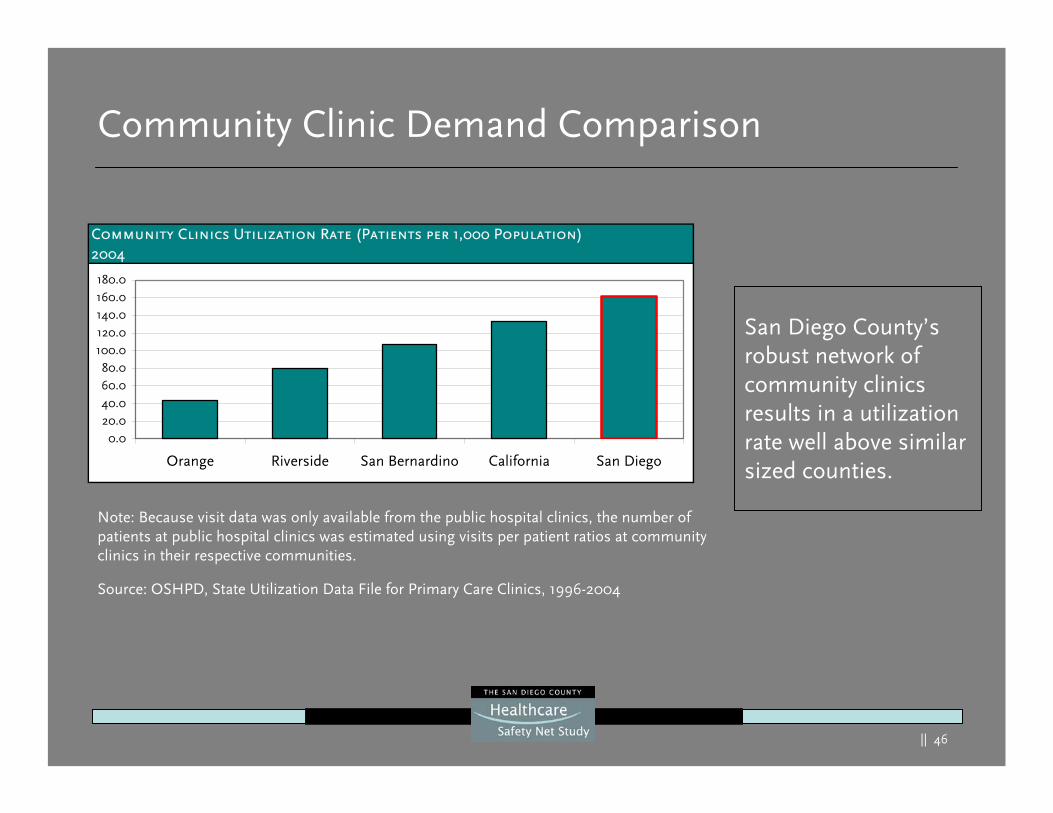
Community Clinic Demand Comparison
San Diego County’s robust network of community clinics results in a utilization rate well above similar sized counties.
Community Clinics Utilization Rate (Patients per 1,000 Population)2004
0.020.040.060.080.0
100.0120.0140.0160.0180.0
Orange Riverside San Bernardino California San Diego
Source: OSHPD, State Utilization Data File for Primary Care Clinics, 1996-2004
Note: Because visit data was only available from the public hospital clinics, the number of patients at public hospital clinics was estimated using visits per patient ratios at community clinics in their respective communities.
|| 47
Current Capacity
|| 48
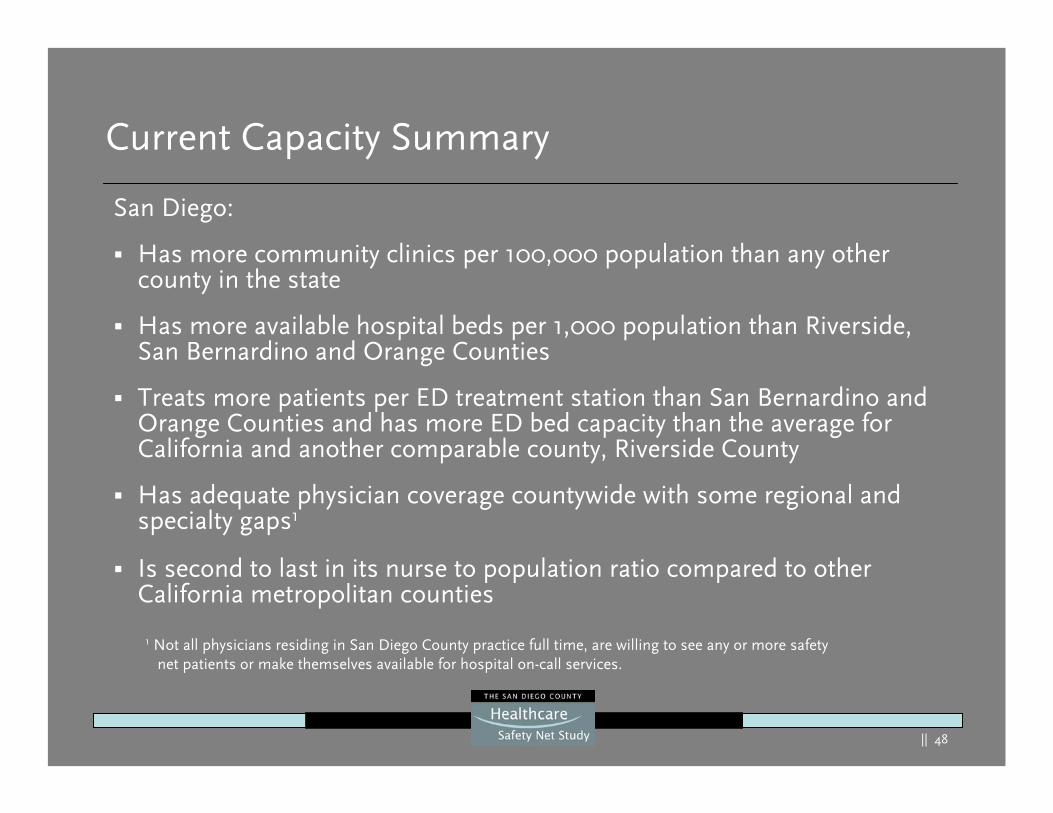
Current Capacity Summary
San Diego:
Has more community clinics per 100,000 population than any othercounty in the state
Has more available hospital beds per 1,000 population than Riverside, San Bernardino and Orange Counties
Treats more patients per ED treatment station than San Bernardino and Orange Counties and has more ED bed capacity than the average for California and another comparable county, Riverside County
Has adequate physician coverage countywide with some regional and specialty gaps1
Is second to last in its nurse to population ratio compared to other California metropolitan counties
1 Not all physicians residing in San Diego County practice full time, are willing to see any or more safety net patients or make themselves available for hospital on-call services.
|| 49
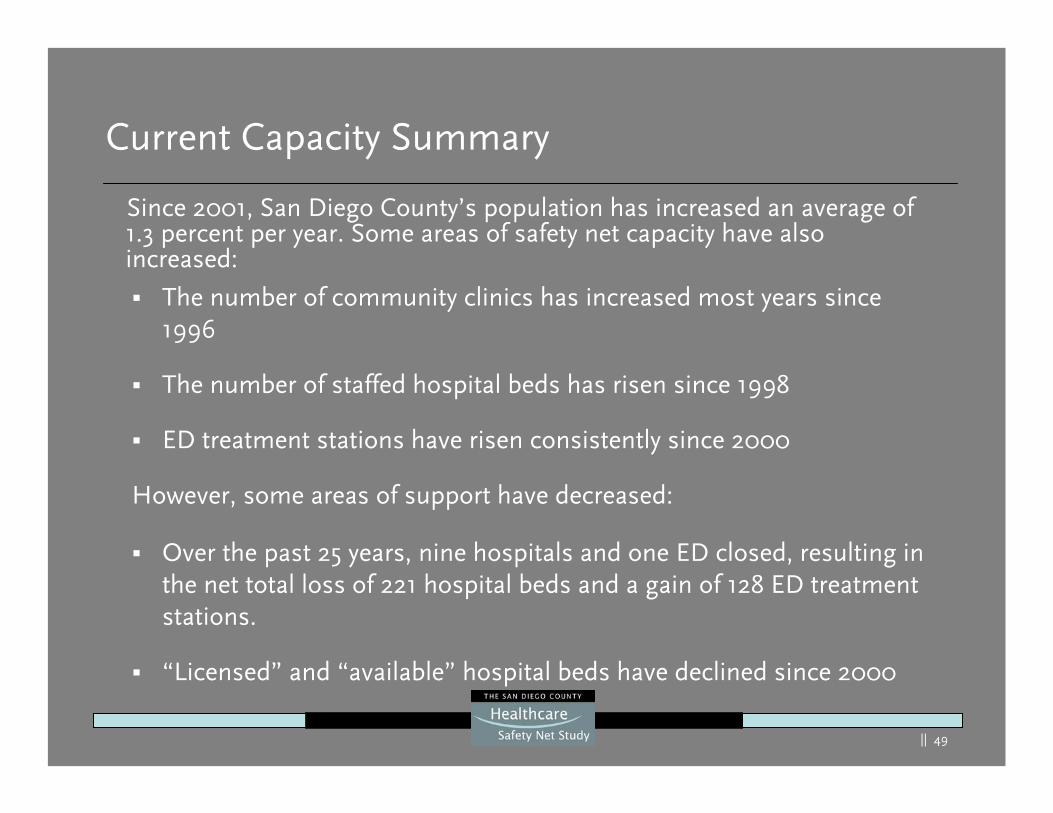
Current Capacity Summary
Since 2001, San Diego County’s population has increased an average of 1.3 percent per year. Some areas of safety net capacity have also increased:
The number of community clinics has increased most years since 1996
The number of staffed hospital beds has risen since 1998
ED treatment stations have risen consistently since 2000
However, some areas of support have decreased:
Over the past 25 years, nine hospitals and one ED closed, resulting in the net total loss of 221 hospital beds and a gain of 128 ED treatment stations.
“Licensed” and “available” hospital beds have declined since 2000
|| 50
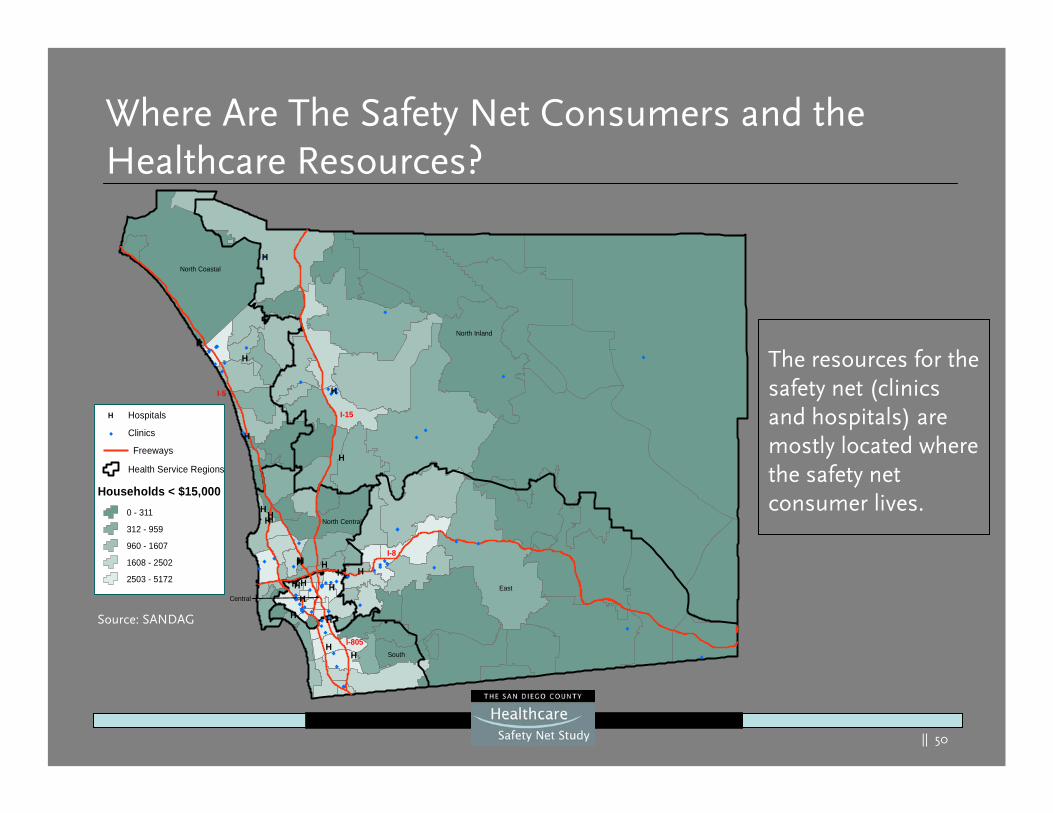
Where Are The Safety Net Consumers and the Healthcare Resources?
Source: SANDAG
H
H
H
H
H
HHHH
HHHH HHH
HHH HH
H H
HH
North Coastal
North Inland
North Central
East
South
Central
I-15
I-5
I-8
I-805
®
H Hospitals
Health Service Regions
Households < $15,000
Freeways
Clinics
0 - 311
312 - 959
960 - 1607
1608 - 2502
2503 - 5172
The resources for the safety net (clinics and hospitals) are mostly located where the safety net consumer lives.
Source: SANDAG
|| 51
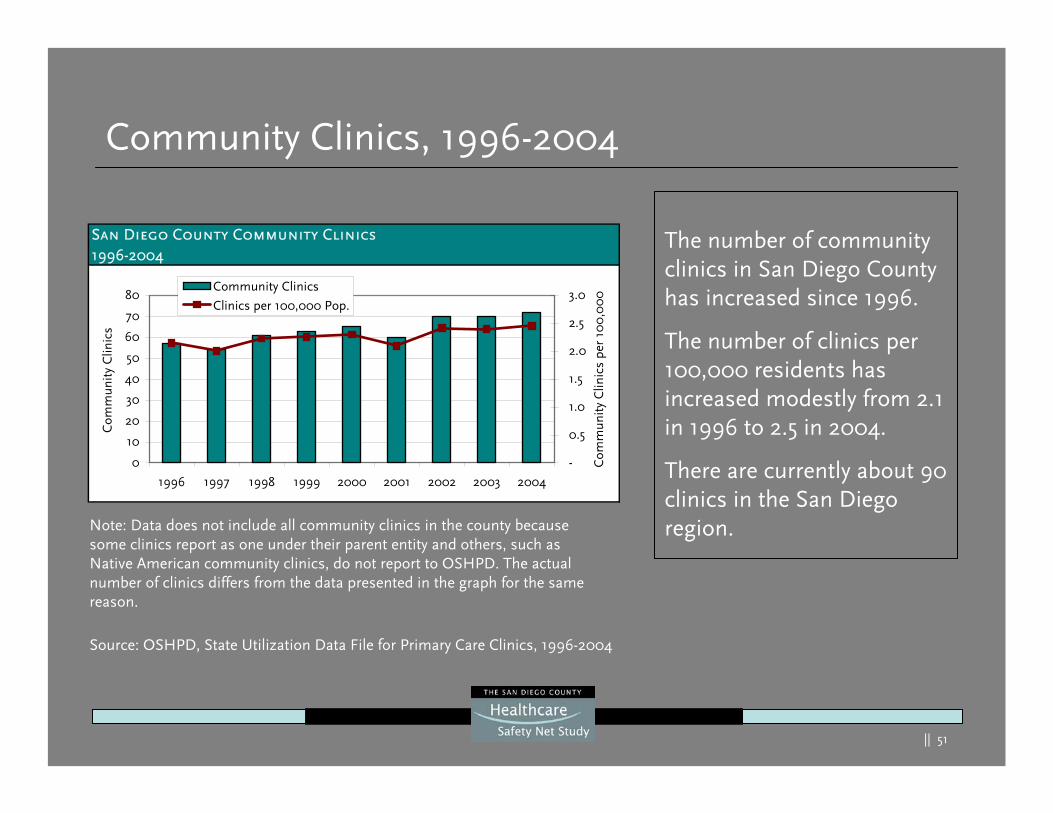
Community Clinics, 1996-2004
The number of community clinics in San Diego County has increased since 1996.
The number of clinics per 100,000 residents has increased modestly from 2.1 in 1996 to 2.5 in 2004.
There are currently about 90 clinics in the San Diego region.Note: Data does not include all community clinics in the county because
some clinics report as one under their parent entity and others, such as Native American community clinics, do not report to OSHPD. The actual number of clinics differs from the data presented in the graph for the same reason.
Source: OSHPD, State Utilization Data File for Primary Care Clinics, 1996-2004
San Diego County Community Clinics1996-2004
0
10
20
30
40
50
60
70
80
1996 1997 1998 1999 2000 2001 2002 2003 2004
Com
mun
ity
Clin
ics
-
0.5
1.0
1.5
2.0
2.5
3.0
Com
mun
ity C
linic
s pe
r 10
0,0
00
Community Clinics
Clinics per 100,000 Pop.
|| 52
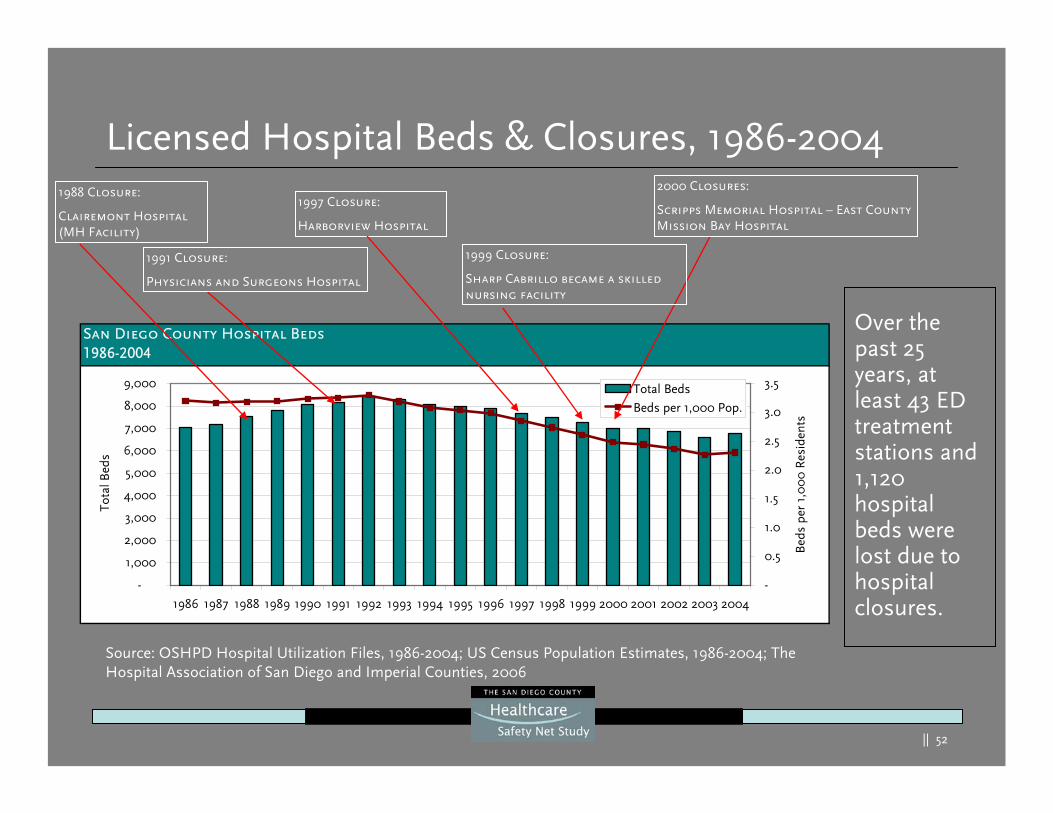
San Diego County Hospital Beds1986-2004
-
1,000
2,000
3,000
4,000
5,000
6,000
7,000
8,000
9,000
1986 1987 1988 1989 1990 1991 1992 1993 1994 1995 1996 1997 1998 1999 2000 2001 2002 2003 2004
Tot
al B
eds
-
0.5
1.0
1.5
2.0
2.5
3.0
3.5
Bed
s pe
r 1,
00
0 R
esid
ents
Total Beds
Beds per 1,000 Pop.
Licensed Hospital Beds & Closures, 1986-20041988 Closure:
Clairemont Hospital (MH Facility)
1997 Closure:
Harborview Hospital
1991 Closure:
Physicians and Surgeons Hospital
2000 Closures:
Scripps Memorial Hospital – East CountyMission Bay Hospital
Source: OSHPD Hospital Utilization Files, 1986-2004; US Census Population Estimates, 1986-2004; The Hospital Association of San Diego and Imperial Counties, 2006
Over the past 25 years, at least 43 ED treatment stations and 1,120 hospital beds were lost due to hospital closures.
1999 Closure:
Sharp Cabrillo became a skilled nursing facility
|| 53
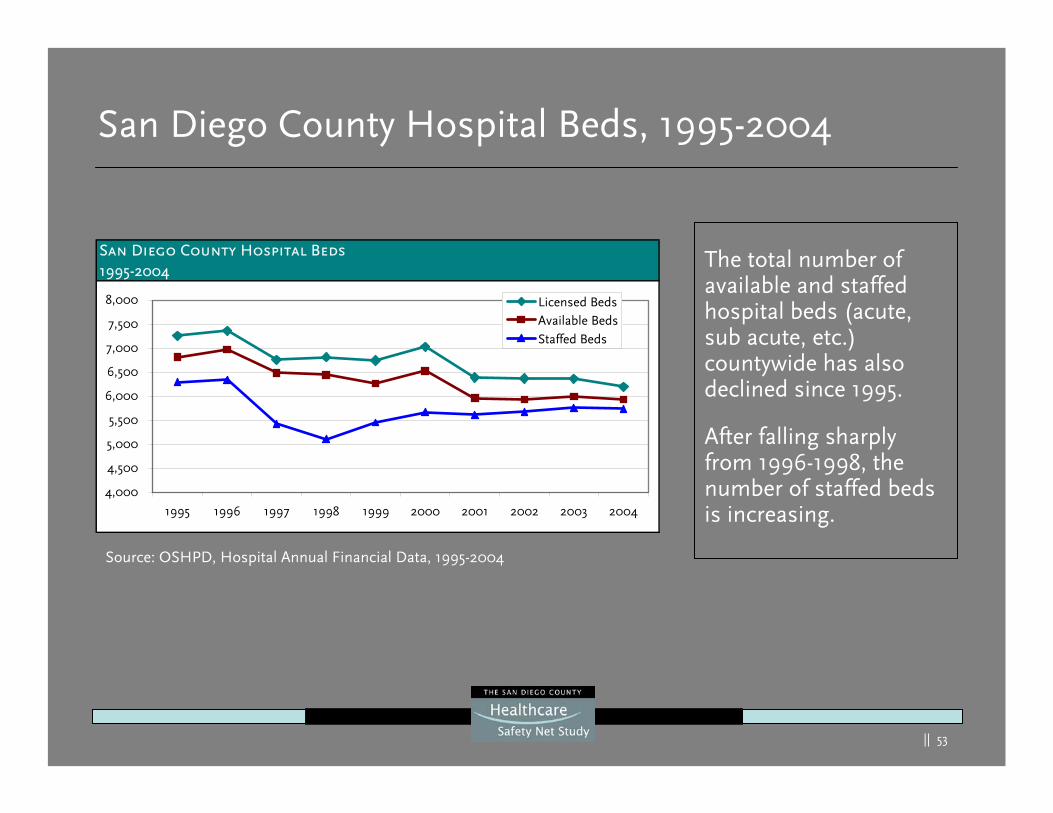
San Diego County Hospital Beds, 1995-2004
The total number of available and staffed hospital beds (acute, sub acute, etc.) countywide has also declined since 1995.
After falling sharply from 1996-1998, the number of staffed beds is increasing.
Source: OSHPD, Hospital Annual Financial Data, 1995-2004
San Diego County Hospital Beds1995-2004
4,000
4,500
5,000
5,500
6,000
6,500
7,000
7,500
8,000
1995 1996 1997 1998 1999 2000 2001 2002 2003 2004
Licensed BedsAvailable BedsStaffed Beds
|| 54
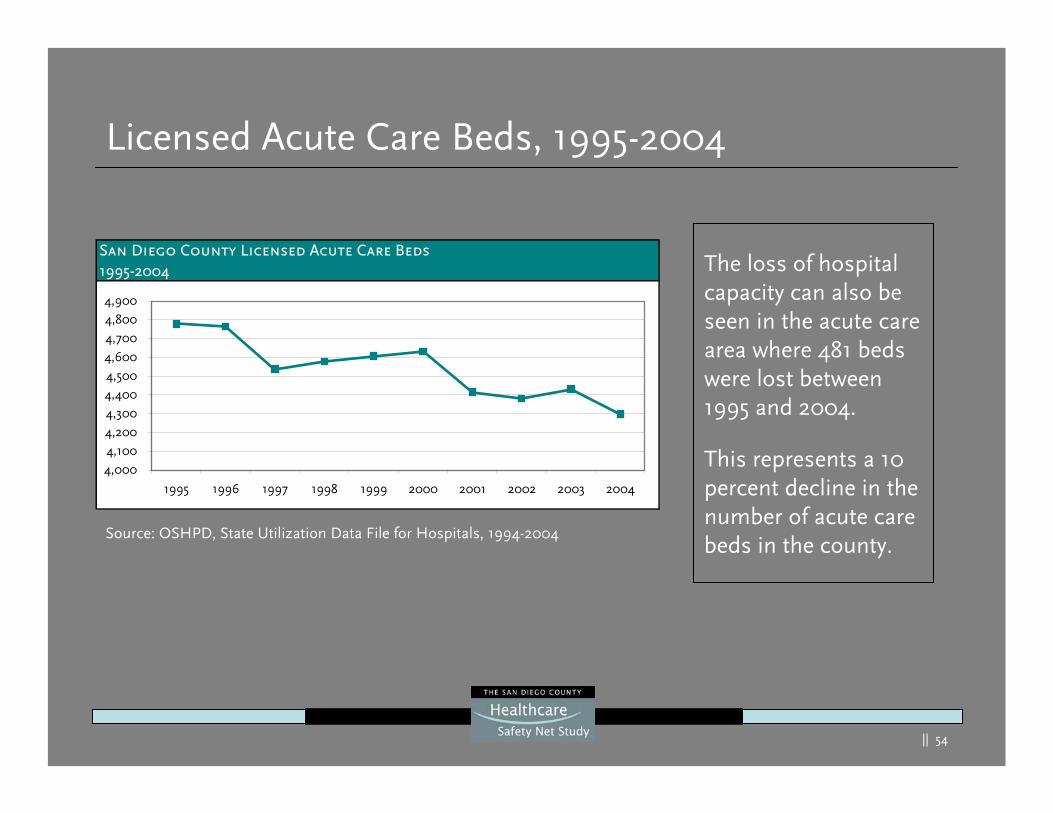
Licensed Acute Care Beds, 1995-2004
The loss of hospital capacity can also be seen in the acute care area where 481 beds were lost between 1995 and 2004.
This represents a 10 percent decline in the number of acute care beds in the county.
Source: OSHPD, State Utilization Data File for Hospitals, 1994-2004
San Diego County Licensed Acute Care Beds1995-2004
4,000
4,100
4,200
4,300
4,400
4,500
4,600
4,7004,800
4,900
1995 1996 1997 1998 1999 2000 2001 2002 2003 2004
|| 55
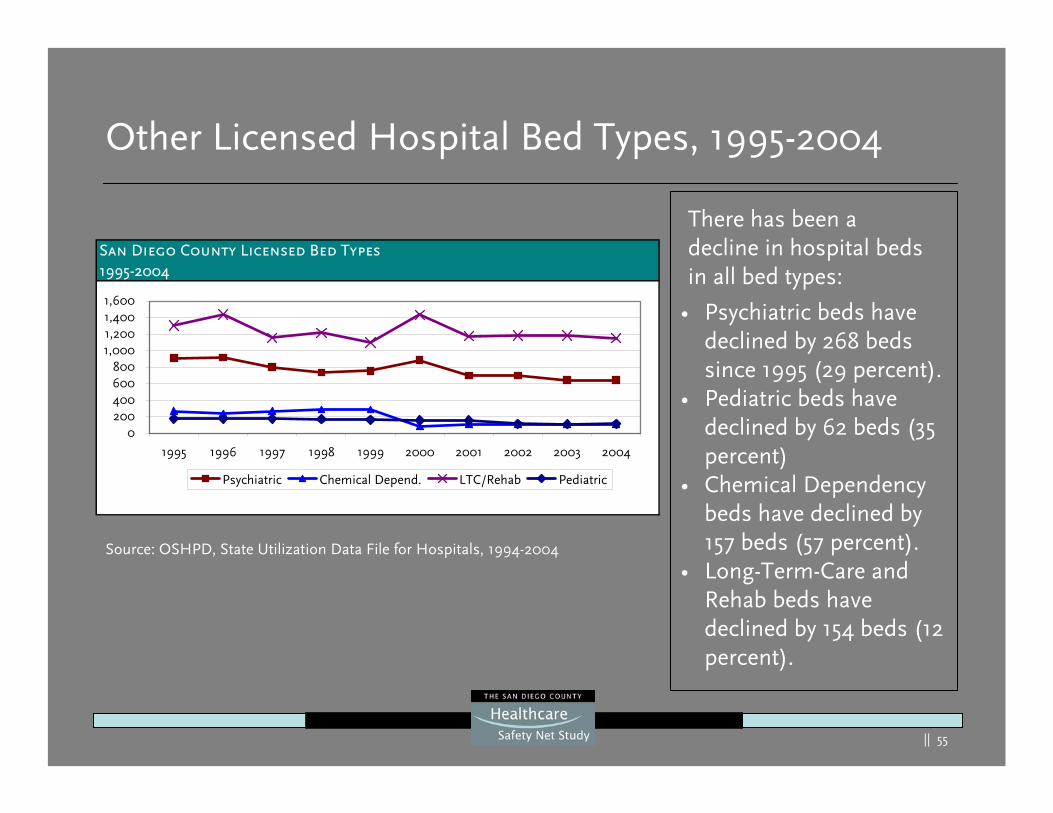
Other Licensed Hospital Bed Types, 1995-2004
Source: OSHPD, State Utilization Data File for Hospitals, 1994-2004
San Diego County Licensed Bed Types1995-2004
0200400600800
1,0001,2001,4001,600
1995 1996 1997 1998 1999 2000 2001 2002 2003 2004
Psychiatric Chemical Depend. LTC/Rehab Pediatric
• Psychiatric beds have declined by 268 beds since 1995 (29 percent).
• Pediatric beds have declined by 62 beds (35 percent)
• Chemical Dependency beds have declined by 157 beds (57 percent).
• Long-Term-Care and Rehab beds have declined by 154 beds (12 percent).
There has been a decline in hospital beds in all bed types:
|| 56
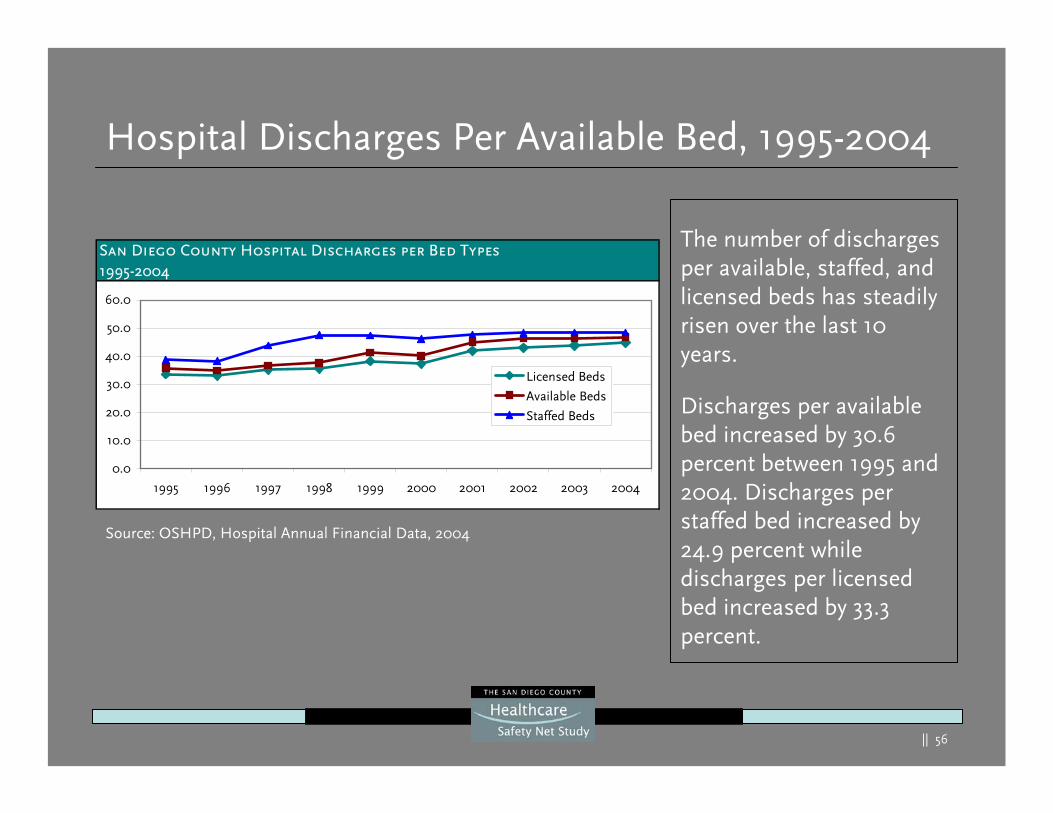
Hospital Discharges Per Available Bed, 1995-2004
The number of discharges per available, staffed, and licensed beds has steadily risen over the last 10 years.
Discharges per available bed increased by 30.6 percent between 1995 and 2004. Discharges per staffed bed increased by 24.9 percent while discharges per licensed bed increased by 33.3 percent.
Source: OSHPD, Hospital Annual Financial Data, 2004
San Diego County Hospital Discharges per Bed Types1995-2004
0.0
10.0
20.0
30.0
40.0
50.0
60.0
1995 1996 1997 1998 1999 2000 2001 2002 2003 2004
Licensed Beds
Available Beds
Staffed Beds
|| 57
San Diego County ED Stations1995-2004
-50
100150
200250300350
400450
1995 1996 1997 1998 1999 2000 2001 2002 2003 2004
ED S
tatio
ns
-
5.0
10.0
15.0
20.0
25.0
Stat
ions
/Hos
pita
l
ED StationsStations per Hospital
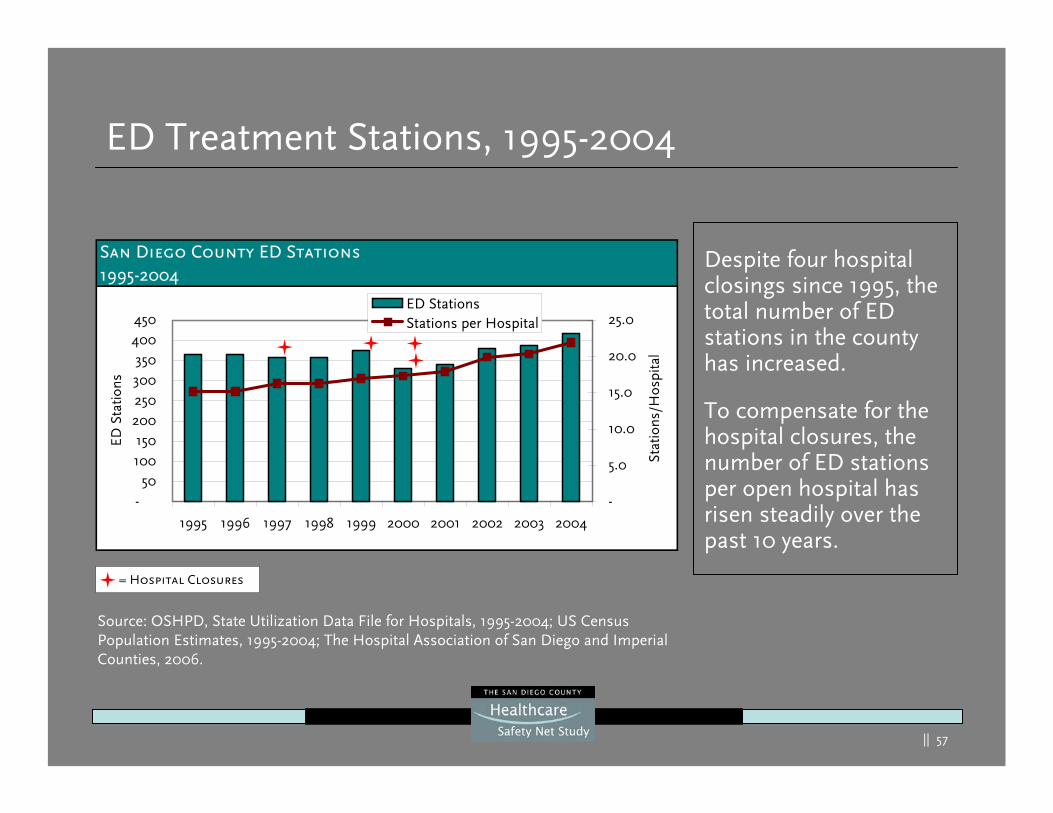
ED Treatment Stations, 1995-2004
= Hospital Closures
Source: OSHPD, State Utilization Data File for Hospitals, 1995-2004; US Census Population Estimates, 1995-2004; The Hospital Association of San Diego and Imperial Counties, 2006.
Despite four hospital closings since 1995, the total number of ED stations in the county has increased.
To compensate for the hospital closures, the number of ED stations per open hospital has risen steadily over the past 10 years.
|| 58
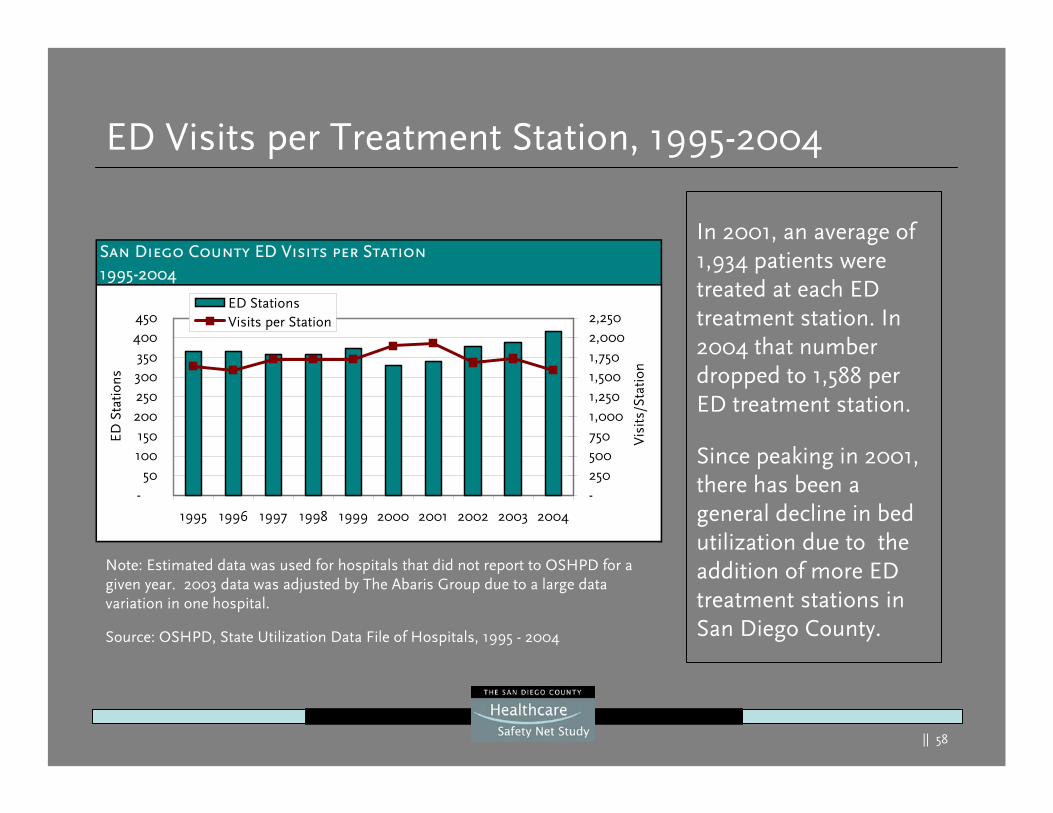
ED Visits per Treatment Station, 1995-2004
Note: Estimated data was used for hospitals that did not report to OSHPD for a given year. 2003 data was adjusted by The Abaris Group due to a large data variation in one hospital.
In 2001, an average of 1,934 patients were treated at each ED treatment station. In 2004 that number dropped to 1,588 per ED treatment station.
Since peaking in 2001, there has been a general decline in bed utilization due to the addition of more ED treatment stations in San Diego County.
San Diego County ED Visits per Station1995-2004
-50
100150
200250300350
400450
1995 1996 1997 1998 1999 2000 2001 2002 2003 2004
ED S
tatio
ns
-2505007501,0001,2501,5001,7502,0002,250
Vis
its/S
tatio
n
ED StationsVisits per Station
Source: OSHPD, State Utilization Data File of Hospitals, 1995 - 2004
|| 59
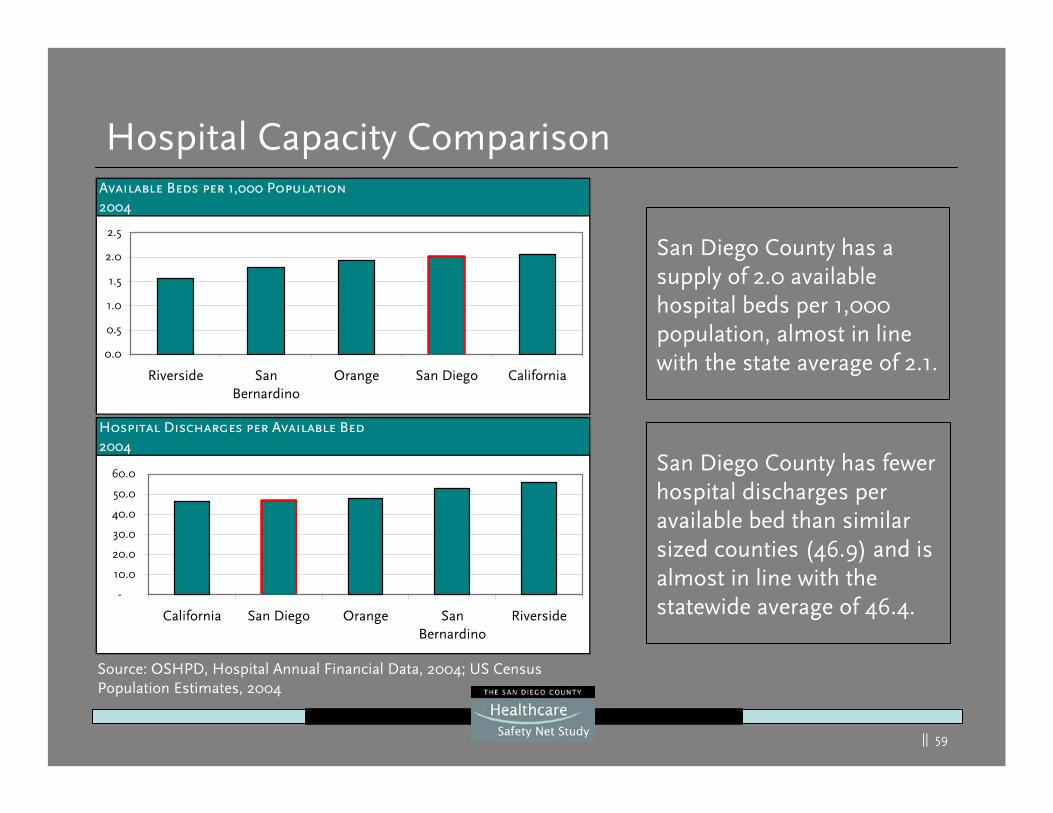
Hospital Capacity Comparison
San Diego County has a supply of 2.0 available hospital beds per 1,000 population, almost in line with the state average of 2.1.
Source: OSHPD, Hospital Annual Financial Data, 2004; US Census Population Estimates, 2004
San Diego County has fewer hospital discharges per available bed than similar sized counties (46.9) and is almost in line with the statewide average of 46.4.
Available Beds per 1,000 Population2004
0.0
0.5
1.0
1.5
2.0
2.5
Riverside SanBernardino
Orange San Diego California
Hospital Discharges per Available Bed2004
-
10.0
20.0
30.0
40.0
50.0
60.0
California San Diego Orange SanBernardino
Riverside
|| 60
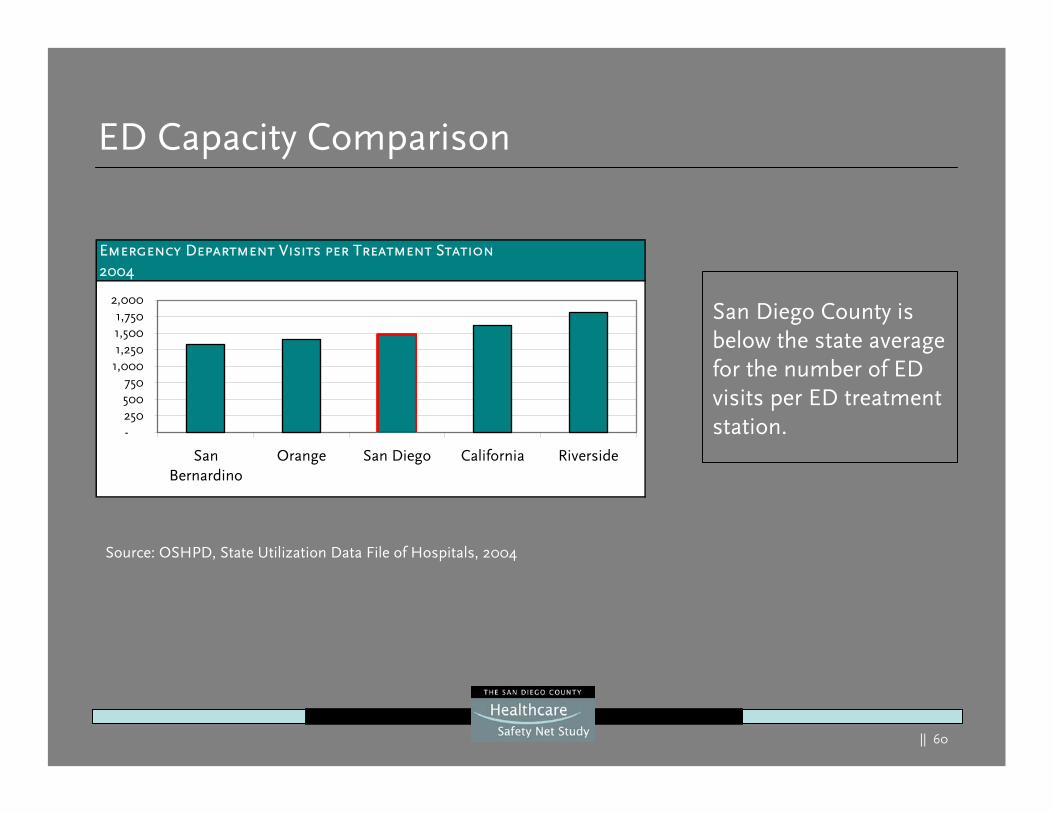
ED Capacity Comparison
San Diego County is below the state average for the number of ED visits per ED treatment station.
Source: OSHPD, State Utilization Data File of Hospitals, 2004
Emergency Department Visits per Treatment Station2004
-250500750
1,0001,2501,5001,750
2,000
SanBernardino
Orange San Diego California Riverside
|| 61
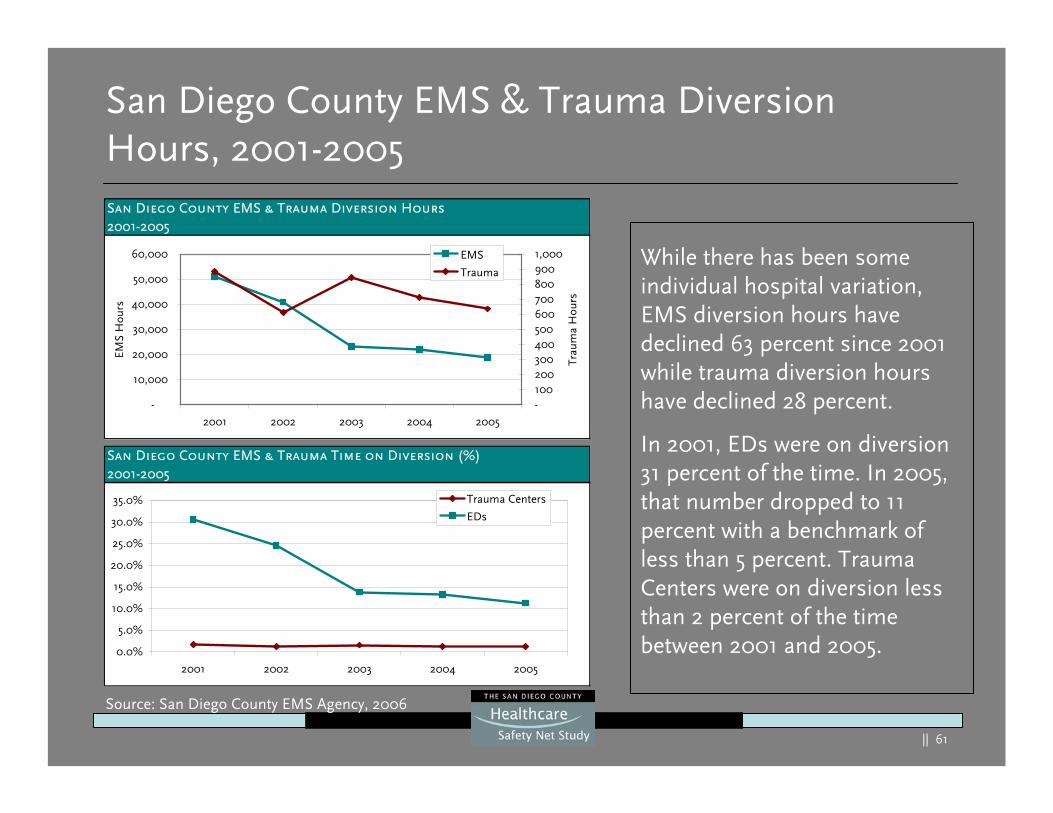
San Diego County EMS & Trauma Diversion Hours, 2001-2005
While there has been some individual hospital variation, EMS diversion hours have declined 63 percent since 2001 while trauma diversion hours have declined 28 percent.
In 2001, EDs were on diversion 31 percent of the time. In 2005, that number dropped to 11 percent with a benchmark of less than 5 percent. Trauma Centers were on diversion less than 2 percent of the time between 2001 and 2005.
Source: San Diego County EMS Agency, 2006
San Diego County EMS & Trauma Diversion Hours2001-2005
-
10,000
20,000
30,000
40,000
50,000
60,000
2001 2002 2003 2004 2005
EMS
Hou
rs
-1002003004005006007008009001,000
Trau
ma
Hou
rs
EMS
Trauma
San Diego County EMS & Trauma Time on Diversion (%)2001-2005
0.0%
5.0%
10.0%
15.0%
20.0%
25.0%
30.0%
35.0%
2001 2002 2003 2004 2005
Trauma Centers
EDs
|| 62
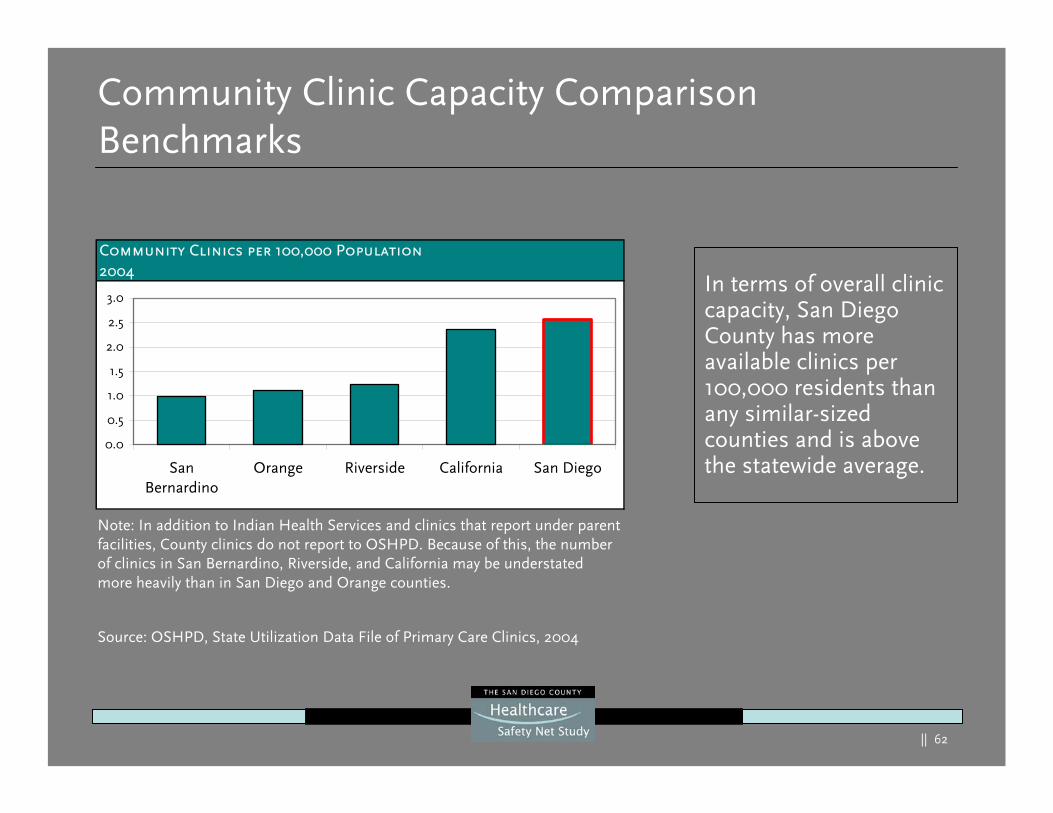
Community Clinic Capacity Comparison Benchmarks
In terms of overall clinic capacity, San Diego County has more available clinics per 100,000 residents than any similar-sized counties and is above the statewide average.
Source: OSHPD, State Utilization Data File of Primary Care Clinics, 2004
Note: In addition to Indian Health Services and clinics that report under parent facilities, County clinics do not report to OSHPD. Because of this, the number of clinics in San Bernardino, Riverside, and California may be understated more heavily than in San Diego and Orange counties.
Community Clinics per 100,000 Population2004
0.0
0.5
1.0
1.5
2.0
2.5
3.0
SanBernardino
Orange Riverside California San Diego
|| 63
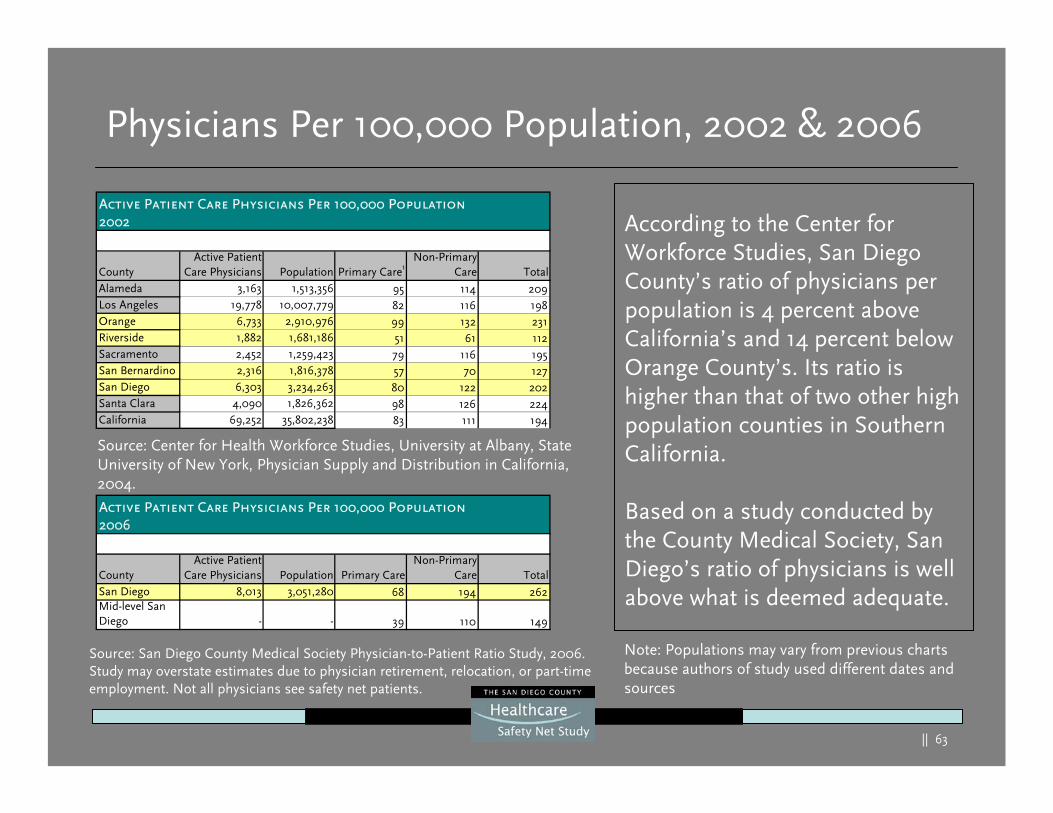
Physicians Per 100,000 Population, 2002 & 2006
According to the Center for Workforce Studies, San Diego County’s ratio of physicians per population is 4 percent above California’s and 14 percent below Orange County’s. Its ratio is higher than that of two other high population counties in Southern California.
Based on a study conducted by the County Medical Society, San Diego’s ratio of physicians is well above what is deemed adequate.
CountyActive Patient
Care Physicians Population Primary Care1Non-Primary
Care TotalAlameda 3,163 1,513,356 95 114 209Los Angeles 19,778 10,007,779 82 116 198Orange 6,733 2,910,976 99 132 231Riverside 1,882 1,681,186 51 61 112Sacramento 2,452 1,259,423 79 116 195San Bernardino 2,316 1,816,378 57 70 127San Diego 6,303 3,234,263 80 122 202Santa Clara 4,090 1,826,362 98 126 224California 69,252 35,802,238 83 111 194
Active Patient Care Physicians Per 100,000 Population2002
CountyActive Patient
Care Physicians Population Primary CareNon-Primary
Care TotalSan Diego 8,013 3,051,280 68 194 262Mid-level San Diego - - 39 110 149
Active Patient Care Physicians Per 100,000 Population2006
Source: Center for Health Workforce Studies, University at Albany, State University of New York, Physician Supply and Distribution in California, 2004.
Source: San Diego County Medical Society Physician-to-Patient Ratio Study, 2006. Study may overstate estimates due to physician retirement, relocation, or part-time employment. Not all physicians see safety net patients.
Note: Populations may vary from previous charts because authors of study used different dates and sources
|| 64
Physician Specialists Per 100,000 Population, 2002 & 2006
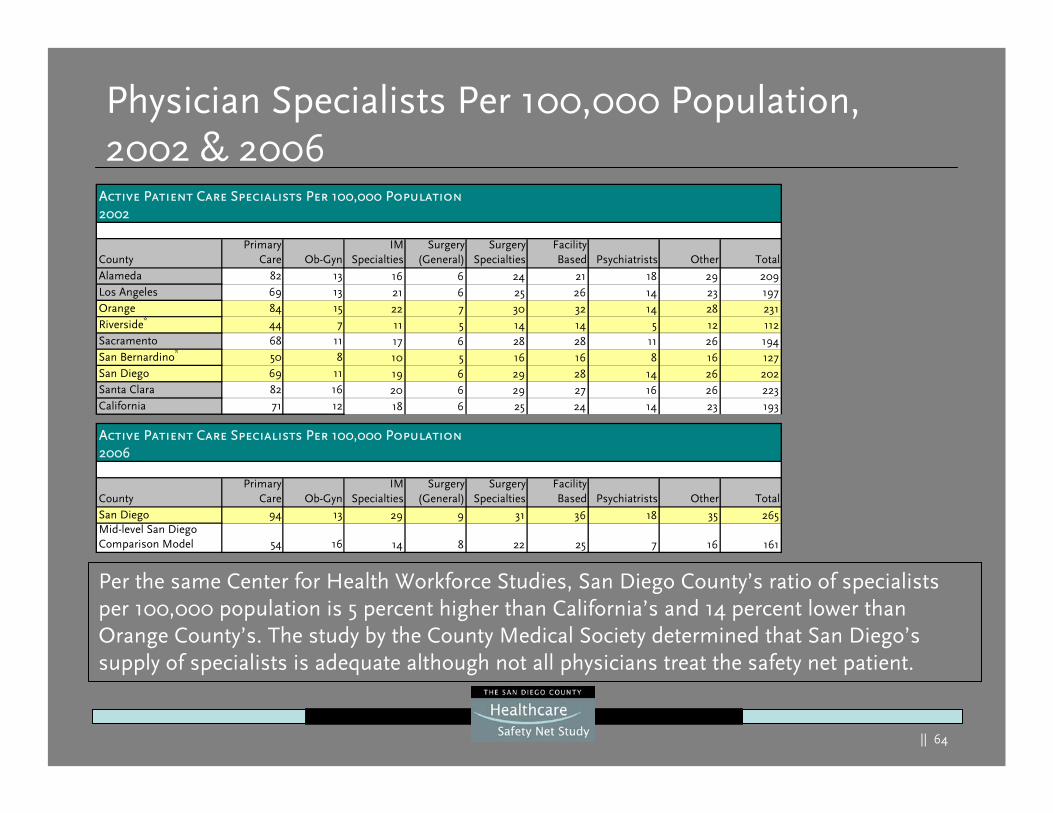
Per the same Center for Health Workforce Studies, San Diego County’s ratio of specialists per 100,000 population is 5 percent higher than California’s and 14 percent lower than Orange County’s. The study by the County Medical Society determined that San Diego’s supply of specialists is adequate although not all physicians treat the safety net patient.
CountyPrimary
Care Ob-GynIM
SpecialtiesSurgery
(General)Surgery
SpecialtiesFacilityBased Psychiatrists Other Total
San Diego 94 13 29 9 31 36 18 35 265Mid-level San Diego Comparison Model 54 16 14 8 22 25 7 16 161
Active Patient Care Specialists Per 100,000 Population2006
CountyPrimary
Care Ob-GynIM
SpecialtiesSurgery
(General)Surgery
SpecialtiesFacilityBased Psychiatrists Other Total
Alameda 82 13 16 6 24 21 18 29 209Los Angeles 69 13 21 6 25 26 14 23 197Orange 84 15 22 7 30 32 14 28 231Riverside* 44 7 11 5 14 14 5 12 112Sacramento 68 11 17 6 28 28 11 26 194San Bernardino* 50 8 10 5 16 16 8 16 127San Diego 69 11 19 6 29 28 14 26 202Santa Clara 82 16 20 6 29 27 16 26 223California 71 12 18 6 25 24 14 23 193
Active Patient Care Specialists Per 100,000 Population2002
|| 65
San Diego Physicians by Region, 2006
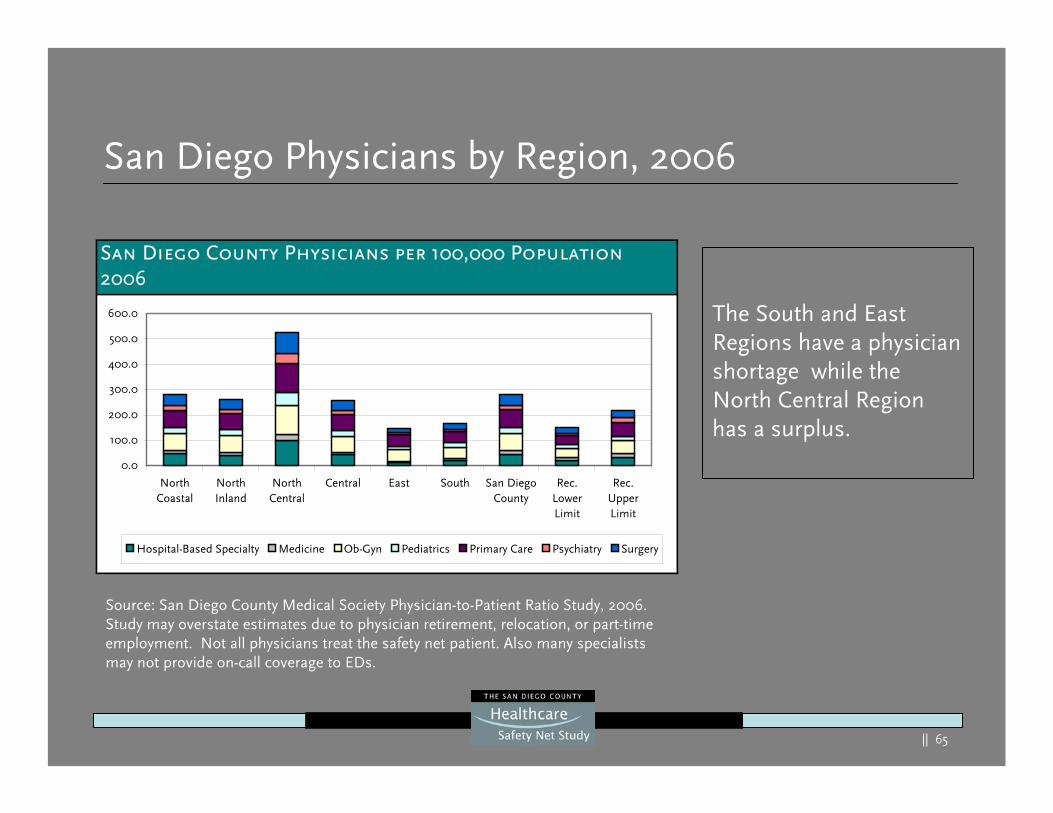
The South and East Regions have a physician shortage while the North Central Region has a surplus.
San Diego County Physicians per 100,000 Population2006
0.0
100.0
200.0
300.0
400.0
500.0
600.0
NorthCoastal
NorthInland
NorthCentral
Central East South San DiegoCounty
Rec.LowerLimit
Rec.UpperLimit
Hospital-Based Specialty Medicine Ob-Gyn Pediatrics Primary Care Psychiatry Surgery
Source: San Diego County Medical Society Physician-to-Patient Ratio Study, 2006. Study may overstate estimates due to physician retirement, relocation, or part-time employment. Not all physicians treat the safety net patient. Also many specialists may not provide on-call coverage to EDs.
|| 66
Registered Nurses Per 100,000 Population, 2004 & 2005
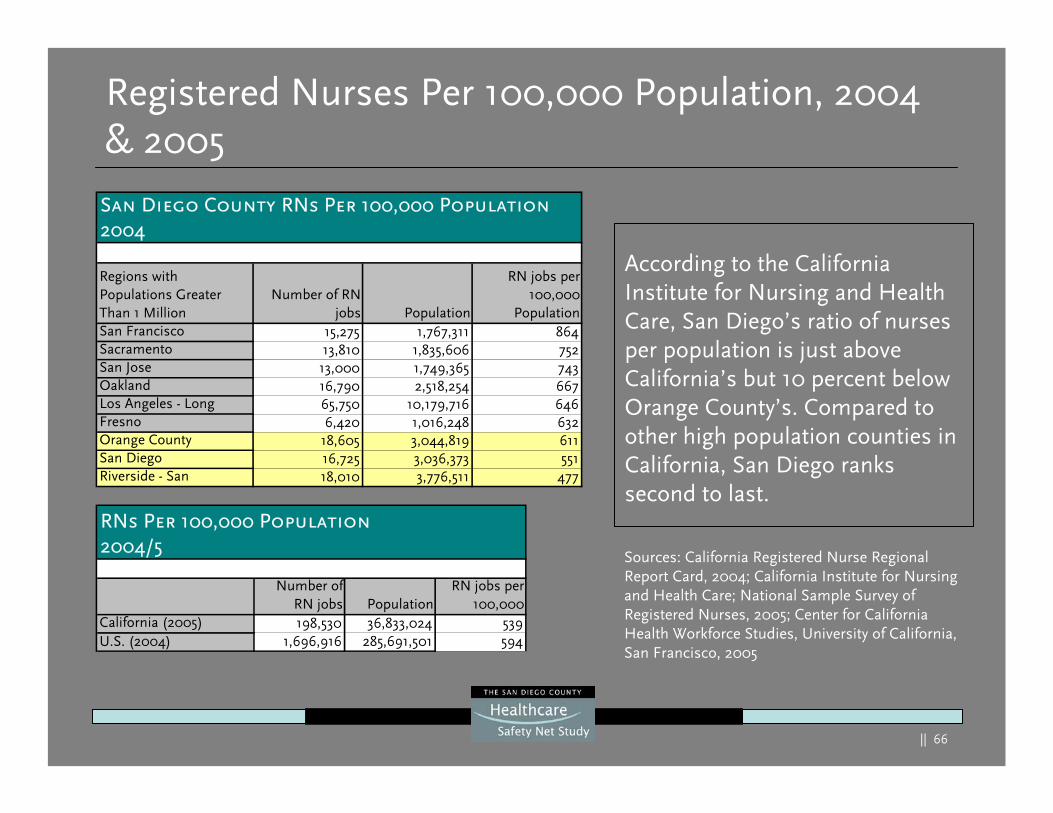
According to the California Institute for Nursing and Health Care, San Diego’s ratio of nurses per population is just above California’s but 10 percent below Orange County’s. Compared to other high population counties in California, San Diego ranks second to last.
Number ofRN jobs Population
RN jobs per100,000
California (2005) 198,530 36,833,024 539U.S. (2004) 1,696,916 285,691,501 594
RNs Per 100,000 Population2004/5
Regions with Populations Greater Than 1 Million
Number of RNjobs Population
RN jobs per100,000
PopulationSan Francisco 15,275 1,767,311 864Sacramento 13,810 1,835,606 752San Jose 13,000 1,749,365 743Oakland 16,790 2,518,254 667Los Angeles - Long 65,750 10,179,716 646Fresno 6,420 1,016,248 632Orange County 18,605 3,044,819 611San Diego 16,725 3,036,373 551Riverside - San 18,010 3,776,511 477
San Diego County RNs Per 100,000 Population2004
Sources: California Registered Nurse Regional Report Card, 2004; California Institute for Nursing and Health Care; National Sample Survey of Registered Nurses, 2005; Center for California Health Workforce Studies, University of California, San Francisco, 2005
|| 67
Unstaffed-Staffed/Available Hospital Beds, 2004
Total Unstaffed Beds2004
-
50
100
150
200
250
300
NorthCoastal
NorthInland
NorthCentral
Central East South
Percent of Available Beds that are Staffed2004
0.0%10.0%20.0%30.0%40.0%50.0%60.0%70.0%80.0%90.0%
100.0%
NorthCoastal
NorthInland
NorthCentral
Central East South
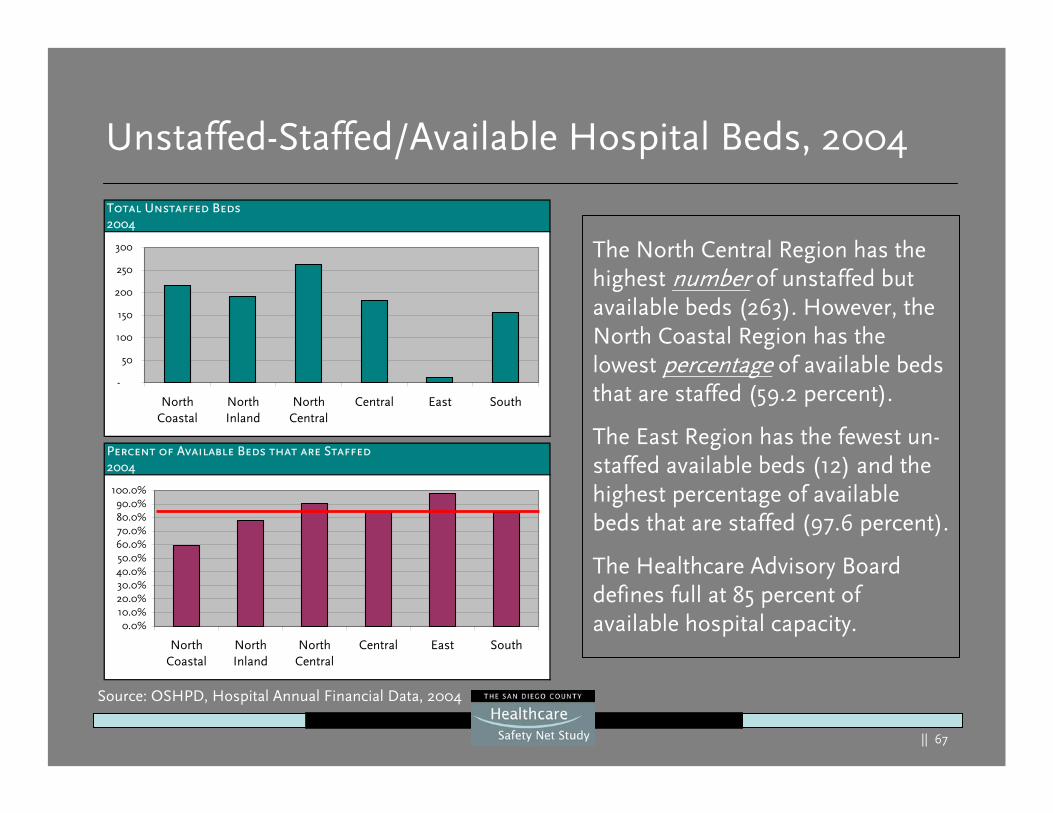
The North Central Region has the highest number of unstaffed but available beds (263). However, the North Coastal Region has the lowest percentage of available beds that are staffed (59.2 percent).
The East Region has the fewest un-staffed available beds (12) and the highest percentage of available beds that are staffed (97.6 percent).
The Healthcare Advisory Board defines full at 85 percent of available hospital capacity.
Source: OSHPD, Hospital Annual Financial Data, 2004
|| 68
Hospital Bed Occupancy Rates, 2005
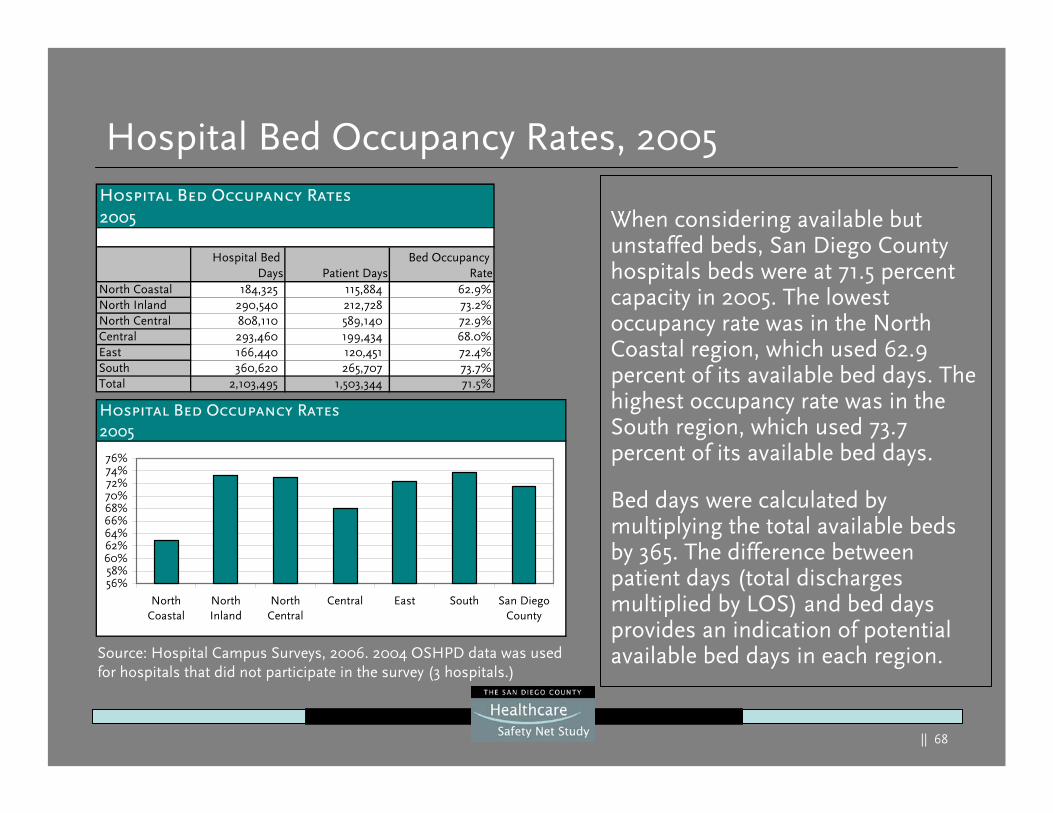
When considering available but unstaffed beds, San Diego County hospitals beds were at 71.5 percent capacity in 2005. The lowest occupancy rate was in the North Coastal region, which used 62.9 percent of its available bed days. The highest occupancy rate was in the South region, which used 73.7 percent of its available bed days.
Bed days were calculated by multiplying the total available beds by 365. The difference between patient days (total discharges multiplied by LOS) and bed days provides an indication of potential available bed days in each region.Source: Hospital Campus Surveys, 2006. 2004 OSHPD data was used
for hospitals that did not participate in the survey (3 hospitals.)
Hospital Bed Occupancy Rates2005
Hospital Bed Days Patient Days
Bed Occupancy Rate
North Coastal 184,325 115,884 62.9%North Inland 290,540 212,728 73.2%North Central 808,110 589,140 72.9%Central 293,460 199,434 68.0%East 166,440 120,451 72.4%South 360,620 265,707 73.7%Total 2,103,495 1,503,344 71.5%
Hospital Bed Occupancy Rates2005
56%58%60%62%64%66%68%70%72%74%76%
NorthCoastal
NorthInland
NorthCentral
Central East South San DiegoCounty
|| 69
Unstaffed Available Beds by Hospital, 2004
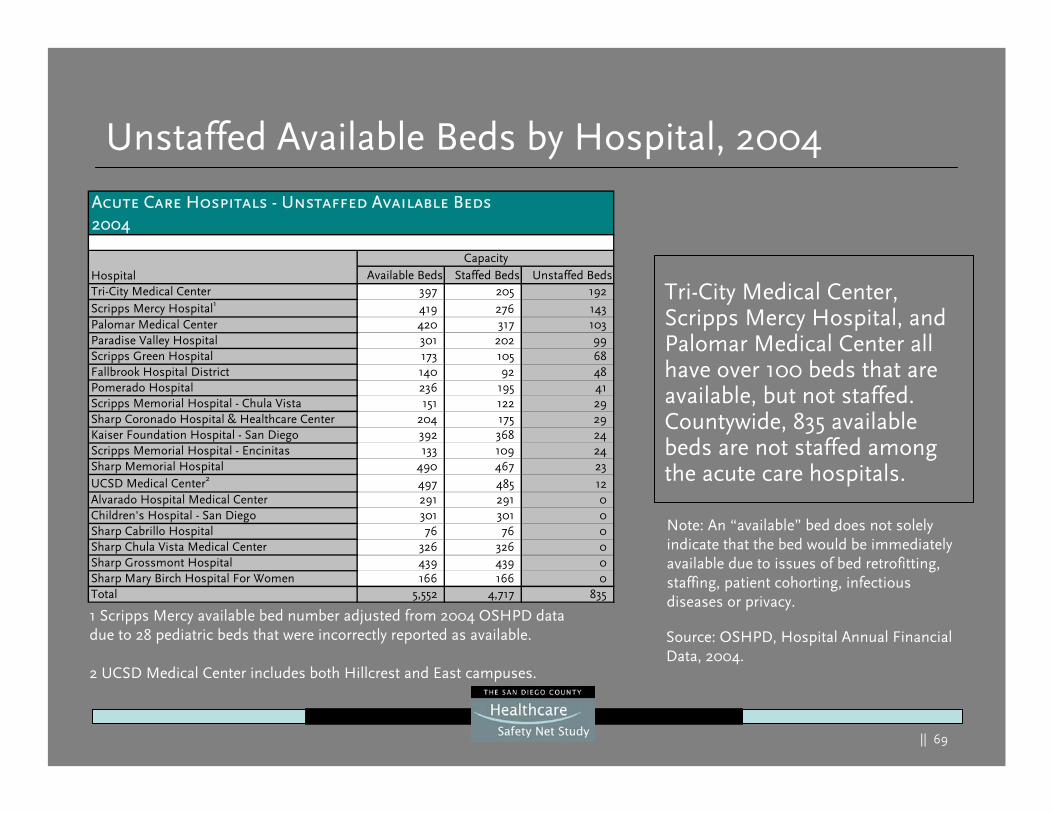
Tri-City Medical Center, Scripps Mercy Hospital, and Palomar Medical Center all have over 100 beds that are available, but not staffed. Countywide, 835 available beds are not staffed among the acute care hospitals.
1 Scripps Mercy available bed number adjusted from 2004 OSHPD data due to 28 pediatric beds that were incorrectly reported as available.
2 UCSD Medical Center includes both Hillcrest and East campuses.
Source: OSHPD, Hospital Annual Financial Data, 2004.
Note: An “available” bed does not solely indicate that the bed would be immediately available due to issues of bed retrofitting, staffing, patient cohorting, infectious diseases or privacy.
Acute Care Hospitals - Unstaffed Available Beds2004
Hospital Available Beds Staffed Beds Unstaffed BedsTri-City Medical Center 397 205 192Scripps Mercy Hospital1 419 276 143Palomar Medical Center 420 317 103Paradise Valley Hospital 301 202 99Scripps Green Hospital 173 105 68Fallbrook Hospital District 140 92 48Pomerado Hospital 236 195 41Scripps Memorial Hospital - Chula Vista 151 122 29Sharp Coronado Hospital & Healthcare Center 204 175 29Kaiser Foundation Hospital - San Diego 392 368 24Scripps Memorial Hospital - Encinitas 133 109 24Sharp Memorial Hospital 490 467 23UCSD Medical Center2 497 485 12Alvarado Hospital Medical Center 291 291 0Children's Hospital - San Diego 301 301 0Sharp Cabrillo Hospital 76 76 0Sharp Chula Vista Medical Center 326 326 0Sharp Grossmont Hospital 439 439 0Sharp Mary Birch Hospital For Women 166 166 0Total 5,552 4,717 835
Capacity
|| 70
Changes in Available Hospital Beds, 2000-2004
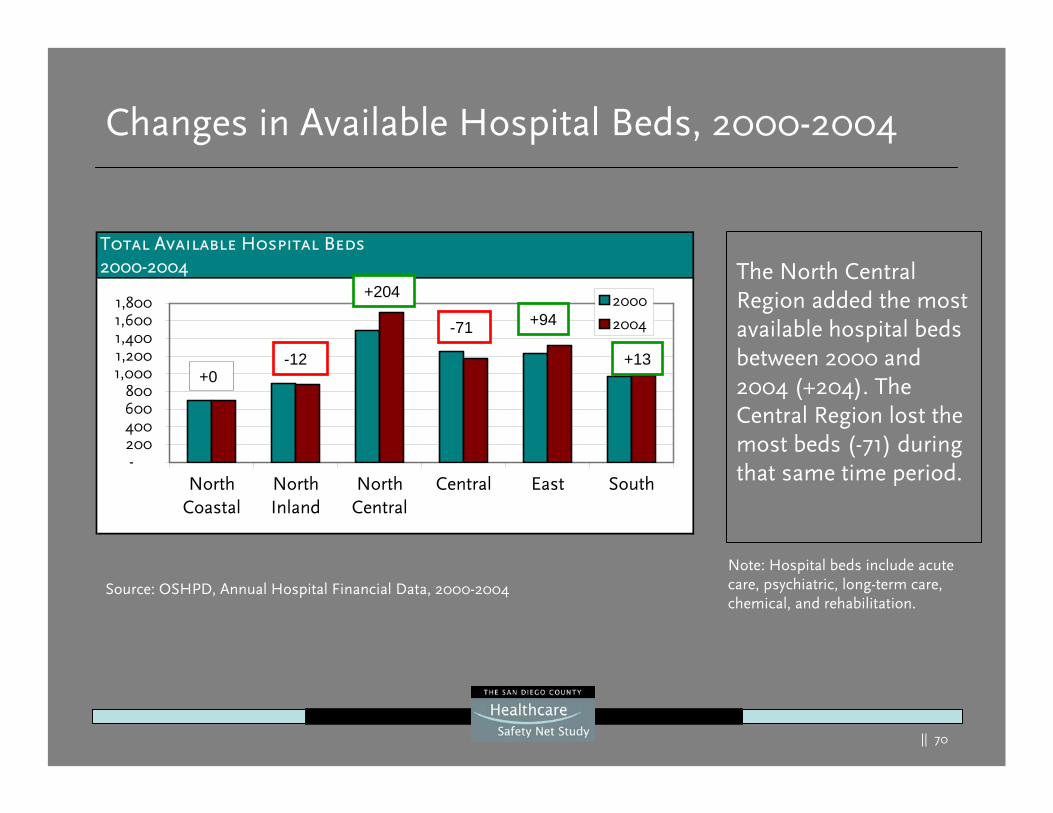
Note: Hospital beds include acute care, psychiatric, long-term care, chemical, and rehabilitation.
Source: OSHPD, Annual Hospital Financial Data, 2000-2004
The North Central Region added the most available hospital beds between 2000 and 2004 (+204). The Central Region lost the most beds (-71) during that same time period.
Total Available Hospital Beds2000-2004
-200400600800
1,0001,2001,4001,6001,800
NorthCoastal
NorthInland
NorthCentral
Central East South
2000
2004
+0-12
+204
-71 +94
+13

|| 71
Demand Forecasts
|| 72
Demand Projection Methodology
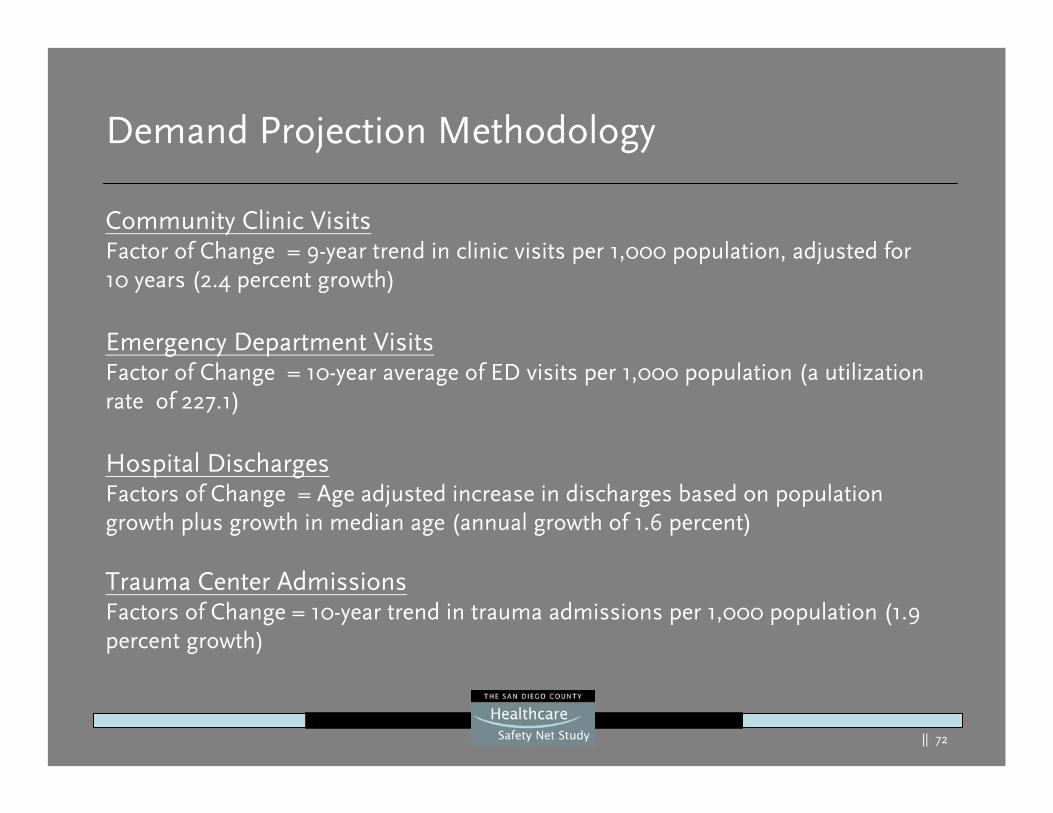
Community Clinic VisitsFactor of Change = 9-year trend in clinic visits per 1,000 population, adjusted for 10 years (2.4 percent growth)
Emergency Department VisitsFactor of Change = 10-year average of ED visits per 1,000 population (a utilization rate of 227.1)
Hospital DischargesFactors of Change = Age adjusted increase in discharges based on population growth plus growth in median age (annual growth of 1.6 percent)
Trauma Center AdmissionsFactors of Change = 10-year trend in trauma admissions per 1,000 population (1.9 percent growth)
|| 73
Demand Forecast Summary
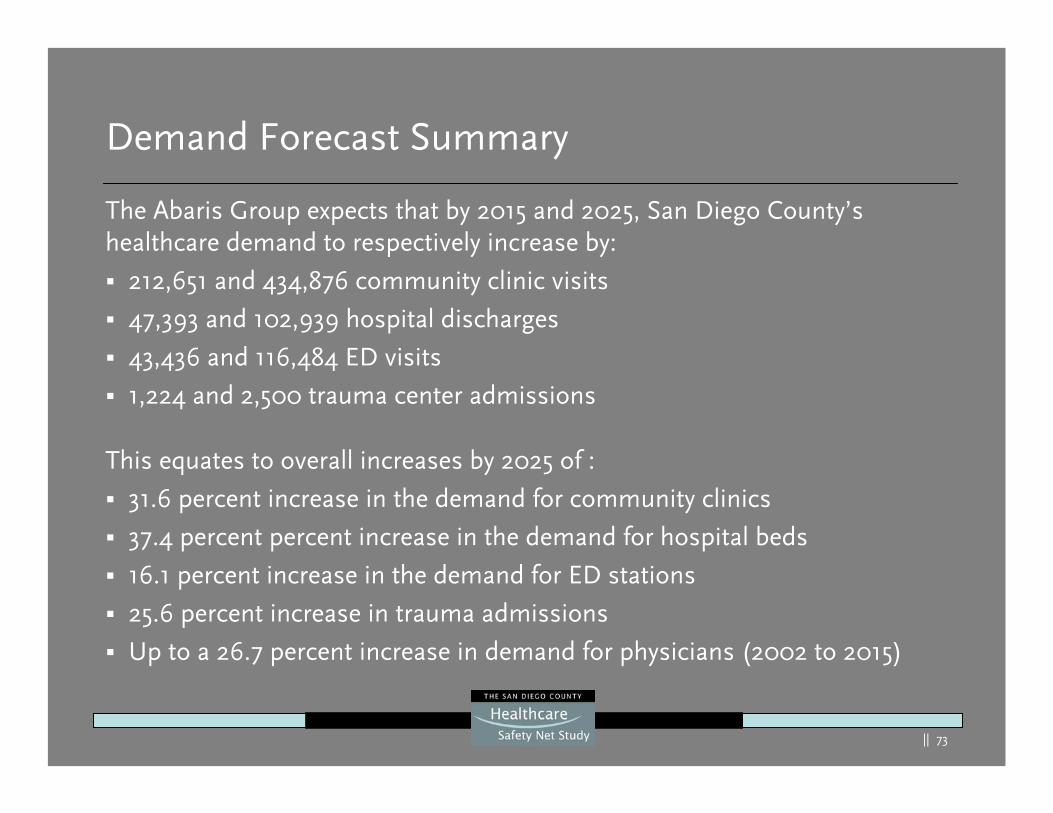
The Abaris Group expects that by 2015 and 2025, San Diego County’s healthcare demand to respectively increase by:
212,651 and 434,876 community clinic visits
47,393 and 102,939 hospital discharges
43,436 and 116,484 ED visits
1,224 and 2,500 trauma center admissions
This equates to overall increases by 2025 of :
31.6 percent increase in the demand for community clinics
37.4 percent percent increase in the demand for hospital beds
16.1 percent increase in the demand for ED stations
25.6 percent increase in trauma admissions
Up to a 26.7 percent increase in demand for physicians (2002 to 2015)
|| 74
Community Clinic Visits Projections2005-2025
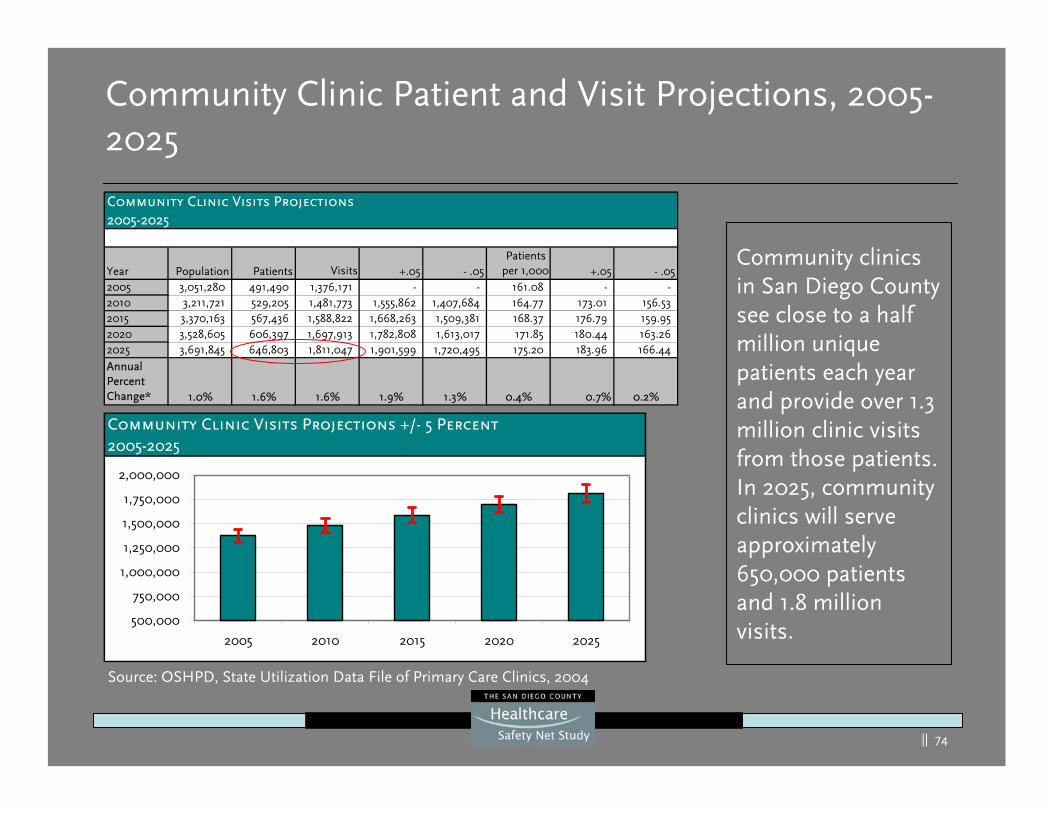
Year Population Patients Visits +.05 - .05Patients
per 1,000 +.05 - .052005 3,051,280 491,490 1,376,171 - - 161.08 - -2010 3,211,721 529,205 1,481,773 1,555,862 1,407,684 164.77 173.01 156.53 2015 3,370,163 567,436 1,588,822 1,668,263 1,509,381 168.37 176.79 159.95 2020 3,528,605 606,397 1,697,913 1,782,808 1,613,017 171.85 180.44 163.26 2025 3,691,845 646,803 1,811,047 1,901,599 1,720,495 175.20 183.96 166.44
Annual Percent Change* 1.0% 1.6% 1.6% 1.9% 1.3% 0.4% 0.7% 0.2%
Community Clinic Patient and Visit Projections, 2005-2025
Community Clinic Visits Projections +/- 5 Percent2005-2025
500,000
750,000
1,000,000
1,250,000
1,500,000
1,750,000
2,000,000
2005 2010 2015 2020 2025
Source: OSHPD, State Utilization Data File of Primary Care Clinics, 2004
Community clinics in San Diego County see close to a half million unique patients each year and provide over 1.3 million clinic visits from those patients. In 2025, community clinics will serve approximately 650,000 patients and 1.8 million visits.
|| 75
Hospital Discharge Projections2005-2025
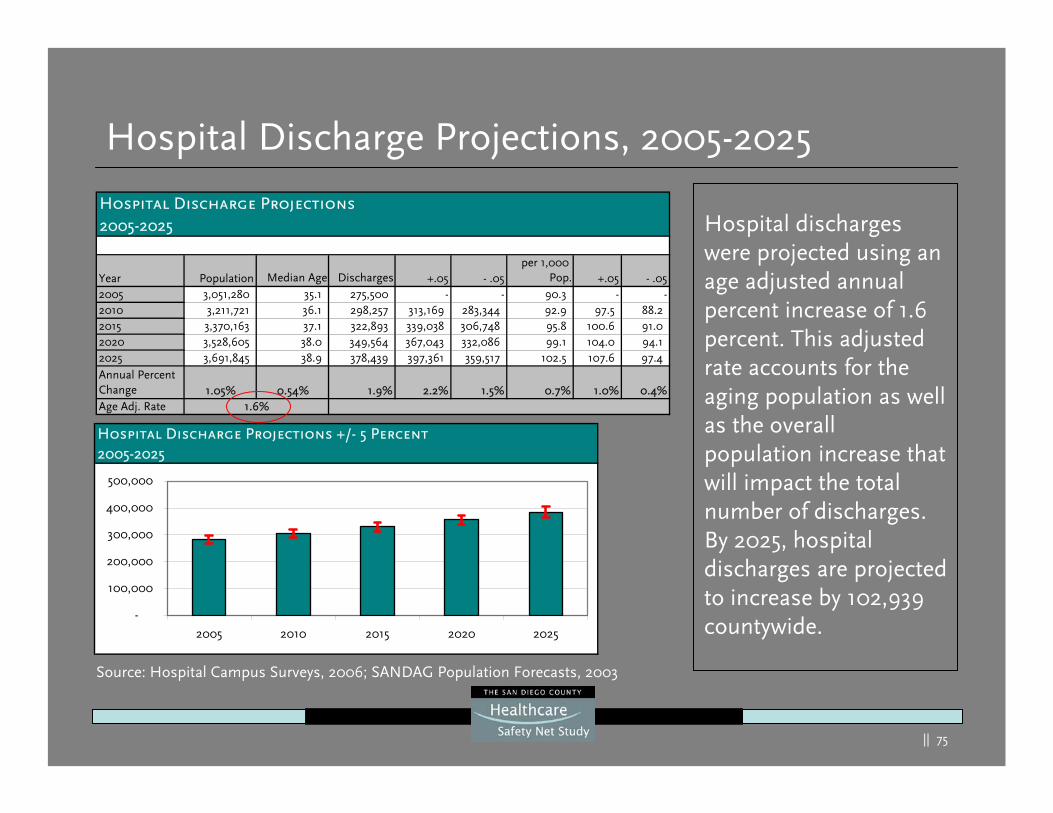
Year Population Median Age Discharges +.05 - .05per 1,000
Pop. +.05 - .052005 3,051,280 35.1 275,500 - - 90.3 - -2010 3,211,721 36.1 298,257 313,169 283,344 92.9 97.5 88.2 2015 3,370,163 37.1 322,893 339,038 306,748 95.8 100.6 91.0 2020 3,528,605 38.0 349,564 367,043 332,086 99.1 104.0 94.1 2025 3,691,845 38.9 378,439 397,361 359,517 102.5 107.6 97.4
Annual Percent Change 1.05% 0.54% 1.9% 2.2% 1.5% 0.7% 1.0% 0.4%Age Adj. Rate 1.6%
Hospital Discharge Projections, 2005-2025
Hospital discharges were projected using an age adjusted annual percent increase of 1.6 percent. This adjusted rate accounts for the aging population as well as the overall population increase that will impact the total number of discharges. By 2025, hospital discharges are projected to increase by 102,939 countywide.
Hospital Discharge Projections +/- 5 Percent2005-2025
-
100,000
200,000
300,000
400,000
500,000
2005 2010 2015 2020 2025
Source: Hospital Campus Surveys, 2006; SANDAG Population Forecasts, 2003
|| 76
Hospital Discharge Projections by Region, 2005-2025
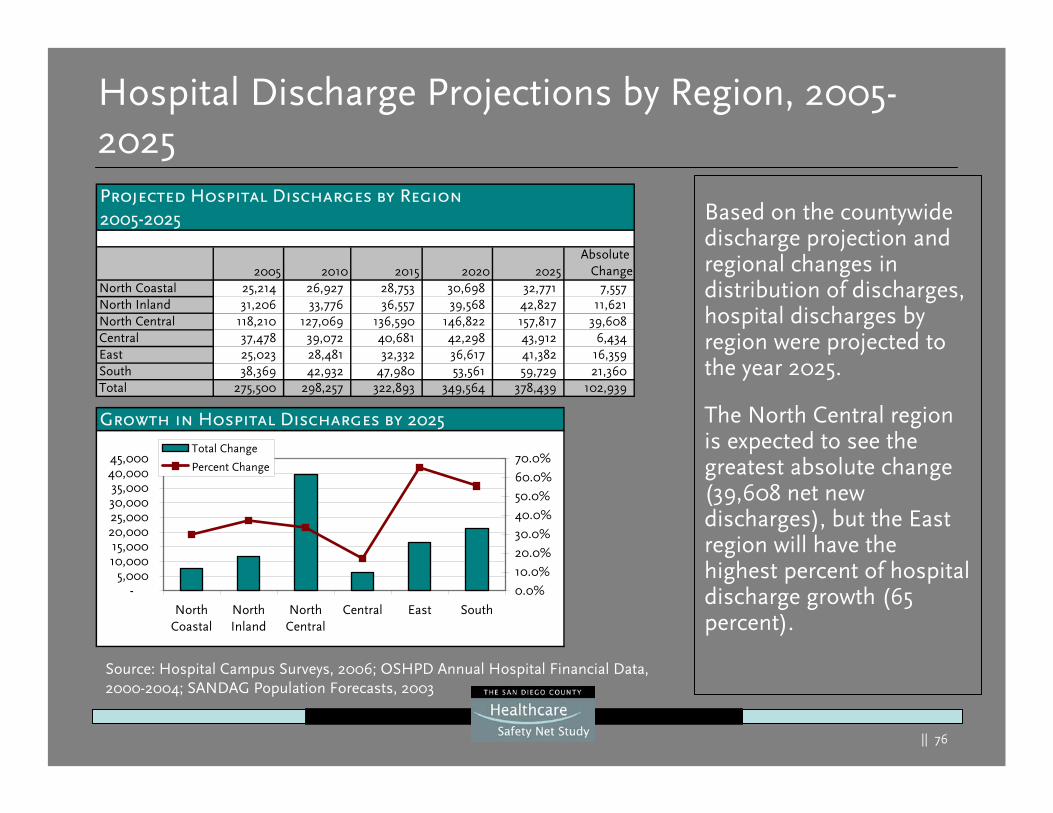
Based on the countywide discharge projection and regional changes in distribution of discharges, hospital discharges by region were projected to the year 2025.
The North Central region is expected to see the greatest absolute change (39,608 net new discharges), but the East region will have the highest percent of hospital discharge growth (65 percent).
Source: Hospital Campus Surveys, 2006; OSHPD Annual Hospital Financial Data, 2000-2004; SANDAG Population Forecasts, 2003
Projected Hospital Discharges by Region2005-2025
2005 2010 2015 2020 2025Absolute
ChangeNorth Coastal 25,214 26,927 28,753 30,698 32,771 7,557 North Inland 31,206 33,776 36,557 39,568 42,827 11,621 North Central 118,210 127,069 136,590 146,822 157,817 39,608 Central 37,478 39,072 40,681 42,298 43,912 6,434 East 25,023 28,481 32,332 36,617 41,382 16,359 South 38,369 42,932 47,980 53,561 59,729 21,360 Total 275,500 298,257 322,893 349,564 378,439 102,939
Growth in Hospital Discharges by 2025
-5,000
10,00015,000
20,00025,00030,00035,000
40,00045,000
NorthCoastal
NorthInland
NorthCentral
Central East South
0.0%
10.0%
20.0%
30.0%
40.0%
50.0%
60.0%
70.0%Total Change
Percent Change
|| 77
Emergency Department Visit Projections2005-2025
Year Population Visits +.05 - .05 1,000 Pop. +.05 - .05
2005 3,051,280 721,859 - - 236.6 - -
2010 3,211,721 729,316 765,782 692,850 227.1 238.4 215.7
2015 3,370,163 765,295 803,560 727,030 227.1 238.4 215.7
2020 3,528,605 801,274 841,338 761,210 227.1 238.4 215.7
2025 3,691,845 838,343 880,260 796,426 227.1 238.4 215.7 Annual Percent Change 1.0% 0.8% 1.1% 0.5% -0.2% 0.0% -0.4%
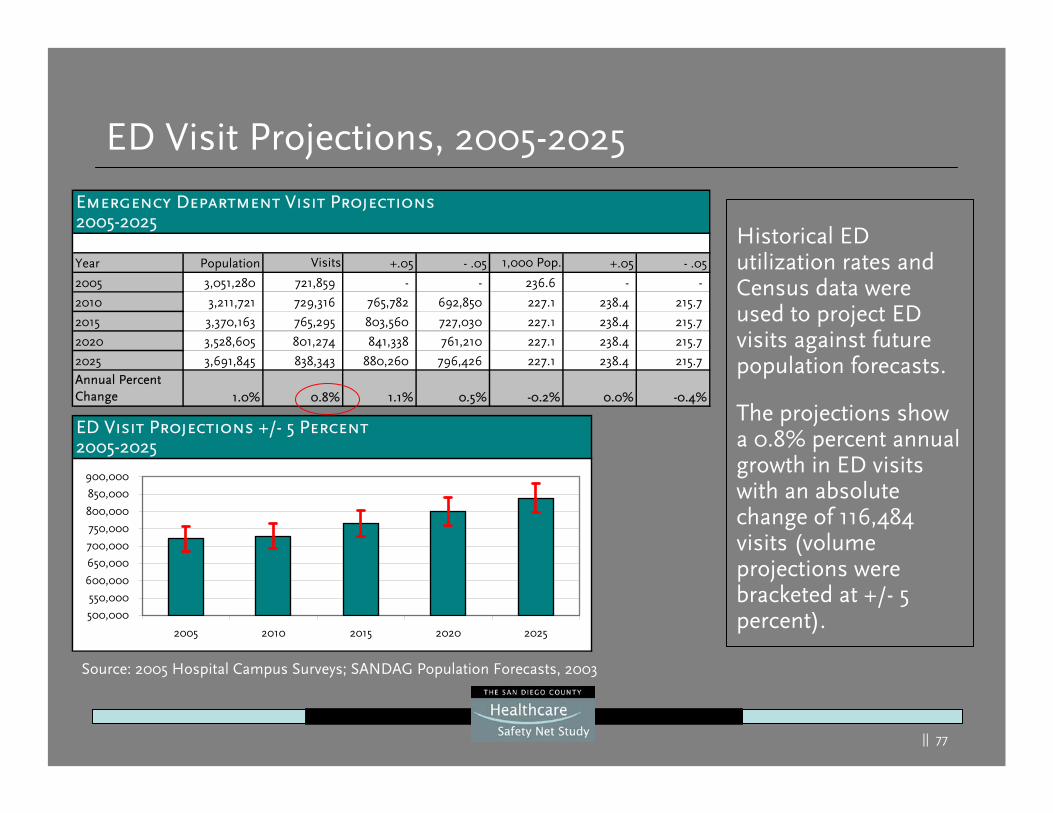
ED Visit Projections, 2005-2025
Historical ED utilization rates and Census data were used to project ED visits against future population forecasts.
The projections show a 0.8% percent annual growth in ED visits with an absolute change of 116,484 visits (volume projections were bracketed at +/- 5 percent).
Source: 2005 Hospital Campus Surveys; SANDAG Population Forecasts, 2003
ED Visit Projections +/- 5 Percent2005-2025
500,000
550,000
600,000
650,000
700,000
750,000
800,000
850,000
900,000
2005 2010 2015 2020 2025
|| 78
ED Visit Projections by Region, 2005-2025
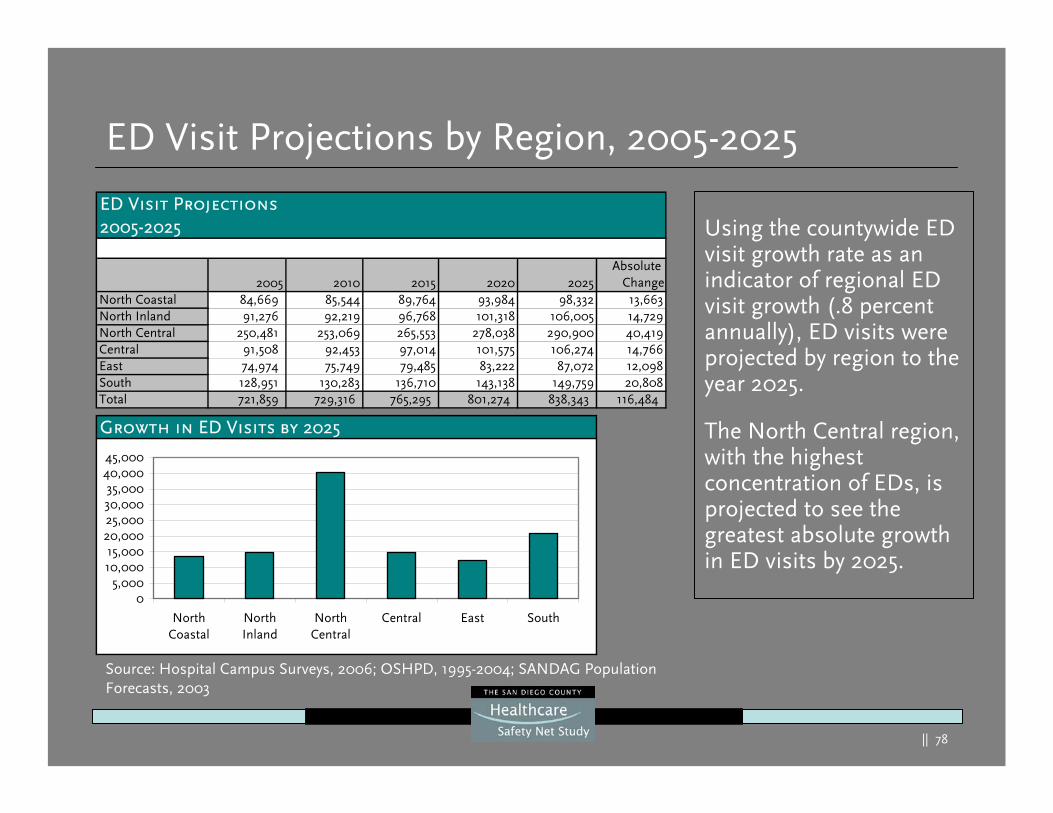
Using the countywide ED visit growth rate as an indicator of regional ED visit growth (.8 percent annually), ED visits were projected by region to the year 2025.
The North Central region, with the highest concentration of EDs, is projected to see the greatest absolute growth in ED visits by 2025.
Source: Hospital Campus Surveys, 2006; OSHPD, 1995-2004; SANDAG Population Forecasts, 2003
ED Visit Projections2005-2025
2005 2010 2015 2020 2025Absolute
ChangeNorth Coastal 84,669 85,544 89,764 93,984 98,332 13,663North Inland 91,276 92,219 96,768 101,318 106,005 14,729North Central 250,481 253,069 265,553 278,038 290,900 40,419Central 91,508 92,453 97,014 101,575 106,274 14,766East 74,974 75,749 79,485 83,222 87,072 12,098South 128,951 130,283 136,710 143,138 149,759 20,808Total 721,859 729,316 765,295 801,274 838,343 116,484
Growth in ED Visits by 2025
05,000
10,00015,000
20,00025,00030,00035,000
40,00045,000
NorthCoastal
NorthInland
NorthCentral
Central East South
|| 79
Trauma Admission Projections2005-2025
Year Population Admissions +.05 - .05Admissions
per 1,000 Pop. +.05 - .052005 3,051,280 9,776 - - 3.20 - -2010 3,211,721 10,386 10,906 9,867 3.23 3.40 3.07 2015 3,370,163 11,000 11,550 10,450 3.26 3.43 3.10 2020 3,528,605 11,625 12,206 11,044 3.29 3.46 3.13 2025 3,691,845 12,276 12,890 11,662 3.33 3.49 3.16
Annual Percent Change 1.0% 1.3% 1.6% 1.0% 0.2% 0.4% -0.1%
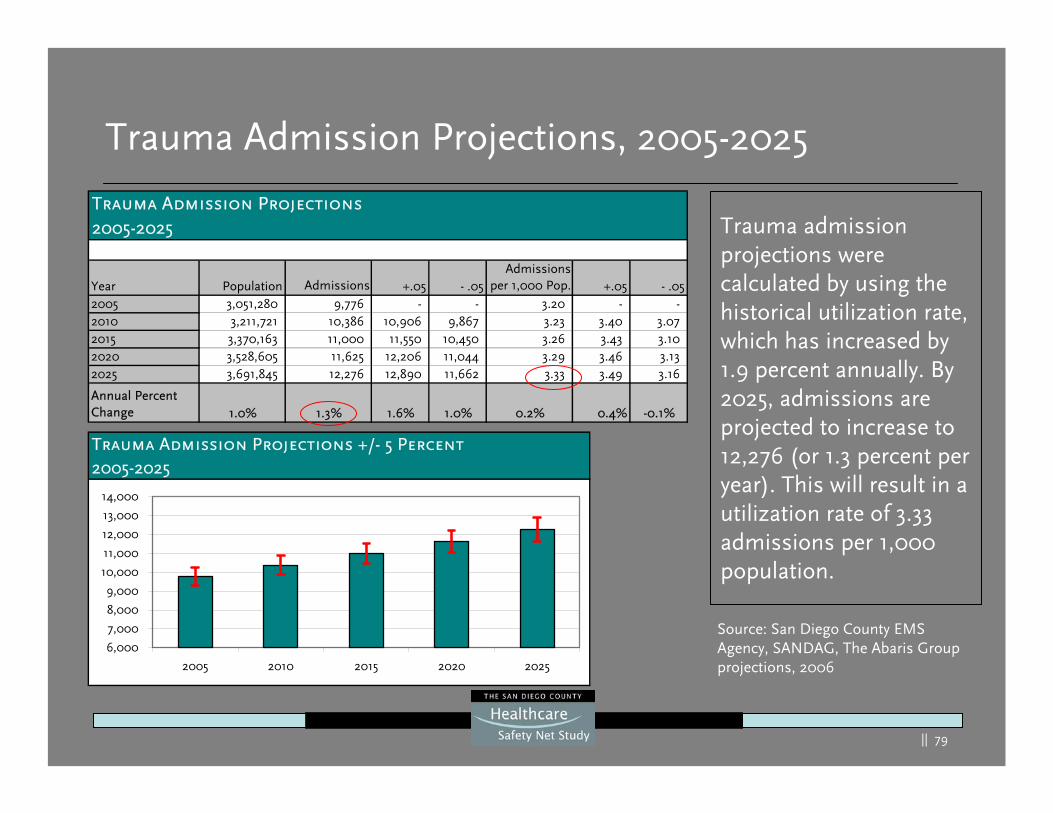
Trauma Admission Projections, 2005-2025
Trauma admission projections were calculated by using the historical utilization rate, which has increased by 1.9 percent annually. By 2025, admissions are projected to increase to 12,276 (or 1.3 percent per year). This will result in a utilization rate of 3.33 admissions per 1,000 population.
Trauma Admission Projections +/- 5 Percent2005-2025
6,000
7,000
8,000
9,000
10,000
11,000
12,000
13,000
14,000
2005 2010 2015 2020 2025
Source: San Diego County EMS Agency, SANDAG, The Abaris Group projections, 2006

|| 80
Capacity Forecasts
|| 81
Capacity Projection Methodology
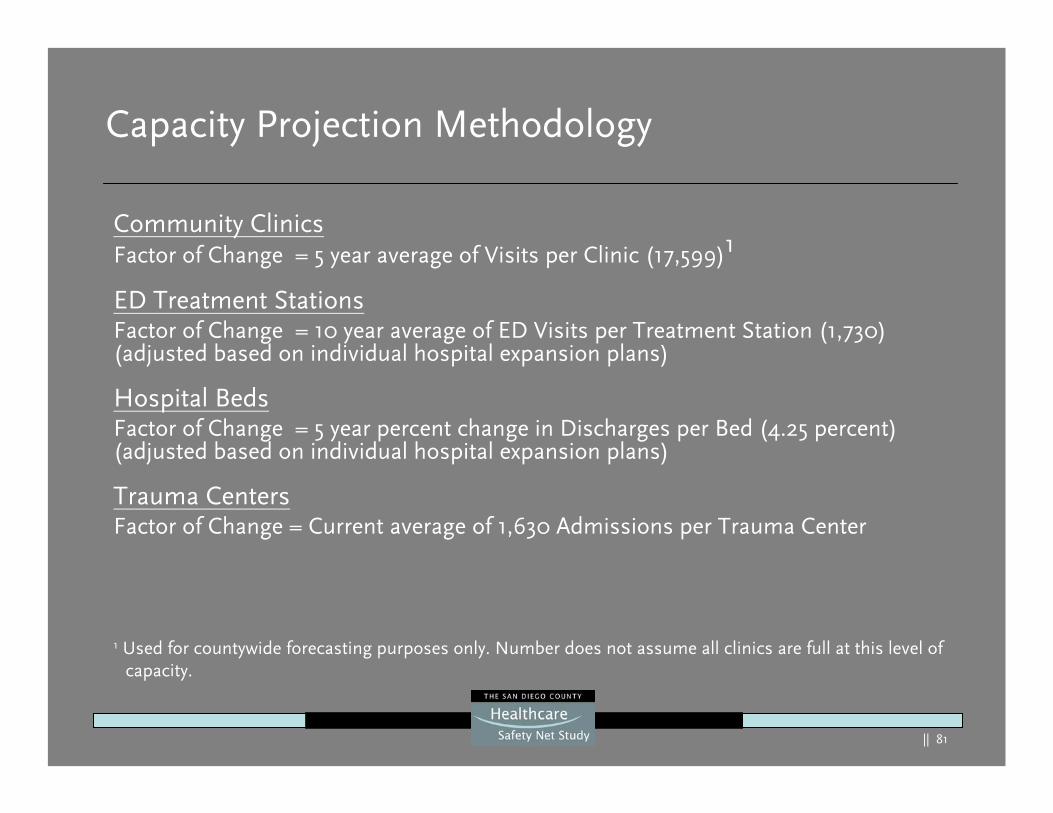
Community ClinicsFactor of Change = 5 year average of Visits per Clinic (17,599)1
ED Treatment StationsFactor of Change = 10 year average of ED Visits per Treatment Station (1,730) (adjusted based on individual hospital expansion plans)
Hospital BedsFactor of Change = 5 year percent change in Discharges per Bed (4.25 percent) (adjusted based on individual hospital expansion plans)
Trauma CentersFactor of Change = Current average of 1,630 Admissions per Trauma Center
1 Used for countywide forecasting purposes only. Number does not assume all clinics are full at this level of capacity.
|| 82
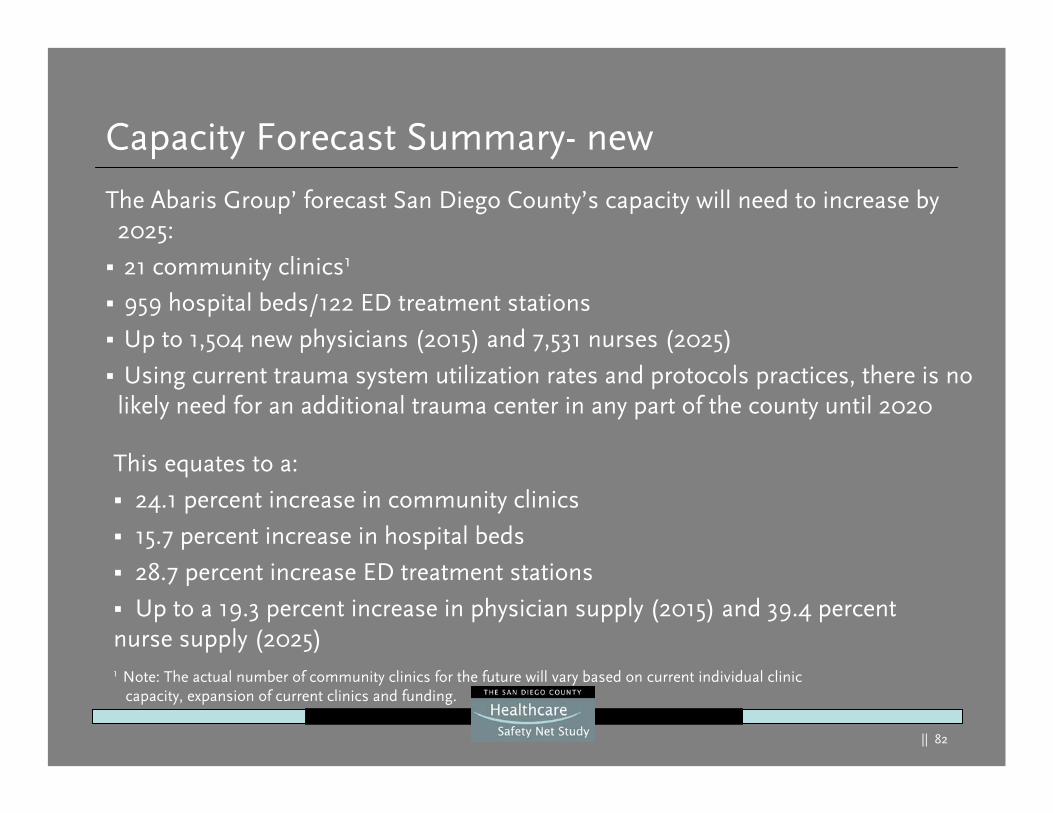
Capacity Forecast Summary- new
The Abaris Group’ forecast San Diego County’s capacity will need to increase by 2025:
21 community clinics1
959 hospital beds/122 ED treatment stations
Up to 1,504 new physicians (2015) and 7,531 nurses (2025)
Using current trauma system utilization rates and protocols practices, there is no likely need for an additional trauma center in any part of the county until 2020
This equates to a:
24.1 percent increase in community clinics
15.7 percent increase in hospital beds
28.7 percent increase ED treatment stations
Up to a 19.3 percent increase in physician supply (2015) and 39.4 percent nurse supply (2025)1 Note: The actual number of community clinics for the future will vary based on current individual clinic
capacity, expansion of current clinics and funding.
|| 83
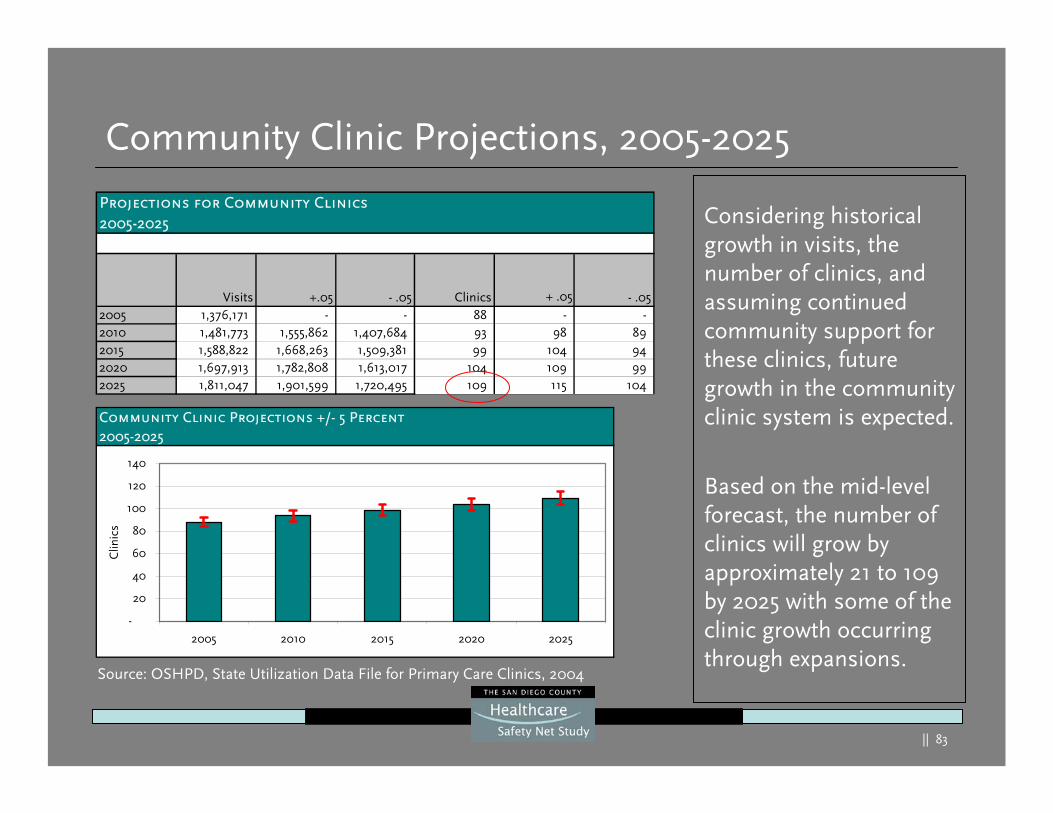
Projections for Community Clinics2005-2025
Visits +.05 - .05 Clinics + .05 - .052005 1,376,171 - - 88 - -2010 1,481,773 1,555,862 1,407,684 93 98 89 2015 1,588,822 1,668,263 1,509,381 99 104 94 2020 1,697,913 1,782,808 1,613,017 104 109 99 2025 1,811,047 1,901,599 1,720,495 109 115 104
Community Clinic Projections, 2005-2025
Considering historical growth in visits, the number of clinics, and assuming continued community support for these clinics, future growth in the community clinic system is expected.
Based on the mid-level forecast, the number of clinics will grow by approximately 21 to 109 by 2025 with some of the clinic growth occurring through expansions.
Community Clinic Projections +/- 5 Percent2005-2025
-
20
40
60
80
100
120
140
2005 2010 2015 2020 2025
Clin
ics
Source: OSHPD, State Utilization Data File for Primary Care Clinics, 2004
|| 84
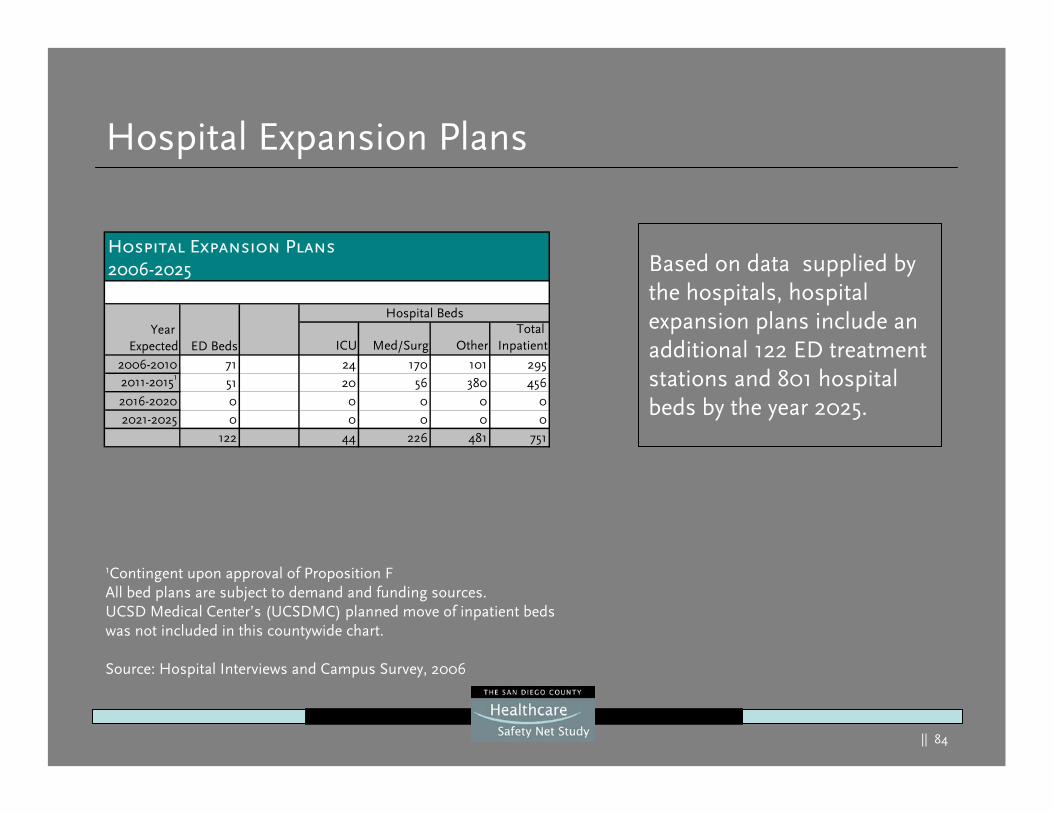
Hospital Expansion Plans
Based on data supplied by the hospitals, hospital expansion plans include an additional 122 ED treatment stations and 801 hospital beds by the year 2025.
Based on data supplied by the hospitals, hospital expansion plans include an additional 122 ED treatment stations and 801 hospital beds by the year 2025.
1Contingent upon approval of Proposition FAll bed plans are subject to demand and funding sources. UCSD Medical Center’s (UCSDMC) planned move of inpatient beds was not included in this countywide chart.
Source: Hospital Interviews and Campus Survey, 2006
ICU Med/Surg OtherTotal
Inpatient
2006-2010 71 24 170 101 2952011-20151 51 20 56 380 4562016-2020 0 0 0 0 02021-2025 0 0 0 0 0
122 44 226 481 751
Hospital Expansion Plans2006-2025
Hospital Beds
ED BedsYear
Expected
|| 85
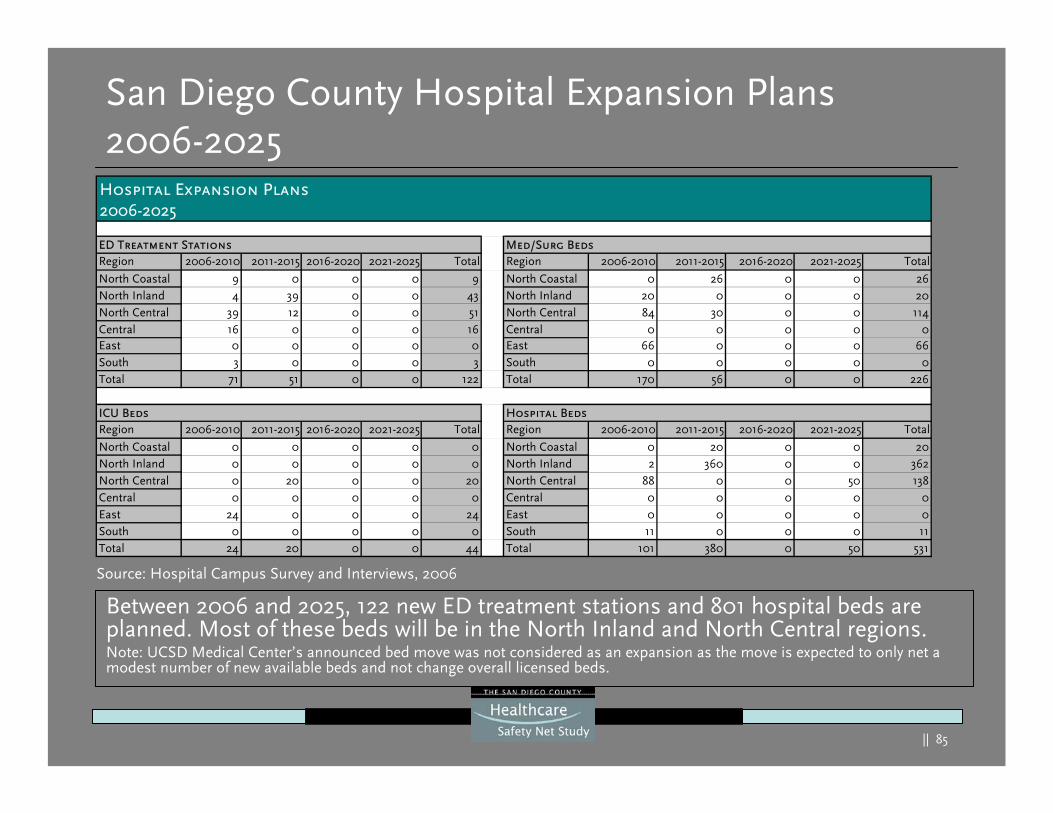
San Diego County Hospital Expansion Plans2006-2025
Between 2006 and 2025, 122 new ED treatment stations and 801 hospital beds are planned. Most of these beds will be in the North Inland and North Central regions.Note: UCSD Medical Center’s announced bed move was not considered as an expansion as the move is expected to only net a modest number of new available beds and not change overall licensed beds.
Between 2006 and 2025, 122 new ED treatment stations and 801 hospital beds are planned. Most of these beds will be in the North Inland and North Central regions.Note: UCSD Medical Center’s announced bed move was not considered as an expansion as the move is expected to only net a modest number of new available beds and not change overall licensed beds.
Region 2006-2010 2011-2015 2016-2020 2021-2025 Total Region 2006-2010 2011-2015 2016-2020 2021-2025 Total
North Coastal 9 0 0 0 9 North Coastal 0 26 0 0 26North Inland 4 39 0 0 43 North Inland 20 0 0 0 20North Central 39 12 0 0 51 North Central 84 30 0 0 114Central 16 0 0 0 16 Central 0 0 0 0 0East 0 0 0 0 0 East 66 0 0 0 66South 3 0 0 0 3 South 0 0 0 0 0Total 71 51 0 0 122 Total 170 56 0 0 226
Region 2006-2010 2011-2015 2016-2020 2021-2025 Total Region 2006-2010 2011-2015 2016-2020 2021-2025 Total
North Coastal 0 0 0 0 0 North Coastal 0 20 0 0 20North Inland 0 0 0 0 0 North Inland 2 360 0 0 362North Central 0 20 0 0 20 North Central 88 0 0 50 138Central 0 0 0 0 0 Central 0 0 0 0 0East 24 0 0 0 24 East 0 0 0 0 0South 0 0 0 0 0 South 11 0 0 0 11Total 24 20 0 0 44 Total 101 380 0 50 531
Hospital Expansion Plans2006-2025
ED Treatment Stations
ICU Beds Hospital Beds
Med/Surg Beds
Source: Hospital Campus Survey and Interviews, 2006
|| 86
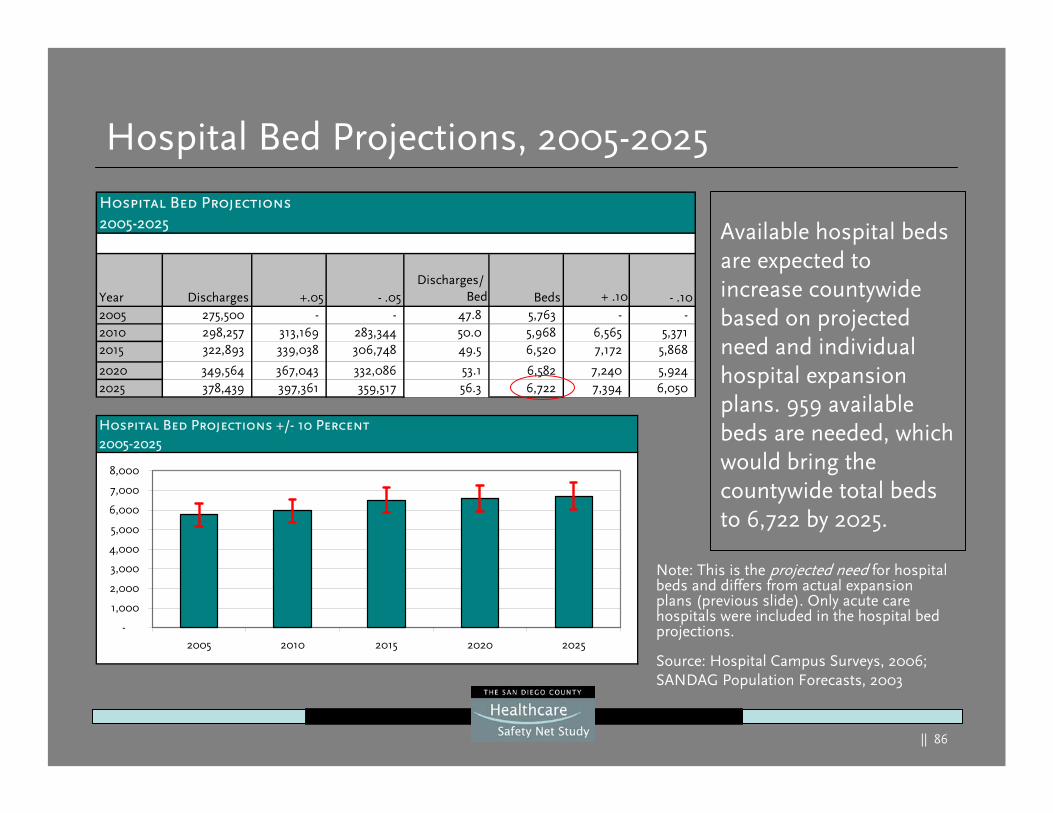
Hospital Bed Projections2005-2025
Year Discharges +.05 - .05Discharges/
Bed Beds + .10 - .102005 275,500 - - 47.8 5,763 - -2010 298,257 313,169 283,344 50.0 5,968 6,565 5,371 2015 322,893 339,038 306,748 49.5 6,520 7,172 5,868
2020 349,564 367,043 332,086 53.1 6,582 7,240 5,924 2025 378,439 397,361 359,517 56.3 6,722 7,394 6,050
Hospital Bed Projections, 2005-2025
Available hospital beds are expected to increase countywide based on projected need and individual hospital expansion plans. 959 available beds are needed, which would bring the countywide total beds to 6,722 by 2025.
Source: Hospital Campus Surveys, 2006; SANDAG Population Forecasts, 2003
Note: This is the projected need for hospital beds and differs from actual expansion plans (previous slide). Only acute care hospitals were included in the hospital bed projections.
Hospital Bed Projections +/- 10 Percent2005-2025
-
1,000
2,000
3,000
4,000
5,000
6,000
7,000
8,000
2005 2010 2015 2020 2025
|| 87
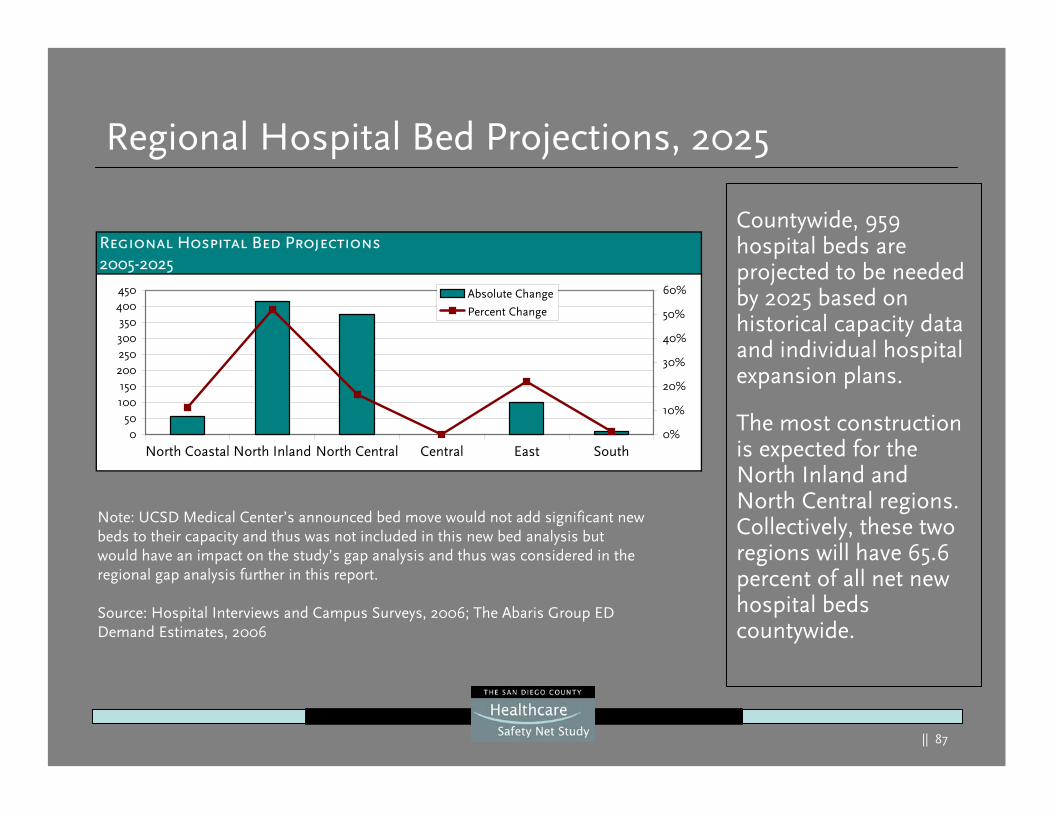
Regional Hospital Bed Projections, 2025
Countywide, 959 hospital beds are projected to be needed by 2025 based on historical capacity data and individual hospital expansion plans.
The most construction is expected for the North Inland and North Central regions. Collectively, these two regions will have 65.6 percent of all net new hospital beds countywide.
Note: UCSD Medical Center’s announced bed move would not add significant new beds to their capacity and thus was not included in this new bed analysis but would have an impact on the study’s gap analysis and thus was considered in the regional gap analysis further in this report.
Source: Hospital Interviews and Campus Surveys, 2006; The Abaris Group ED Demand Estimates, 2006
Regional Hospital Bed Projections2005-2025
050
100150
200250300350
400450
North Coastal North Inland North Central Central East South0%
10%
20%
30%
40%
50%
60%Absolute Change
Percent Change
|| 88
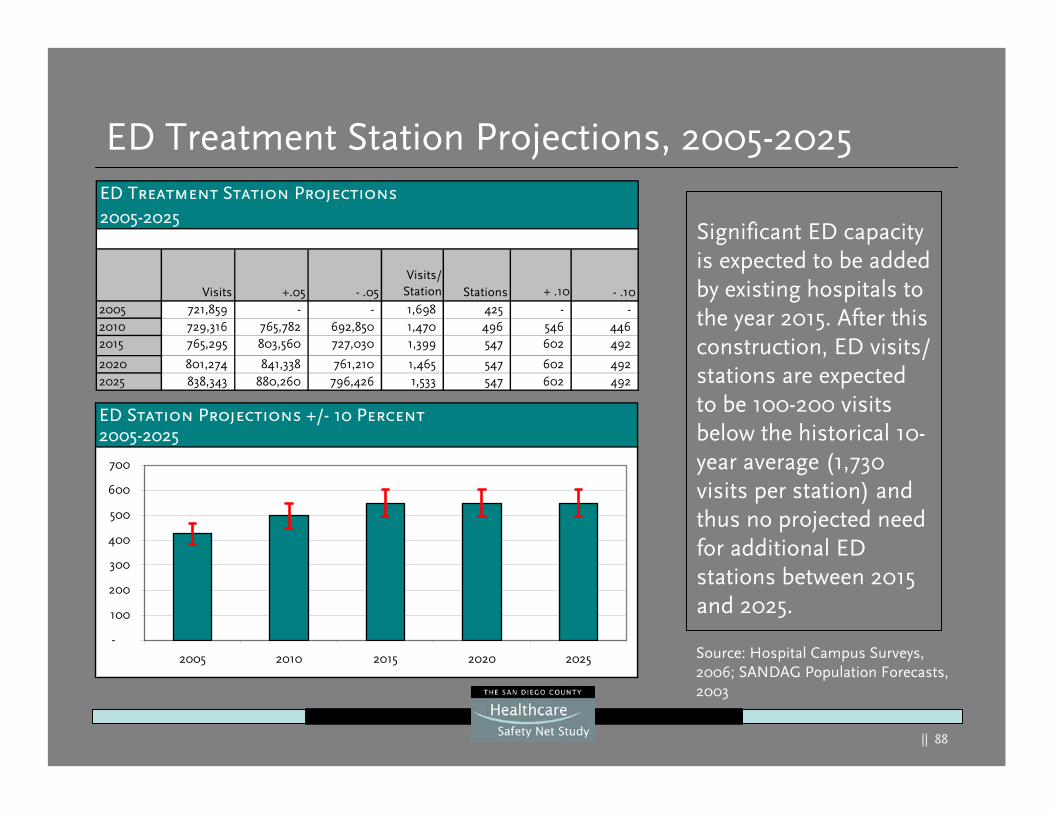
ED Treatment Station Projections, 2005-2025
Significant ED capacity is expected to be added by existing hospitals to the year 2015. After this construction, ED visits/ stations are expected to be 100-200 visits below the historical 10-year average (1,730 visits per station) and thus no projected need for additional ED stations between 2015 and 2025.
Significant ED capacity is expected to be added by existing hospitals to the year 2015. After this construction, ED visits/ stations are expected to be 100-200 visits below the historical 10-year average (1,730 visits per station) and thus no projected need for additional ED stations between 2015 and 2025.
Source: Hospital Campus Surveys, 2006; SANDAG Population Forecasts, 2003
ED Treatment Station Projections2005-2025
Visits +.05 - .05Visits/
Station Stations + .10 - .102005 721,859 - - 1,698 425 - -2010 729,316 765,782 692,850 1,470 496 546 446 2015 765,295 803,560 727,030 1,399 547 602 492
2020 801,274 841,338 761,210 1,465 547 602 492 2025 838,343 880,260 796,426 1,533 547 602 492
ED Station Projections +/- 10 Percent2005-2025
-
100
200
300
400
500
600
700
2005 2010 2015 2020 2025
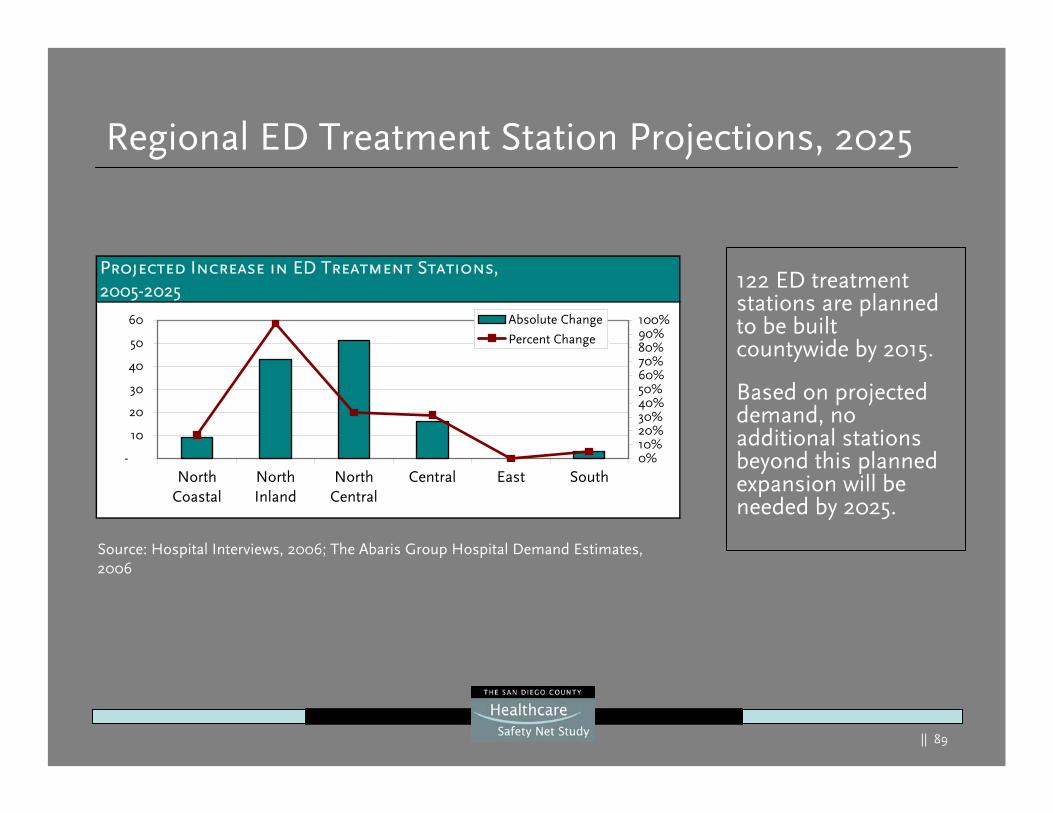
|| 89
Regional ED Treatment Station Projections, 2025
122 ED treatment stations are planned to be built countywide by 2015.
Based on projected demand, no additional stations beyond this planned expansion will be needed by 2025.
Source: Hospital Interviews, 2006; The Abaris Group Hospital Demand Estimates, 2006
Projected Increase in ED Treatment Stations,2005-2025
-
10
20
30
40
50
60
NorthCoastal
NorthInland
NorthCentral
Central East South0%10%20%30%40%50%60%70%80%90%100%Absolute Change
Percent Change
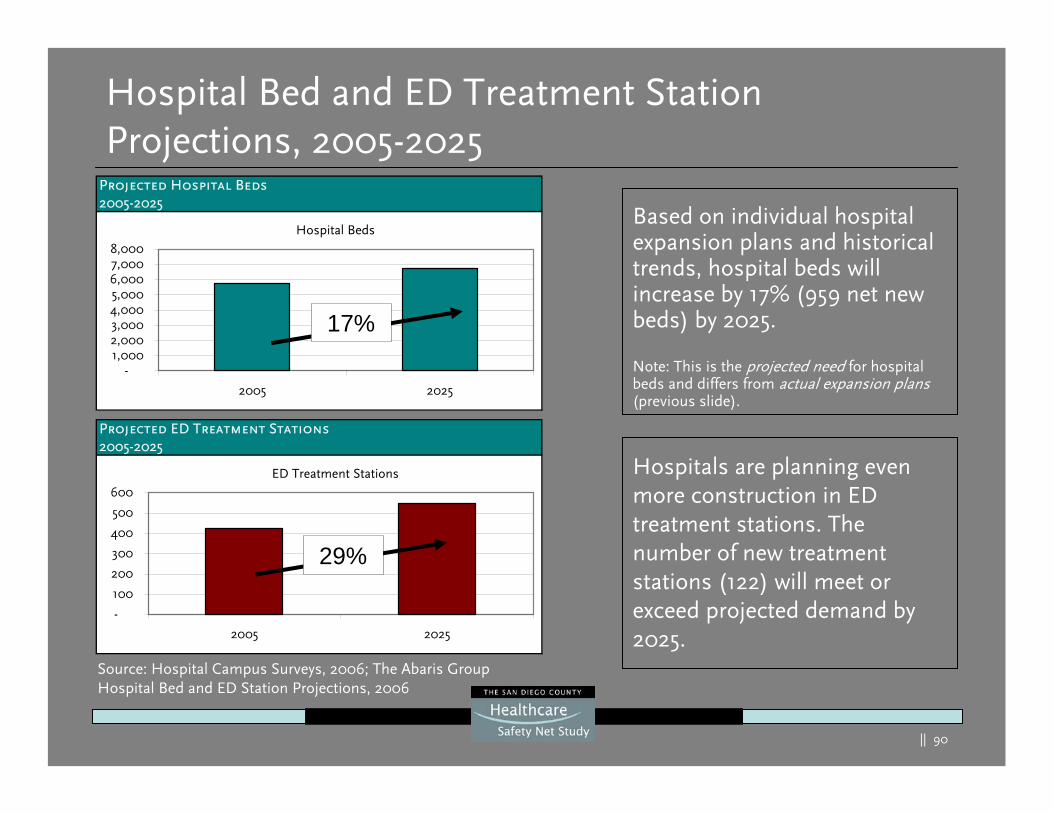
|| 90
Projected ED Treatment Stations2005-2025
ED Treatment Stations
-
100
200
300
400
500
600
2005 2025
Projected Hospital Beds2005-2025
Hospital Beds
-1,0002,0003,0004,0005,0006,0007,0008,000
2005 2025
Hospital Bed and ED Treatment Station Projections, 2005-2025
Based on individual hospital expansion plans and historical trends, hospital beds will increase by 17% (959 net new beds) by 2025.
Note: This is the projected need for hospital beds and differs from actual expansion plans(previous slide).
29%
17%
Hospitals are planning even more construction in ED treatment stations. The number of new treatment stations (122) will meet or exceed projected demand by 2025.
Source: Hospital Campus Surveys, 2006; The Abaris Group Hospital Bed and ED Station Projections, 2006
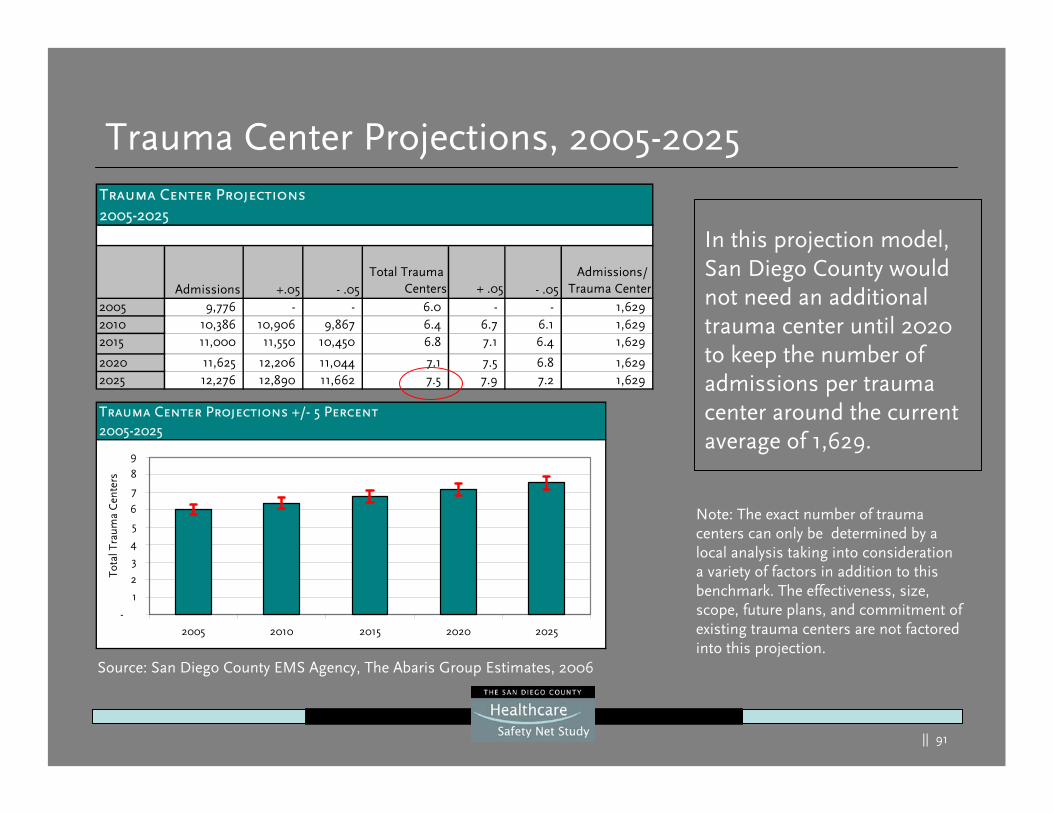
|| 91
Trauma Center Projections2005-2025
Admissions +.05 - .05Total Trauma
Centers + .05 - .05Admissions/
Trauma Center2005 9,776 - - 6.0 - - 1,629 2010 10,386 10,906 9,867 6.4 6.7 6.1 1,629 2015 11,000 11,550 10,450 6.8 7.1 6.4 1,629
2020 11,625 12,206 11,044 7.1 7.5 6.8 1,629 2025 12,276 12,890 11,662 7.5 7.9 7.2 1,629
Trauma Center Projections, 2005-2025
In this projection model, San Diego County would not need an additional trauma center until 2020 to keep the number of admissions per trauma center around the current average of 1,629.
Trauma Center Projections +/- 5 Percent2005-2025
-
1
2
3
4
5
6
7
8
9
2005 2010 2015 2020 2025
Tota
l Tra
uma
Cen
ters
Source: San Diego County EMS Agency, The Abaris Group Estimates, 2006
Note: The exact number of trauma centers can only be determined by a local analysis taking into consideration a variety of factors in addition to this benchmark. The effectiveness, size, scope, future plans, and commitment of existing trauma centers are not factored into this projection.
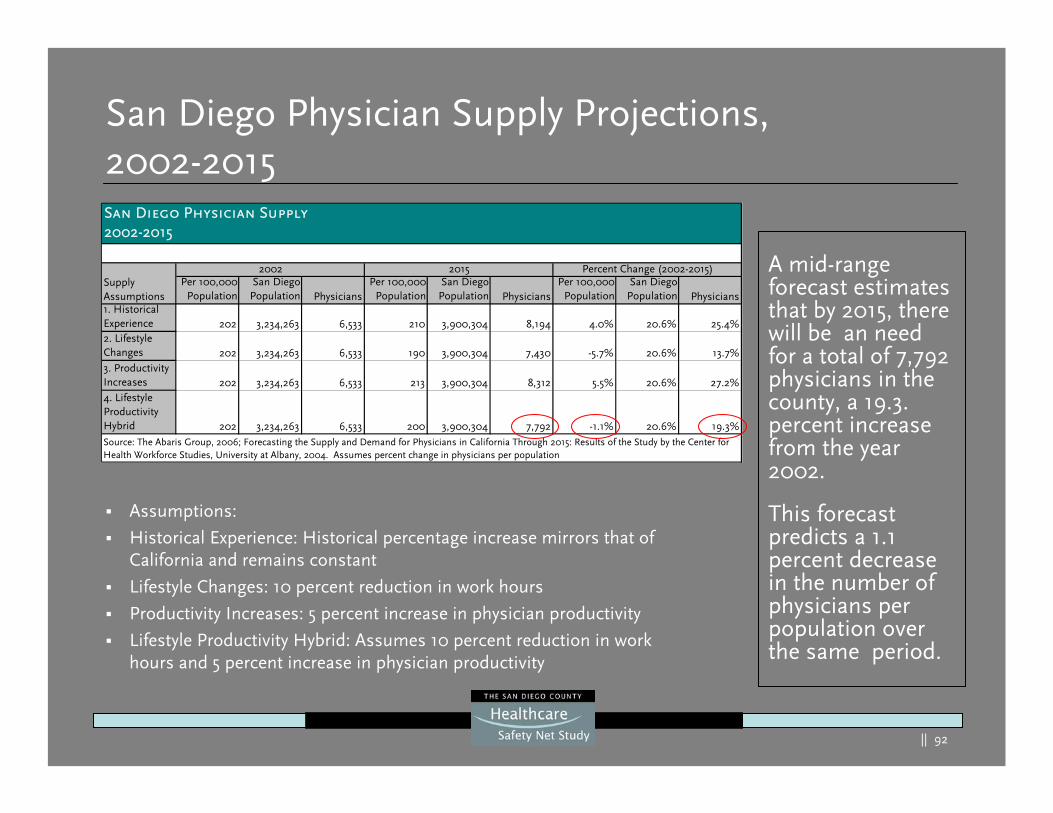
|| 92
Per 100,000Population
San DiegoPopulation Physicians
Per 100,000Population
San DiegoPopulation Physicians
Per 100,000Population
San DiegoPopulation Physicians
1. Historical Experience 202 3,234,263 6,533 210 3,900,304 8,194 4.0% 20.6% 25.4%2. Lifestyle Changes 202 3,234,263 6,533 190 3,900,304 7,430 -5.7% 20.6% 13.7%3. Productivity Increases 202 3,234,263 6,533 213 3,900,304 8,312 5.5% 20.6% 27.2%4. Lifestyle Productivity Hybrid 202 3,234,263 6,533 200 3,900,304 7,792 -1.1% 20.6% 19.3%
Percent Change (2002-2015)Supply Assumptions
2015
San Diego Physician Supply2002-2015
Source: The Abaris Group, 2006; Forecasting the Supply and Demand for Physicians in California Through 2015: Results of the Study by the Center for Health Workforce Studies, University at Albany, 2004. Assumes percent change in physicians per population
2002
San Diego Physician Supply Projections, 2002-2015
Assumptions:
Historical Experience: Historical percentage increase mirrors that of California and remains constant
Lifestyle Changes: 10 percent reduction in work hours
Productivity Increases: 5 percent increase in physician productivity
Lifestyle Productivity Hybrid: Assumes 10 percent reduction in work hours and 5 percent increase in physician productivity
A mid-range forecast estimates that by 2015, there will be an need for a total of 7,792 physicians in the county, a 19.3. percent increase from the year 2002.
This forecast predicts a 1.1 percent decrease in the number of physicians per population over the same period.
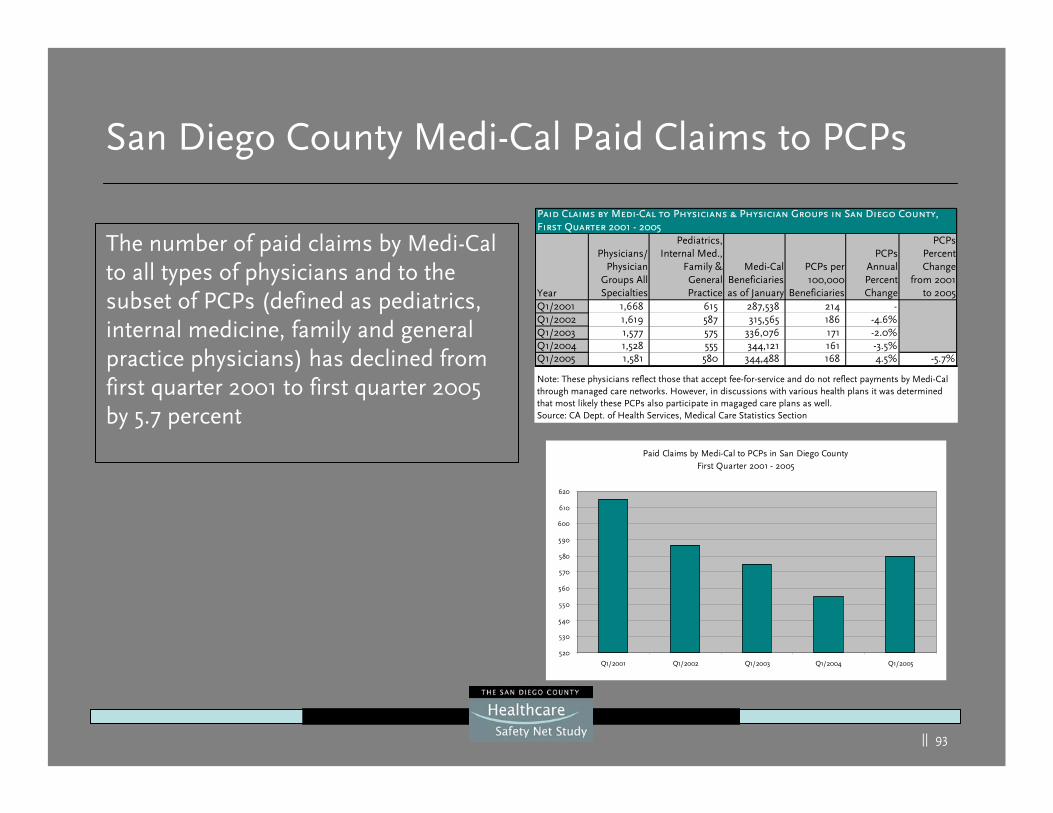
|| 93
San Diego County Medi-Cal Paid Claims to PCPs
Year
Physicians/Physician
Groups AllSpecialties
Pediatrics,Internal Med.,
Family &GeneralPractice
Medi-CalBeneficiariesas of January
PCPs per100,000
Beneficiaries
PCPsAnnualPercentChange
PCPsPercentChange
from 2001to 2005
Q1/2001 1,668 615 287,538 214 -Q1/2002 1,619 587 315,565 186 -4.6%Q1/2003 1,577 575 336,076 171 -2.0%Q1/2004 1,528 555 344,121 161 -3.5%Q1/2005 1,581 580 344,488 168 4.5% -5.7%
Paid Claims by Medi-Cal to Physicians & Physician Groups in San Diego County, First Quarter 2001 - 2005
Note: These physicians reflect those that accept fee-for-service and do not reflect payments by Medi-Cal through managed care networks. However, in discussions with various health plans it was determined that most likely these PCPs also participate in magaged care plans as well.Source: CA Dept. of Health Services, Medical Care Statistics Section
Paid Claims by Medi-Cal to PCPs in San Diego CountyFirst Quarter 2001 - 2005
520
530
540
550
560
570
580
590
600
610
620
Q1/2001 Q1/2002 Q1/2003 Q1/2004 Q1/2005
The number of paid claims by Medi-Cal to all types of physicians and to the subset of PCPs (defined as pediatrics, internal medicine, family and general practice physicians) has declined from first quarter 2001 to first quarter 2005 by 5.7 percent
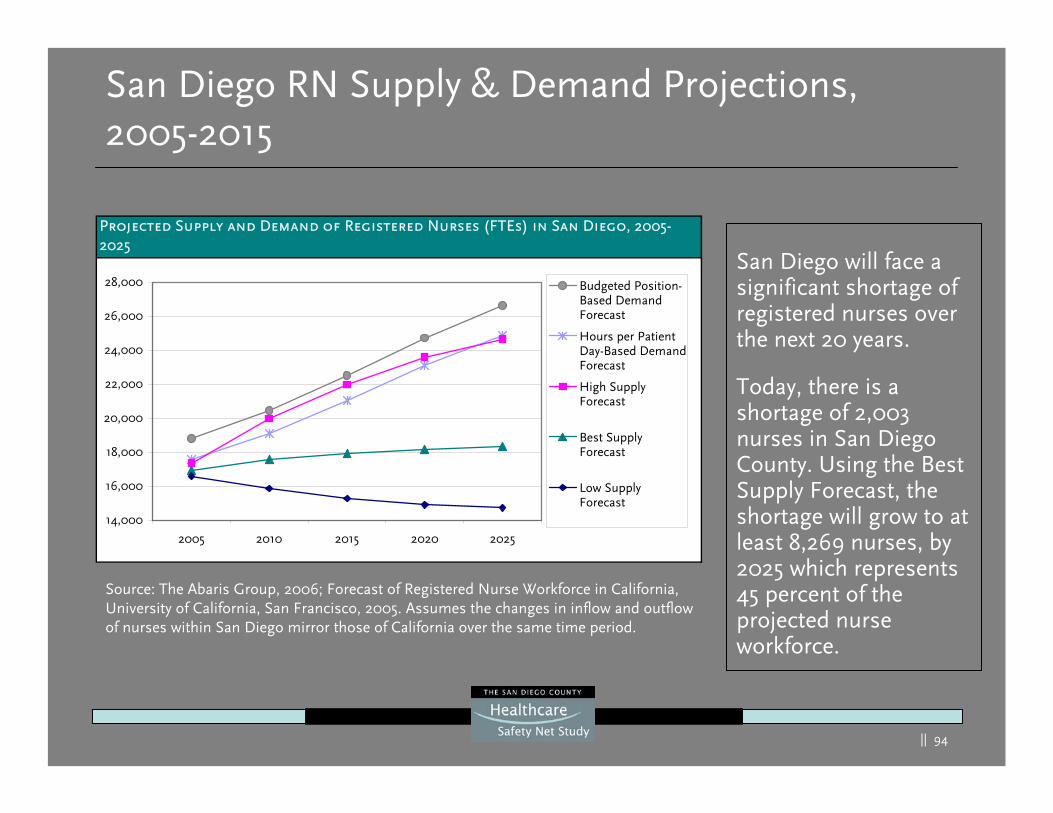
|| 94
San Diego RN Supply & Demand Projections, 2005-2015
San Diego will face a significant shortage of registered nurses over the next 20 years.
Today, there is a shortage of 2,003 nurses in San Diego County. Using the Best Supply Forecast, the shortage will grow to at least 8,269 nurses, by 2025 which represents 45 percent of the projected nurse workforce.
Source: The Abaris Group, 2006; Forecast of Registered Nurse Workforce in California, University of California, San Francisco, 2005. Assumes the changes in inflow and outflow of nurses within San Diego mirror those of California over the same time period.
Projected Supply and Demand of Registered Nurses (FTEs) in San Diego, 2005-2025
14,000
16,000
18,000
20,000
22,000
24,000
26,000
28,000
2005 2010 2015 2020 2025
Budgeted Position-Based DemandForecast
Hours per PatientDay-Based DemandForecast
High SupplyForecast
Best SupplyForecast
Low SupplyForecast
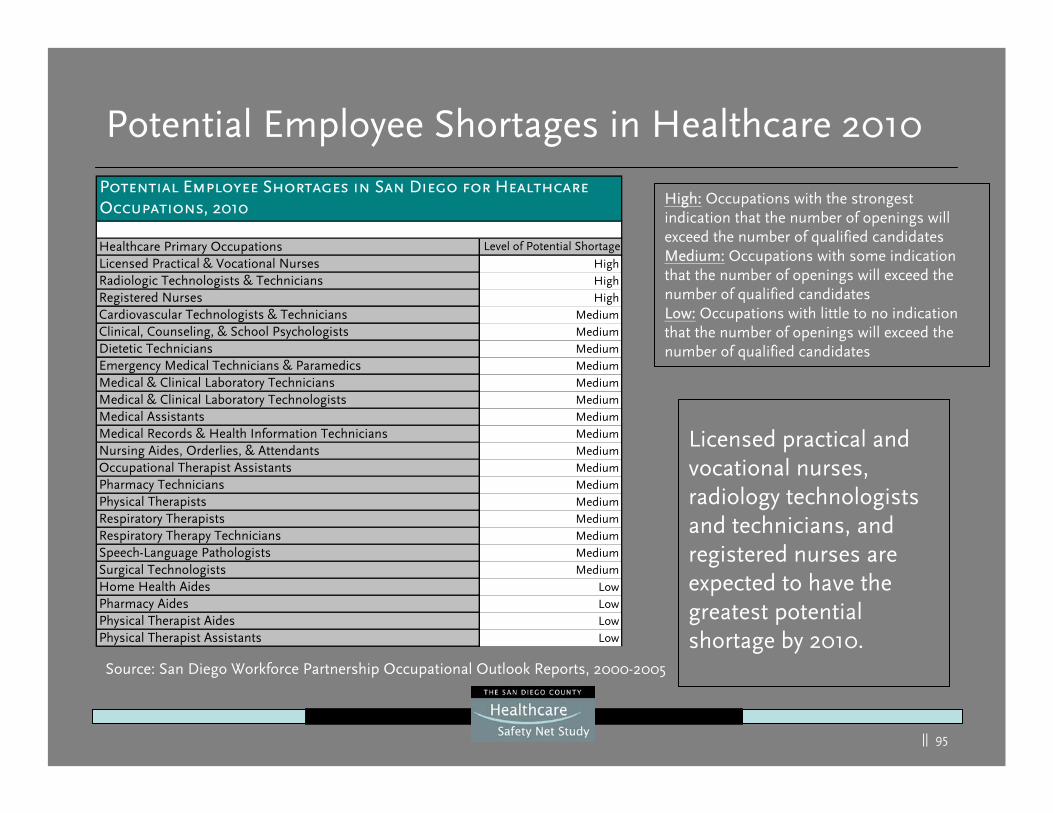
|| 95
Potential Employee Shortages in Healthcare 2010
Licensed practical and vocational nurses, radiology technologists and technicians, and registered nurses are expected to have the greatest potential shortage by 2010.
Healthcare Primary Occupations Level of Potential Shortage
Licensed Practical & Vocational Nurses HighRadiologic Technologists & Technicians HighRegistered Nurses HighCardiovascular Technologists & Technicians MediumClinical, Counseling, & School Psychologists MediumDietetic Technicians MediumEmergency Medical Technicians & Paramedics MediumMedical & Clinical Laboratory Technicians MediumMedical & Clinical Laboratory Technologists MediumMedical Assistants MediumMedical Records & Health Information Technicians MediumNursing Aides, Orderlies, & Attendants MediumOccupational Therapist Assistants MediumPharmacy Technicians MediumPhysical Therapists MediumRespiratory Therapists MediumRespiratory Therapy Technicians MediumSpeech-Language Pathologists MediumSurgical Technologists MediumHome Health Aides LowPharmacy Aides LowPhysical Therapist Aides LowPhysical Therapist Assistants Low
Potential Employee Shortages in San Diego for Healthcare Occupations, 2010
Source: San Diego Workforce Partnership Occupational Outlook Reports, 2000-2005
High: Occupations with the strongest indication that the number of openings will exceed the number of qualified candidatesMedium: Occupations with some indication that the number of openings will exceed the number of qualified candidatesLow: Occupations with little to no indication that the number of openings will exceed the number of qualified candidates

|| 96
Demand & Capacity Forecast Qualifiers

|| 97
Demand/Capacity Notes
The previous current and forecasted demand and capacity calculations
were based on historical utilization and projected need . This
methodology may have limitations:
Calculations used averages and yet patient utilization of services generally follow peaks and valleys throughout the day (e.g. ED volumes peak at 5:00 pm and on Mondays) and season (e.g. flu andrespiratory seasons)
No adjustments were made for pandemics, major emergencies (e.g. fires, earthquakes) or for terrorism events
Inventorying current capacity has the risk of over simplification of the assumptions such as the use of beds (e.g. acute care, pediatric versus adults) and availability of staff (e.g. physician capacity) for the safety net and healthcare in general
|| 98
Demand/Capacity Forecast Qualifiers
There are many areas of risk for the future county healthcare system:
Decline in reimbursement at all levels (Medicare, Medi-Cal, CMS and private payers)
Adjustments to health care delivery payments (e.g. physician andhospital quality DRG adjustments)
Potential public policy changes regarding the undocumented immigrant (e.g. citizenship documentation, immigration policy)
Changes in the number and location of providers (e.g. hospitals)
Workforce capacity challenges at all levels and for all providers
Unfunded mandates (e.g. seismic safety, nurse ratios, EMTALA)
Uncertainty on how future health care resources will be funded
Increased cost of construction
|| 99
Demand/Capacity Forecast Qualifiers
Some possible ways future risk may be mitigated:
Increased use of technology
Best practice industry production methodology implementation
Improved healthcare regional strategic planning and collaboration
Creative use of healthcare workforce resources
Reduction in utilization rates due to healthy living, disease management, prevention and gate keeping
Continued trend towards outpatient services
Market demands that may be attractive to healthcare providers

|| 100
Forecasted Payer Sources
|| 101
Projected Payer Mix by Region - Background
Projections derived from data, surveys, and trends at the national, state, county, and regional levels
Based on the SANDAG’s steady growth population projections
Considerations made for the aging populations and the locations of the poor and ethnic distributions
Medi-Cal projections include Healthy Families
Medicare projections reflect those people who only have Medicareas their sole insurance, and those on Medicare who have additional insurance distributed throughout
Uninsured projections are for all ages
Changes in public policy (e.g., universal payer, immigration, etc.) could impact these projections
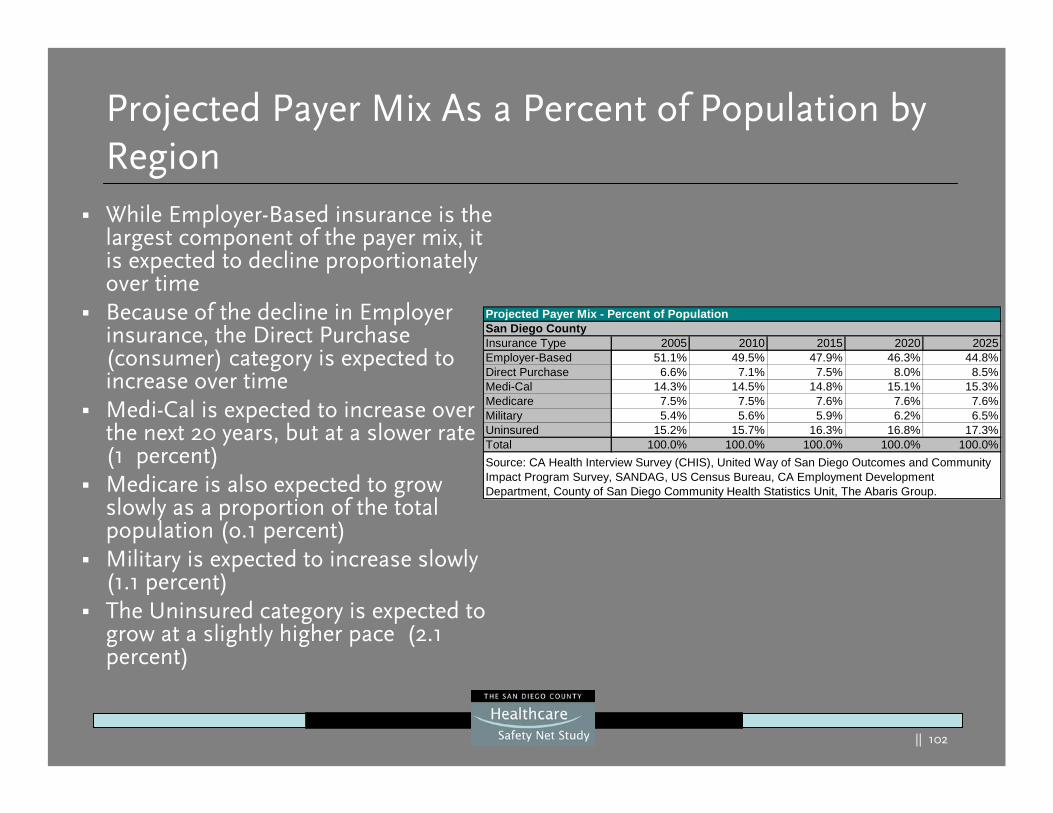
|| 102
Projected Payer Mix As a Percent of Population by RegionWhile Employer-Based insurance is the largest component of the payer mix, it is expected to decline proportionately over timeBecause of the decline in Employer insurance, the Direct Purchase (consumer) category is expected to increase over timeMedi-Cal is expected to increase over the next 20 years, but at a slower rate (1 percent)Medicare is also expected to grow slowly as a proportion of the total population (o.1 percent)Military is expected to increase slowly (1.1 percent)The Uninsured category is expected to grow at a slightly higher pace (2.1 percent)
Projected Payer Mix - Percent of PopulationSan Diego CountyInsurance Type 2005 2010 2015 2020 2025Employer-Based 51.1% 49.5% 47.9% 46.3% 44.8%Direct Purchase 6.6% 7.1% 7.5% 8.0% 8.5%Medi-Cal 14.3% 14.5% 14.8% 15.1% 15.3%Medicare 7.5% 7.5% 7.6% 7.6% 7.6%Military 5.4% 5.6% 5.9% 6.2% 6.5%Uninsured 15.2% 15.7% 16.3% 16.8% 17.3%Total 100.0% 100.0% 100.0% 100.0% 100.0%Source: CA Health Interview Survey (CHIS), United Way of San Diego Outcomes and Community Impact Program Survey, SANDAG, US Census Bureau, CA Employment Development Department, County of San Diego Community Health Statistics Unit, The Abaris Group.
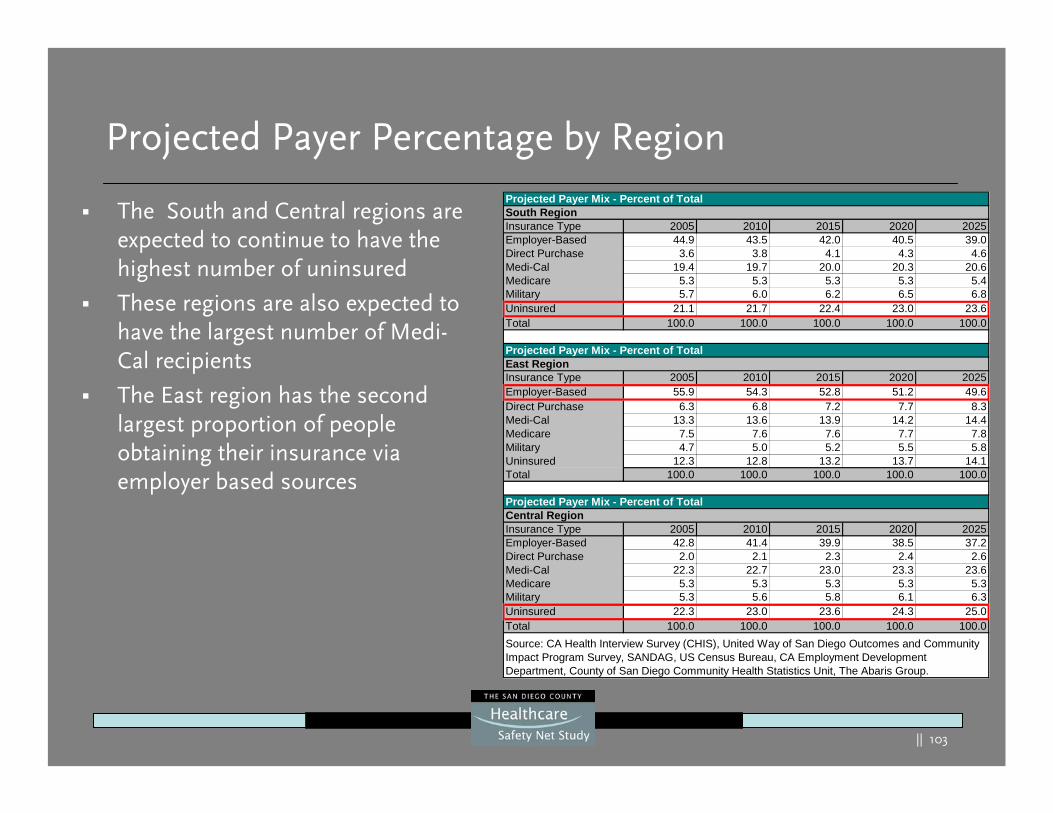
|| 103
Projected Payer Percentage by Region
The South and Central regions are expected to continue to have the highest number of uninsured
These regions are also expected to have the largest number of Medi-Cal recipients
The East region has the second largest proportion of people obtaining their insurance via employer based sources
Projected Payer Mix - Percent of TotalSouth RegionInsurance Type 2005 2010 2015 2020 2025Employer-Based 44.9 43.5 42.0 40.5 39.0Direct Purchase 3.6 3.8 4.1 4.3 4.6Medi-Cal 19.4 19.7 20.0 20.3 20.6Medicare 5.3 5.3 5.3 5.3 5.4Military 5.7 6.0 6.2 6.5 6.8Uninsured 21.1 21.7 22.4 23.0 23.6Total 100.0 100.0 100.0 100.0 100.0
Projected Payer Mix - Percent of TotalEast RegionInsurance Type 2005 2010 2015 2020 2025Employer-Based 55.9 54.3 52.8 51.2 49.6Direct Purchase 6.3 6.8 7.2 7.7 8.3Medi-Cal 13.3 13.6 13.9 14.2 14.4Medicare 7.5 7.6 7.6 7.7 7.8Military 4.7 5.0 5.2 5.5 5.8Uninsured 12.3 12.8 13.2 13.7 14.1Total 100.0 100.0 100.0 100.0 100.0
Projected Payer Mix - Percent of TotalCentral RegionInsurance Type 2005 2010 2015 2020 2025Employer-Based 42.8 41.4 39.9 38.5 37.2Direct Purchase 2.0 2.1 2.3 2.4 2.6Medi-Cal 22.3 22.7 23.0 23.3 23.6Medicare 5.3 5.3 5.3 5.3 5.3Military 5.3 5.6 5.8 6.1 6.3Uninsured 22.3 23.0 23.6 24.3 25.0Total 100.0 100.0 100.0 100.0 100.0Source: CA Health Interview Survey (CHIS), United Way of San Diego Outcomes and Community Impact Program Survey, SANDAG, US Census Bureau, CA Employment Development Department, County of San Diego Community Health Statistics Unit, The Abaris Group.
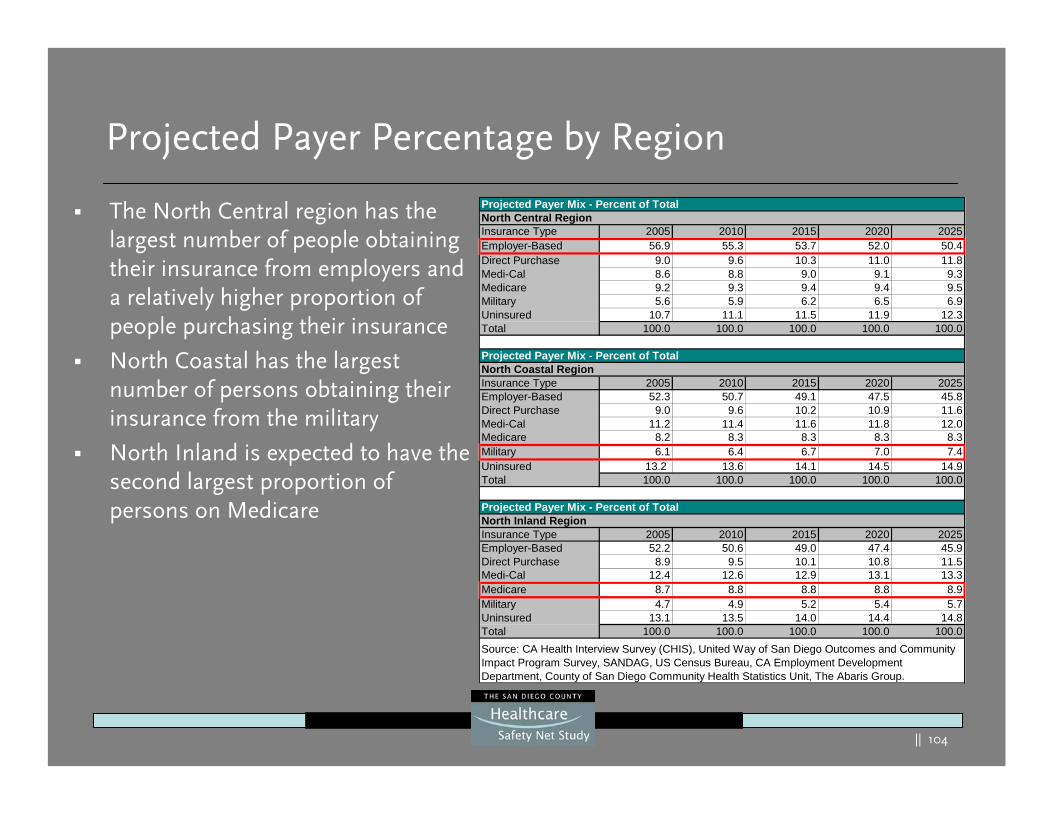
|| 104
Projected Payer Percentage by Region
The North Central region has the largest number of people obtaining their insurance from employers and a relatively higher proportion of people purchasing their insurance
North Coastal has the largest number of persons obtaining their insurance from the military
North Inland is expected to have the second largest proportion of persons on Medicare
Projected Payer Mix - Percent of TotalNorth Central RegionInsurance Type 2005 2010 2015 2020 2025Employer-Based 56.9 55.3 53.7 52.0 50.4Direct Purchase 9.0 9.6 10.3 11.0 11.8Medi-Cal 8.6 8.8 9.0 9.1 9.3Medicare 9.2 9.3 9.4 9.4 9.5Military 5.6 5.9 6.2 6.5 6.9Uninsured 10.7 11.1 11.5 11.9 12.3Total 100.0 100.0 100.0 100.0 100.0
Projected Payer Mix - Percent of TotalNorth Coastal RegionInsurance Type 2005 2010 2015 2020 2025Employer-Based 52.3 50.7 49.1 47.5 45.8Direct Purchase 9.0 9.6 10.2 10.9 11.6Medi-Cal 11.2 11.4 11.6 11.8 12.0Medicare 8.2 8.3 8.3 8.3 8.3Military 6.1 6.4 6.7 7.0 7.4Uninsured 13.2 13.6 14.1 14.5 14.9Total 100.0 100.0 100.0 100.0 100.0
Projected Payer Mix - Percent of TotalNorth Inland RegionInsurance Type 2005 2010 2015 2020 2025Employer-Based 52.2 50.6 49.0 47.4 45.9Direct Purchase 8.9 9.5 10.1 10.8 11.5Medi-Cal 12.4 12.6 12.9 13.1 13.3Medicare 8.7 8.8 8.8 8.8 8.9Military 4.7 4.9 5.2 5.4 5.7Uninsured 13.1 13.5 14.0 14.4 14.8Total 100.0 100.0 100.0 100.0 100.0Source: CA Health Interview Survey (CHIS), United Way of San Diego Outcomes and Community Impact Program Survey, SANDAG, US Census Bureau, CA Employment Development Department, County of San Diego Community Health Statistics Unit, The Abaris Group.
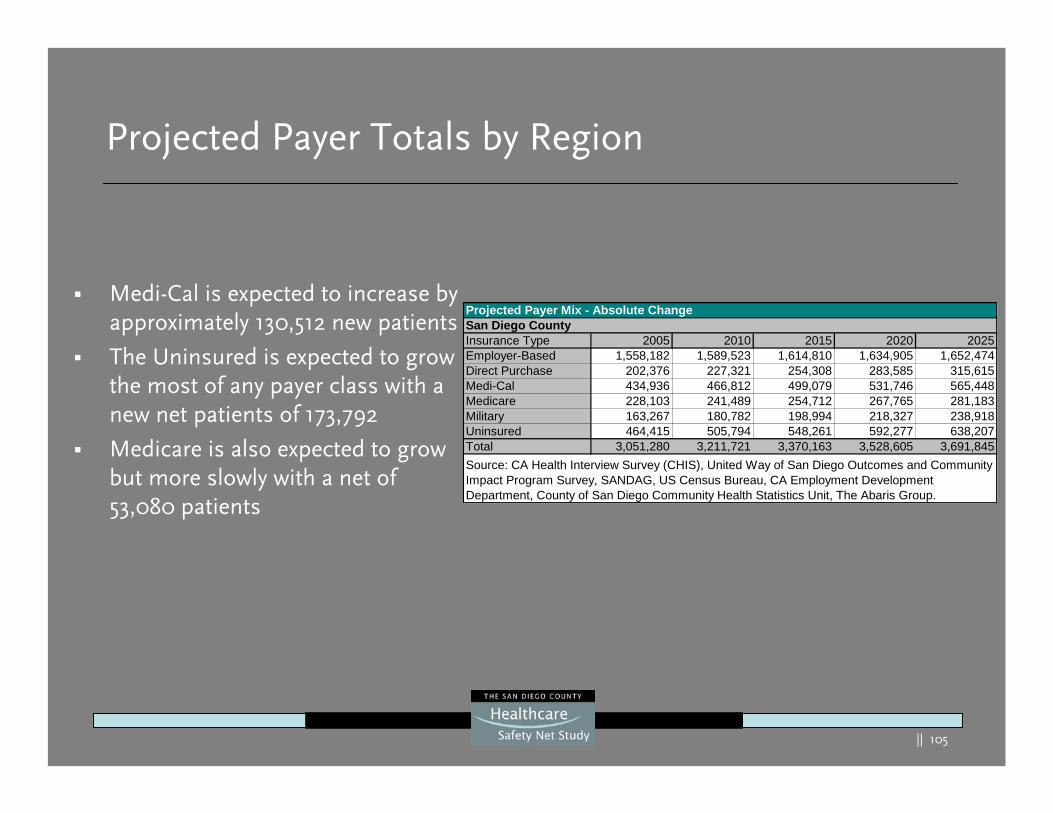
|| 105
Projected Payer Totals by Region
Medi-Cal is expected to increase by approximately 130,512 new patients
The Uninsured is expected to grow the most of any payer class with a new net patients of 173,792
Medicare is also expected to grow but more slowly with a net of 53,080 patients
Projected Payer Mix - Absolute ChangeSan Diego CountyInsurance Type 2005 2010 2015 2020 2025Employer-Based 1,558,182 1,589,523 1,614,810 1,634,905 1,652,474Direct Purchase 202,376 227,321 254,308 283,585 315,615Medi-Cal 434,936 466,812 499,079 531,746 565,448Medicare 228,103 241,489 254,712 267,765 281,183Military 163,267 180,782 198,994 218,327 238,918Uninsured 464,415 505,794 548,261 592,277 638,207Total 3,051,280 3,211,721 3,370,163 3,528,605 3,691,845Source: CA Health Interview Survey (CHIS), United Way of San Diego Outcomes and Community Impact Program Survey, SANDAG, US Census Bureau, CA Employment Development Department, County of San Diego Community Health Statistics Unit, The Abaris Group.
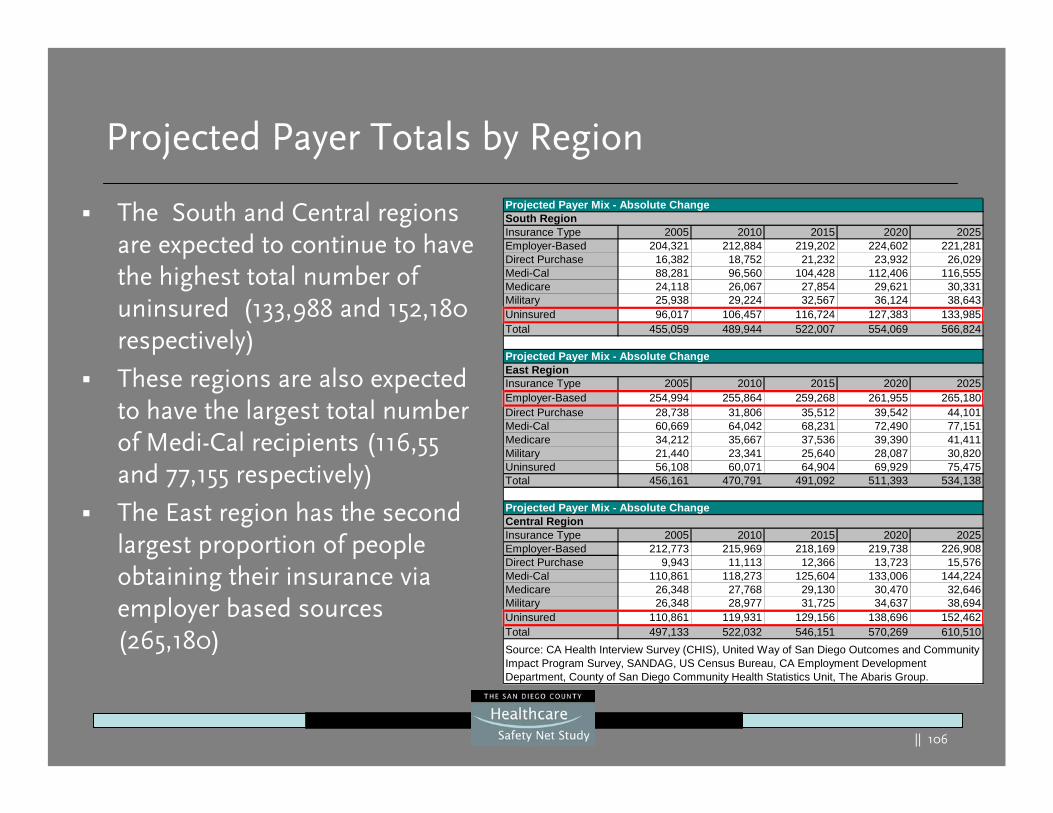
|| 106
Projected Payer Totals by Region
Projected Payer Mix - Absolute ChangeSouth RegionInsurance Type 2005 2010 2015 2020 2025Employer-Based 204,321 212,884 219,202 224,602 221,281Direct Purchase 16,382 18,752 21,232 23,932 26,029Medi-Cal 88,281 96,560 104,428 112,406 116,555Medicare 24,118 26,067 27,854 29,621 30,331Military 25,938 29,224 32,567 36,124 38,643Uninsured 96,017 106,457 116,724 127,383 133,985Total 455,059 489,944 522,007 554,069 566,824
Projected Payer Mix - Absolute ChangeEast RegionInsurance Type 2005 2010 2015 2020 2025Employer-Based 254,994 255,864 259,268 261,955 265,180Direct Purchase 28,738 31,806 35,512 39,542 44,101Medi-Cal 60,669 64,042 68,231 72,490 77,151Medicare 34,212 35,667 37,536 39,390 41,411Military 21,440 23,341 25,640 28,087 30,820Uninsured 56,108 60,071 64,904 69,929 75,475Total 456,161 470,791 491,092 511,393 534,138
Projected Payer Mix - Absolute ChangeCentral RegionInsurance Type 2005 2010 2015 2020 2025Employer-Based 212,773 215,969 218,169 219,738 226,908Direct Purchase 9,943 11,113 12,366 13,723 15,576Medi-Cal 110,861 118,273 125,604 133,006 144,224Medicare 26,348 27,768 29,130 30,470 32,646Military 26,348 28,977 31,725 34,637 38,694Uninsured 110,861 119,931 129,156 138,696 152,462Total 497,133 522,032 546,151 570,269 610,510Source: CA Health Interview Survey (CHIS), United Way of San Diego Outcomes and Community Impact Program Survey, SANDAG, US Census Bureau, CA Employment Development Department, County of San Diego Community Health Statistics Unit, The Abaris Group.
The South and Central regions are expected to continue to have the highest total number of uninsured (133,988 and 152,180 respectively)
These regions are also expected to have the largest total number of Medi-Cal recipients (116,55 and 77,155 respectively)
The East region has the second largest proportion of people obtaining their insurance via employer based sources (265,180)
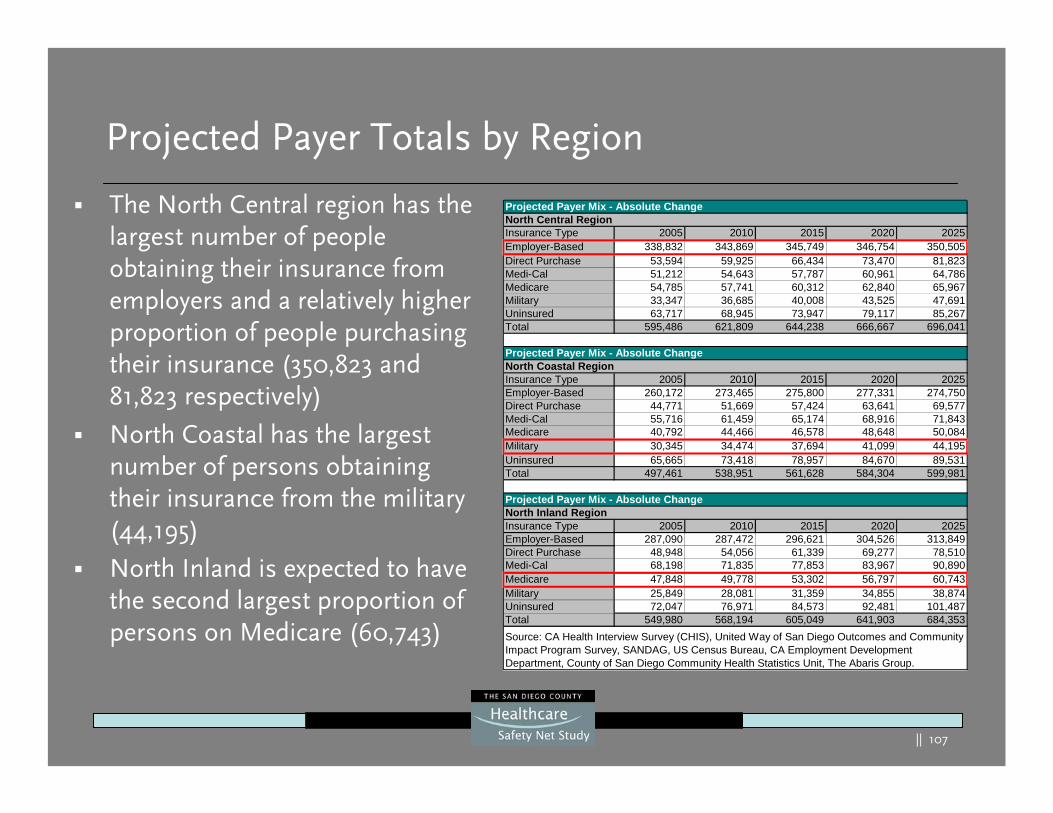
|| 107
Projected Payer Totals by Region
Projected Payer Mix - Absolute ChangeNorth Central RegionInsurance Type 2005 2010 2015 2020 2025Employer-Based 338,832 343,869 345,749 346,754 350,505Direct Purchase 53,594 59,925 66,434 73,470 81,823Medi-Cal 51,212 54,643 57,787 60,961 64,786Medicare 54,785 57,741 60,312 62,840 65,967Military 33,347 36,685 40,008 43,525 47,691Uninsured 63,717 68,945 73,947 79,117 85,267Total 595,486 621,809 644,238 666,667 696,041
Projected Payer Mix - Absolute ChangeNorth Coastal RegionInsurance Type 2005 2010 2015 2020 2025Employer-Based 260,172 273,465 275,800 277,331 274,750Direct Purchase 44,771 51,669 57,424 63,641 69,577Medi-Cal 55,716 61,459 65,174 68,916 71,843Medicare 40,792 44,466 46,578 48,648 50,084Military 30,345 34,474 37,694 41,099 44,195Uninsured 65,665 73,418 78,957 84,670 89,531Total 497,461 538,951 561,628 584,304 599,981
Projected Payer Mix - Absolute ChangeNorth Inland RegionInsurance Type 2005 2010 2015 2020 2025Employer-Based 287,090 287,472 296,621 304,526 313,849Direct Purchase 48,948 54,056 61,339 69,277 78,510Medi-Cal 68,198 71,835 77,853 83,967 90,890Medicare 47,848 49,778 53,302 56,797 60,743Military 25,849 28,081 31,359 34,855 38,874Uninsured 72,047 76,971 84,573 92,481 101,487Total 549,980 568,194 605,049 641,903 684,353Source: CA Health Interview Survey (CHIS), United Way of San Diego Outcomes and Community Impact Program Survey, SANDAG, US Census Bureau, CA Employment Development Department, County of San Diego Community Health Statistics Unit, The Abaris Group.
The North Central region has the largest number of people obtaining their insurance from employers and a relatively higher proportion of people purchasing their insurance (350,823 and 81,823 respectively)
North Coastal has the largest number of persons obtaining their insurance from the military (44,195)
North Inland is expected to have the second largest proportion of persons on Medicare (60,743)
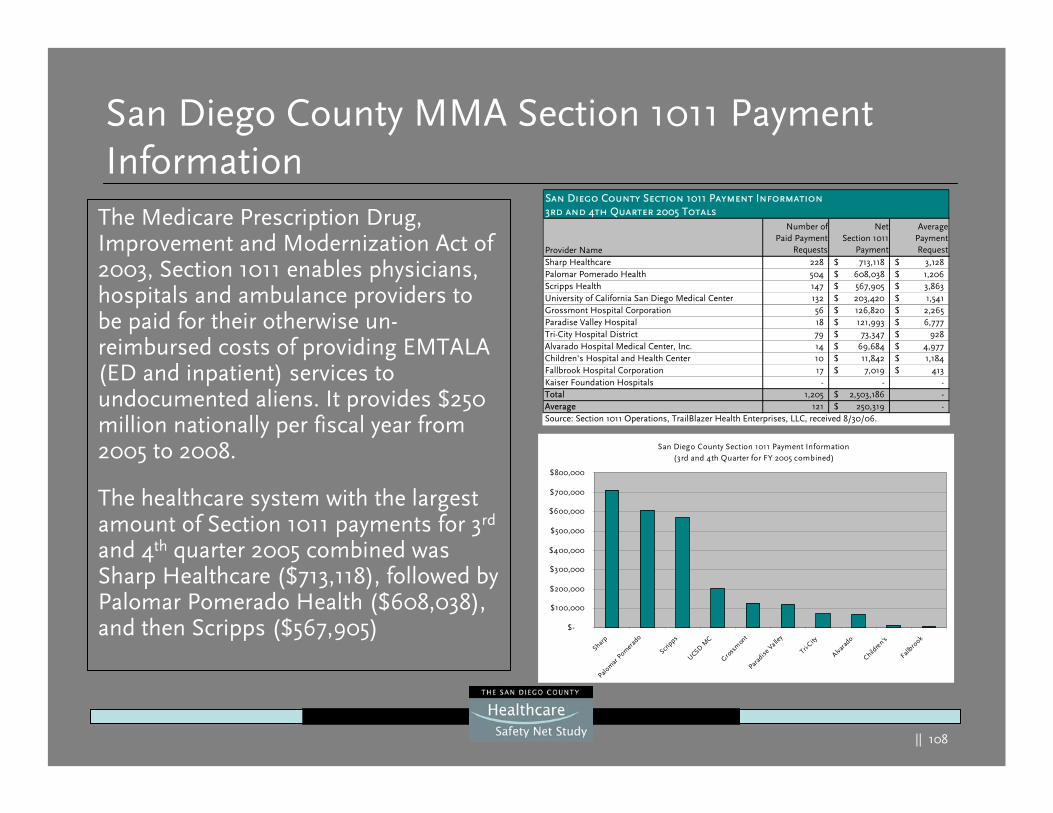
|| 108
San Diego County MMA Section 1011 Payment Information
The Medicare Prescription Drug, Improvement and Modernization Act of 2003, Section 1011 enables physicians, hospitals and ambulance providers to be paid for their otherwise un-reimbursed costs of providing EMTALA (ED and inpatient) services to undocumented aliens. It provides $250 million nationally per fiscal year from 2005 to 2008.
The healthcare system with the largest amount of Section 1011 payments for 3rd
and 4th quarter 2005 combined was Sharp Healthcare ($713,118), followed by Palomar Pomerado Health ($608,038), and then Scripps ($567,905)
Provider Name
Number ofPaid Payment
Requests
NetSection 1011
Payment
AveragePaymentRequest
Sharp Healthcare 228 713,118$ 3,128$ Palomar Pomerado Health 504 608,038$ 1,206$ Scripps Health 147 567,905$ 3,863$ University of California San Diego Medical Center 132 203,420$ 1,541$ Grossmont Hospital Corporation 56 126,820$ 2,265$ Paradise Valley Hospital 18 121,993$ 6,777$ Tri-City Hospital District 79 73,347$ 928$ Alvarado Hospital Medical Center, Inc. 14 69,684$ 4,977$ Children's Hospital and Health Center 10 11,842$ 1,184$ Fallbrook Hospital Corporation 17 7,019$ 413$ Kaiser Foundation Hospitals - - -Total 1,205 2,503,186$ -Average 121 250,319$ -Source: Section 1011 Operations, TrailBlazer Health Enterprises, LLC, received 8/30/06.
San Diego County Section 1011 Payment Information3rd and 4th Quarter 2005 Totals
San Diego County Section 1011 Payment Information(3rd and 4th Quarter for FY 2005 combined)
$-
$100,000
$200,000
$300,000
$400,000
$500,000
$600,000
$700,000
$800,000
Sharp
Palom
ar P
omer
ado
Scripps
UCSD MC
Gross
mon
tPar
adise
Valle
y
Tri-City
Alvara
do
Childre
n's
Fallbro
ok

|| 109
Gap Analysis
|| 110
What if no new beds/ED stations or clinics were added?
Possible effects on hospitals could be:
• Longer waiting times to get a hospital bed or a clinic appointment• Discharging patients faster from beds, possibly prematurely and leading to
potential poorer clinical outcomes with potential higher costs of care for these patients in the future
• Overuse of outpatient services including EDs
These problems are especially acute in the East, South, and Central Regions, which have the highest percent of existing filled beds.
In 2004, 84.9 percent of all available beds were staffed countywide and many community clinics today are reported at or near capacity. If there are no new beds/clinics added and/or staffed, or insufficient beds/clinics are added, approximately 103,000 hospital discharges and 435,000 clinic visits would be affected by the year 2025.
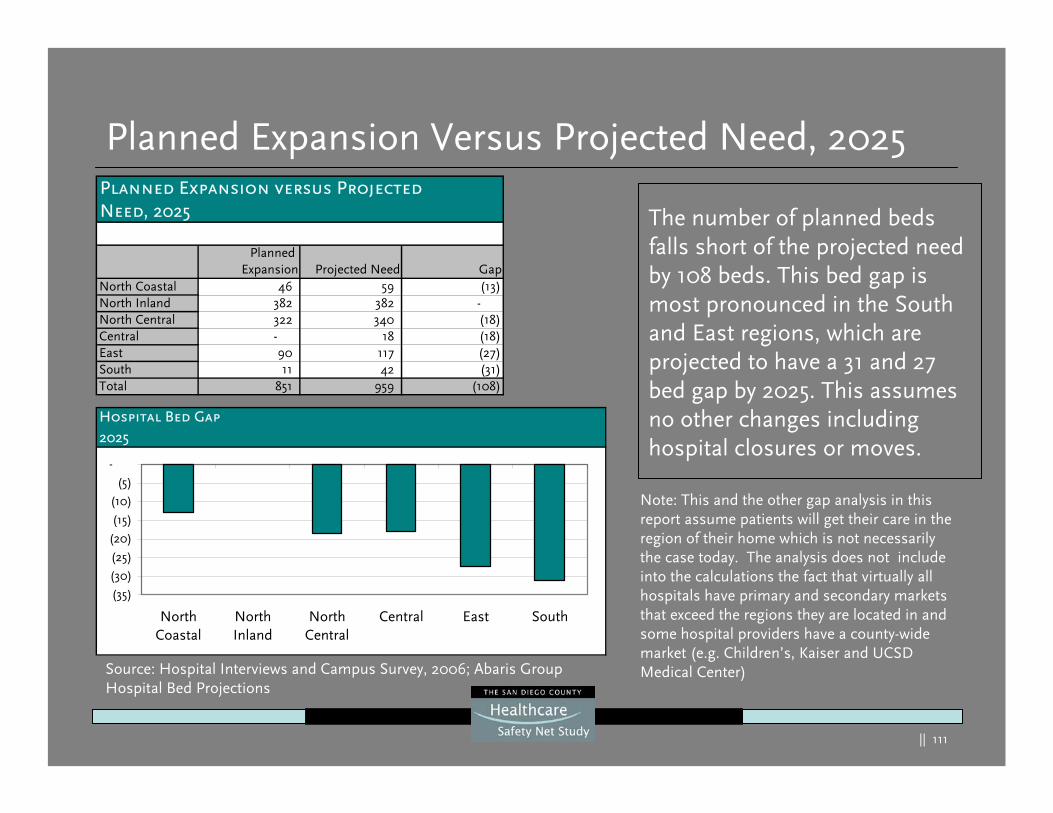
|| 111
Planned Expansion Versus Projected Need, 2025
The number of planned beds falls short of the projected need by 108 beds. This bed gap is most pronounced in the South and East regions, which are projected to have a 31 and 27 bed gap by 2025. This assumes no other changes including hospital closures or moves.
Planned Expansion versus ProjectedNeed, 2025
Planned Expansion Projected Need Gap
North Coastal 46 59 (13) North Inland 382 382 - North Central 322 340 (18) Central - 18 (18) East 90 117 (27) South 11 42 (31) Total 851 959 (108)
Hospital Bed Gap2025
(35)
(30)
(25)
(20)
(15)
(10)
(5)
-
NorthCoastal
NorthInland
NorthCentral
Central East South
Note: This and the other gap analysis in this report assume patients will get their care in the region of their home which is not necessarily the case today. The analysis does not include into the calculations the fact that virtually all hospitals have primary and secondary markets that exceed the regions they are located in and some hospital providers have a county-wide market (e.g. Children’s, Kaiser and UCSD Medical Center)Source: Hospital Interviews and Campus Survey, 2006; Abaris Group
Hospital Bed Projections
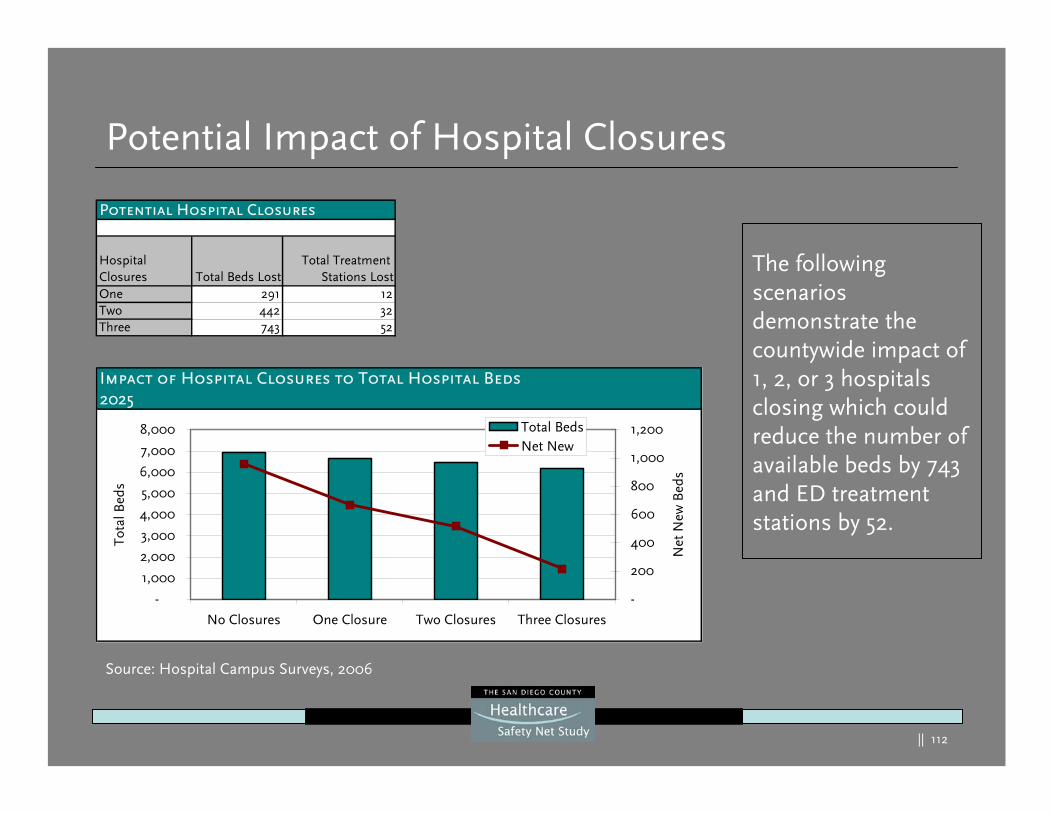
|| 112
Potential Impact of Hospital Closures
The following scenarios demonstrate the countywide impact of 1, 2, or 3 hospitals closing which could reduce the number of available beds by 743 and ED treatment stations by 52.
Impact of Hospital Closures to Total Hospital Beds2025
-
1,000
2,000
3,000
4,000
5,000
6,000
7,000
8,000
No Closures One Closure Two Closures Three Closures
Tota
l Bed
s
-
200
400
600
800
1,000
1,200
Net
New
Bed
s
Total BedsNet New
Potential Hospital Closures
Hospital Closures Total Beds Lost
Total Treatment Stations Lost
One 291 12Two 442 32Three 743 52
Source: Hospital Campus Surveys, 2006
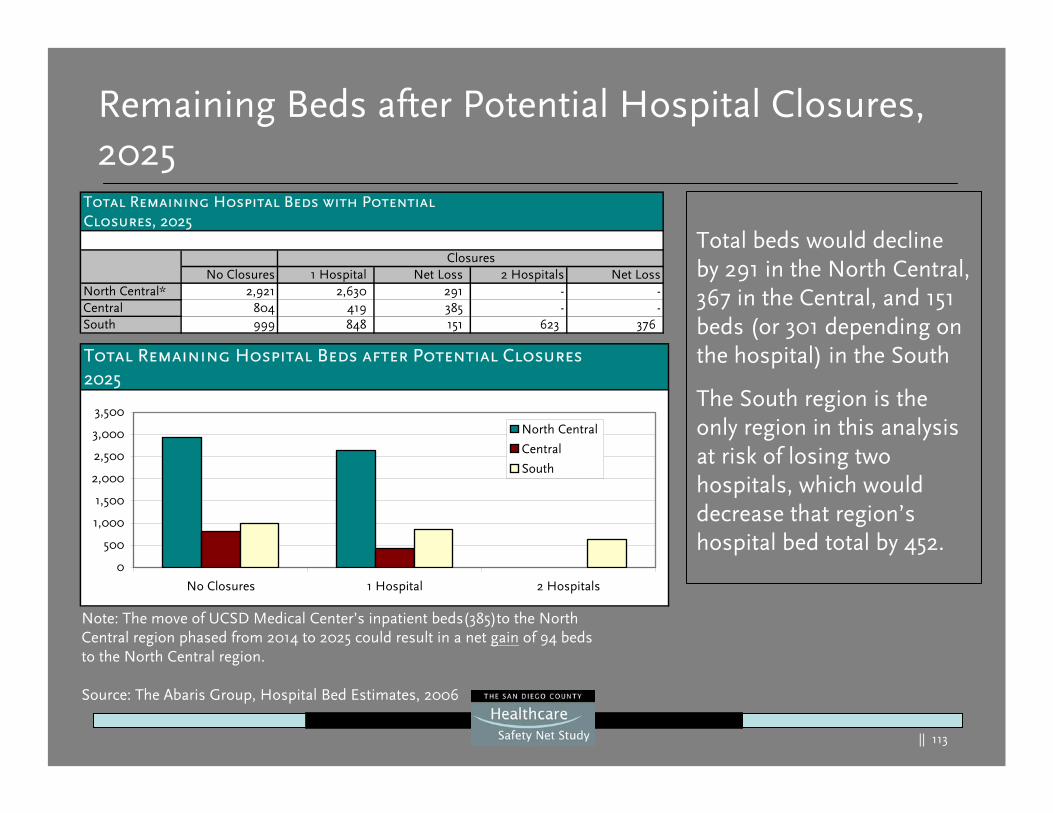
|| 113
Total beds would decline by 291 in the North Central, 367 in the Central, and 151 beds (or 301 depending on the hospital) in the South
The South region is the only region in this analysis at risk of losing two hospitals, which would decrease that region’s hospital bed total by 452.
Remaining Beds after Potential Hospital Closures, 2025
Note: The move of UCSD Medical Center’s inpatient beds(385)to the North Central region phased from 2014 to 2025 could result in a net gain of 94 beds to the North Central region.
Source: The Abaris Group, Hospital Bed Estimates, 2006
Total Remaining Hospital Beds with PotentialClosures, 2025
No Closures 1 Hospital Net Loss 2 Hospitals Net LossNorth Central* 2,921 2,630 291 - -Central 804 419 385 - -South 999 848 151 623 376
Closures
Total Remaining Hospital Beds after Potential Closures2025
0
500
1,000
1,500
2,000
2,500
3,000
3,500
No Closures 1 Hospital 2 Hospitals
North Central
Central
South
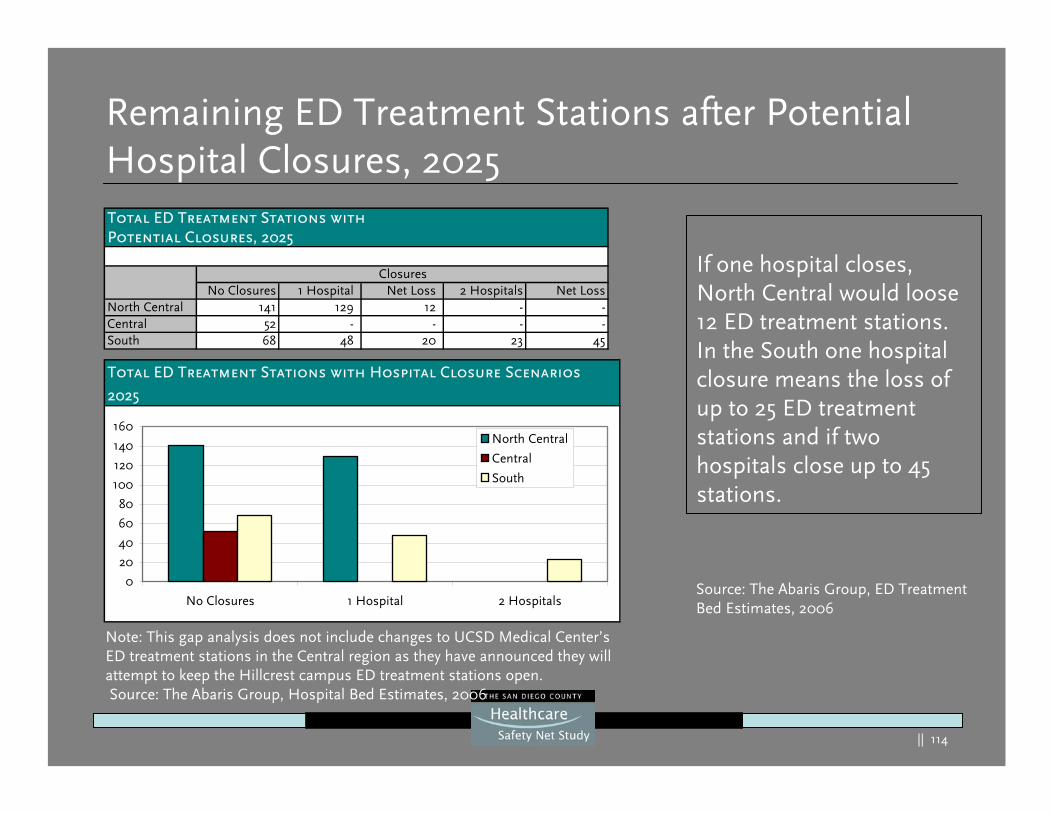
|| 114
If one hospital closes, North Central would loose 12 ED treatment stations. In the South one hospital closure means the loss of up to 25 ED treatment stations and if two hospitals close up to 45 stations.
Remaining ED Treatment Stations after Potential Hospital Closures, 2025
Note: This gap analysis does not include changes to UCSD Medical Center’s ED treatment stations in the Central region as they have announced they will attempt to keep the Hillcrest campus ED treatment stations open.Source: The Abaris Group, Hospital Bed Estimates, 2006
Source: The Abaris Group, ED Treatment Bed Estimates, 2006
Total ED Treatment Stations with Hospital Closure Scenarios
2025
0
20
40
60
80
100
120
140
160
No Closures 1 Hospital 2 Hospitals
North Central
Central
South
Total ED Treatment Stations with Potential Closures, 2025
No Closures 1 Hospital Net Loss 2 Hospitals Net LossNorth Central 141 129 12 - -Central 52 - - - -South 68 48 20 23 45
Closures
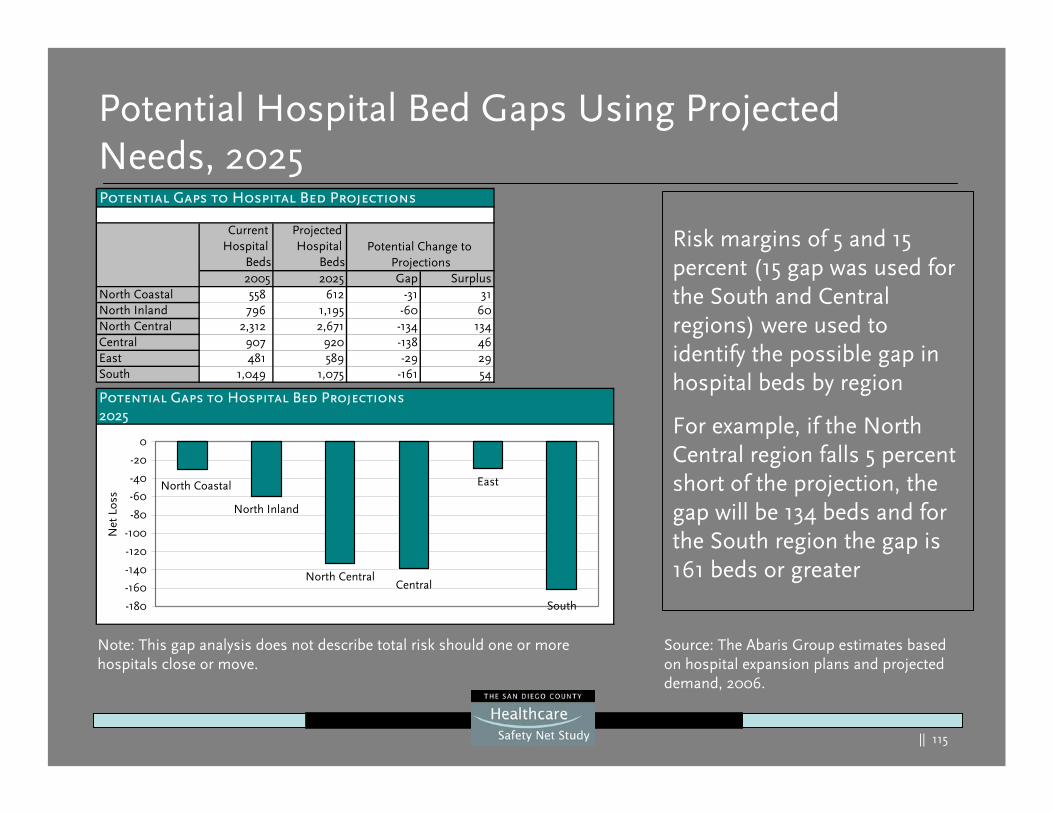
|| 115
Potential Hospital Bed Gaps Using Projected Needs, 2025
Risk margins of 5 and 15 percent (15 gap was used for the South and Central regions) were used to identify the possible gap in hospital beds by region
For example, if the North Central region falls 5 percent short of the projection, the gap will be 134 beds and for the South region the gap is 161 beds or greater
Note: This gap analysis does not describe total risk should one or more hospitals close or move.
Current Hospital
Beds
Projected Hospital
Beds2005 2025 Gap Surplus
North Coastal 558 612 -31 31North Inland 796 1,195 -60 60North Central 2,312 2,671 -134 134Central 907 920 -138 46East 481 589 -29 29South 1,049 1,075 -161 54
Potential Gaps to Hospital Bed Projections
Potential Change to Projections
Potential Gaps to Hospital Bed Projections2025
North Inland
North Central
EastNorth Coastal
Central
South-180
-160
-140
-120
-100
-80
-60
-40
-20
0
Net
Los
s
Source: The Abaris Group estimates based on hospital expansion plans and projected demand, 2006.
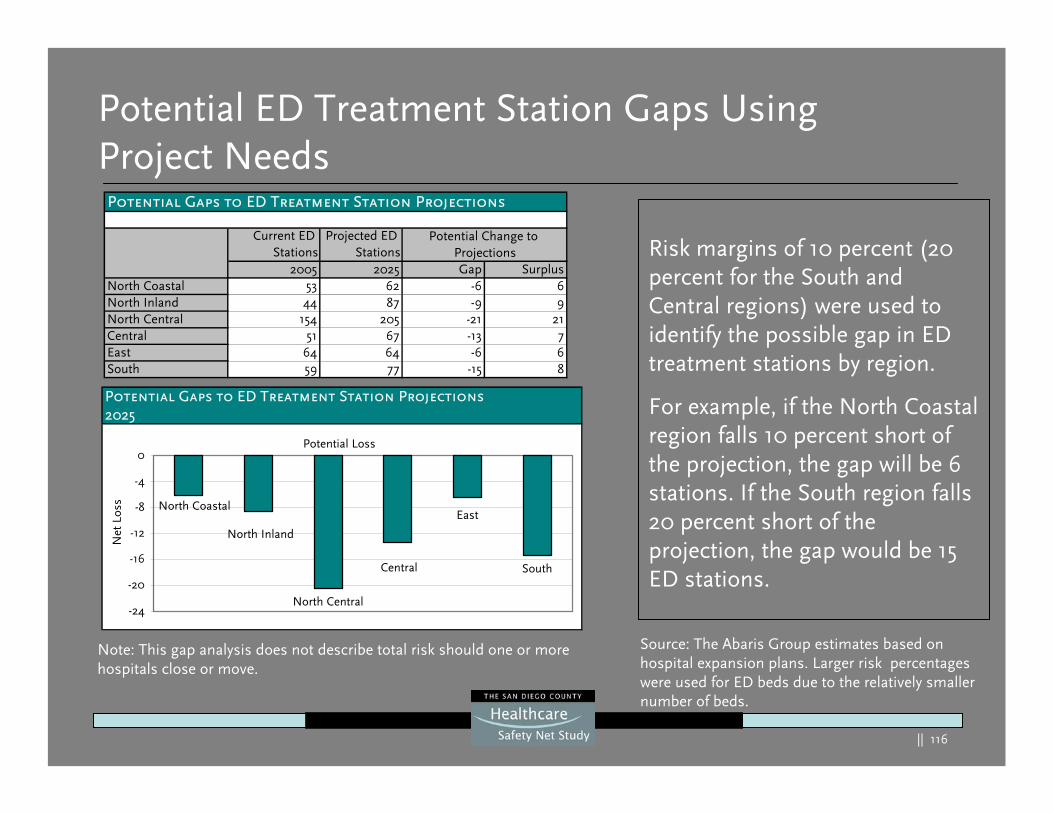
|| 116
Potential ED Treatment Station Gaps Using Project Needs
Risk margins of 10 percent (20 percent for the South and Central regions) were used to identify the possible gap in ED treatment stations by region.
For example, if the North Coastal region falls 10 percent short of the projection, the gap will be 6 stations. If the South region falls 20 percent short of the projection, the gap would be 15 ED stations.
Note: This gap analysis does not describe total risk should one or more hospitals close or move.
Potential Gaps to ED Treatment Station Projections2025
Potential Loss
North Central
South
North Coastal
Central
East
North Inland
-24
-20
-16
-12
-8
-4
0
Net
Los
s
Current ED Stations
Projected ED Stations
2005 2025 Gap SurplusNorth Coastal 53 62 -6 6North Inland 44 87 -9 9North Central 154 205 -21 21Central 51 67 -13 7East 64 64 -6 6South 59 77 -15 8
Potential Gaps to ED Treatment Station Projections
Potential Change to Projections
Source: The Abaris Group estimates based on hospital expansion plans. Larger risk percentages were used for ED beds due to the relatively smaller number of beds.
|| 117
Gap Analysis - UCSD Medical Center’s Inpatient Bed Move
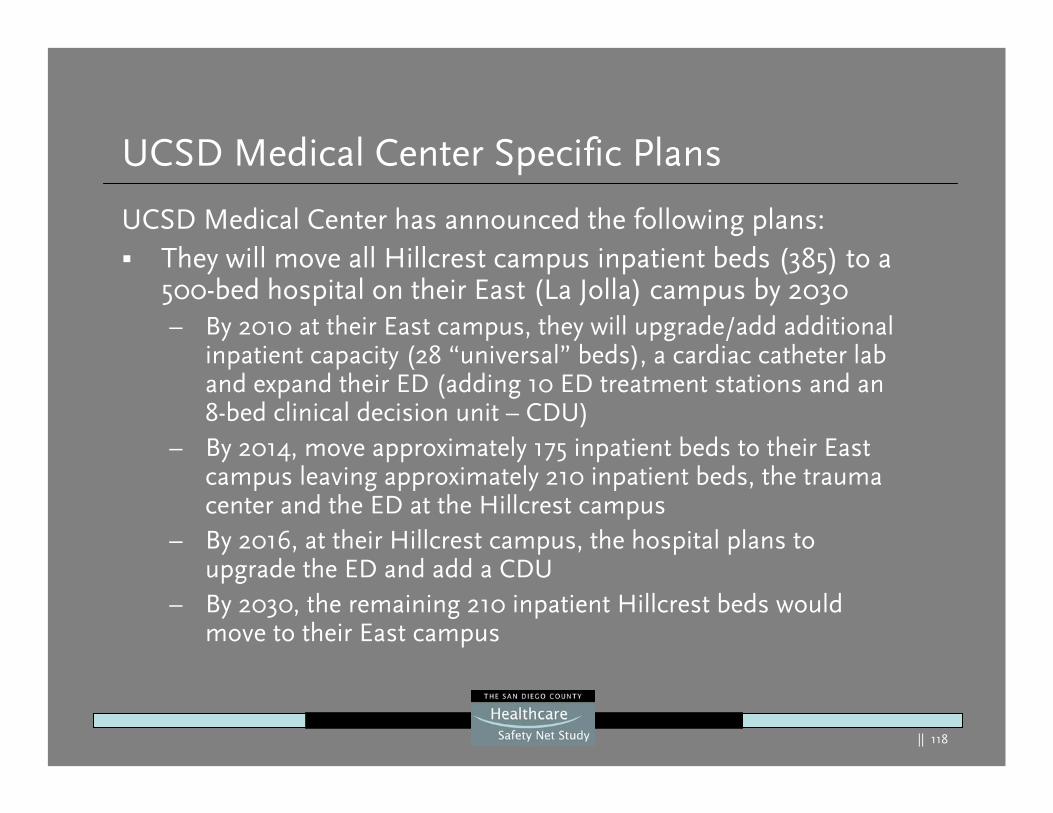
|| 118
UCSD Medical Center Specific Plans
UCSD Medical Center has announced the following plans:They will move all Hillcrest campus inpatient beds (385) to a 500-bed hospital on their East (La Jolla) campus by 2030 – By 2010 at their East campus, they will upgrade/add additional
inpatient capacity (28 “universal” beds), a cardiac catheter lab and expand their ED (adding 10 ED treatment stations and an 8-bed clinical decision unit – CDU)
– By 2014, move approximately 175 inpatient beds to their East campus leaving approximately 210 inpatient beds, the trauma center and the ED at the Hillcrest campus
– By 2016, at their Hillcrest campus, the hospital plans to upgrade the ED and add a CDU
– By 2030, the remaining 210 inpatient Hillcrest beds would move to their East campus
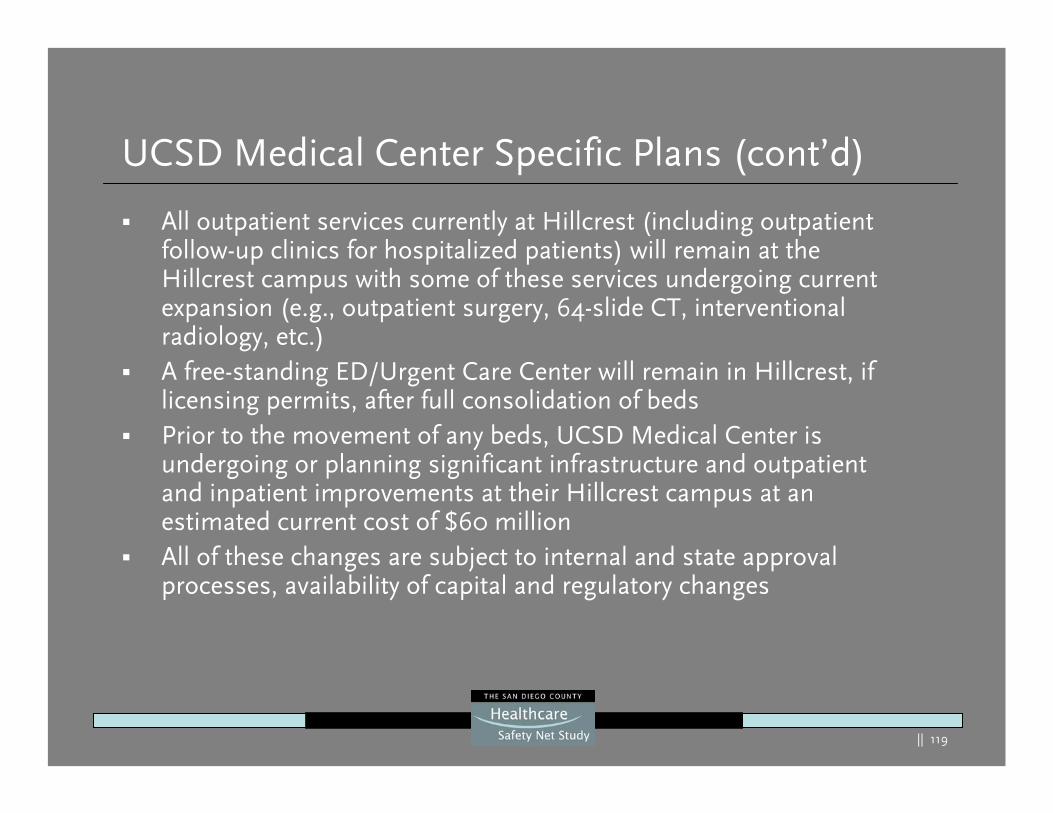
|| 119
UCSD Medical Center Specific Plans (cont’d)
All outpatient services currently at Hillcrest (including outpatient follow-up clinics for hospitalized patients) will remain at the Hillcrest campus with some of these services undergoing current expansion (e.g., outpatient surgery, 64-slide CT, interventional radiology, etc.) A free-standing ED/Urgent Care Center will remain in Hillcrest, if licensing permits, after full consolidation of bedsPrior to the movement of any beds, UCSD Medical Center is undergoing or planning significant infrastructure and outpatientand inpatient improvements at their Hillcrest campus at an estimated current cost of $60 millionAll of these changes are subject to internal and state approval processes, availability of capital and regulatory changes
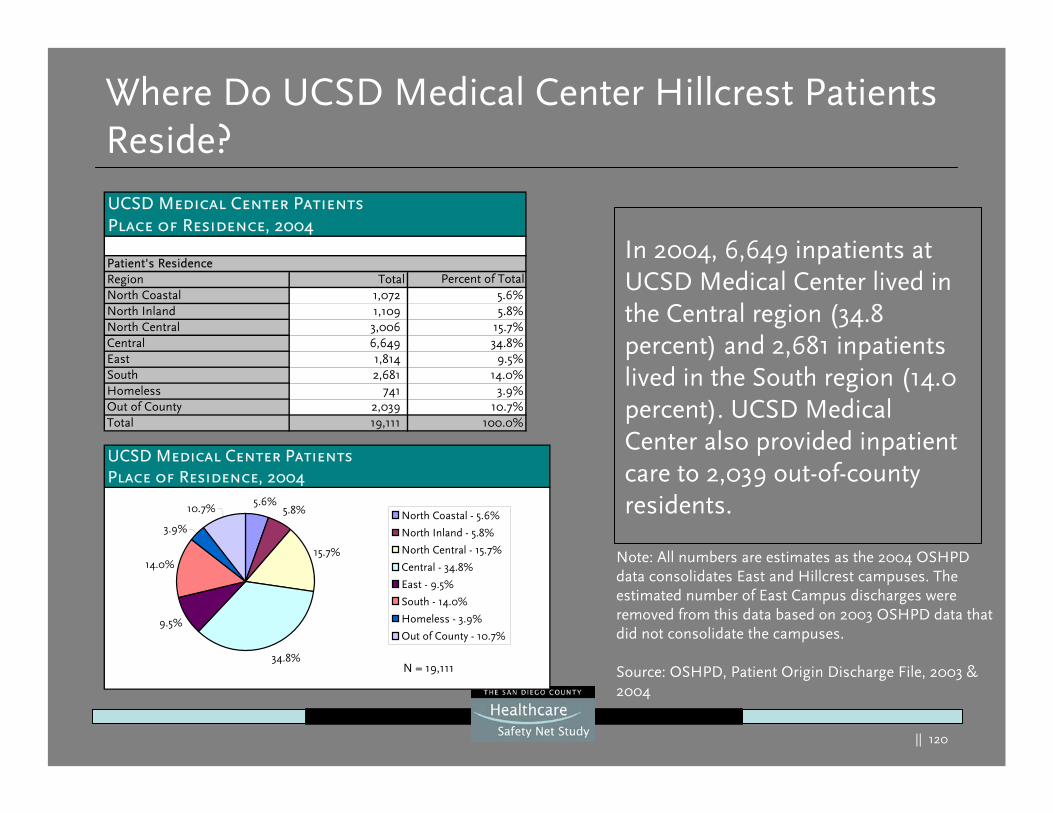
|| 120
Where Do UCSD Medical Center Hillcrest Patients Reside?
In 2004, 6,649 inpatients at UCSD Medical Center lived in the Central region (34.8 percent) and 2,681 inpatients lived in the South region (14.0 percent). UCSD Medical Center also provided inpatient care to 2,039 out-of-county residents.
Note: All numbers are estimates as the 2004 OSHPD data consolidates East and Hillcrest campuses. The estimated number of East Campus discharges were removed from this data based on 2003 OSHPD data that did not consolidate the campuses.
Source: OSHPD, Patient Origin Discharge File, 2003 & 2004
UCSD Medical Center PatientsPlace of Residence, 2004
Patient's ResidenceRegion Total Percent of TotalNorth Coastal 1,072 5.6%North Inland 1,109 5.8%North Central 3,006 15.7%Central 6,649 34.8%East 1,814 9.5%South 2,681 14.0%Homeless 741 3.9%Out of County 2,039 10.7%Total 19,111 100.0%
UCSD Medical Center PatientsPlace of Residence, 2004
5.6%5.8%
15.7%
34.8%
9.5%
14.0%
3.9%
10.7%North Coastal - 5.6%
North Inland - 5.8%
North Central - 15.7%
Central - 34.8%
East - 9.5%
South - 14.0%
Homeless - 3.9%
Out of County - 10.7%
N = 19,111
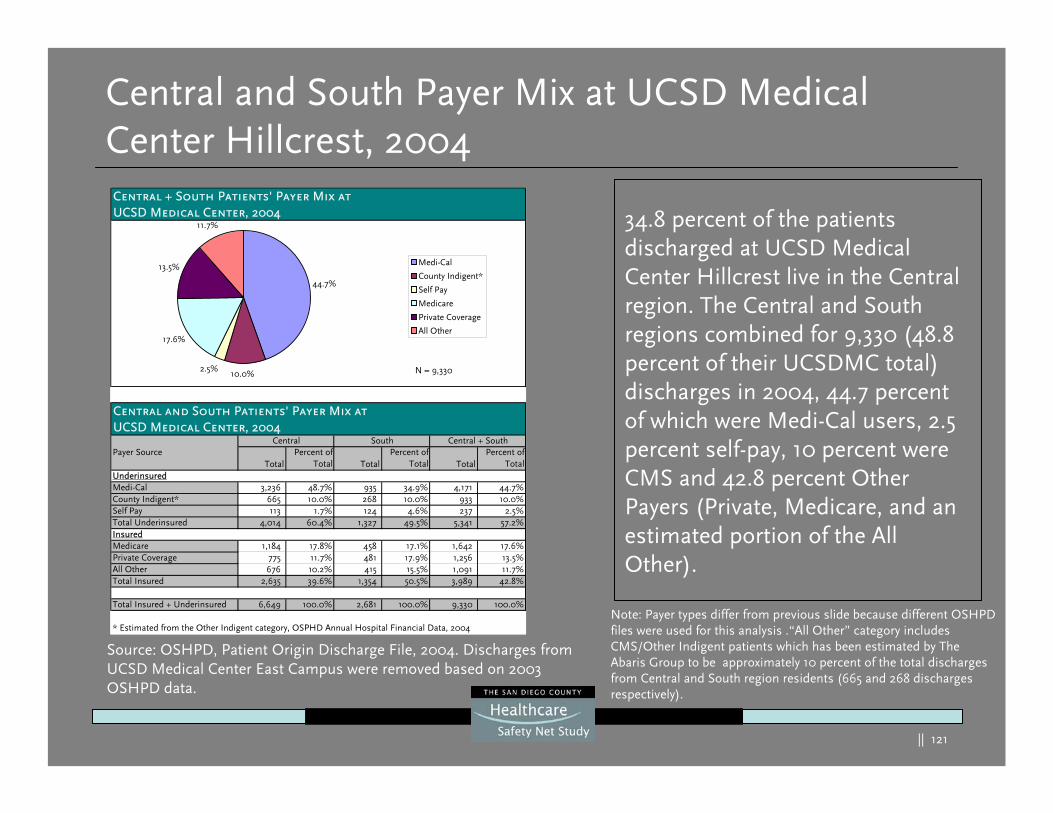
|| 121
Central and South Payer Mix at UCSD Medical Center Hillcrest, 2004
34.8 percent of the patients discharged at UCSD Medical Center Hillcrest live in the Central region. The Central and South regions combined for 9,330 (48.8 percent of their UCSDMC total) discharges in 2004, 44.7 percent of which were Medi-Cal users, 2.5 percent self-pay, 10 percent were CMS and 42.8 percent Other Payers (Private, Medicare, and an estimated portion of the All Other).
Source: OSHPD, Patient Origin Discharge File, 2004. Discharges from UCSD Medical Center East Campus were removed based on 2003 OSHPD data.
Note: Payer types differ from previous slide because different OSHPD files were used for this analysis .“All Other” category includes CMS/Other Indigent patients which has been estimated by The Abaris Group to be approximately 10 percent of the total discharges from Central and South region residents (665 and 268 discharges respectively).
Central + South Patients' Payer Mix atUCSD Medical Center, 2004
Central and South Patients' Payer Mix atUCSD Medical Center, 2004
TotalPercent of
Total TotalPercent of
Total TotalPercent of
TotalUnderinsuredMedi-Cal 3,236 48.7% 935 34.9% 4,171 44.7%County Indigent* 665 10.0% 268 10.0% 933 10.0%Self Pay 113 1.7% 124 4.6% 237 2.5%Total Underinsured 4,014 60.4% 1,327 49.5% 5,341 57.2%InsuredMedicare 1,184 17.8% 458 17.1% 1,642 17.6%Private Coverage 775 11.7% 481 17.9% 1,256 13.5%All Other 676 10.2% 415 15.5% 1,091 11.7%Total Insured 2,635 39.6% 1,354 50.5% 3,989 42.8%
Total Insured + Underinsured 6,649 100.0% 2,681 100.0% 9,330 100.0%
* Estimated from the Other Indigent category, OSPHD Annual Hospital Financial Data, 2004
Central South Central + SouthPayer Source
44.7%
2.5%
17.6%
13.5%
11.7%
10.0%
Medi-Cal
County Indigent*
Self Pay
Medicare
Private Coverage
All Other
N = 9,330
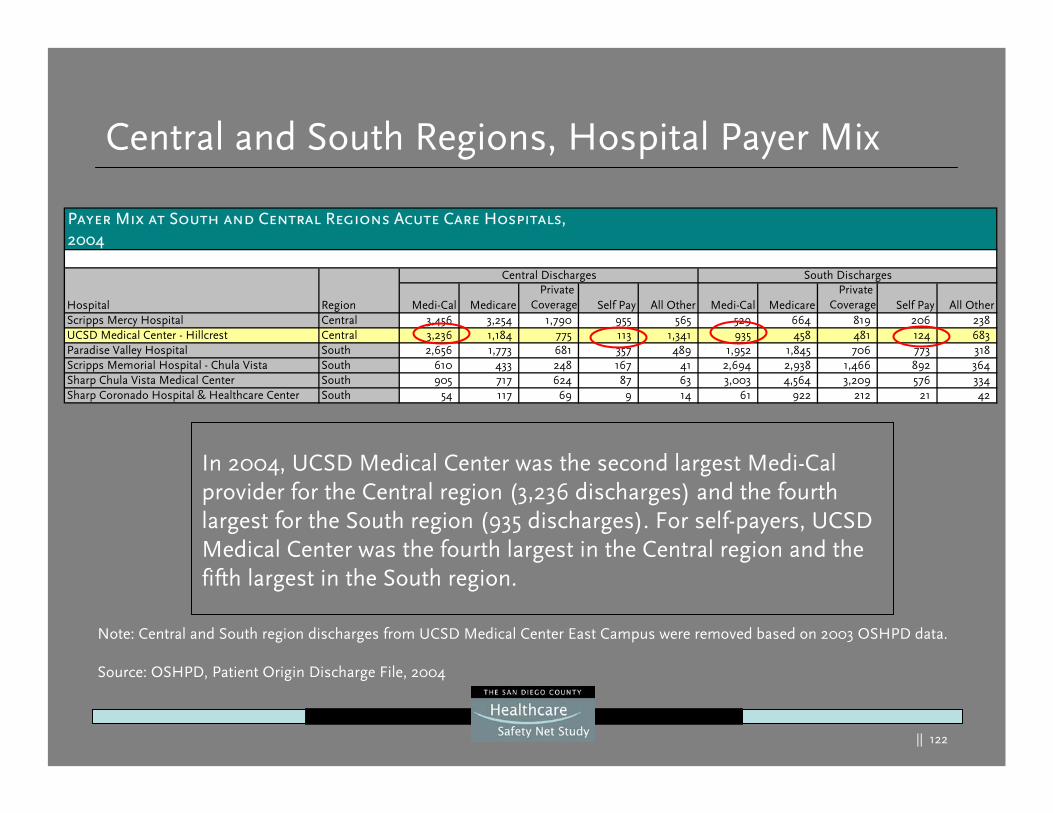
|| 122
Payer Mix at South and Central Regions Acute Care Hospitals,2004
Hospital Region Medi-Cal MedicarePrivate
Coverage Self Pay All Other Medi-Cal MedicarePrivate
Coverage Self Pay All OtherScripps Mercy Hospital Central 3,456 3,254 1,790 955 565 529 664 819 206 238 UCSD Medical Center - Hillcrest Central 3,236 1,184 775 113 1,341 935 458 481 124 683 Paradise Valley Hospital South 2,656 1,773 681 357 489 1,952 1,845 706 773 318 Scripps Memorial Hospital - Chula Vista South 610 433 248 167 41 2,694 2,938 1,466 892 364 Sharp Chula Vista Medical Center South 905 717 624 87 63 3,003 4,564 3,209 576 334 Sharp Coronado Hospital & Healthcare Center South 54 117 69 9 14 61 922 212 21 42
Central Discharges South Discharges
Central and South Regions, Hospital Payer Mix
Note: Central and South region discharges from UCSD Medical Center East Campus were removed based on 2003 OSHPD data.
Source: OSHPD, Patient Origin Discharge File, 2004
In 2004, UCSD Medical Center was the second largest Medi-Cal provider for the Central region (3,236 discharges) and the fourth largest for the South region (935 discharges). For self-payers, UCSD Medical Center was the fourth largest in the Central region and the fifth largest in the South region.
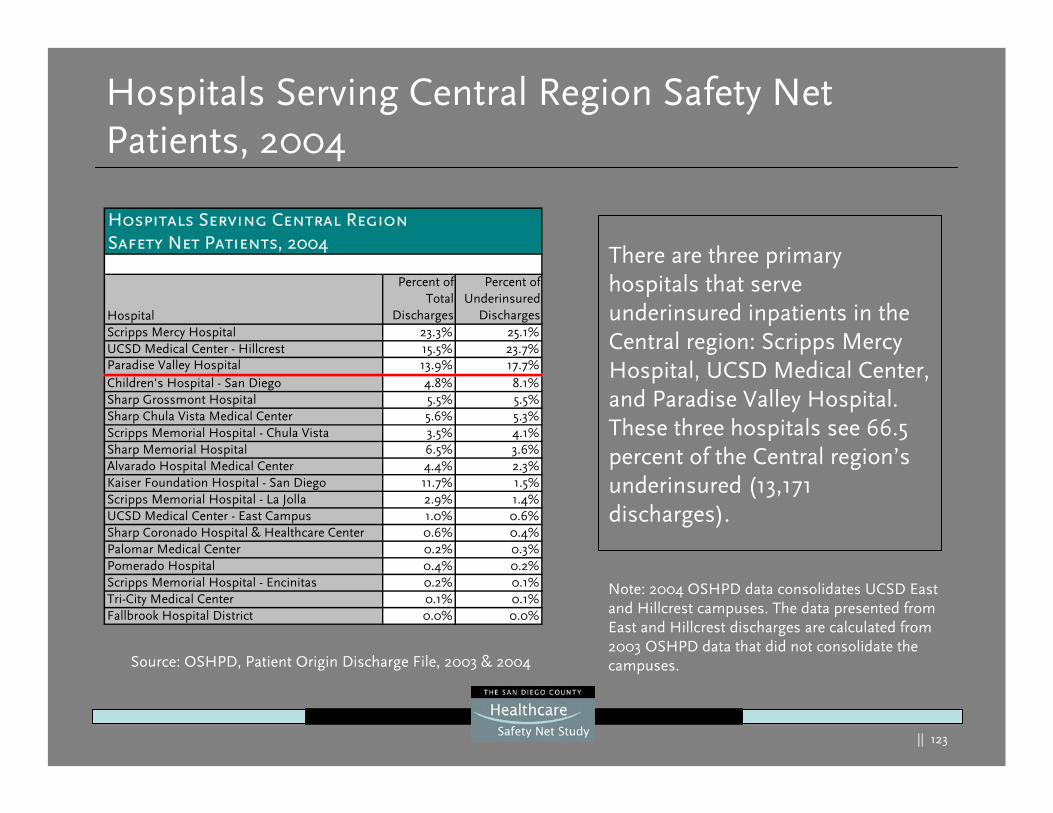
|| 123
There are three primary hospitals that serve underinsured inpatients in the Central region: Scripps Mercy Hospital, UCSD Medical Center, and Paradise Valley Hospital. These three hospitals see 66.5 percent of the Central region’s underinsured (13,171 discharges).
Hospitals Serving Central Region Safety Net Patients, 2004
Hospitals Serving Central RegionSafety Net Patients, 2004
Hospital
Percent ofTotal
Discharges
Percent ofUnderinsured
DischargesScripps Mercy Hospital 23.3% 25.1%UCSD Medical Center - Hillcrest 15.5% 23.7%Paradise Valley Hospital 13.9% 17.7%Children's Hospital - San Diego 4.8% 8.1%Sharp Grossmont Hospital 5.5% 5.5%Sharp Chula Vista Medical Center 5.6% 5.3%Scripps Memorial Hospital - Chula Vista 3.5% 4.1%Sharp Memorial Hospital 6.5% 3.6%Alvarado Hospital Medical Center 4.4% 2.3%Kaiser Foundation Hospital - San Diego 11.7% 1.5%Scripps Memorial Hospital - La Jolla 2.9% 1.4%UCSD Medical Center - East Campus 1.0% 0.6%Sharp Coronado Hospital & Healthcare Center 0.6% 0.4%Palomar Medical Center 0.2% 0.3%Pomerado Hospital 0.4% 0.2%Scripps Memorial Hospital - Encinitas 0.2% 0.1%Tri-City Medical Center 0.1% 0.1%Fallbrook Hospital District 0.0% 0.0%
Note: 2004 OSHPD data consolidates UCSD East and Hillcrest campuses. The data presented from East and Hillcrest discharges are calculated from 2003 OSHPD data that did not consolidate the campuses.Source: OSHPD, Patient Origin Discharge File, 2003 & 2004

|| 124
Hospitals Serving South Region Safety Net Patients, 2004
There are three primary hospitals that serve underinsured inpatients in the South region. They are, Scripps Hospital in Chula Vista, Sharp Chula Vista Medical Center, and Paradise Valley Hospital. Combined these three hospitals see 66.5 percent of the South region’s underinsured (10,906 discharges).
Hospitals Serving South RegionSafety Net Patients, 2004
Hospital
Percent ofTotal
Discharges
Percent ofUnderinsured
DischargesScripps Memorial Hospital - Chula Vista 19.0% 24.1%Sharp Chula Vista Medical Center 26.6% 23.9%Paradise Valley Hospital 12.7% 18.6%UCSD Medical Center - Hillcrest 6.1% 10.6%Children's Hospital - San Diego 4.3% 7.4%Scripps Mercy Hospital 5.6% 5.9%Alvarado Hospital Medical Center 1.4% 2.4%Kaiser Foundation Hospital - San Diego 12.7% 1.5%Sharp Grossmont Hospital 1.6% 1.5%Sharp Memorial Hospital 3.7% 1.4%Scripps Memorial Hospital - La Jolla 2.3% 1.1%Sharp Coronado Hospital & Healthcare Center 2.9% 0.8%UCSD Medical Center - East Campus 0.7% 0.5%Palomar Medical Center 0.1% 0.2%Pomerado Hospital 0.2% 0.1%Tri-City Medical Center 0.1% 0.1%Scripps Memorial Hospital - Encinitas 0.1% 0.0%Fallbrook Hospital District 0.0% 0.0%
Note: 2004 OSHPD data consolidates UCSD East and Hillcrest campuses. The data presented from East and Hillcrest discharges are calculated from 2003 OSHPD data that did not consolidate the campuses.Source: OSHPD, Patient Origin Discharge File, 2003 & 2004

|| 125
Patient Days at UCSD Medical Center, 2015
By 2015, there will be an estimated 54,368 patient days from UCSD Medical Center’s Hillcrest campus that will need to find treatment elsewhere. The number of available (unoccupied) beds by region reflect the available capacity if all of the remaining UCSD patient days still received care in the Central region. which is a conservative assumption as UCSD plans and will have the capacity to admit all current Hillcrest patients at their East campus by 2030. The number of available bed days are based on current hospital bed expansion plans, which call for 751 beds to be built by 2015.
Source: The Abaris Group, 2006. Estimates based on OSHPD and individual hospital data and interviews.
Projected Patient Days Affected by UCSD Medical Center Move2015
A B
Region
UCSDMC Patient Days Based on 385 Beds @
85%
UCSDMC Patient Days Based on 210 Beds @
85%Difference
(A - B)
Regional Bed Occupancy
Rates
Unused Available Bed
DaysNorth Coastal 6,567 3,580 2,987 65.7% 38,801 North Inland 6,820 3,718 3,102 58.0% 116,266 North Central 18,395 10,027 8,368 71.4% 129,317 Central 43,033 23,458 19,575 94.3% (21,330) East 11,426 6,229 5,198 78.1% 13,763 South 16,587 9,042 7,545 91.1% (22,324) Other 16,692 9,099 7,593 - -Total 119,520 65,153 54,368 74.3% 254,494
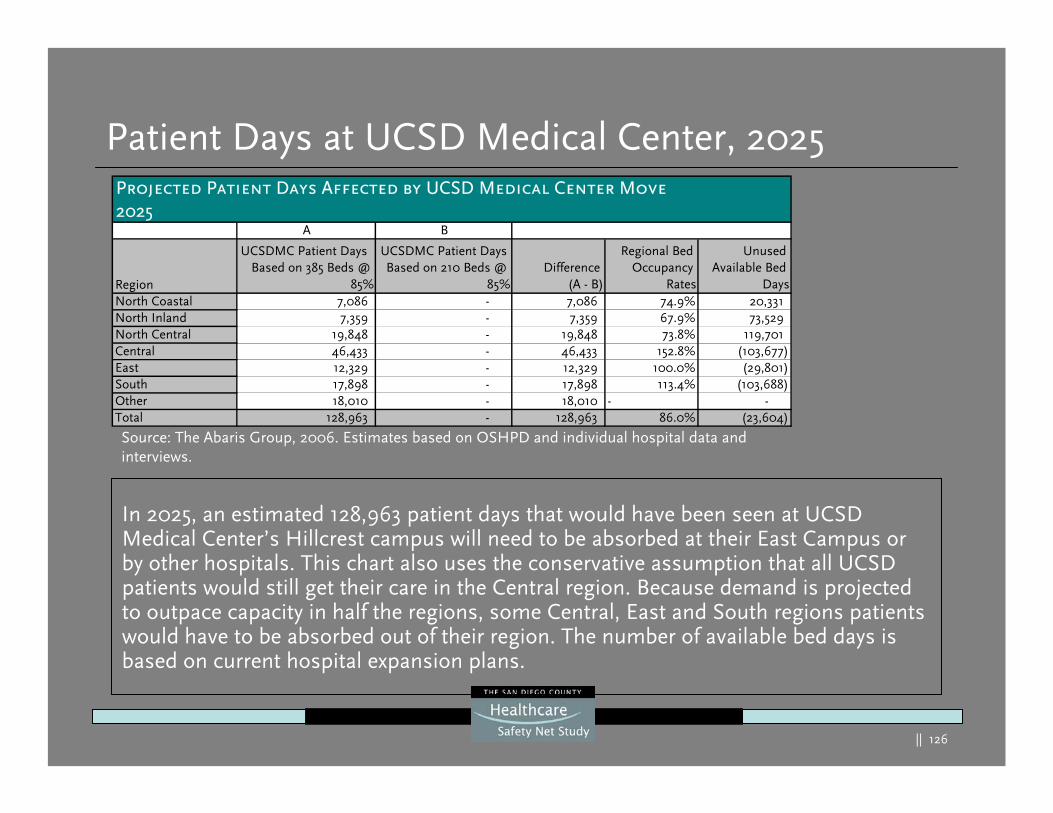
|| 126
Patient Days at UCSD Medical Center, 2025
In 2025, an estimated 128,963 patient days that would have been seen at UCSD Medical Center’s Hillcrest campus will need to be absorbed at their East Campus or by other hospitals. This chart also uses the conservative assumption that all UCSD patients would still get their care in the Central region. Because demand is projected to outpace capacity in half the regions, some Central, East and South regions patients would have to be absorbed out of their region. The number of available bed days is based on current hospital expansion plans.
Source: The Abaris Group, 2006. Estimates based on OSHPD and individual hospital data and interviews.
Projected Patient Days Affected by UCSD Medical Center Move2025
A B
Region
UCSDMC Patient Days Based on 385 Beds @
85%
UCSDMC Patient Days Based on 210 Beds @
85%Difference
(A - B)
Regional Bed Occupancy
Rates
Unused Available Bed
DaysNorth Coastal 7,086 - 7,086 74.9% 20,331 North Inland 7,359 - 7,359 67.9% 73,529 North Central 19,848 - 19,848 73.8% 119,701 Central 46,433 - 46,433 152.8% (103,677) East 12,329 - 12,329 100.0% (29,801) South 17,898 - 17,898 113.4% (103,688) Other 18,010 - 18,010 - - Total 128,963 - 128,963 86.0% (23,604)
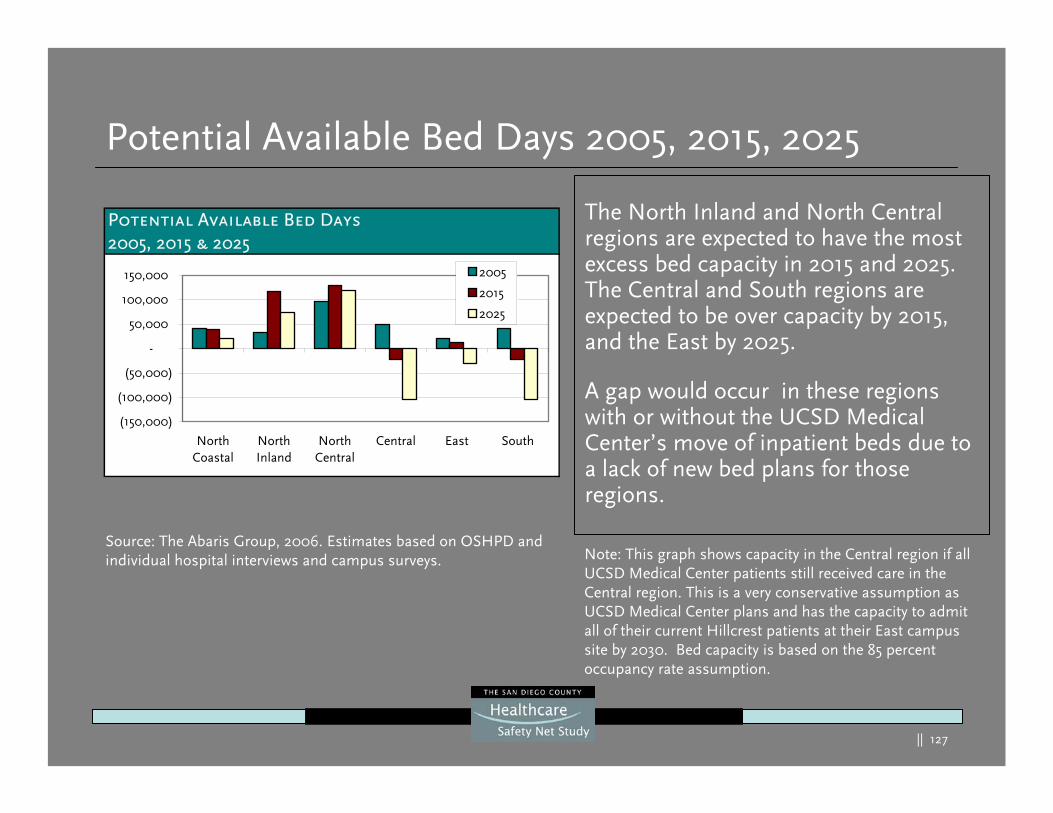
|| 127
Potential Available Bed Days 2005, 2015, 2025
The North Inland and North Central regions are expected to have the most excess bed capacity in 2015 and 2025. The Central and South regions are expected to be over capacity by 2015, and the East by 2025.
A gap would occur in these regions with or without the UCSD Medical Center’s move of inpatient beds due to a lack of new bed plans for those regions.
Note: This graph shows capacity in the Central region if all UCSD Medical Center patients still received care in the Central region. This is a very conservative assumption as UCSD Medical Center plans and has the capacity to admit all of their current Hillcrest patients at their East campus site by 2030. Bed capacity is based on the 85 percent occupancy rate assumption.
Source: The Abaris Group, 2006. Estimates based on OSHPD and individual hospital interviews and campus surveys.
Potential Available Bed Days2005, 2015 & 2025
(150,000)
(100,000)
(50,000)
-
50,000
100,000
150,000
NorthCoastal
NorthInland
NorthCentral
Central East South
2005
2015
2025

|| 128
Medicare, Medi-Cal & Spending Gaps
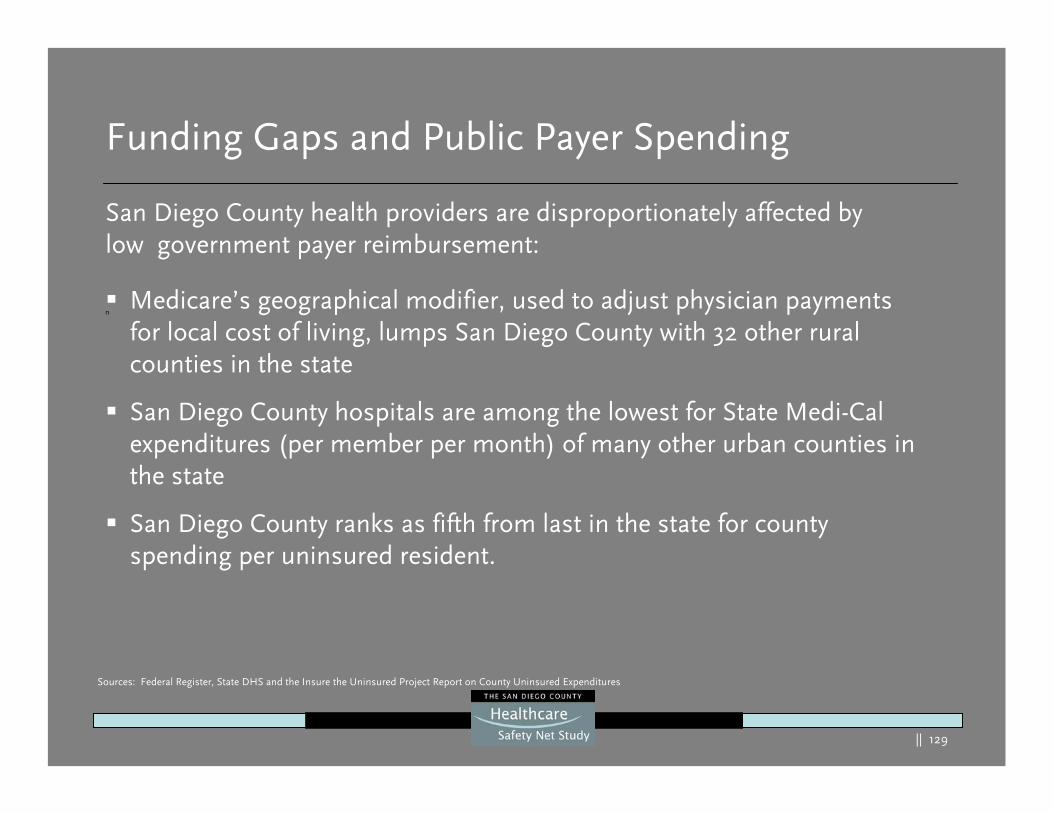
|| 129
Funding Gaps and Public Payer Spending
Medicare’s geographical modifier, used to adjust physician payments for local cost of living, lumps San Diego County with 32 other rural counties in the state
San Diego County hospitals are among the lowest for State Medi-Cal expenditures (per member per month) of many other urban counties in the state
San Diego County ranks as fifth from last in the state for county spending per uninsured resident.
San Diego County health providers are disproportionately affected by low government payer reimbursement:
n
Sources: Federal Register, State DHS and the Insure the Uninsured Project Report on County Uninsured Expenditures
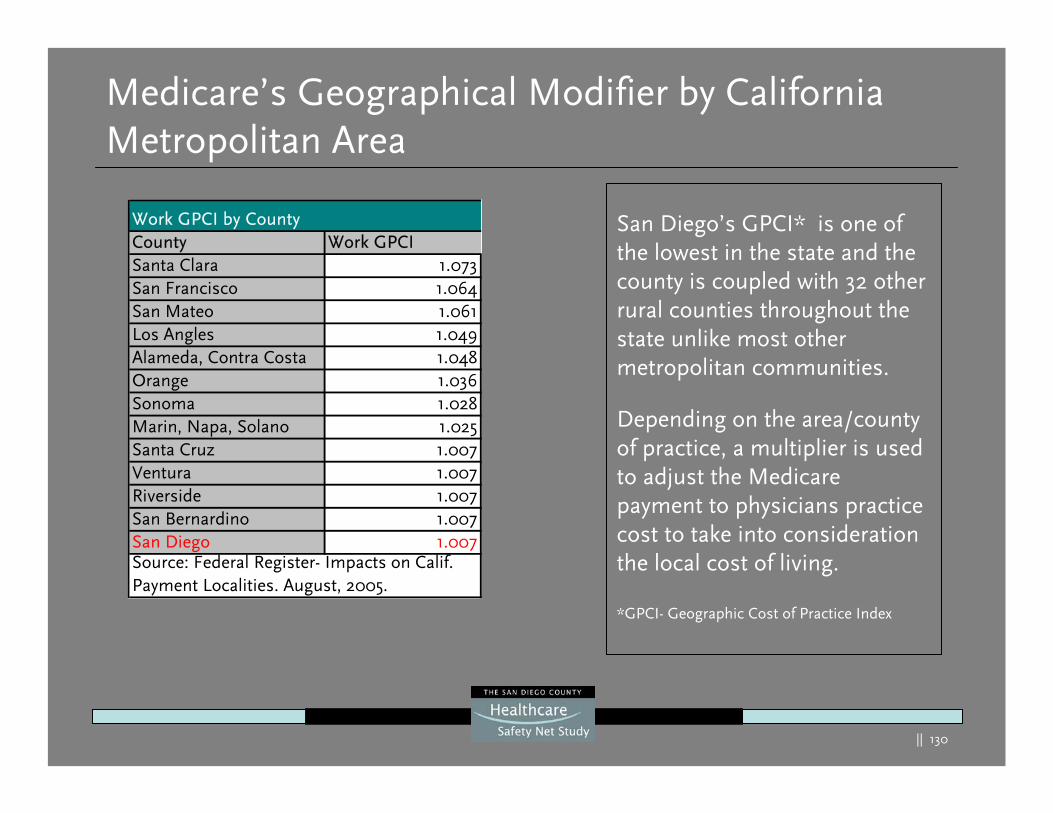
|| 130
Medicare’s Geographical Modifier by California Metropolitan Area
San Diego’s GPCI* is one of the lowest in the state and the county is coupled with 32 other rural counties throughout the state unlike most other metropolitan communities.
Depending on the area/county of practice, a multiplier is used to adjust the Medicare payment to physicians practice cost to take into consideration the local cost of living.
*GPCI- Geographic Cost of Practice Index
Work GPCI by CountyCounty Work GPCISanta Clara 1.073San Francisco 1.064San Mateo 1.061Los Angles 1.049Alameda, Contra Costa 1.048Orange 1.036Sonoma 1.028Marin, Napa, Solano 1.025Santa Cruz 1.007Ventura 1.007Riverside 1.007San Bernardino 1.007San Diego 1.007Source: Federal Register- Impacts on Calif. Payment Localities. August, 2005.
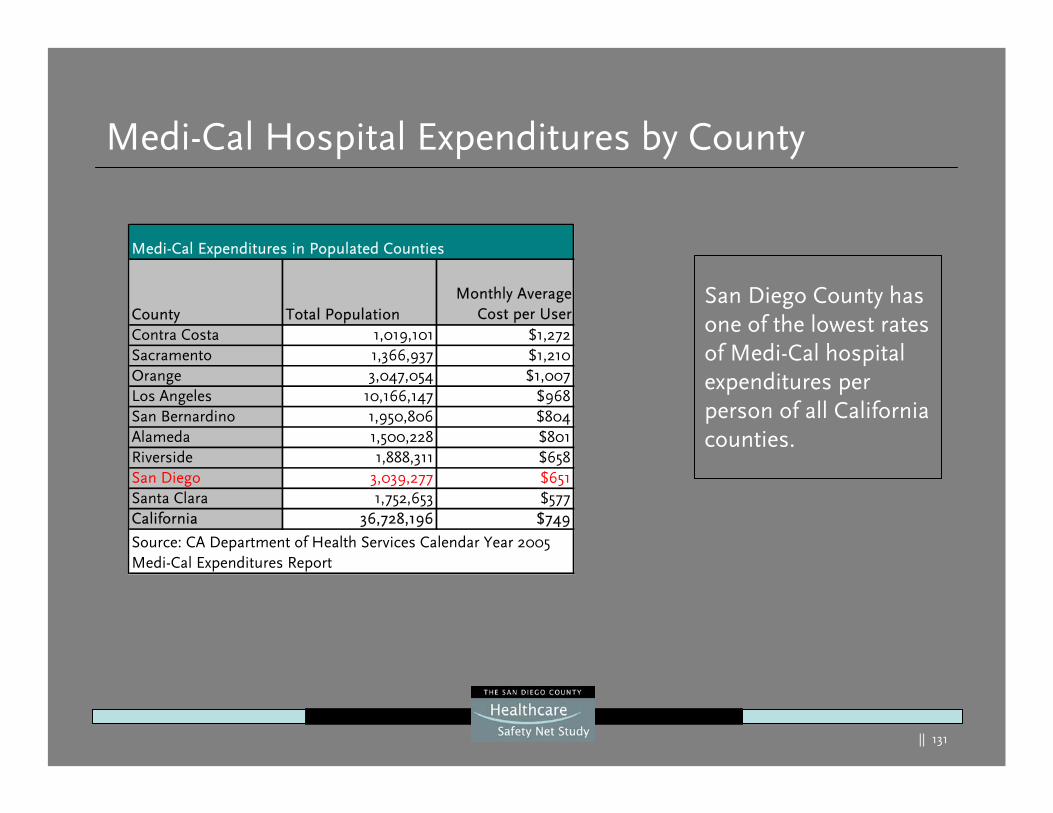
|| 131
Medi-Cal Hospital Expenditures by County
San Diego County has one of the lowest rates of Medi-Cal hospital expenditures per person of all California counties.
Medi-Cal Expenditures in Populated Counties
County Total Population Monthly Average
Cost per UserContra Costa 1,019,101 $1,272Sacramento 1,366,937 $1,210Orange 3,047,054 $1,007Los Angeles 10,166,147 $968San Bernardino 1,950,806 $804Alameda 1,500,228 $801Riverside 1,888,311 $658San Diego 3,039,277 $651Santa Clara 1,752,653 $577California 36,728,196 $749
Source: CA Department of Health Services Calendar Year 2005 Medi-Cal Expenditures Report
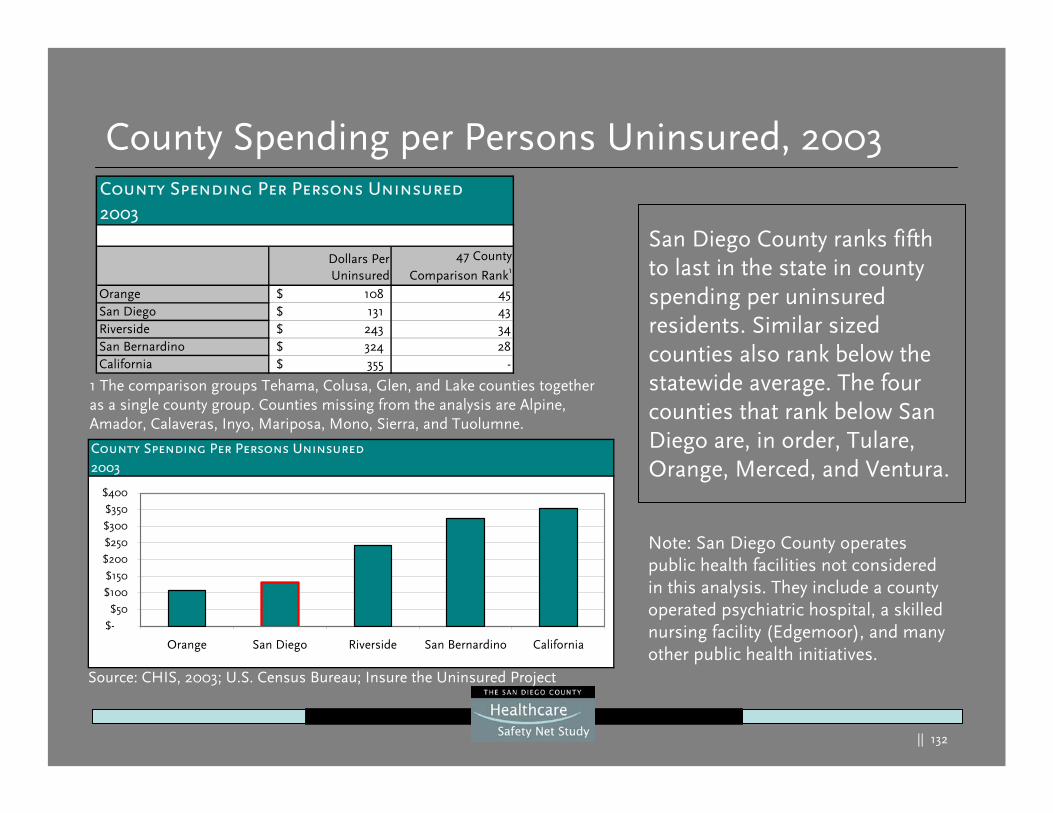
|| 132
County Spending per Persons Uninsured, 2003
San Diego County ranks fifth to last in the state in county spending per uninsured residents. Similar sized counties also rank below the statewide average. The four counties that rank below San Diego are, in order, Tulare, Orange, Merced, and Ventura.
Source: CHIS, 2003; U.S. Census Bureau; Insure the Uninsured Project
County Spending Per Persons Uninsured2003
$-
$50
$100
$150
$200
$250
$300
$350
$400
Orange San Diego Riverside San Bernardino California
1 The comparison groups Tehama, Colusa, Glen, and Lake counties together as a single county group. Counties missing from the analysis are Alpine, Amador, Calaveras, Inyo, Mariposa, Mono, Sierra, and Tuolumne.
Note: San Diego County operates public health facilities not considered in this analysis. They include a county operated psychiatric hospital, a skilled nursing facility (Edgemoor), and many other public health initiatives.
County Spending Per Persons Uninsured2003
Dollars PerUninsured
47 County
Comparison Rank1
Orange 108$ 45San Diego 131$ 43Riverside 243$ 34San Bernardino 324$ 28California 355$ -
|| 133
County Spending per Uninsured, Methodology
The number of uninsured in each county was calculated using 2003 California Health Interview Survey (CHIS) results and 2003 U.S. Census Bureau population estimates. The Insure the Uninsured Project staff acquired 2003 data on total county dollars spent on the uninsured. With this total and the total number of uninsured, the county spending per uninsured resident could be calculated.
Total County Spending on Uninsured Total Number of Uninsured Residents = County Spending Per
Uninsured

|| 134
Input From Stakeholders and Consumers
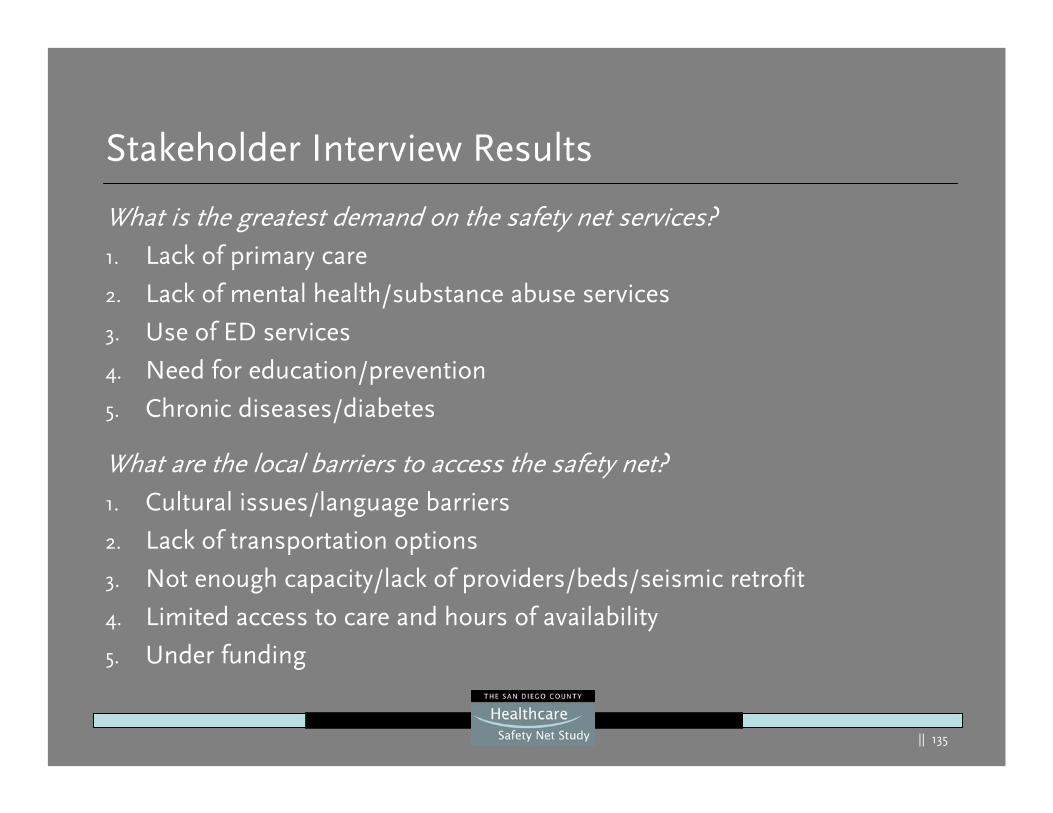
|| 135
What is the greatest demand on the safety net services? 1. Lack of primary care
2. Lack of mental health/substance abuse services
3. Use of ED services
4. Need for education/prevention
5. Chronic diseases/diabetes
What are the local barriers to access the safety net? 1. Cultural issues/language barriers
2. Lack of transportation options
3. Not enough capacity/lack of providers/beds/seismic retrofit
4. Limited access to care and hours of availability
5. Under funding
Stakeholder Interview Results
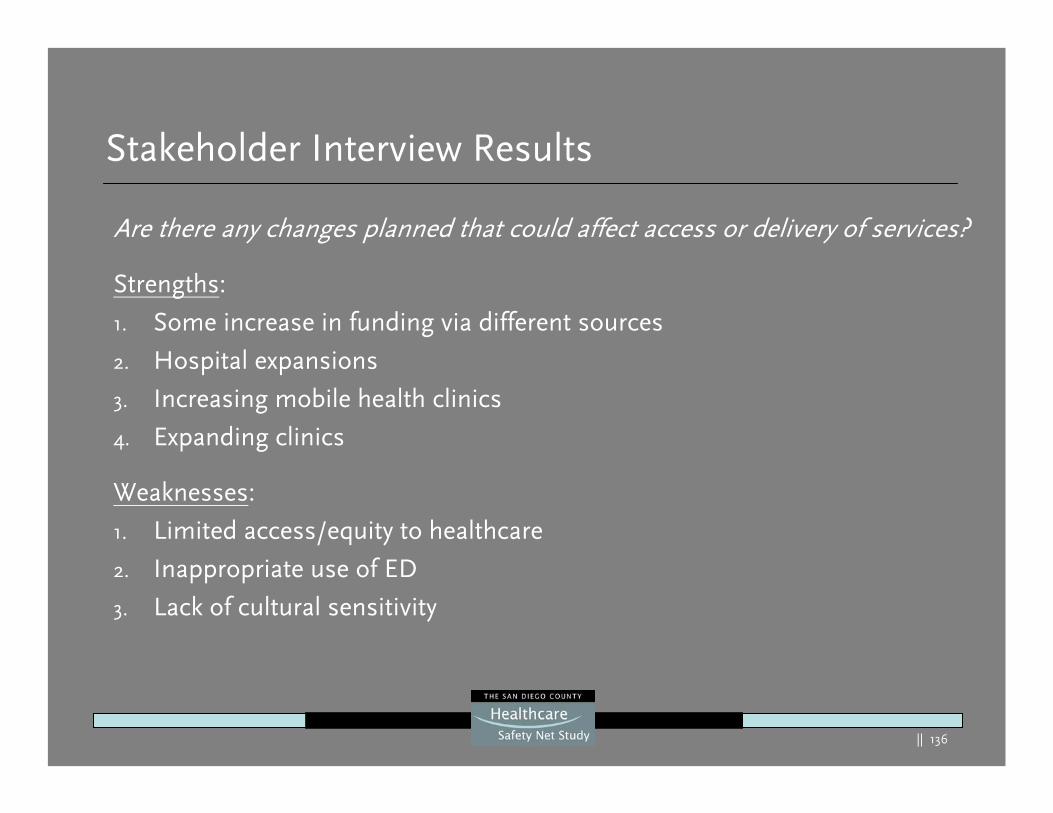
|| 136
Are there any changes planned that could affect access or delivery of services?
Strengths:
1. Some increase in funding via different sources
2. Hospital expansions
3. Increasing mobile health clinics
4. Expanding clinics
Weaknesses:
1. Limited access/equity to healthcare
2. Inappropriate use of ED
3. Lack of cultural sensitivity
Stakeholder Interview Results
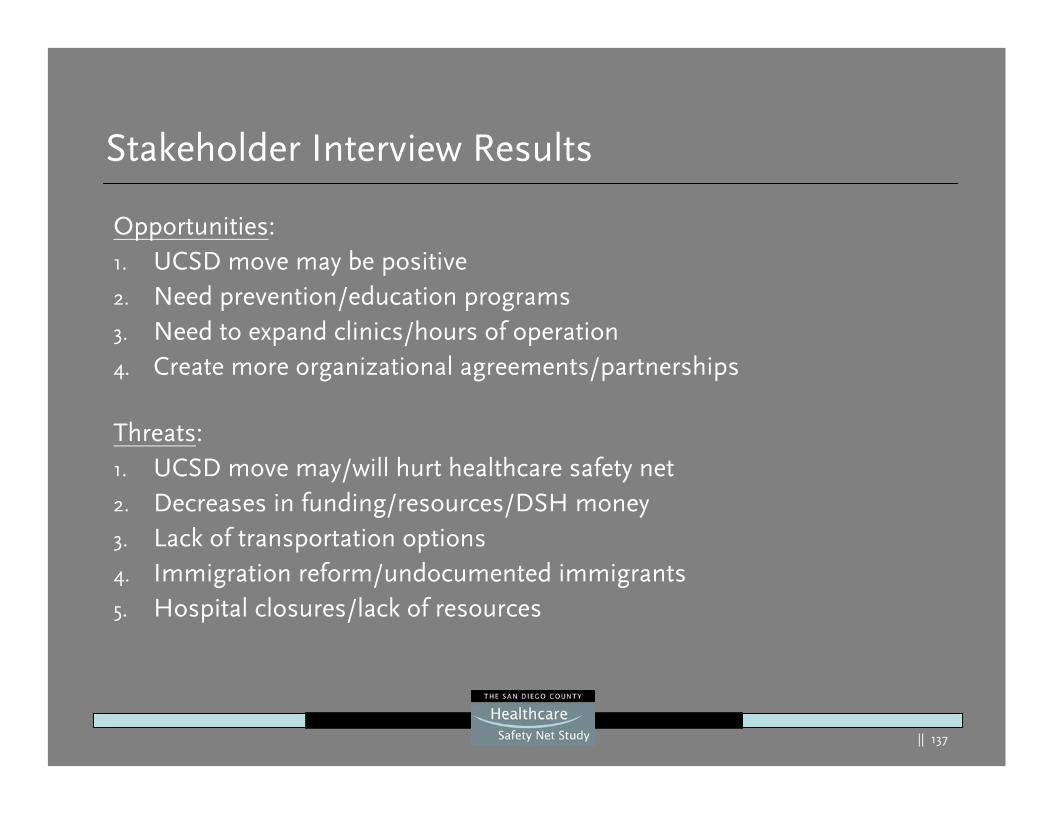
|| 137
Opportunities: 1. UCSD move may be positive 2. Need prevention/education programs 3. Need to expand clinics/hours of operation 4. Create more organizational agreements/partnerships
Threats: 1. UCSD move may/will hurt healthcare safety net 2. Decreases in funding/resources/DSH money3. Lack of transportation options 4. Immigration reform/undocumented immigrants 5. Hospital closures/lack of resources
Stakeholder Interview Results
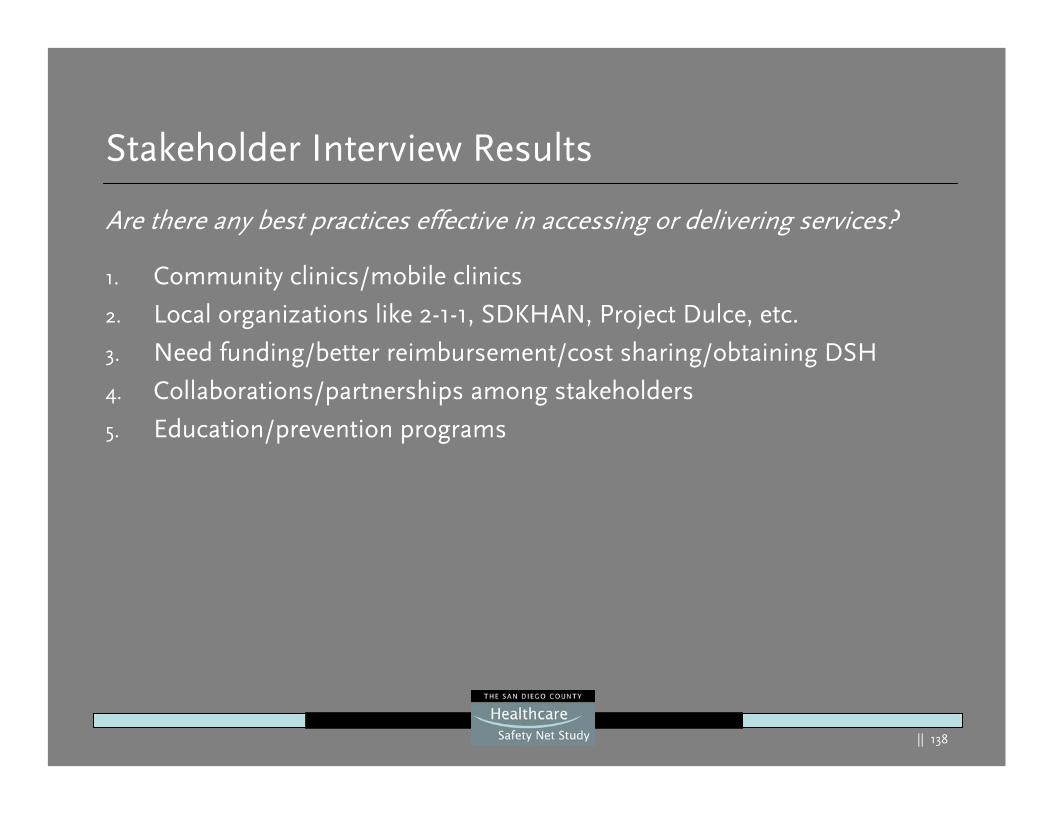
|| 138
Stakeholder Interview Results
Are there any best practices effective in accessing or delivering services?
1. Community clinics/mobile clinics
2. Local organizations like 2-1-1, SDKHAN, Project Dulce, etc.
3. Need funding/better reimbursement/cost sharing/obtaining DSH
4. Collaborations/partnerships among stakeholders
5. Education/prevention programs
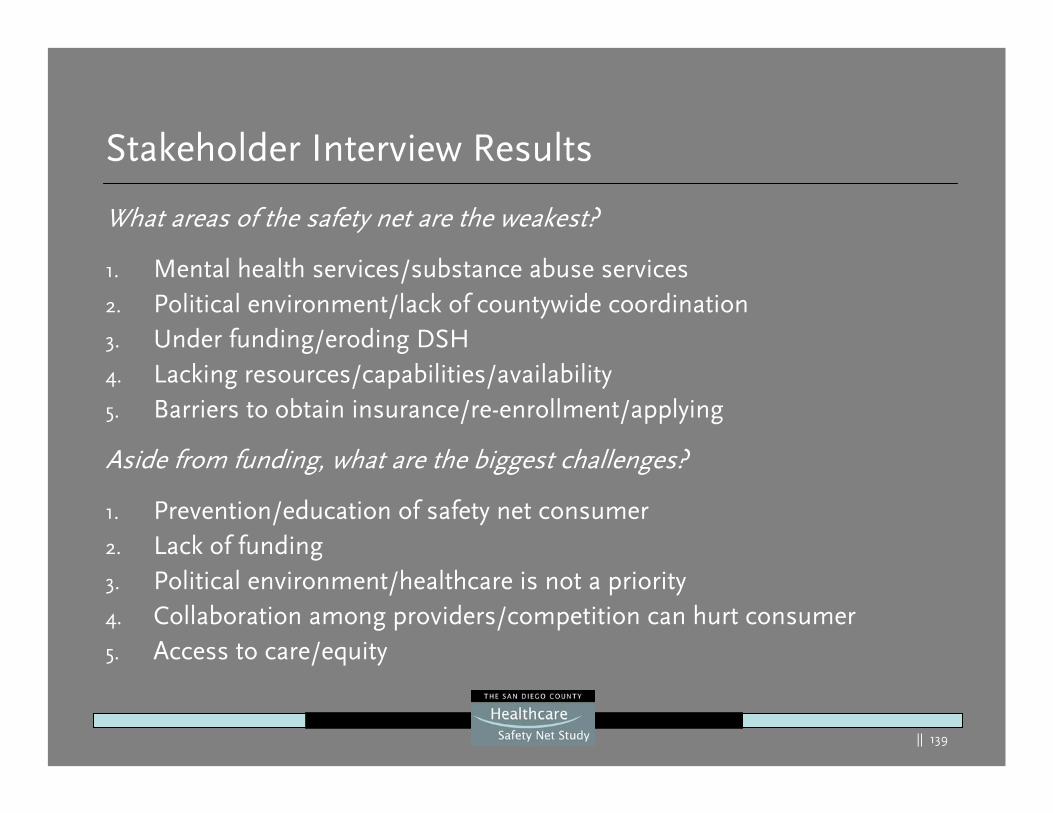
|| 139
Stakeholder Interview Results
What areas of the safety net are the weakest?
1. Mental health services/substance abuse services 2. Political environment/lack of countywide coordination 3. Under funding/eroding DSH 4. Lacking resources/capabilities/availability 5. Barriers to obtain insurance/re-enrollment/applying
Aside from funding, what are the biggest challenges?
1. Prevention/education of safety net consumer2. Lack of funding3. Political environment/healthcare is not a priority 4. Collaboration among providers/competition can hurt consumer 5. Access to care/equity
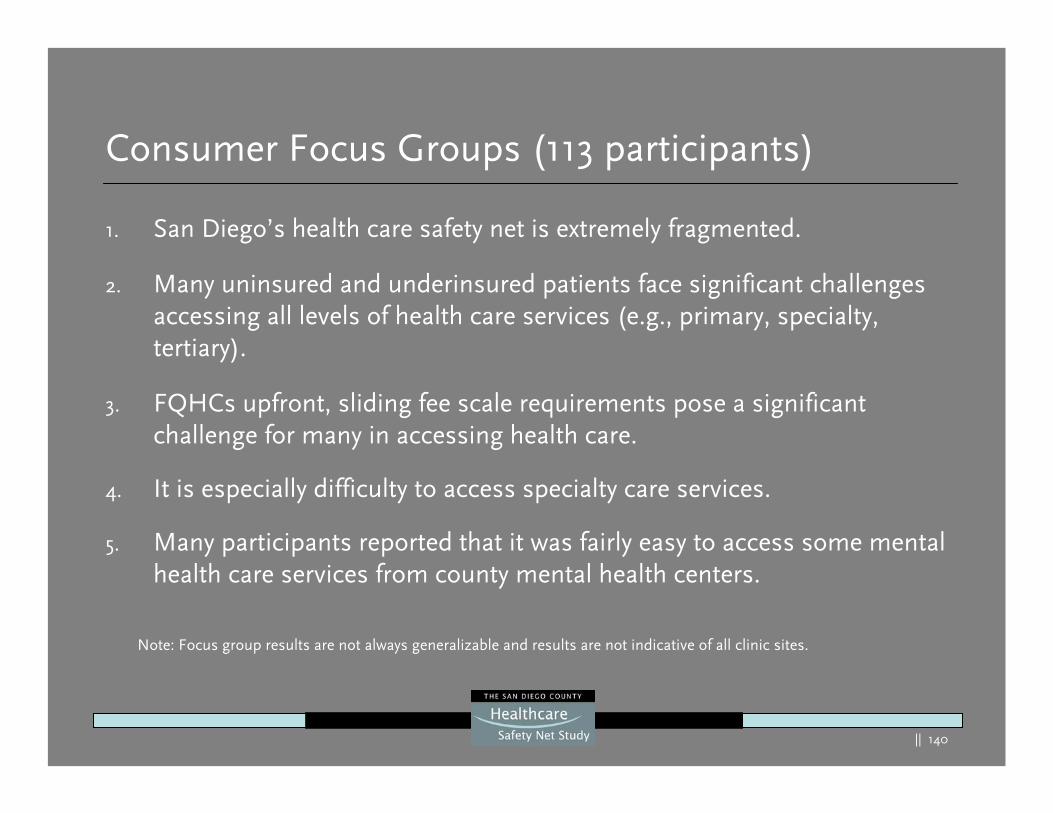
|| 140
Consumer Focus Groups (113 participants)
1. San Diego’s health care safety net is extremely fragmented.
2. Many uninsured and underinsured patients face significant challenges accessing all levels of health care services (e.g., primary, specialty, tertiary).
3. FQHCs upfront, sliding fee scale requirements pose a significantchallenge for many in accessing health care.
4. It is especially difficulty to access specialty care services.
5. Many participants reported that it was fairly easy to access some mental health care services from county mental health centers.
Note: Focus group results are not always generalizable and results are not indicative of all clinic sites.
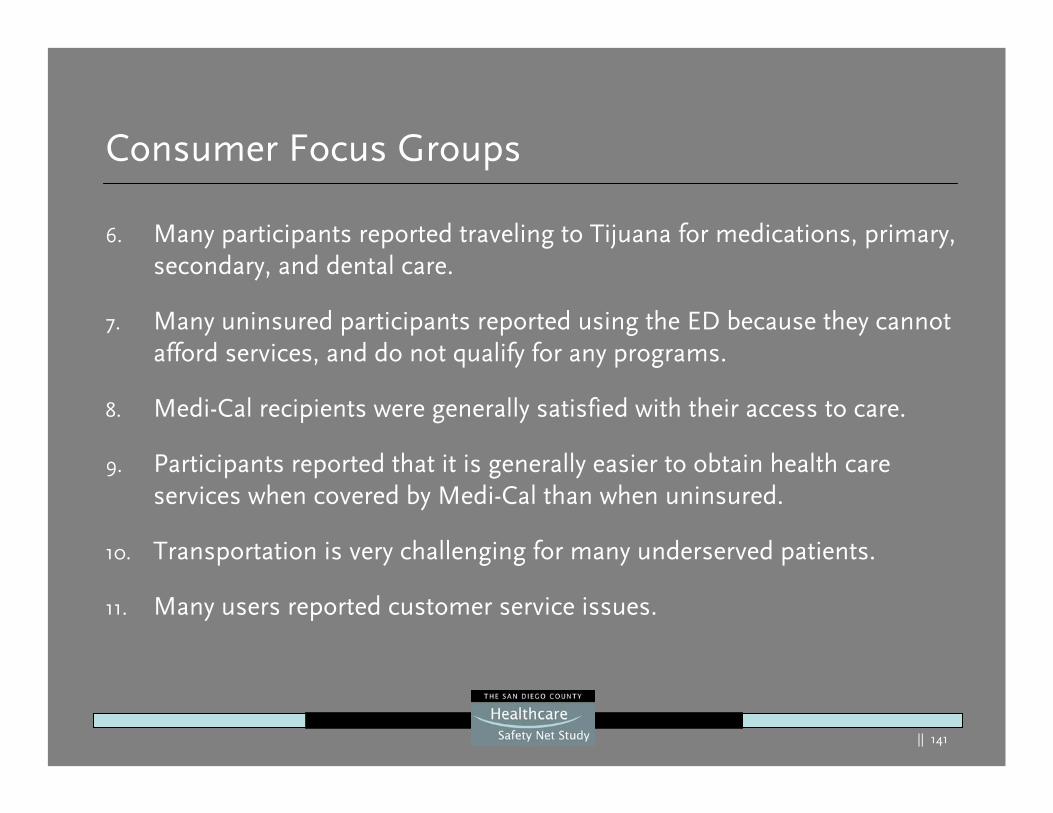
|| 141
Consumer Focus Groups
6. Many participants reported traveling to Tijuana for medications, primary, secondary, and dental care.
7. Many uninsured participants reported using the ED because they cannot afford services, and do not qualify for any programs.
8. Medi-Cal recipients were generally satisfied with their access to care.
9. Participants reported that it is generally easier to obtain health care services when covered by Medi-Cal than when uninsured.
10. Transportation is very challenging for many underserved patients.
11. Many users reported customer service issues.
|| 142
Characteristics of a Strong Healthcare Safety Net
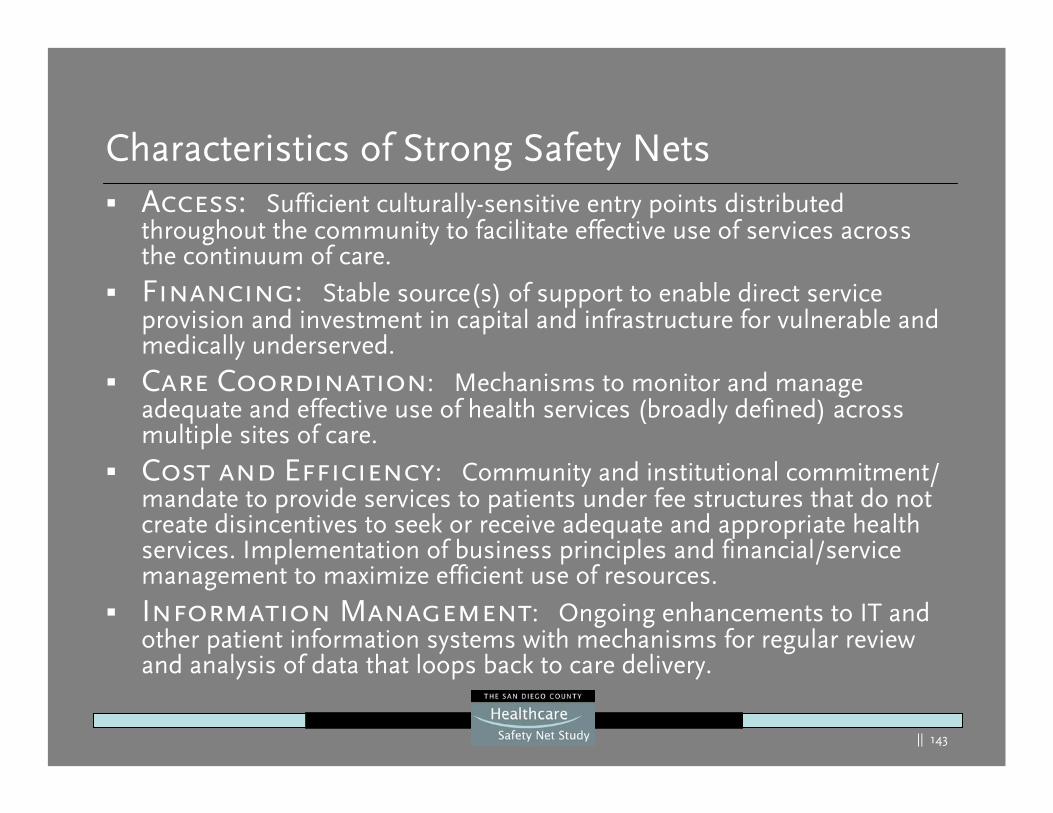
|| 143
Characteristics of Strong Safety NetsAccess: Sufficient culturally-sensitive entry points distributed throughout the community to facilitate effective use of services across the continuum of care. Financing: Stable source(s) of support to enable direct service provision and investment in capital and infrastructure for vulnerable and medically underserved.
Care Coordination: Mechanisms to monitor and manage adequate and effective use of health services (broadly defined) across multiple sites of care.
Cost and Efficiency: Community and institutional commitment/ mandate to provide services to patients under fee structures that do not create disincentives to seek or receive adequate and appropriate health services. Implementation of business principles and financial/service management to maximize efficient use of resources.
Information Management: Ongoing enhancements to IT and other patient information systems with mechanisms for regular review and analysis of data that loops back to care delivery.
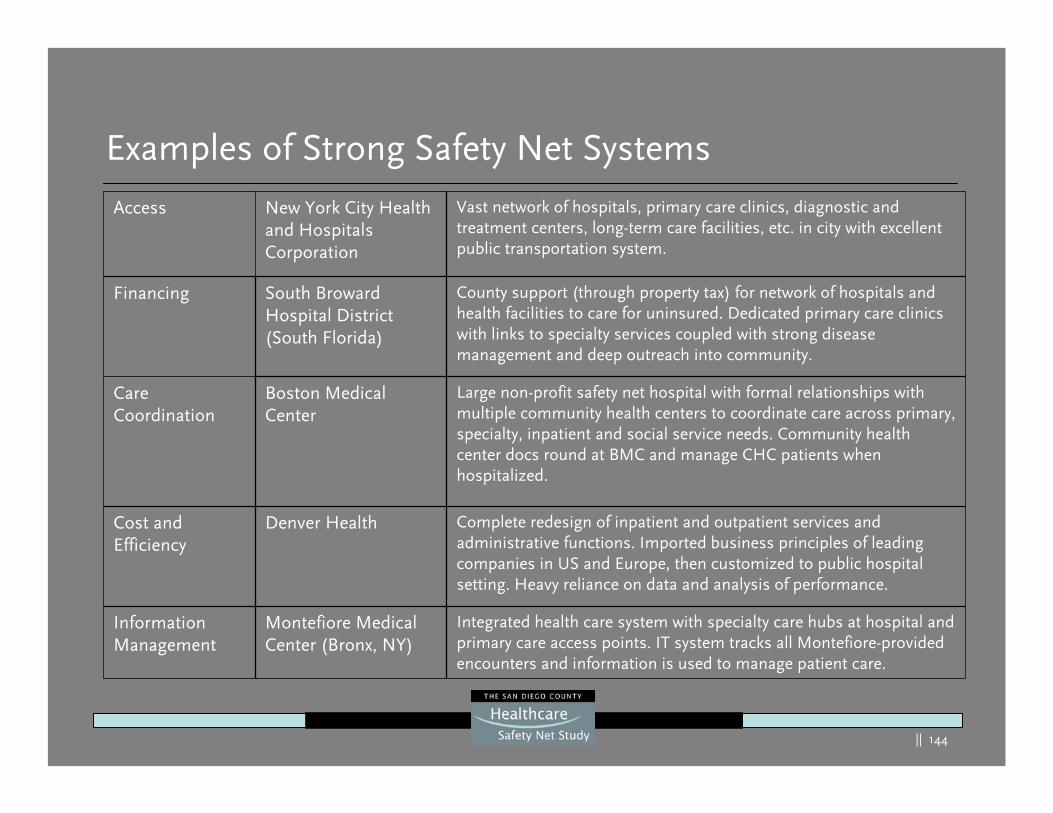
|| 144
Examples of Strong Safety Net Systems
Integrated health care system with specialty care hubs at hospital and primary care access points. IT system tracks all Montefiore-provided encounters and information is used to manage patient care.
Montefiore Medical Center (Bronx, NY)
Information Management
Complete redesign of inpatient and outpatient services and administrative functions. Imported business principles of leading companies in US and Europe, then customized to public hospital setting. Heavy reliance on data and analysis of performance.
Denver HealthCost and Efficiency
Large non-profit safety net hospital with formal relationships with multiple community health centers to coordinate care across primary, specialty, inpatient and social service needs. Community health center docs round at BMC and manage CHC patients when hospitalized.
Boston Medical Center
Care Coordination
County support (through property tax) for network of hospitals and health facilities to care for uninsured. Dedicated primary care clinics with links to specialty services coupled with strong disease management and deep outreach into community.
South Broward Hospital District(South Florida)
Financing
Vast network of hospitals, primary care clinics, diagnostic and treatment centers, long-term care facilities, etc. in city with excellent public transportation system.
New York City Health and Hospitals Corporation
Access
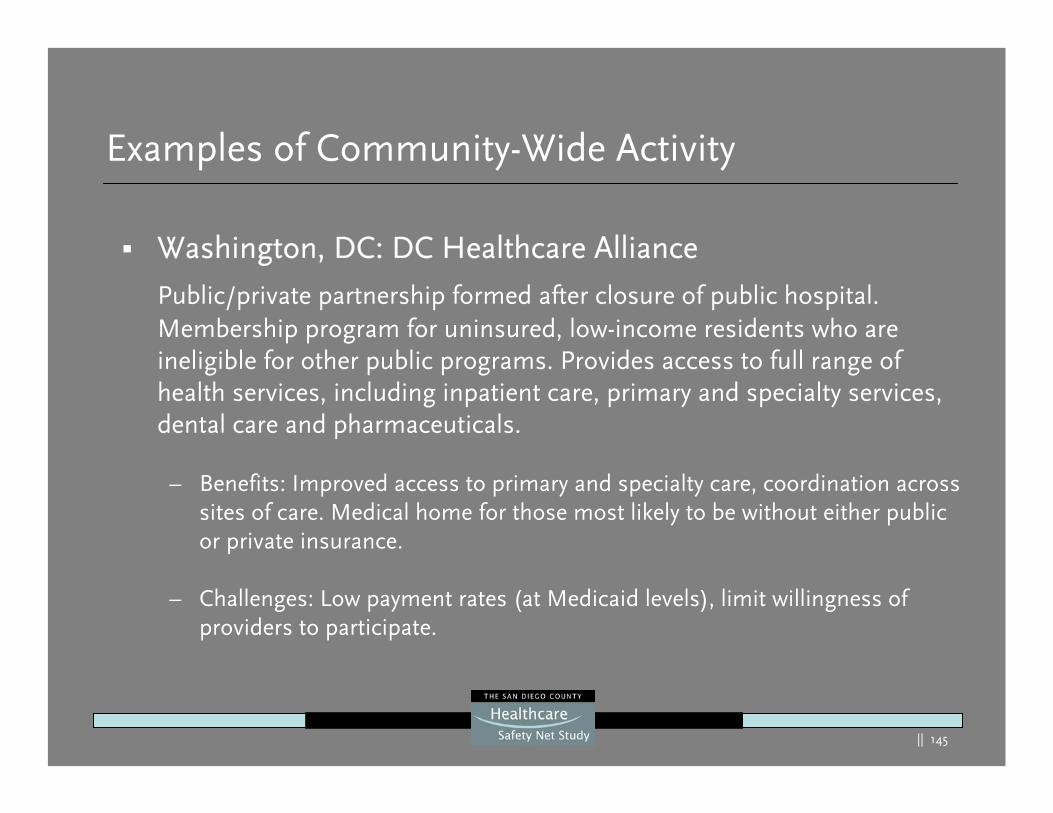
|| 145
Examples of Community-Wide Activity
Washington, DC: DC Healthcare Alliance
Public/private partnership formed after closure of public hospital. Membership program for uninsured, low-income residents who are ineligible for other public programs. Provides access to full range of health services, including inpatient care, primary and specialty services, dental care and pharmaceuticals.
– Benefits: Improved access to primary and specialty care, coordination across sites of care. Medical home for those most likely to be without either public or private insurance.
– Challenges: Low payment rates (at Medicaid levels), limit willingness of providers to participate.
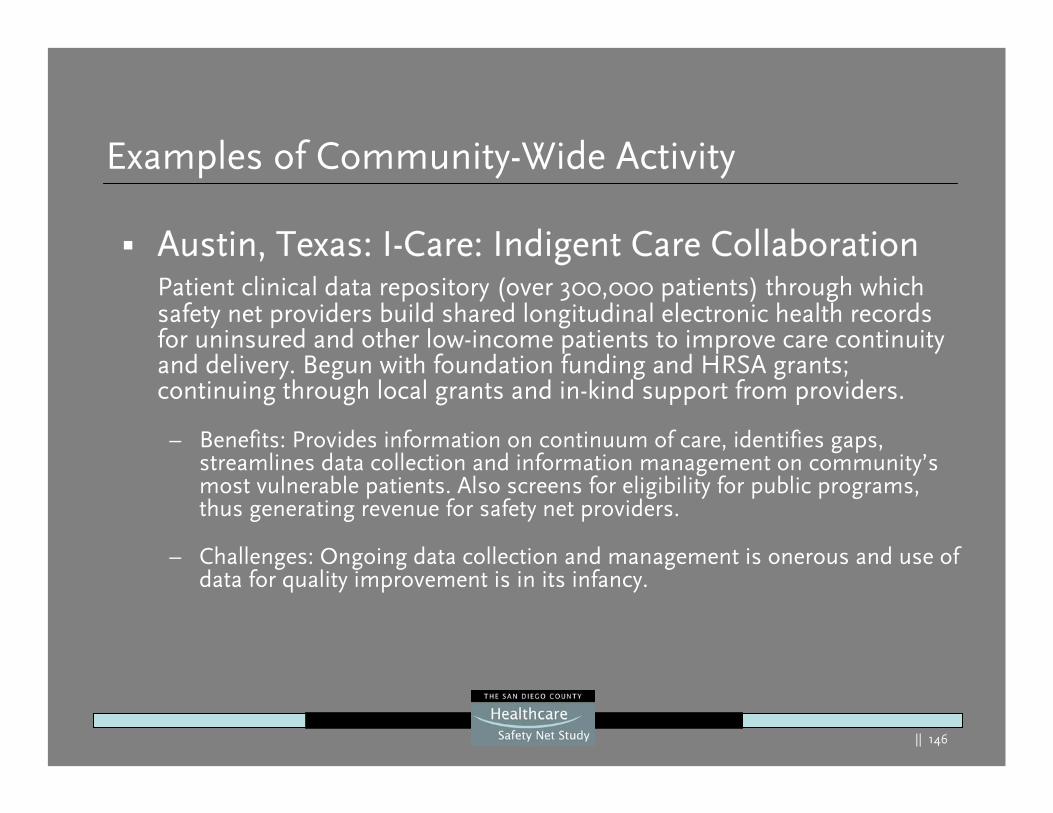
|| 146
Examples of Community-Wide Activity
Austin, Texas: I-Care: Indigent Care CollaborationPatient clinical data repository (over 300,000 patients) through which safety net providers build shared longitudinal electronic health records for uninsured and other low-income patients to improve care continuity and delivery. Begun with foundation funding and HRSA grants; continuing through local grants and in-kind support from providers.
– Benefits: Provides information on continuum of care, identifies gaps, streamlines data collection and information management on community’s most vulnerable patients. Also screens for eligibility for public programs, thus generating revenue for safety net providers.
– Challenges: Ongoing data collection and management is onerous and use of data for quality improvement is in its infancy.
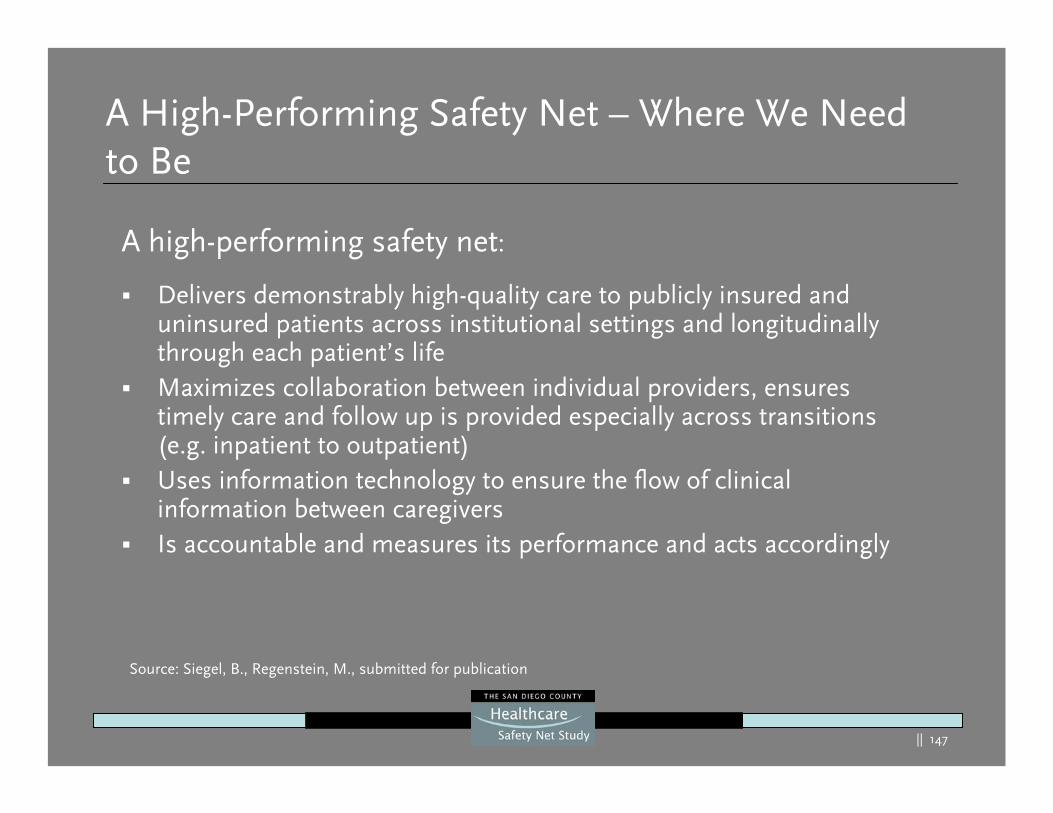
|| 147
A High-Performing Safety Net – Where We Need to Be
A high-performing safety net:
Delivers demonstrably high-quality care to publicly insured and uninsured patients across institutional settings and longitudinally through each patient’s lifeMaximizes collaboration between individual providers, ensures timely care and follow up is provided especially across transitions (e.g. inpatient to outpatient)Uses information technology to ensure the flow of clinical information between caregiversIs accountable and measures its performance and acts accordingly
Source: Siegel, B., Regenstein, M., submitted for publication

|| 148
Strengths, Weaknesses, Opportunities and Threats (SWOT) Summary
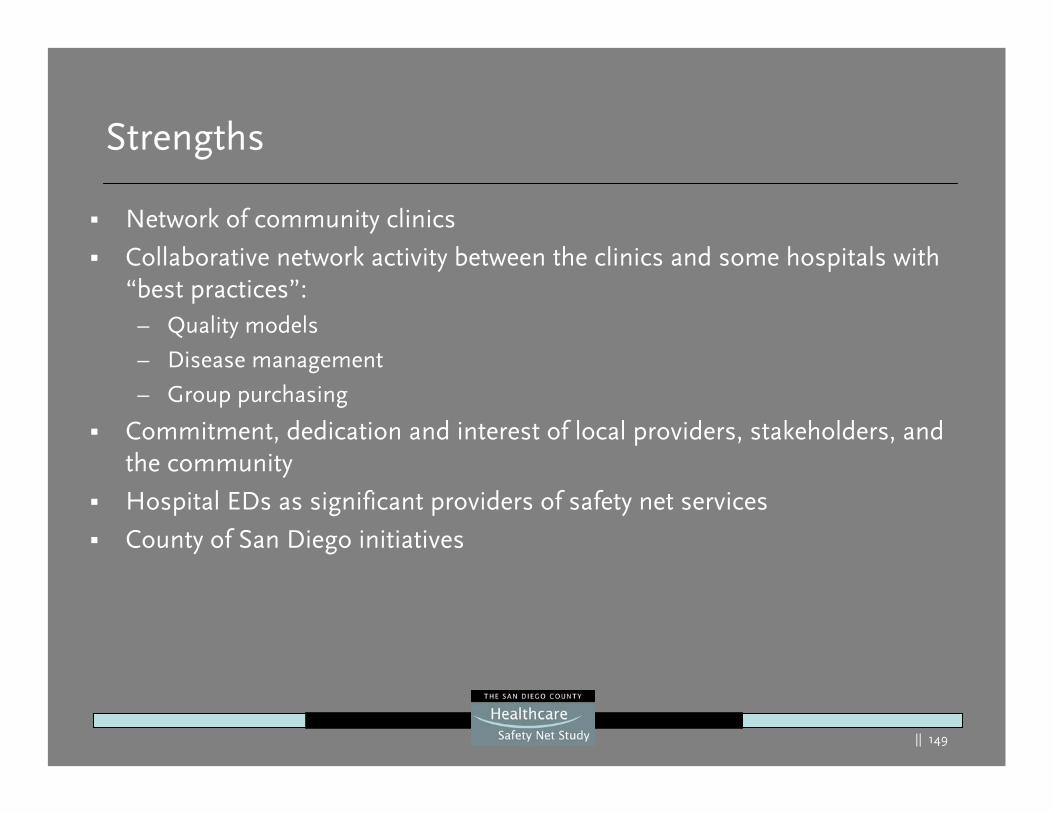
|| 149
Strengths
Network of community clinics
Collaborative network activity between the clinics and some hospitals with “best practices”:– Quality models
– Disease management
– Group purchasing
Commitment, dedication and interest of local providers, stakeholders, and the community
Hospital EDs as significant providers of safety net services
County of San Diego initiatives
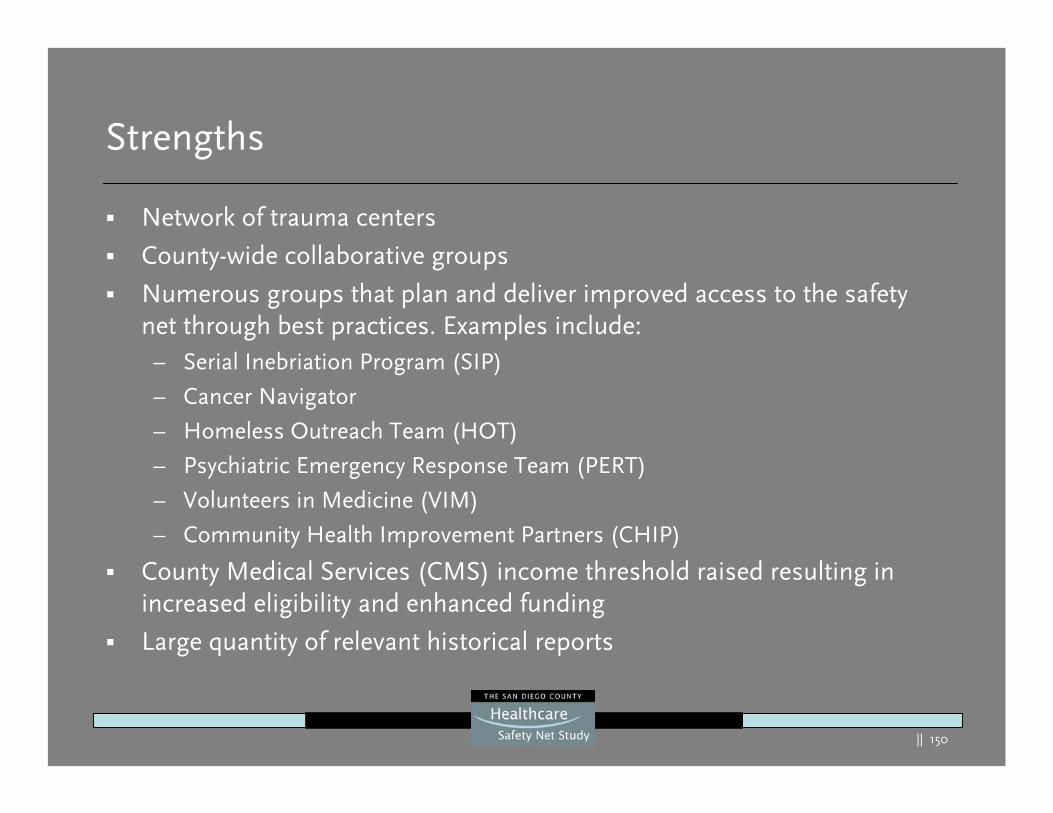
|| 150
Strengths
Network of trauma centers
County-wide collaborative groups
Numerous groups that plan and deliver improved access to the safety net through best practices. Examples include:– Serial Inebriation Program (SIP)
– Cancer Navigator
– Homeless Outreach Team (HOT)
– Psychiatric Emergency Response Team (PERT)
– Volunteers in Medicine (VIM)
– Community Health Improvement Partners (CHIP)
County Medical Services (CMS) income threshold raised resulting in increased eligibility and enhanced funding
Large quantity of relevant historical reports
|| 151
San Diego’s safety net is served by a mosaic of advocacy and service providers
Fire DepartmentsFirst Responders Ambulance
Providers
First 5San Diego
Health Care for AllHealth Care for AllCaliforniaCalifornia
|| 152
Weaknesses
Safety Net Access:
There is an erosion of providers willing to serve the safety netExtremely limited access to specialty physician providersClinics lack significant after-hour operationsUp front payment clinic practices limit accessPerceived and uneven access to affordable pharmaceuticalsTransportation to/from safety net services and the lack of public transportation in certain geographic areasLack of awareness/publication/education regarding services and programs; no clearly coordinated effort on the “how to” for access
|| 153
Weaknesses
Capacity:
Delays in achieving clinic appointments and long waits with some clinics and EDsLong patient off-load challenges for EMS providersFragile hospital financial stability in the South county regionED on-call physician challenges with trauma centers and their EDs believing they have become the dumping ground for some other hospital responsibilities Lack of complete adoption of best-practice outpatient and inpatient access and throughput strategies by many providers
|| 154
Weaknesses
Utilization/Outreach:
Competitive hospital environment leading to aggressive competition and technology acquisition without regard to regional needsActive growth of community clinics: – Without benefit of a master plan– Leading to some overlap and duplication– Lack of complete collaboration or benefit of initiatives and programs
Non-emergent use of hospital ED:– Leads to capacity challenges– Higher cost of care – Episodic care at best
Limited coordinated outreach to specific groups (e.g. elderly, cancer, mental health, chronic diseases)
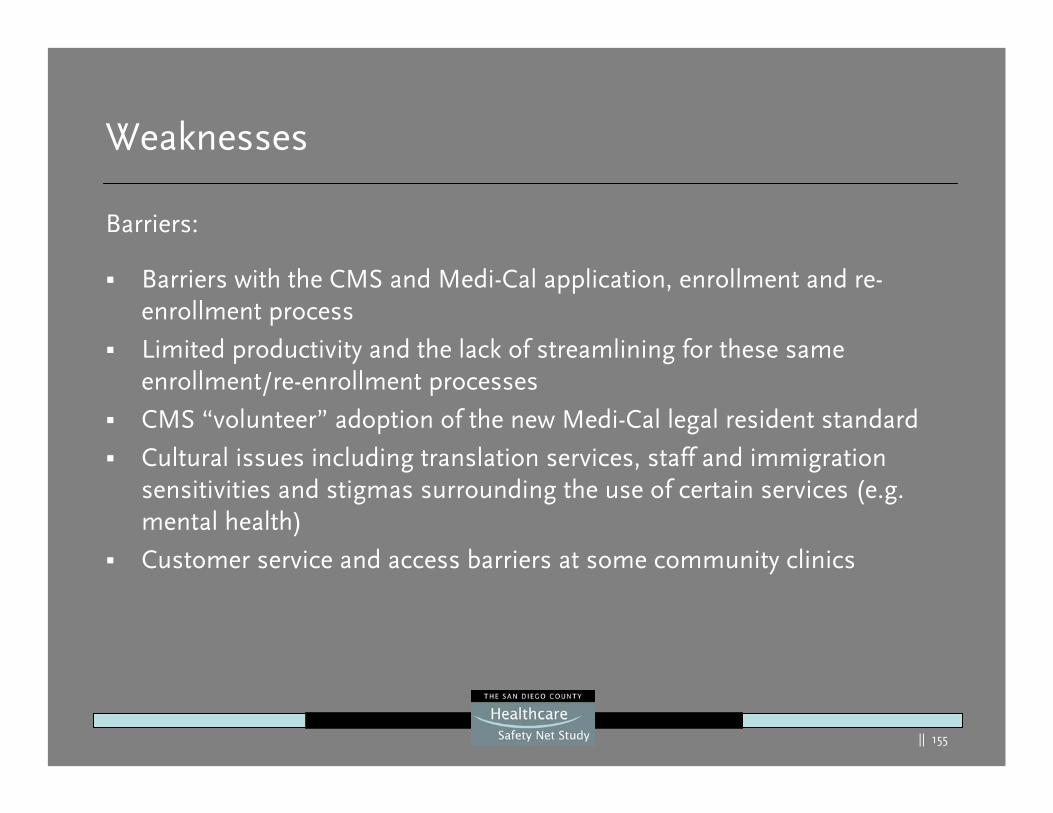
|| 155
Weaknesses
Barriers:
Barriers with the CMS and Medi-Cal application, enrollment and re-enrollment process
Limited productivity and the lack of streamlining for these sameenrollment/re-enrollment processes
CMS “volunteer” adoption of the new Medi-Cal legal resident standard
Cultural issues including translation services, staff and immigration sensitivities and stigmas surrounding the use of certain services (e.g. mental health)
Customer service and access barriers at some community clinics
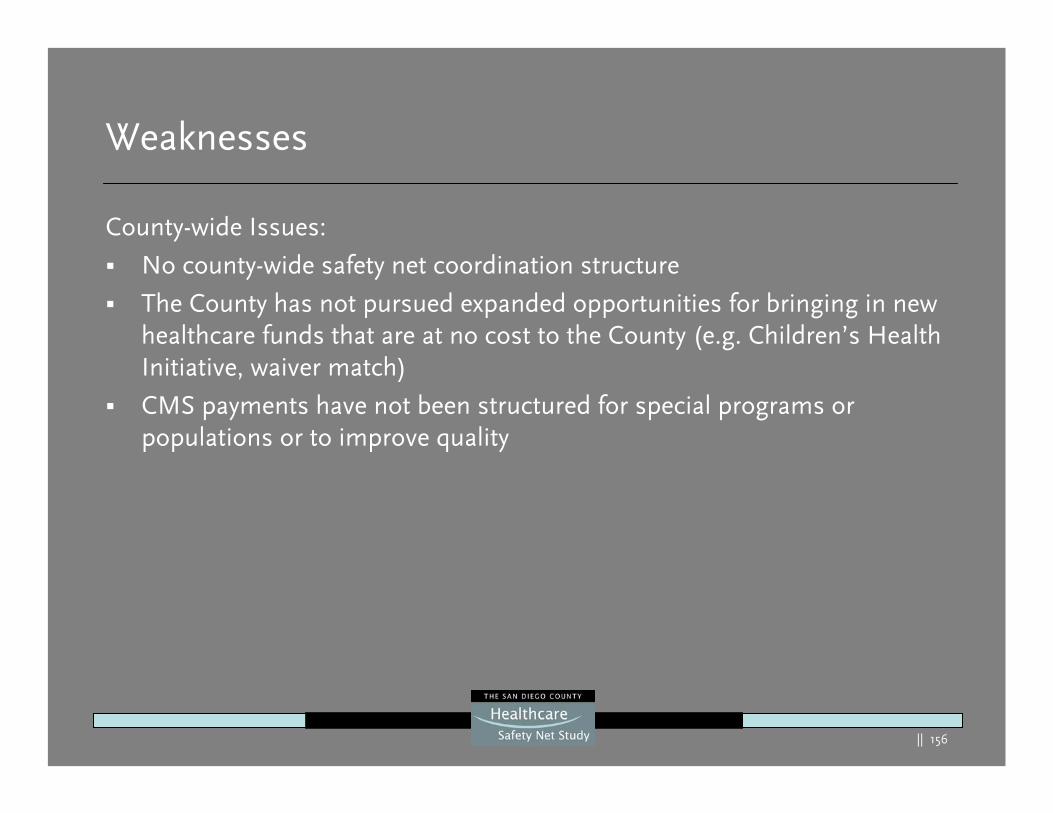
|| 156
Weaknesses
County-wide Issues:
No county-wide safety net coordination structure
The County has not pursued expanded opportunities for bringing in new healthcare funds that are at no cost to the County (e.g. Children’s Health Initiative, waiver match)
CMS payments have not been structured for special programs or populations or to improve quality
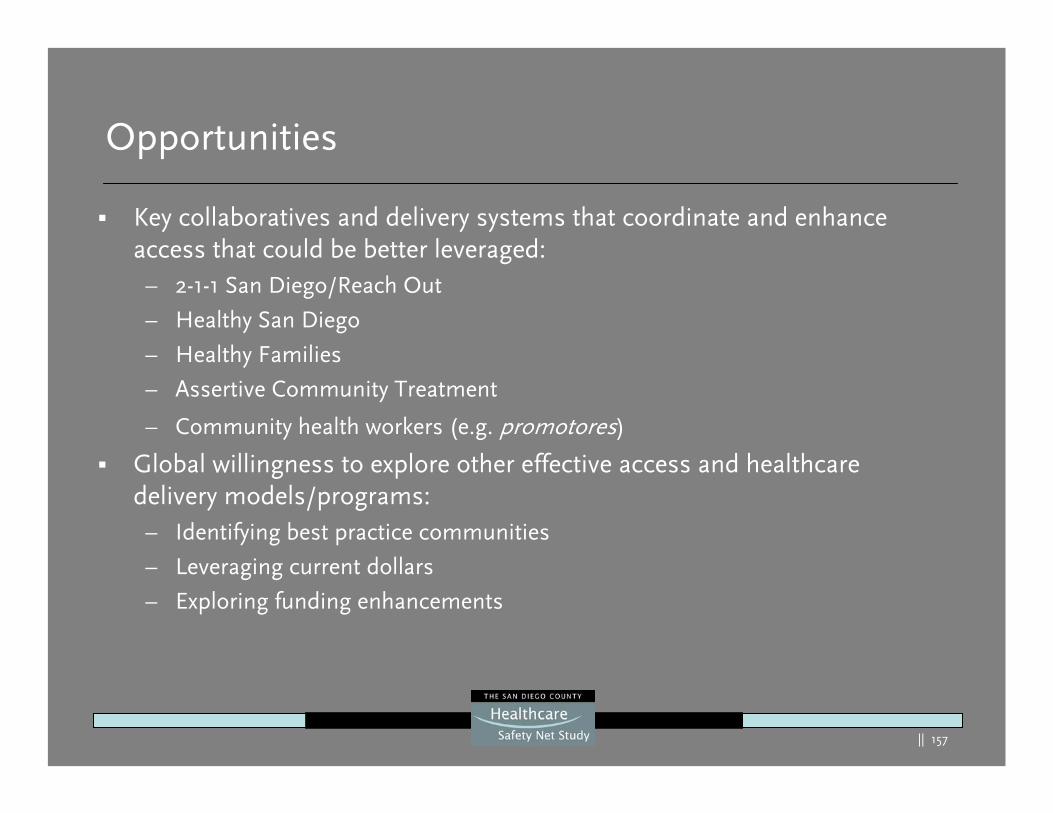
|| 157
Opportunities
Key collaboratives and delivery systems that coordinate and enhance access that could be better leveraged:– 2-1-1 San Diego/Reach Out
– Healthy San Diego
– Healthy Families
– Assertive Community Treatment
– Community health workers (e.g. promotores)
Global willingness to explore other effective access and healthcare delivery models/programs:– Identifying best practice communities
– Leveraging current dollars
– Exploring funding enhancements
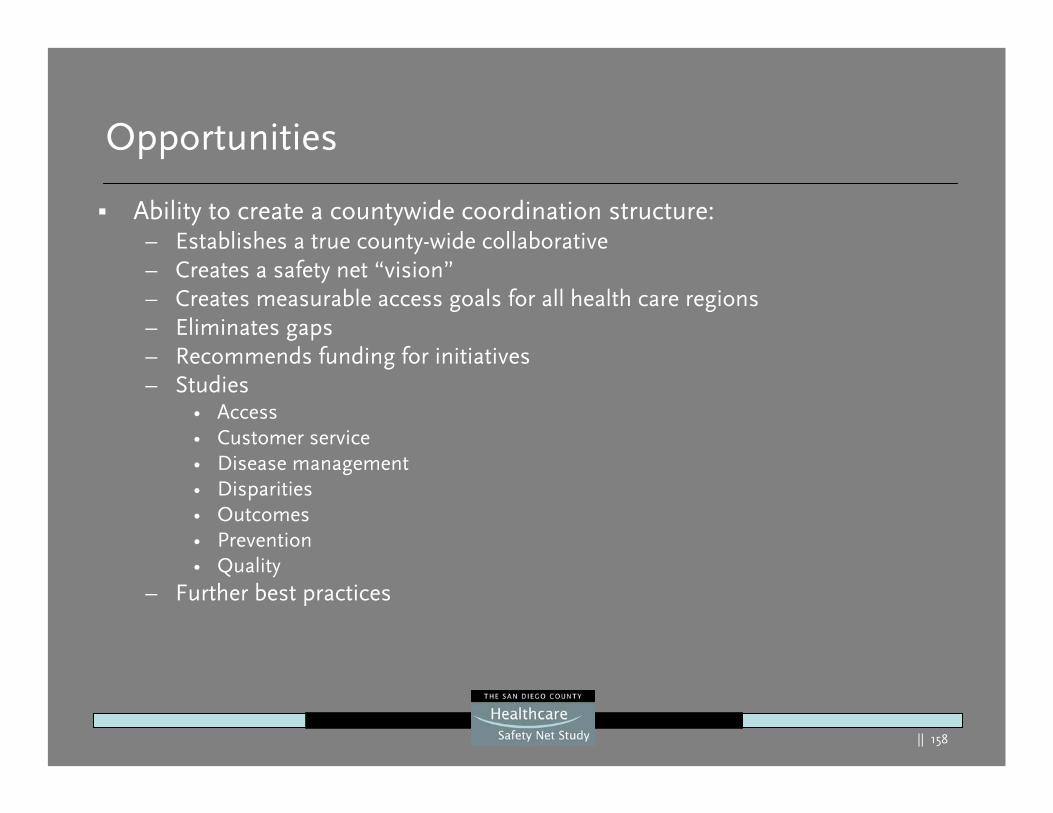
|| 158
Opportunities
Ability to create a countywide coordination structure:– Establishes a true county-wide collaborative– Creates a safety net “vision”– Creates measurable access goals for all health care regions– Eliminates gaps – Recommends funding for initiatives – Studies
• Access• Customer service • Disease management• Disparities• Outcomes• Prevention• Quality
– Further best practices
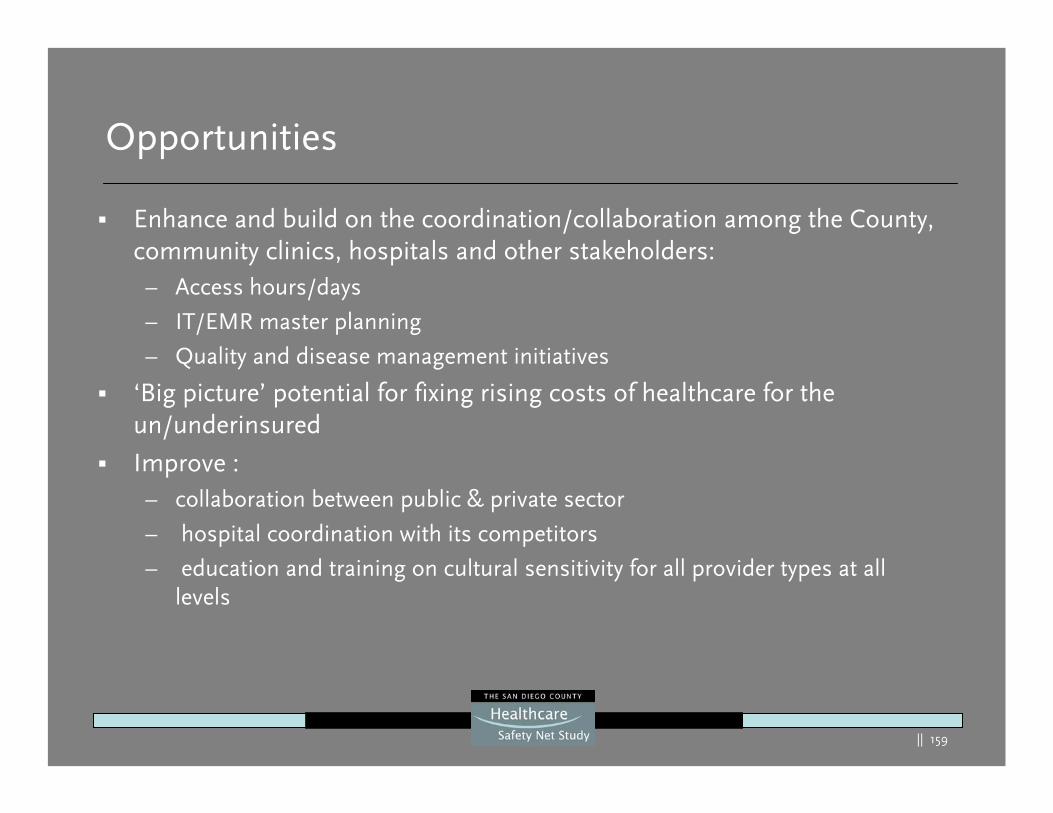
|| 159
Opportunities
Enhance and build on the coordination/collaboration among the County, community clinics, hospitals and other stakeholders:– Access hours/days
– IT/EMR master planning
– Quality and disease management initiatives
‘Big picture’ potential for fixing rising costs of healthcare for the un/underinsured
Improve :– collaboration between public & private sector
– hospital coordination with its competitors
– education and training on cultural sensitivity for all provider types at all levels
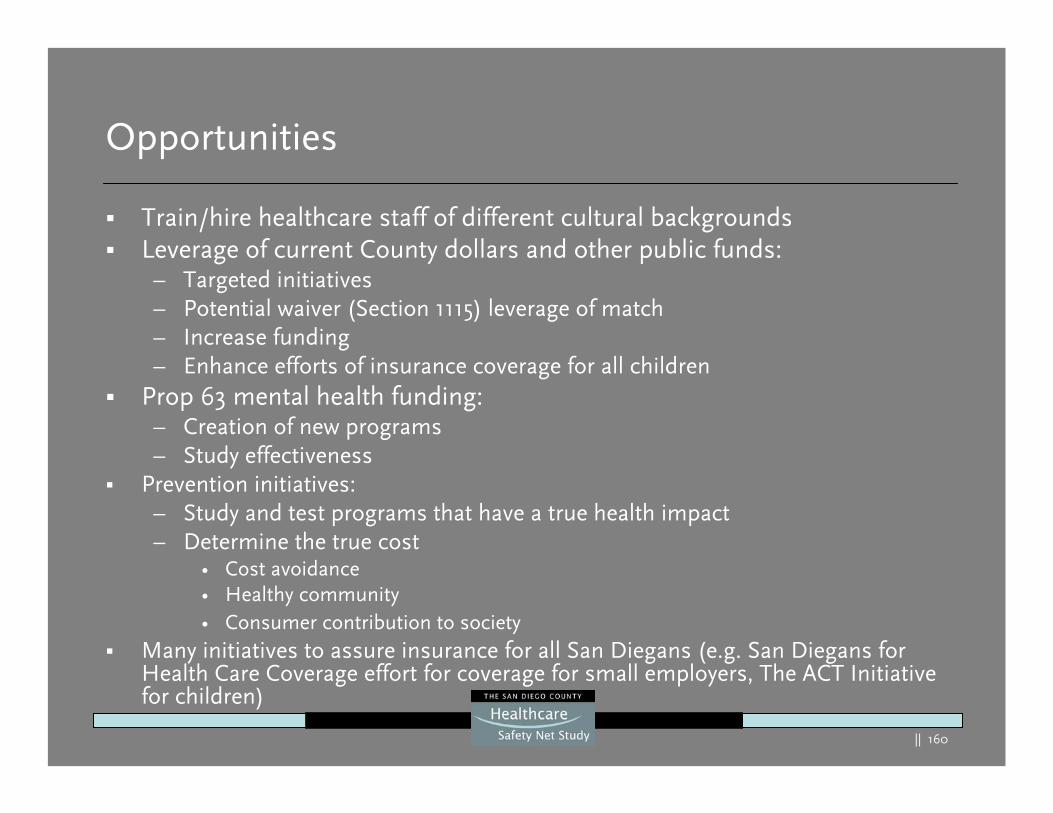
|| 160
Opportunities
Train/hire healthcare staff of different cultural backgroundsLeverage of current County dollars and other public funds:– Targeted initiatives – Potential waiver (Section 1115) leverage of match – Increase funding – Enhance efforts of insurance coverage for all children
Prop 63 mental health funding:– Creation of new programs– Study effectiveness
Prevention initiatives:– Study and test programs that have a true health impact– Determine the true cost
• Cost avoidance• Healthy community• Consumer contribution to society
Many initiatives to assure insurance for all San Diegans (e.g. San Diegans for Health Care Coverage effort for coverage for small employers, The ACT Initiative for children)
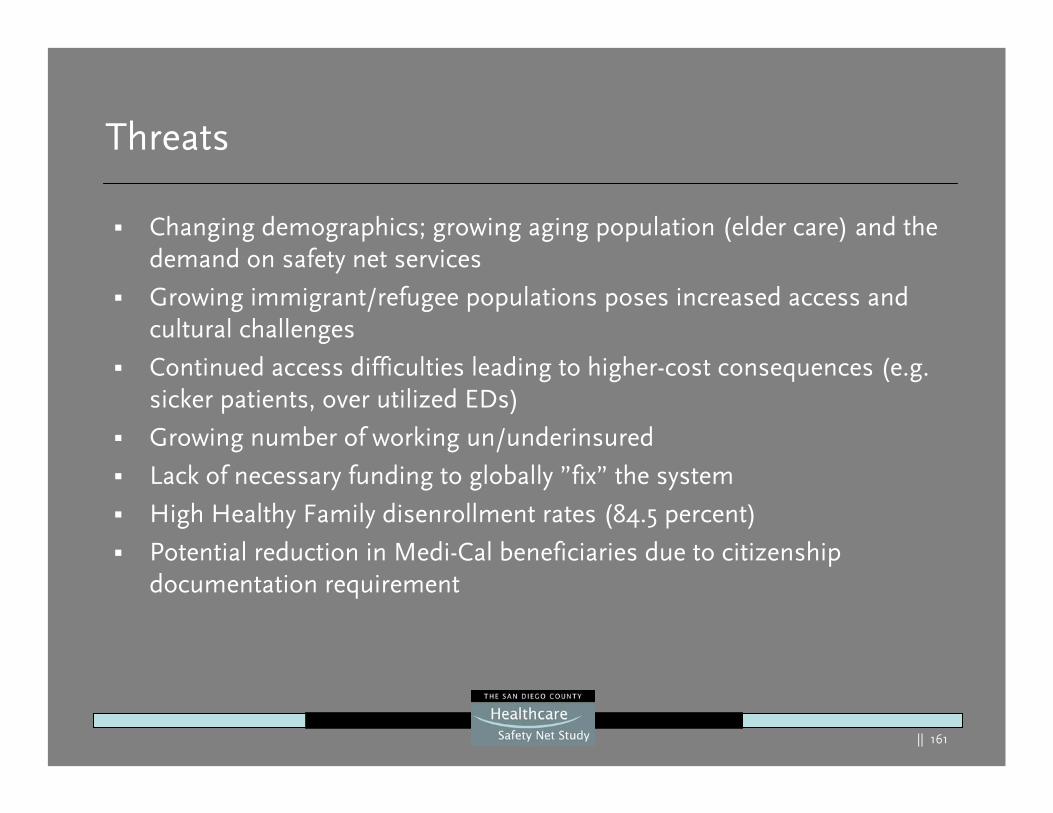
|| 161
Threats
Changing demographics; growing aging population (elder care) and the demand on safety net services
Growing immigrant/refugee populations poses increased access andcultural challenges
Continued access difficulties leading to higher-cost consequences (e.g. sicker patients, over utilized EDs)
Growing number of working un/underinsured
Lack of necessary funding to globally ”fix” the system
High Healthy Family disenrollment rates (84.5 percent)
Potential reduction in Medi-Cal beneficiaries due to citizenship documentation requirement
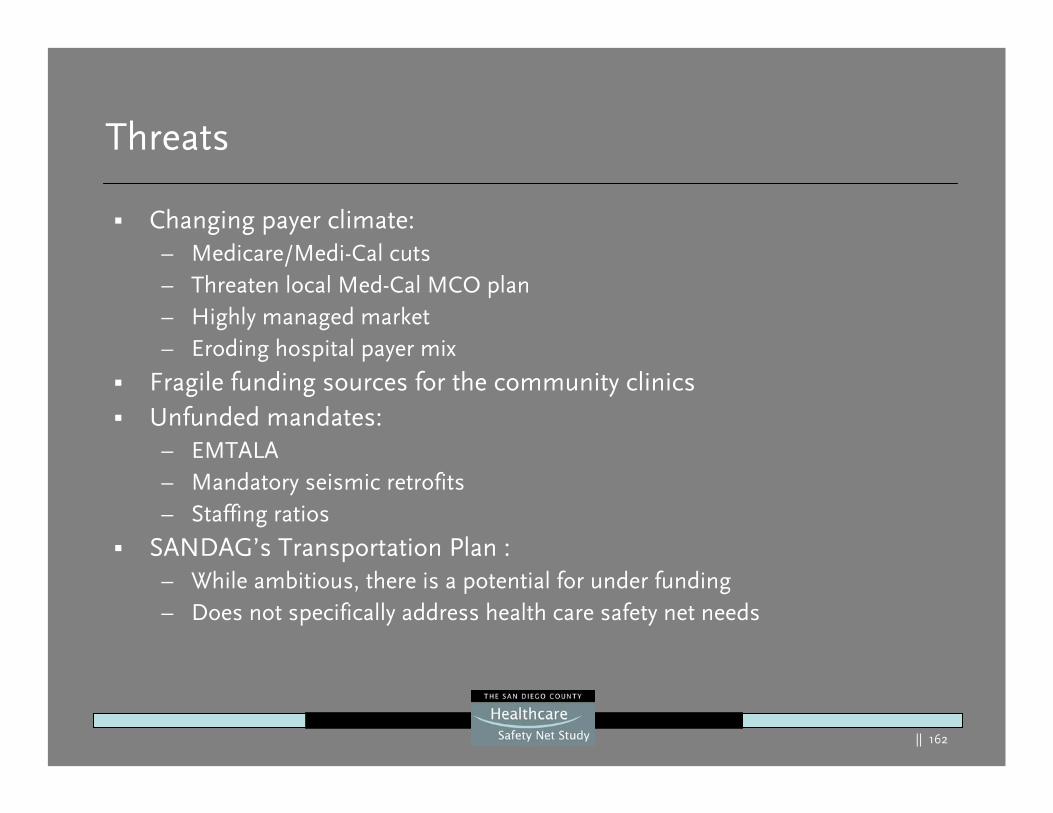
|| 162
Threats
Changing payer climate:– Medicare/Medi-Cal cuts– Threaten local Med-Cal MCO plan– Highly managed market– Eroding hospital payer mix
Fragile funding sources for the community clinicsUnfunded mandates:– EMTALA– Mandatory seismic retrofits – Staffing ratios
SANDAG’s Transportation Plan : – While ambitious, there is a potential for under funding – Does not specifically address health care safety net needs
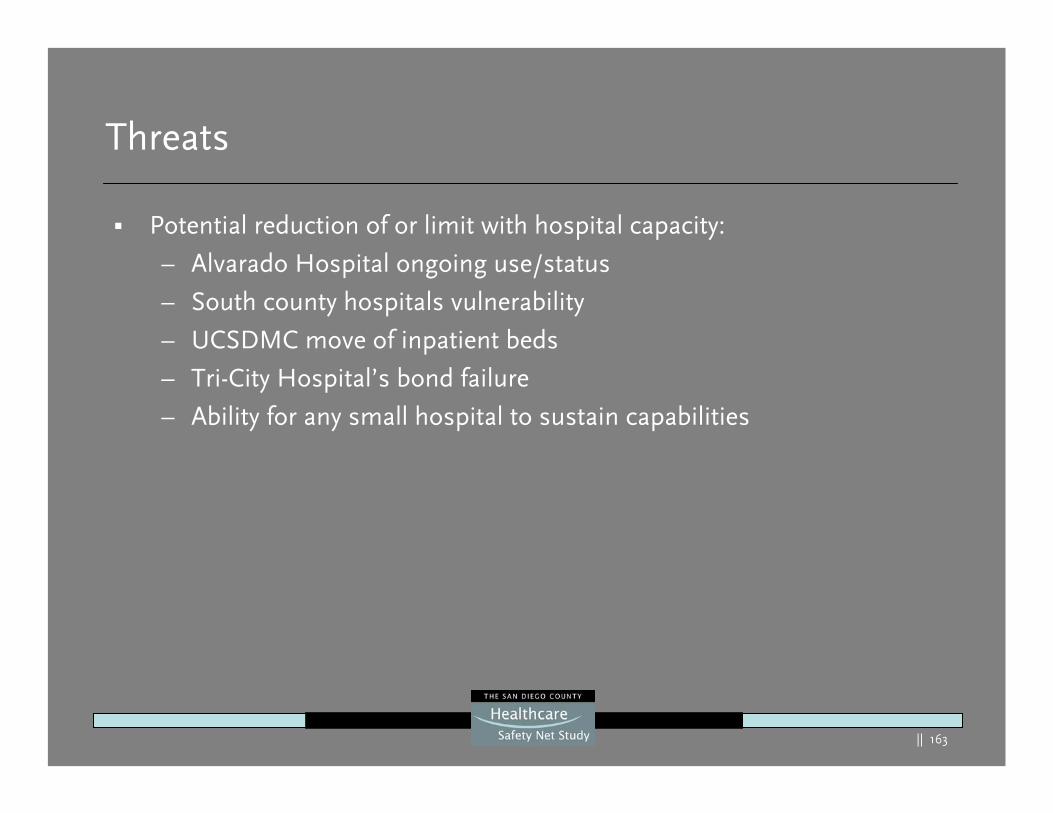
|| 163
Threats
Potential reduction of or limit with hospital capacity:
– Alvarado Hospital ongoing use/status
– South county hospitals vulnerability
– UCSDMC move of inpatient beds
– Tri-City Hospital’s bond failure
– Ability for any small hospital to sustain capabilities
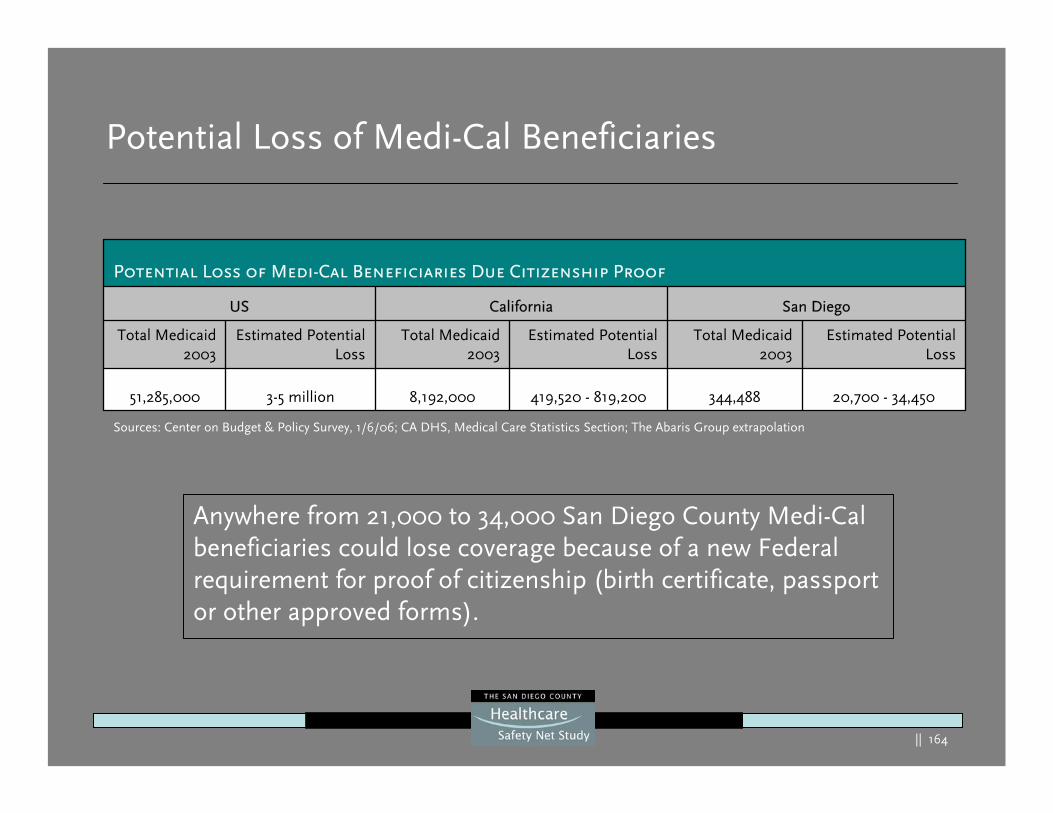
|| 164
Potential Loss of Medi-Cal Beneficiaries
Anywhere from 21,000 to 34,000 San Diego County Medi-Cal beneficiaries could lose coverage because of a new Federal requirement for proof of citizenship (birth certificate, passport or other approved forms).
Sources: Center on Budget & Policy Survey, 1/6/06; CA DHS, Medical Care Statistics Section; The Abaris Group extrapolation
20,700 - 34,450344,488419,520 - 819,2008,192,0003-5 million51,285,000
Estimated Potential Loss
Total Medicaid 2003
Estimated Potential Loss
Total Medicaid 2003
Estimated Potential Loss
Total Medicaid 2003
San DiegoCaliforniaUS
Potential Loss of Medi-Cal Beneficiaries Due Citizenship Proof
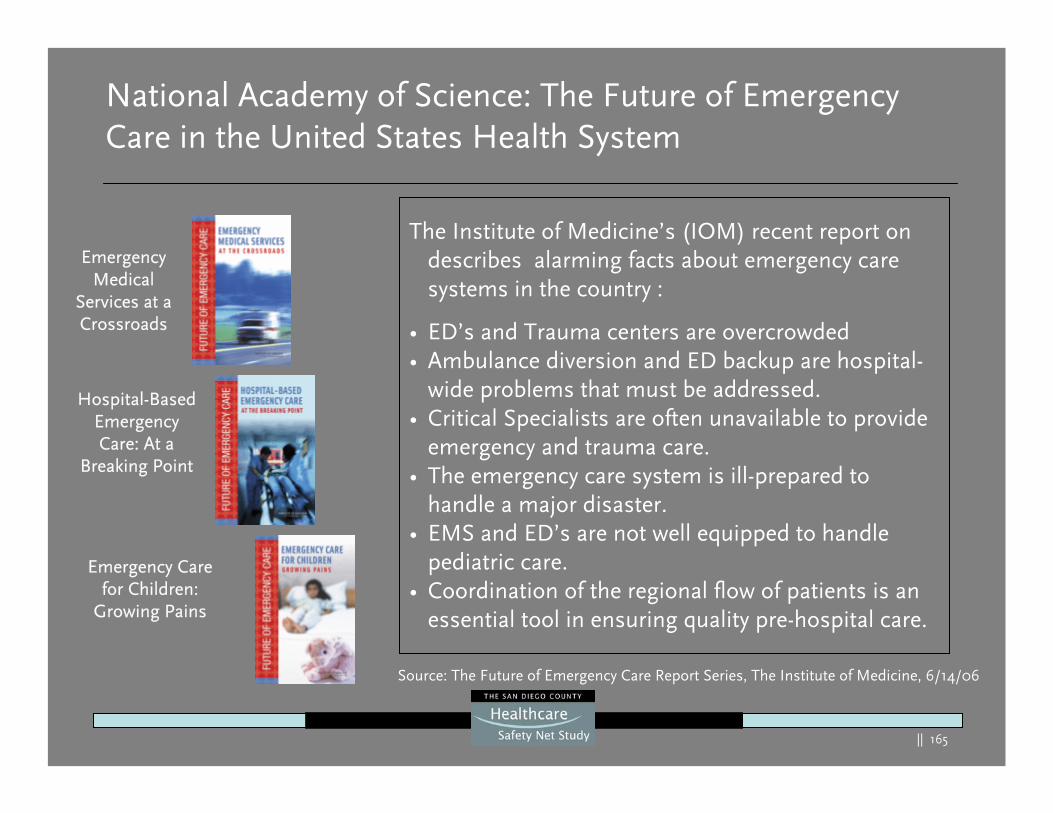
|| 165
National Academy of Science: The Future of Emergency Care in the United States Health System
Emergency Medical
Services at a Crossroads
Hospital-Based Emergency Care: At a
Breaking Point
Emergency Care for Children:
Growing Pains
Source: The Future of Emergency Care Report Series, The Institute of Medicine, 6/14/06
The Institute of Medicine’s (IOM) recent report on describes alarming facts about emergency care systems in the country :
• ED’s and Trauma centers are overcrowded • Ambulance diversion and ED backup are hospital-
wide problems that must be addressed.• Critical Specialists are often unavailable to provide
emergency and trauma care. • The emergency care system is ill-prepared to
handle a major disaster.• EMS and ED’s are not well equipped to handle
pediatric care. • Coordination of the regional flow of patients is an
essential tool in ensuring quality pre-hospital care.
|| 166
Conclusions
|| 167
Conclusions
Conclusion One:San Diego County has taken a major step by studying the healthcare safety net with the potential to rethink the delivery of healthcare safety net services within the community:
Global in scope Collaborative processBold study allows for bold solutions Huge opportunity to recast the safety net to stabilize, expand coverage and assure quality outcomes
|| 168
Conclusions
Conclusion Two:The San Diego County community benefits from a countywide range of resources that either responds to or addresses many of the healthcare needs of the poor.
Benefits include:ProvidersAccess facilitators (Community Health Workers, public health workers, Consumer Center for Health Education & Advocacy, 2-1-1, Reach Out, etc.)Community collaborations
|| 169
Conclusions
Conclusion Three:There are tremendous capacity challenges which also provide an opportunity for the community to rethink what the safety net will look like:
Challenges include:Hospital current and future capacity needs are at serious risk in certain regions of the countyPerceived and actual access issues are prevalentCurrent community collaborations do not extend to a true shared vision
|| 170
Conclusions
Most of their current patient work is outpatient (86 percent) and UCSD has plans to leave all outpatient services and an Urgent Care/ED product at Hillcrest
UCSD Medical Center plans to and will have the capacity to manage all current inpatients at their East campus
Conclusion Four:The announcement of UCSD Medical Center’s move of inpatient beds (over 25 years )from their Hillcrest to their East campus move will impact some patients and their families. However, the impact is expected to be minimized because:
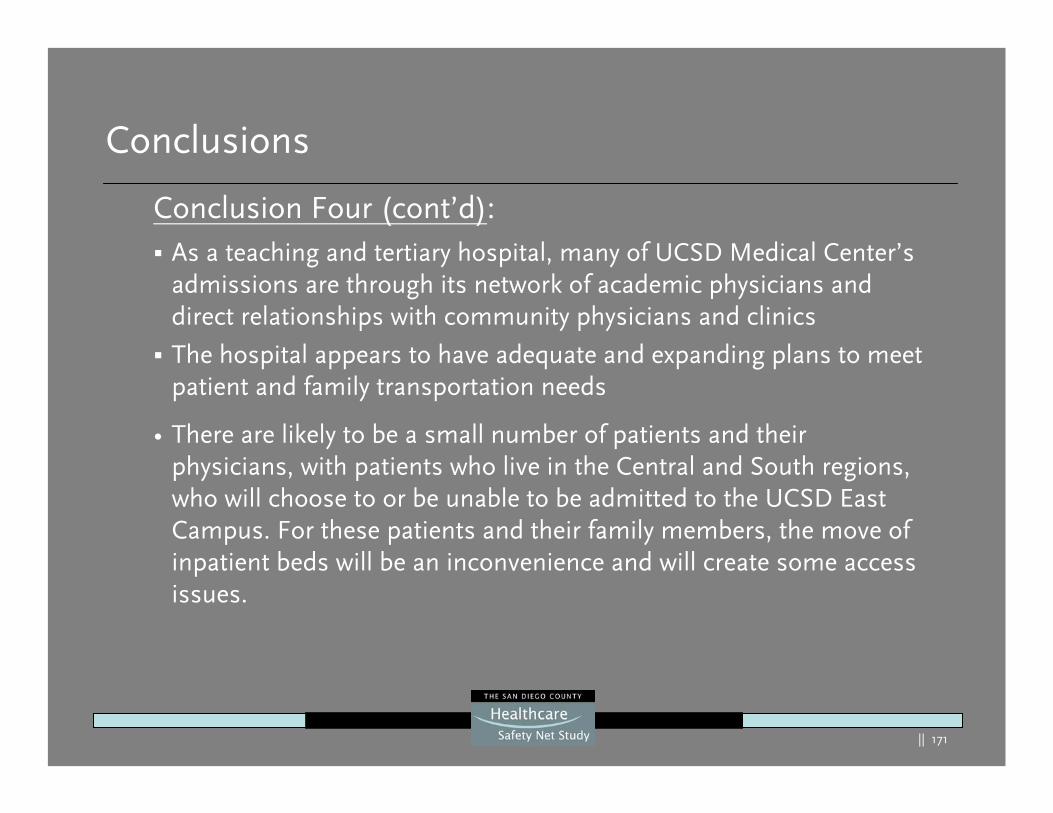
|| 171
Conclusions
As a teaching and tertiary hospital, many of UCSD Medical Center’s admissions are through its network of academic physicians and direct relationships with community physicians and clinics
The hospital appears to have adequate and expanding plans to meet patient and family transportation needs
• There are likely to be a small number of patients and their physicians, with patients who live in the Central and South regions, who will choose to or be unable to be admitted to the UCSD East Campus. For these patients and their family members, the move ofinpatient beds will be an inconvenience and will create some access issues.
Conclusion Four (cont’d):
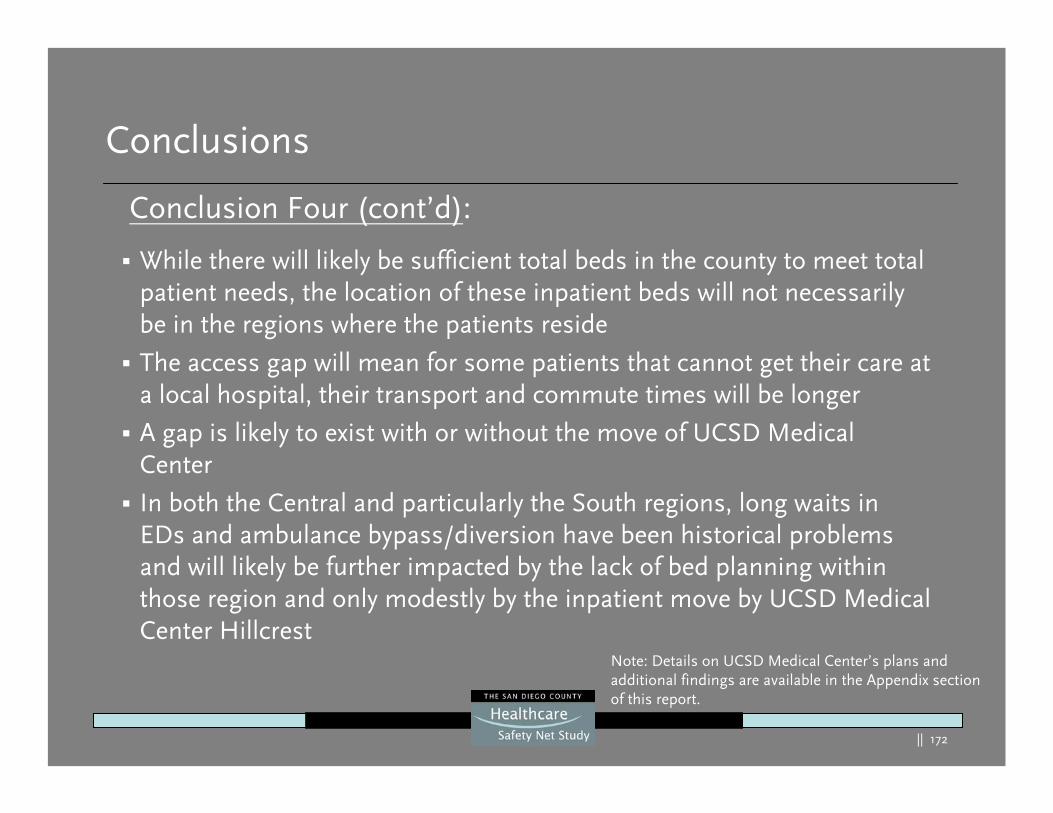
|| 172
Conclusions
While there will likely be sufficient total beds in the county to meet total patient needs, the location of these inpatient beds will not necessarily be in the regions where the patients reside
The access gap will mean for some patients that cannot get their care at a local hospital, their transport and commute times will be longer
A gap is likely to exist with or without the move of UCSD Medical Center
In both the Central and particularly the South regions, long waits in EDs and ambulance bypass/diversion have been historical problemsand will likely be further impacted by the lack of bed planning within those region and only modestly by the inpatient move by UCSD Medical Center Hillcrest
Conclusion Four (cont’d):
Note: Details on UCSD Medical Center’s plans and additional findings are available in the Appendix section of this report.
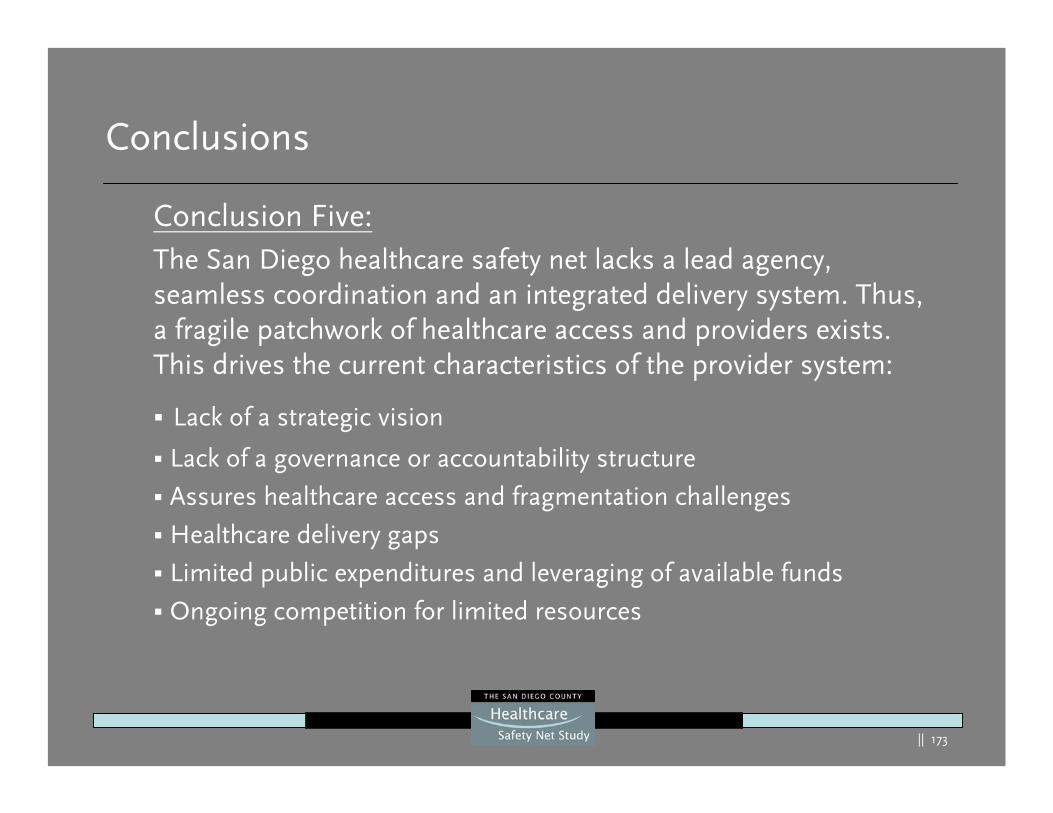
|| 173
Conclusions
Conclusion Five:The San Diego healthcare safety net lacks a lead agency, seamless coordination and an integrated delivery system. Thus, a fragile patchwork of healthcare access and providers exists. This drives the current characteristics of the provider system:
Lack of a strategic vision
Lack of a governance or accountability structure
Assures healthcare access and fragmentation challenges
Healthcare delivery gaps
Limited public expenditures and leveraging of available funds
Ongoing competition for limited resources
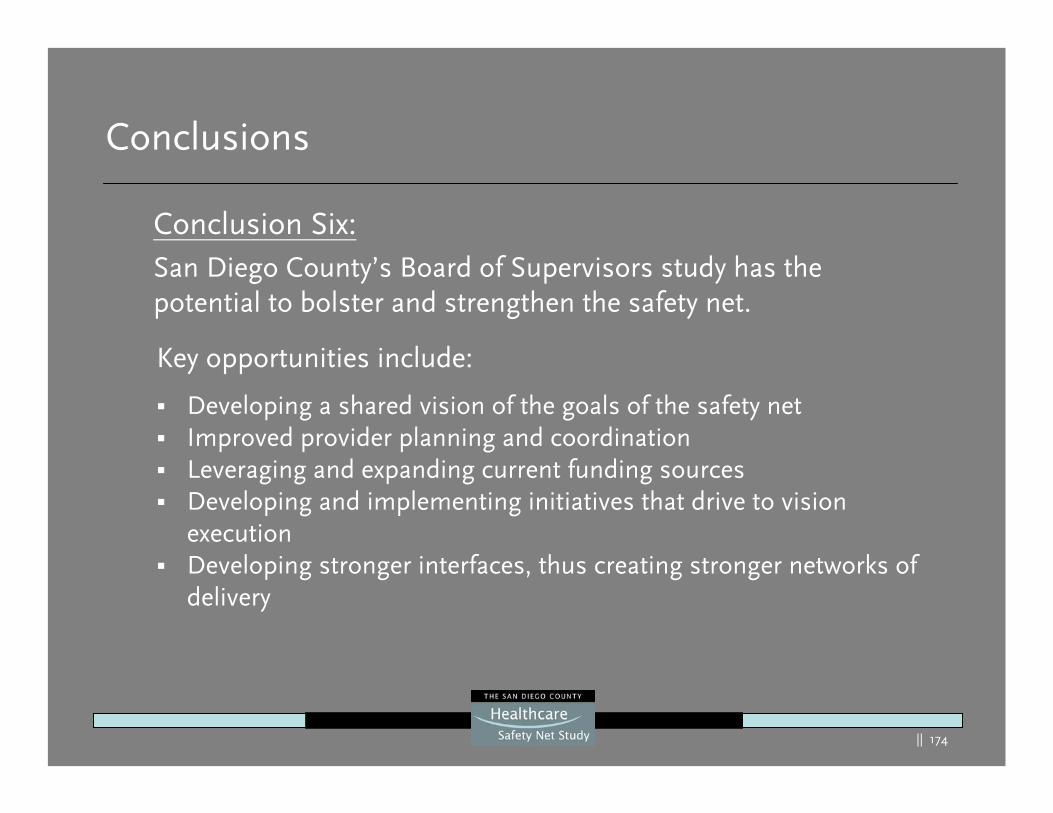
|| 174
Conclusions
Conclusion Six:San Diego County’s Board of Supervisors study has the potential to bolster and strengthen the safety net.
Key opportunities include:
Developing a shared vision of the goals of the safety net Improved provider planning and coordination Leveraging and expanding current funding sourcesDeveloping and implementing initiatives that drive to vision executionDeveloping stronger interfaces, thus creating stronger networks of delivery
|| 175
Conclusions
Key threat drivers include:
Reducing revenue streams
Rapidly increasing cost of care
Healthcare capacity challenges
Vulnerable hospitals in key safety net regions
Unfunded mandates
Healthcare worker challenges
Conclusion Seven:The largest threat to the healthcare safety net in SanDiego County is the potential failure to address the conclusionsof this report.
|| 176
Recommendations
|| 177
Recommendations – System Planning & Oversight
System Planning and Oversight
San Diego County stakeholders should develop a collaborative countywide coordination and oversight structure that uses a public/private partnership model. Early duties would include:
Create a vision statement for the safety netDevelop a countywide performance dashboard for the safety net which is periodically published to all stakeholders Develop a series of summits around the key safety net features recommended in this reportDevelop resources for needed studiesConduct site visits to best practice safety net communitiesMonitor the UCSD Medical Center and other healthcare provider’s transitions affecting the safety net
|| 178
Recommendations – System Planning & Oversight
System Planning and Oversight
Suggested membership might include executive leaders from:
Community clinicsHospitalsAccess/consumer advocatesCounty of San Diego representativesTargeted population stakeholder groupsMedical SocietyHealth plansBusiness communityElected officials Consumer groups representing all agesOther key stakeholders that have an interest in a strong healthcare safety net
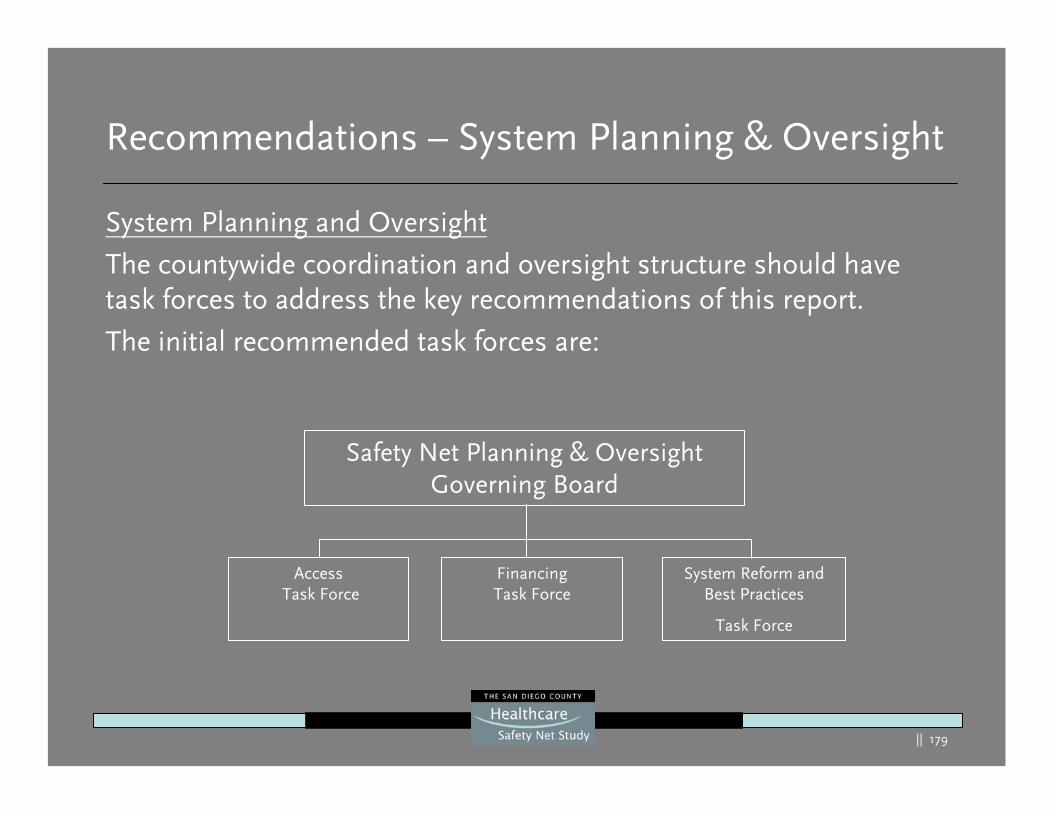
|| 179
Recommendations – System Planning & Oversight
System Planning and Oversight
The countywide coordination and oversight structure should have task forces to address the key recommendations of this report.
The initial recommended task forces are:
AccessTask Force
Safety Net Planning & Oversight Governing Board
FinancingTask Force
System Reform and Best Practices
Task Force
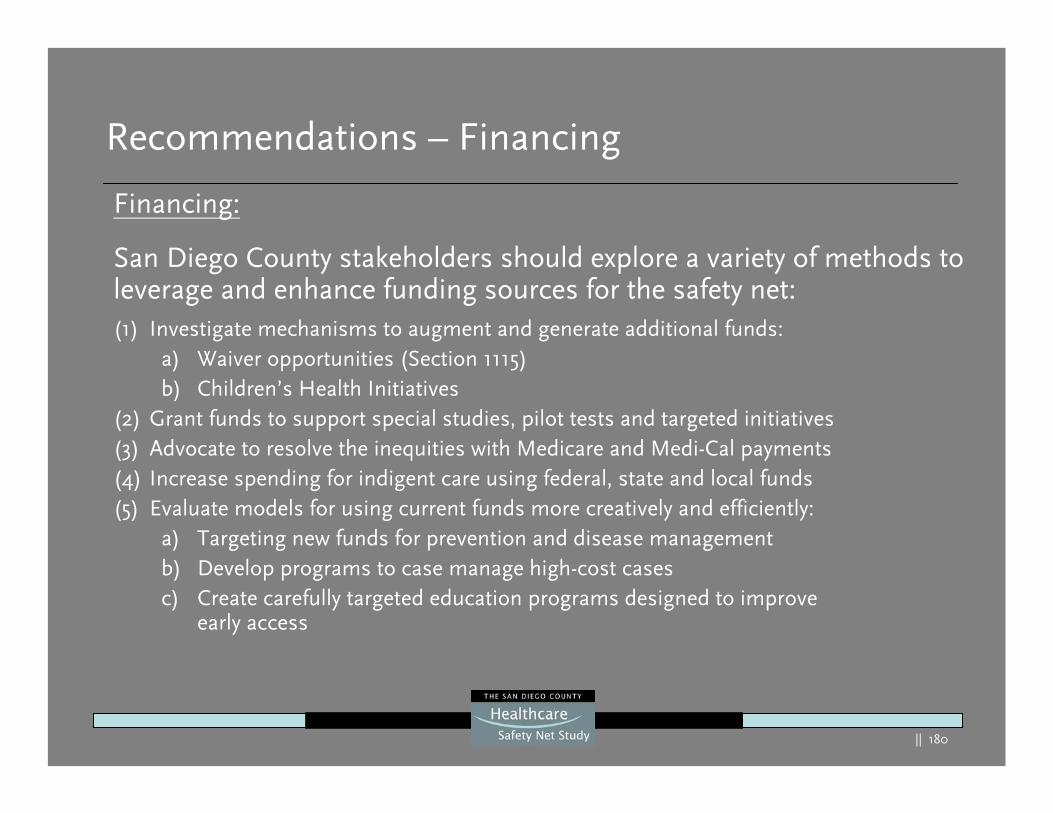
|| 180
Recommendations – Financing
Financing:
San Diego County stakeholders should explore a variety of methods to leverage and enhance funding sources for the safety net:(1) Investigate mechanisms to augment and generate additional funds:
a) Waiver opportunities (Section 1115)b) Children’s Health Initiatives
(2) Grant funds to support special studies, pilot tests and targeted initiatives(3) Advocate to resolve the inequities with Medicare and Medi-Cal payments(4) Increase spending for indigent care using federal, state and local funds (5) Evaluate models for using current funds more creatively and efficiently:
a) Targeting new funds for prevention and disease management b) Develop programs to case manage high-cost casesc) Create carefully targeted education programs designed to improve
early access
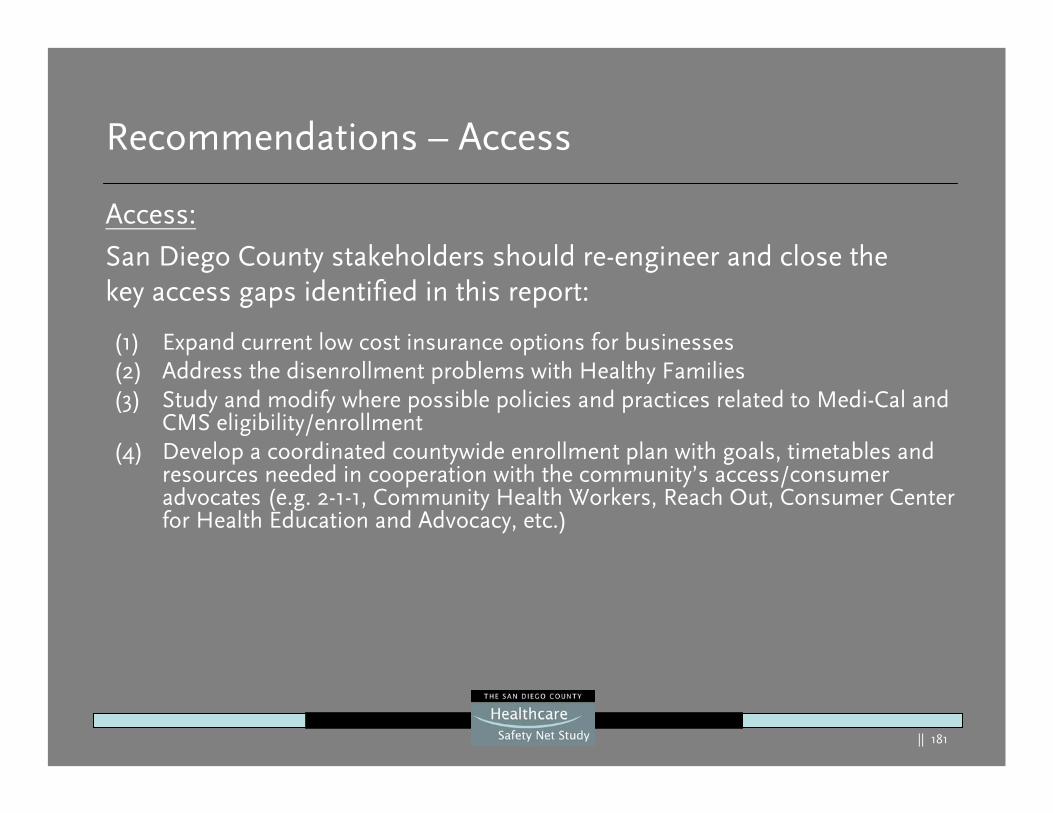
|| 181
Recommendations – Access
Access:
San Diego County stakeholders should re-engineer and close the key access gaps identified in this report:
(1) Expand current low cost insurance options for businesses (2) Address the disenrollment problems with Healthy Families(3) Study and modify where possible policies and practices related to Medi-Cal and
CMS eligibility/enrollment (4) Develop a coordinated countywide enrollment plan with goals, timetables and
resources needed in cooperation with the community’s access/consumer advocates (e.g. 2-1-1, Community Health Workers, Reach Out, Consumer Center for Health Education and Advocacy, etc.)
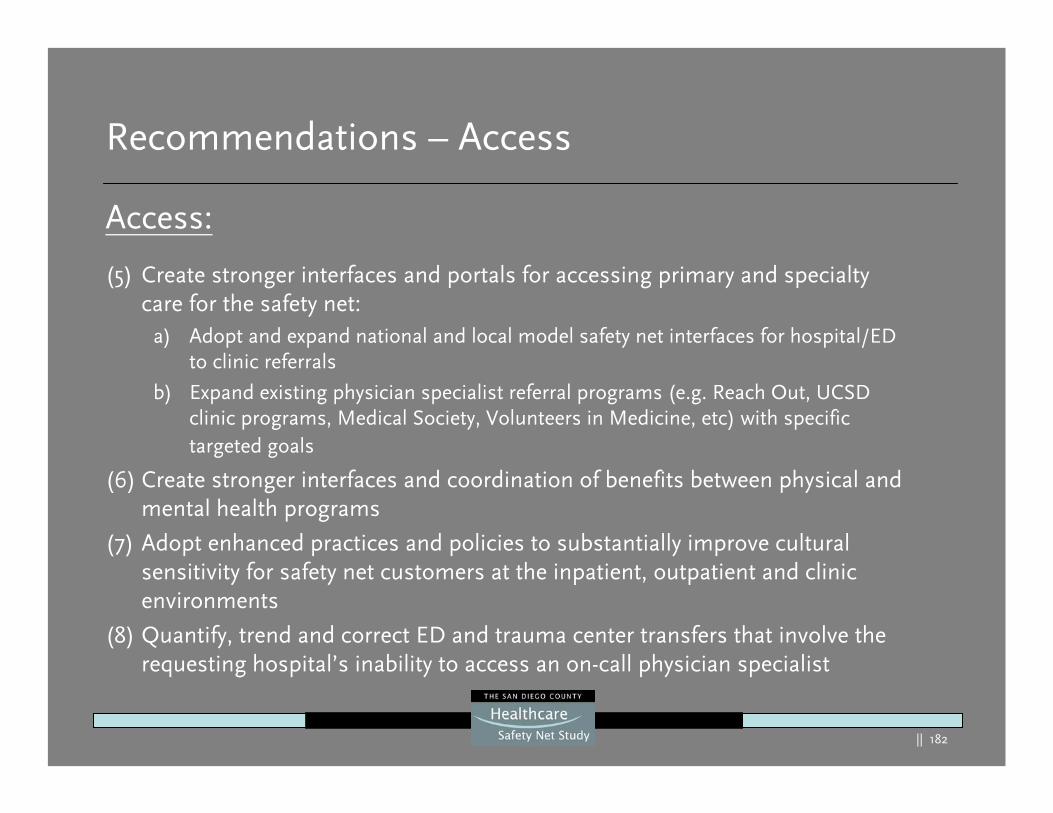
|| 182
Recommendations – Access
Access:
(5) Create stronger interfaces and portals for accessing primary and specialty care for the safety net:
a) Adopt and expand national and local model safety net interfaces for hospital/ED to clinic referrals
b) Expand existing physician specialist referral programs (e.g. Reach Out, UCSD clinic programs, Medical Society, Volunteers in Medicine, etc) with specific targeted goals
(6) Create stronger interfaces and coordination of benefits between physical and mental health programs
(7) Adopt enhanced practices and policies to substantially improve cultural sensitivity for safety net customers at the inpatient, outpatient and clinic environments
(8) Quantify, trend and correct ED and trauma center transfers that involve the requesting hospital’s inability to access an on-call physician specialist
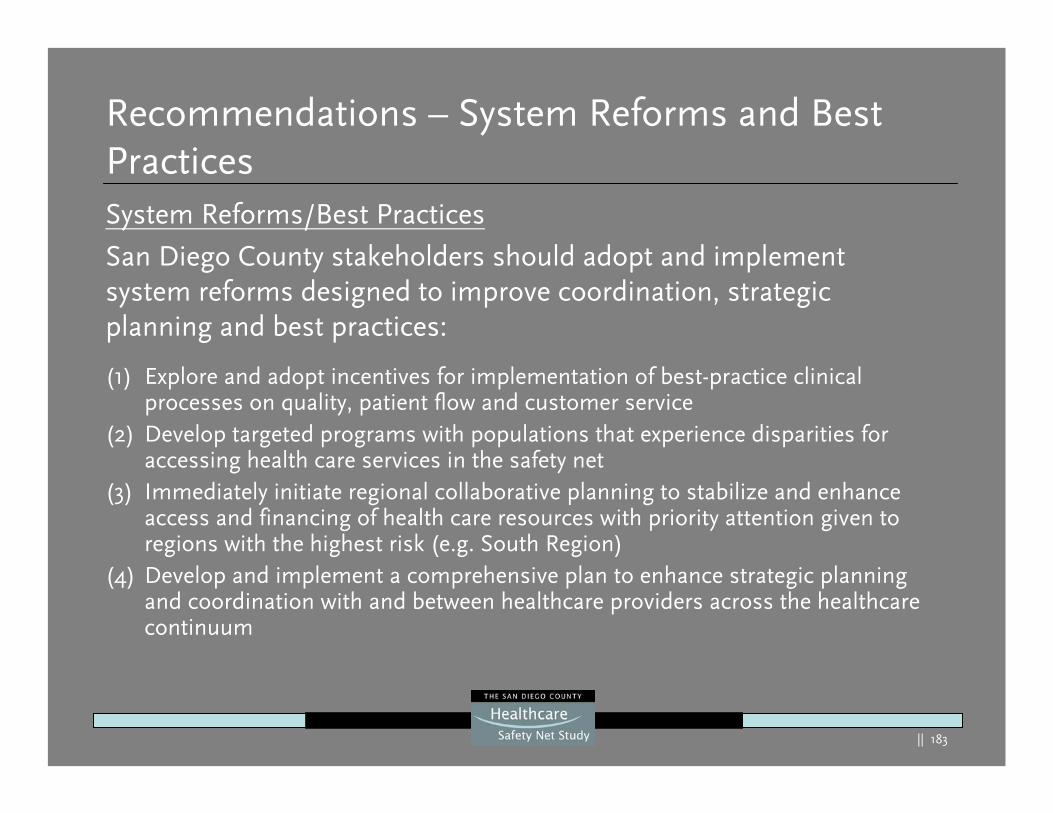
|| 183
Recommendations – System Reforms and Best Practices System Reforms/Best Practices
San Diego County stakeholders should adopt and implement system reforms designed to improve coordination, strategic planning and best practices:
(1) Explore and adopt incentives for implementation of best-practice clinical processes on quality, patient flow and customer service
(2) Develop targeted programs with populations that experience disparities for accessing health care services in the safety net
(3) Immediately initiate regional collaborative planning to stabilize and enhance access and financing of health care resources with priority attention given to regions with the highest risk (e.g. South Region)
(4) Develop and implement a comprehensive plan to enhance strategic planning and coordination with and between healthcare providers across the healthcare continuum
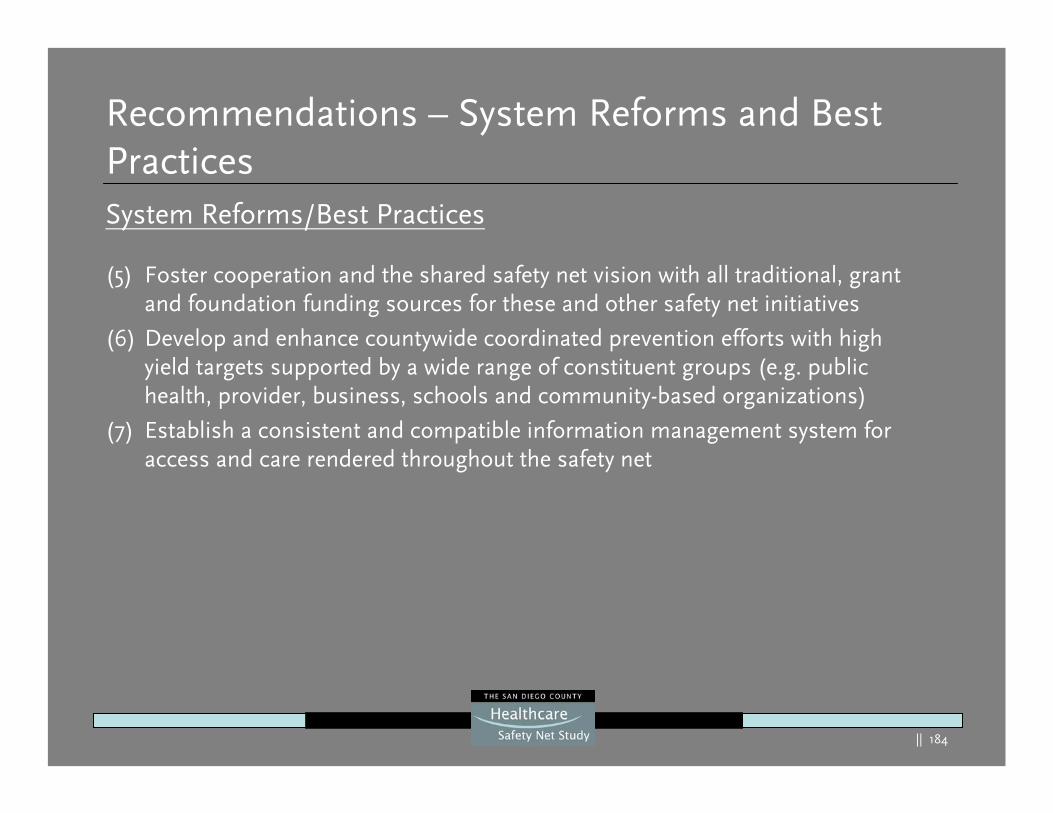
|| 184
Recommendations – System Reforms and Best Practices System Reforms/Best Practices
(5) Foster cooperation and the shared safety net vision with all traditional, grant and foundation funding sources for these and other safety net initiatives
(6) Develop and enhance countywide coordinated prevention efforts with high yield targets supported by a wide range of constituent groups (e.g. public health, provider, business, schools and community-based organizations)
(7) Establish a consistent and compatible information management system for access and care rendered throughout the safety net
|| 185
Thanks To Our Partners
Community:
Consumers
Many community coalitions and advocacy groups
Hospital, clinic and physician providers
Individual stakeholders with an interest in the safety net
San Diego County Health and Human Services Agency
Many members of the public that provided input for this study
|| 186
Appendix
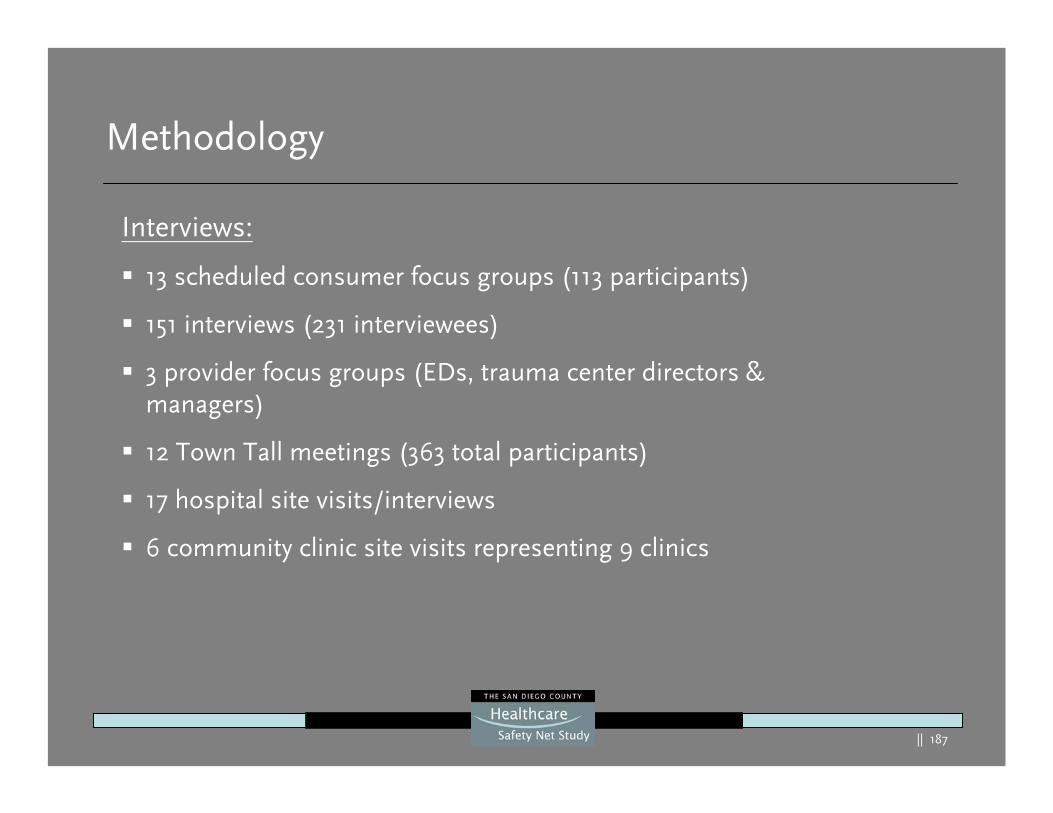
|| 187
Methodology
Interviews:
13 scheduled consumer focus groups (113 participants)
151 interviews (231 interviewees)
3 provider focus groups (EDs, trauma center directors & managers)
12 Town Tall meetings (363 total participants)
17 hospital site visits/interviews
6 community clinic site visits representing 9 clinics
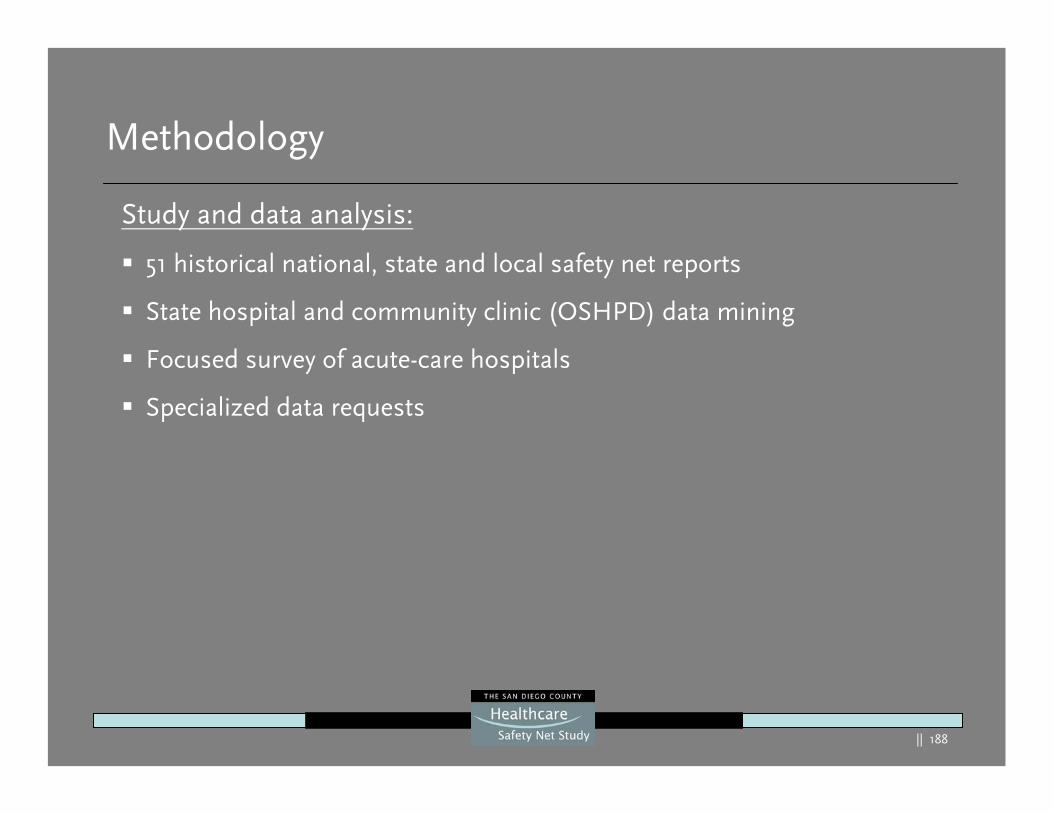
|| 188
Methodology
Study and data analysis:
51 historical national, state and local safety net reports
State hospital and community clinic (OSHPD) data mining
Focused survey of acute-care hospitals
Specialized data requests

|| 189
Key Project Staff
Technical:
The Abaris Group:
–Mike Williams, President
–Juliana Boyle, VP/Economist
–Mark Zocchi, Senior Analyst
–Bill Bullard, Senior Researcher
–Jonathan Chin, Senior Researcher
–Chuck Baucom, Mapping/GIS
–Dan Wong, Analyst
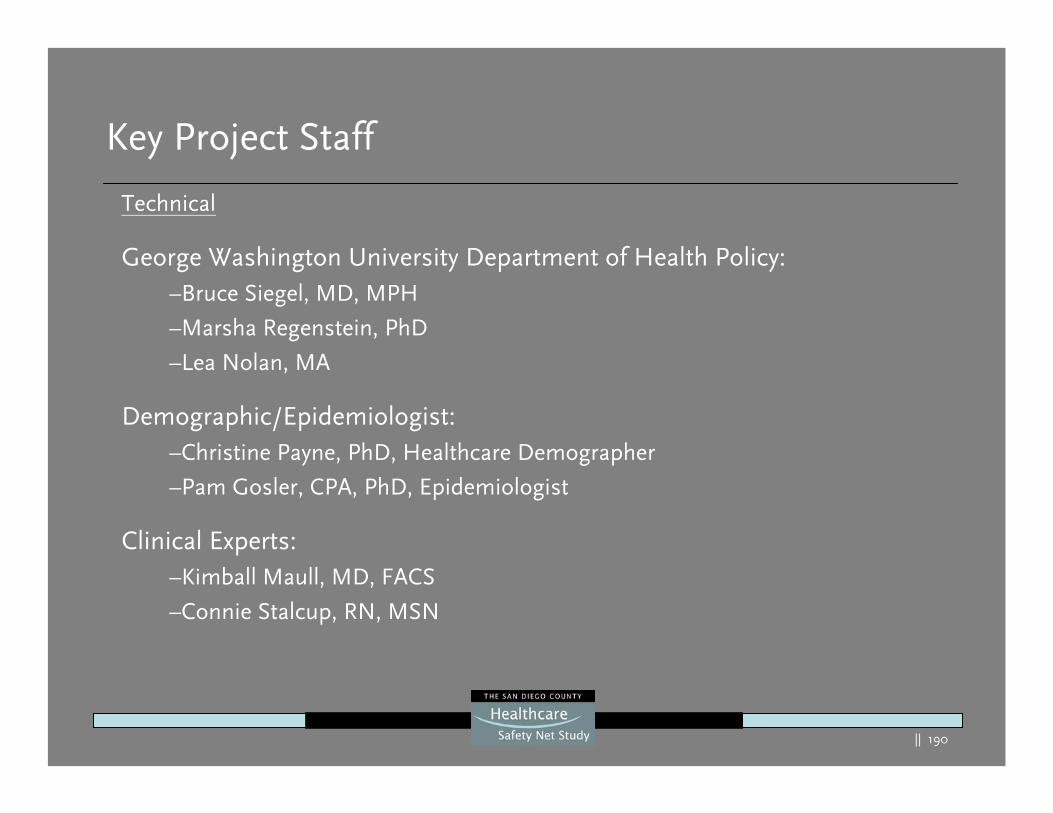
|| 190
Technical
George Washington University Department of Health Policy:–Bruce Siegel, MD, MPH
–Marsha Regenstein, PhD
–Lea Nolan, MA
Demographic/Epidemiologist:–Christine Payne, PhD, Healthcare Demographer
–Pam Gosler, CPA, PhD, Epidemiologist
Clinical Experts:–Kimball Maull, MD, FACS
–Connie Stalcup, RN, MSN
Key Project Staff

|| 191
Principles for the Safety Net Coordination Structure

|| 192
Countywide Coordination Structure - Principles
Principles of System Planning and Oversight
The general principles proposed for the countywide coordination and oversight structure are:
A collaborative approach to safety net planning and “global vision”increases the probability of the safety net improving and stabilizingThe coordination structure would have the potential of wielding significant informal leverage through the representative stakeholder’s volunteer endorsement of the principals and vision adopted by the structureA public/private partnership provides the ideal relationship and assures the highest potential to achieve success with the goals recommended for this studyValuing of identified local and published national best practices on safety net patient access, flow, customer service and cost efficiencies will assist in accelerating success with these goals

|| 193
Countywide Coordination Structure - Principles
Principles of System Planning and Oversight
The vision, goals and forecasts of this report represent a snapshot in time and should be verified or updated every three years

|| 194
Best Practice Communities and Resources
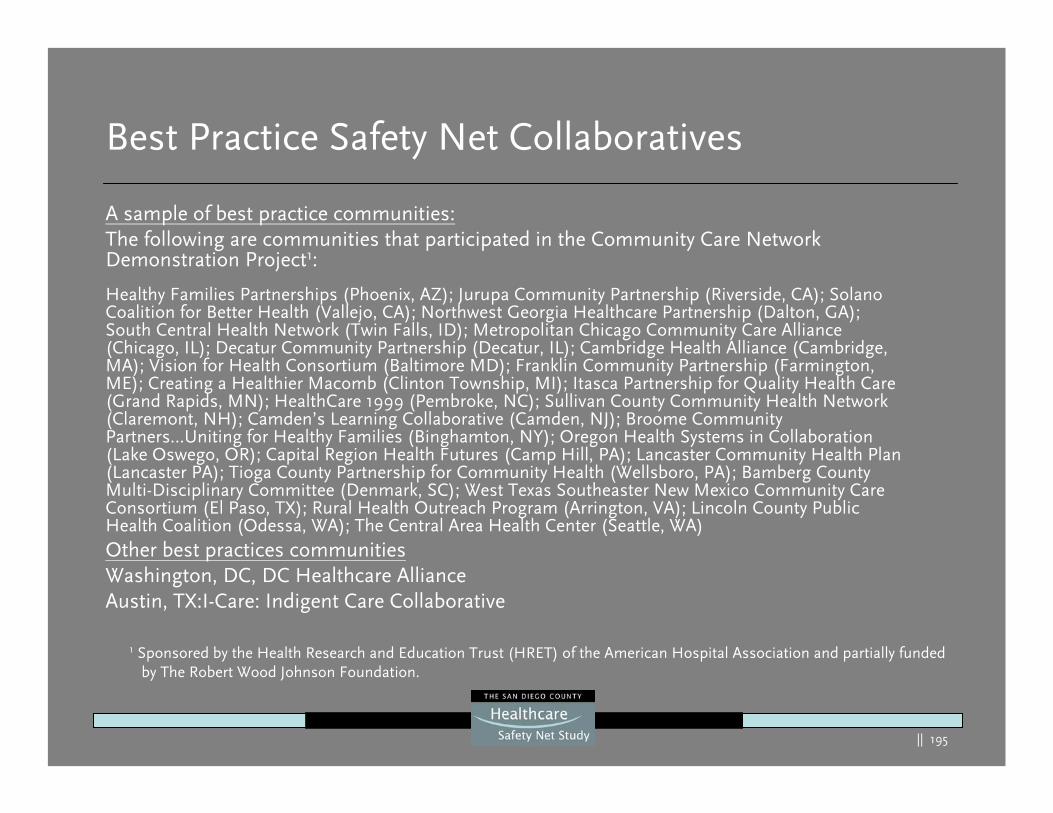
|| 195
Best Practice Safety Net Collaboratives
A sample of best practice communities:The following are communities that participated in the Community Care Network Demonstration Project1:
Healthy Families Partnerships (Phoenix, AZ); Jurupa Community Partnership (Riverside, CA); Solano Coalition for Better Health (Vallejo, CA); Northwest Georgia Healthcare Partnership (Dalton, GA); South Central Health Network (Twin Falls, ID); Metropolitan Chicago Community Care Alliance (Chicago, IL); Decatur Community Partnership (Decatur, IL); Cambridge Health Alliance (Cambridge, MA); Vision for Health Consortium (Baltimore MD); Franklin Community Partnership (Farmington, ME); Creating a Healthier Macomb (Clinton Township, MI); Itasca Partnership for Quality Health Care (Grand Rapids, MN); HealthCare 1999 (Pembroke, NC); Sullivan County Community Health Network (Claremont, NH); Camden’s Learning Collaborative (Camden, NJ); Broome Community Partners…Uniting for Healthy Families (Binghamton, NY); Oregon Health Systems in Collaboration (Lake Oswego, OR); Capital Region Health Futures (Camp Hill, PA); Lancaster Community Health Plan (Lancaster PA); Tioga County Partnership for Community Health (Wellsboro, PA); Bamberg County Multi-Disciplinary Committee (Denmark, SC); West Texas Southeaster New Mexico Community Care Consortium (El Paso, TX); Rural Health Outreach Program (Arrington, VA); Lincoln County Public Health Coalition (Odessa, WA); The Central Area Health Center (Seattle, WA)Other best practices communitiesWashington, DC, DC Healthcare AllianceAustin, TX:I-Care: Indigent Care Collaborative
1 Sponsored by the Health Research and Education Trust (HRET) of the American Hospital Association and partially funded by The Robert Wood Johnson Foundation.
|| 196
Best Practice Resources:
A sample of web sites that publish best practice outpatient and inpatient examples:
Institute of Health Improvement – ihi.org
Volunteer Hospital Association – vha.org
University Health System Consortium – uhc.edu
Urgent Matters – urgentmatters.org
Medical Group Management Association – mgma.com
National Association of Public Hospitals and Health Systems – naph.org
Healthcare Advisory Board – advisory.com
The Abaris Group – abarisgroup.com
1 Sponsored by the Health Research and Education Trust (HRET) of the American Hospital Association and partially funded by The Robert Wood Johnson Foundation.
|| 197
UCSD Medical Center –Additional Findings
|| 198
Findings - UCSD Medical Center PlansShort Term:
There are no planned inpatient bed moves for the next nine yearsTwo south county hospital providers have had serious financial challenges for in excess of five yearsThese challenges threaten all hospital providers in the South and Central regions. Those challenges are likely to drive a need to change their cost, revenue and/or service delivery models in the near futureThis short-term need exists irrespective of the planned move of UCSD’s inpatient beds
Note: There is a third hospital in the South region with a history of financial losses that has recently become more financially stable but could be at risk in the future.
|| 199
Findings - UCSD Medical Center PlansMedium Term (2015):
The move of 175 beds by 2014 will reduce inpatient capacity at UCSD Hillcrest by 46 percent (increasing capacity at their East Campus by 122 percent)
A modest number of patients are currently admitted to UCSD Medical Center from the South region (2,681) and approximately 50.5 percent of these patients are insured (e.g. Medicare, private and other insurance)
A larger number of patients are admitted from the Central region(6,649) of which 39.6 percent are insured
|| 200
Findings - UCSD Medical Center PlansMedium Term (2015):
The uninsured from the Central and South regions make up a smallpart of the inpatient admissions at UCSD Medical Center (1.7 percent and 4.6 percent,113 and 124 patients respectively) and the number of County Indigent is a modest number as well (10 percent for both regions, 665 and 268 patients respectively)The ED and trauma center will remain open during this time period and there will be no impact on these services with the exception of the likelihood of a small number of patients who would bypass that ED by ambulance to a closer full service hospital or that might need to be transferred from the Hillcrest campus or admitted to specialized units at their East campusUCSD Medical Center has significant faculty and resident relationships with physicians and community clinics that largely drive the source and location of hospital admissions
|| 201
Findings - UCSD Medical Center PlansMedium Term (2015):
For this time period, the move of 175 inpatient beds is potentially mitigated by the fact:– UCSD Medical Center has plans and will have the capacity to retain
and serve all UCSD patients after consolidation of inpatient beds.– With this move, UCSD Medical Center will be able to operate at their
full licensed capacity which they have not been able to do for some years.
– A large percentage (86%) of UCSD Medical Center’s work is outpatient and outpatient services are expected to remain and expand at the Hillcrest campus
– A large percent of the inpatients will be insured– Existing hospital capacity is likely to be available within the South and
Central regions to partially meet the potential incremental patient needs and capacity is available in other regions to totally meet this need
|| 202
Findings - UCSD Medical Center Plans
Medium Term (2015) (con’t):
The move of the initial 175 inpatient beds is further potentially mitigated by the fact:
– The announced opening of a clinical decision unit (CDU) at both campuses will likely reduce ED inpatient admissions by up to 30 percent1
– Outpatient services at Hillcrest will remain the same or grow
– Those needing transportation (e.g. family members of Hillcrest displaced East campus inpatients) will be met by the hospital’s planned transportation service (twice hourly and subject to expansion)
1 This assumes the hospital operates a state of the art observation medicine program consistent with those that have demonstrated admission rate reductions and improve cost effectiveness of the care.
|| 203
Findings - UCSD Medical Center PlansLonger Term(2025):
The complete move of all 385 beds coupled with the lack of hospital expansion plans in the Central and South regions will impact theaccess for those patients that have historically used UCSD Medical Center Hillcrest for inpatient admissions that choose to or are unable to be admitted at their East campusWhile there will likely be sufficient total beds in the county to meet total patient needs, the location of these inpatient beds will not necessarily be in the regions where the patients resideThe access gap will mean for some patients who cannot get their care at a local hospital, that they will be disproportionately affected and their transport and commute times will be longer A gap is likely to exist with or without the move of UCSD Medical Center
|| 204
Findings - UCSD Medical Center PlansLonger Term(2025):This is potentially mitigated by:
The actual capacity will exist at their East campus to handle inpatient demandThere is current and expected expansion of inpatient beds throughout the county that also could meet this demandThe existence of a freestanding ED or similar product and the CDU will likely mitigate most of the ED needs and a portion of the inpatient needs (only lower acuity patients will likely to be transported by ambulance to the freestanding ED/urgent care center)UCSD Medical Center and numerous other San Diego hospital providers have successfully operated in the past as countywide providers and safety net providers
1 This assumes the hospital operates a freestanding ED and a state of the art observation medicine unit consistent with other national models.
|| 205.
Findings - UCSD Medical Center PlansOther general findings:
While the data suggests that actual future capacity needs will be met, the emotional impact cannot be ignoredWhen a hospital leaves a region in a community where it has been a leader in healthcare for the poor, it is likely to be perceived as having a significant impact on those who reside in that community whether they can receive care elsewhere or notFor some poor and the other underinsured who need inpatient careand cannot get it in the community they reside:– Inpatient care will necessarily have to be provided in other regions– Patients will require longer transport times– Some family members will experience some delays and challenges when
visiting their family members who are admitted to other hospitals outside the regions they live
In both the Central and particularly the South regions, long waits in the ED and ambulance bypass/diversion have been historical problems and will likely be further impacted by the lack bed planning within those region providers and only modestly by the inpatient move UCSD Medical Center Hillcrest
|| 206
Findings - UCSD Medical Center PlansLonger Term(2025):
UCSD Medical Center plans to move their trauma center to their East
campus. An automatic move is not possible under current State
regulations:
Current State regulation requires that a redesignation process occur for any new trauma center
A revised State-approved trauma plan would also be likely needed
The previous trauma system study submitted to the Board of Supervisors1:– Recommends that a complete needs assessment be conducted if any
trauma center were to close
– The needs assessment should include reassessing many of the volume-driven assumptions of the trauma system including trauma triage procedures, on-call coverage costs, the practice of co-locating trauma centers, etc. 1 San Diego Trauma System Assessment, The Abaris
Group , 2003

|| 207
San Diego County Information Technology Best Practice
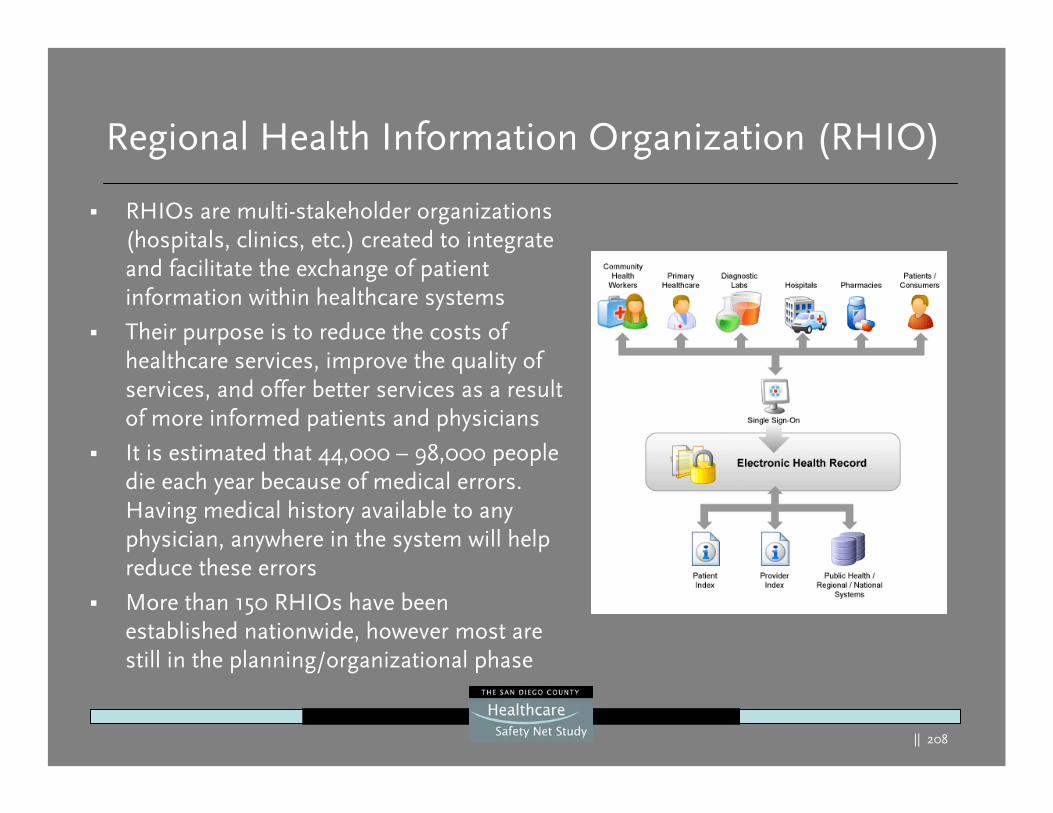
|| 208
Regional Health Information Organization (RHIO)
RHIOs are multi-stakeholder organizations (hospitals, clinics, etc.) created to integrate and facilitate the exchange of patient information within healthcare systems
Their purpose is to reduce the costs of healthcare services, improve the quality of services, and offer better services as a result of more informed patients and physicians
It is estimated that 44,000 – 98,000 people die each year because of medical errors. Having medical history available to any physician, anywhere in the system will help reduce these errors
More than 150 RHIOs have been established nationwide, however most are still in the planning/organizational phase
|| 209
San Diego Medical Information Network Exchange (SD Mine)
San Diego County Medical Society and California Institute of Information Technology & Telecommunications are working together to develop a countywide strategy to deliver “real time” healthcare information via a RHIO
The initiative is called SD Mine and is funded by a grant from the Blue Shield of California Foundation
It is being designed to yield measurable improvements in quality and patient safety for healthcare providers
The initial project is focused on linking the 19 emergency departments throughout San Diego to find underinsured and uninsured patients, who use the ED as their main source of medical care, a medical home (a physician or clinic)
Many of these underinsured and uninsured patients are eligible for some type of coverage, but have difficulty completing the paperwork to enroll
CalRHIO, a not-for-profit statewide organization providing services to RHIOs in California, is working closely with SD MINE to help the initiative meet statewide guidelines
|| 210
Capacity Challenges for Major Emergencies
|| 211
Disaster Preparedness
The underlying philosophy of disaster management is that every event is handled at the lowest possible geographic, organizational and jurisdictional level.
~ Department of Homeland Security (DHS), 2004
|| 212
National Preparedness
Regions must be self-sufficient for at least 72 hoursIdentify surge capabilities in both hospitals and alternate care sitesActivate additional staffing, such as Medical Reserve Corps (MRC)Educate citizens on self-help and supporting others (e.g. CERT)DHS, HRSA and CDC funding available to counties to prepare
Equipment – Strategic National Stockpile (SNS) includes ventilators, antivirals, antibiotics, other medical supplies Staffing – Disaster Medical Assistance Teams (DMAT)Funding – Reimbursement for operations, additional staffing, etc.Coordination – National Incident Management System (NIMS)
Regional Preparedness
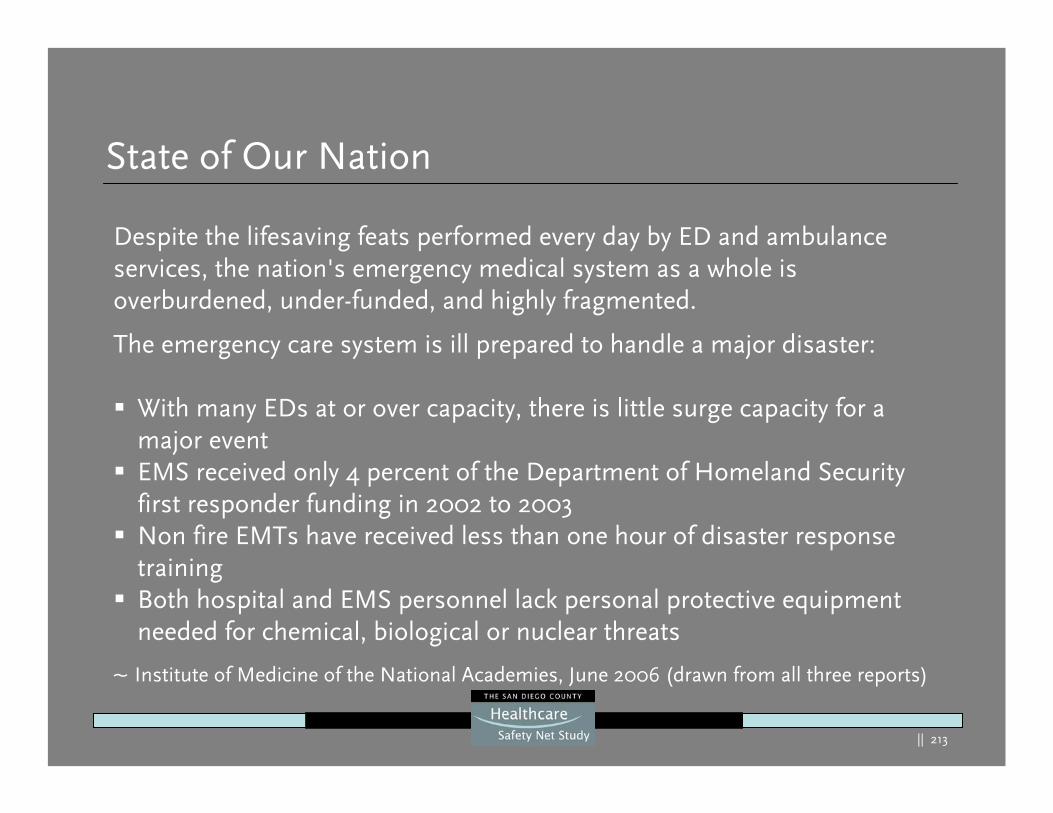
|| 213
State of Our Nation
Despite the lifesaving feats performed every day by ED and ambulance services, the nation's emergency medical system as a whole is overburdened, under-funded, and highly fragmented.
The emergency care system is ill prepared to handle a major disaster:
With many EDs at or over capacity, there is little surge capacity for a major eventEMS received only 4 percent of the Department of Homeland Security first responder funding in 2002 to 2003Non fire EMTs have received less than one hour of disaster response trainingBoth hospital and EMS personnel lack personal protective equipment needed for chemical, biological or nuclear threats
~ Institute of Medicine of the National Academies, June 2006 (drawn from all three reports)
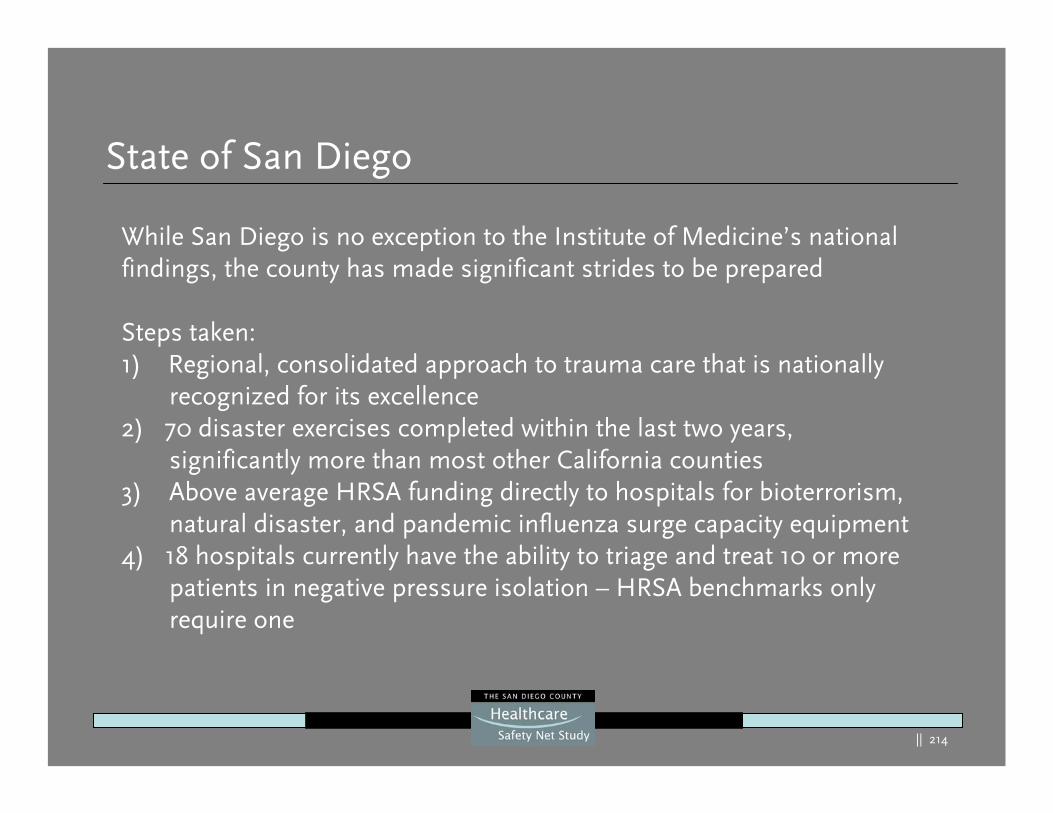
|| 214
State of San Diego
While San Diego is no exception to the Institute of Medicine’s national findings, the county has made significant strides to be prepared
Steps taken:1) Regional, consolidated approach to trauma care that is nationally
recognized for its excellence2) 70 disaster exercises completed within the last two years,
significantly more than most other California counties3) Above average HRSA funding directly to hospitals for bioterrorism,
natural disaster, and pandemic influenza surge capacity equipment 4) 18 hospitals currently have the ability to triage and treat 10 or more
patients in negative pressure isolation – HRSA benchmarks only require one
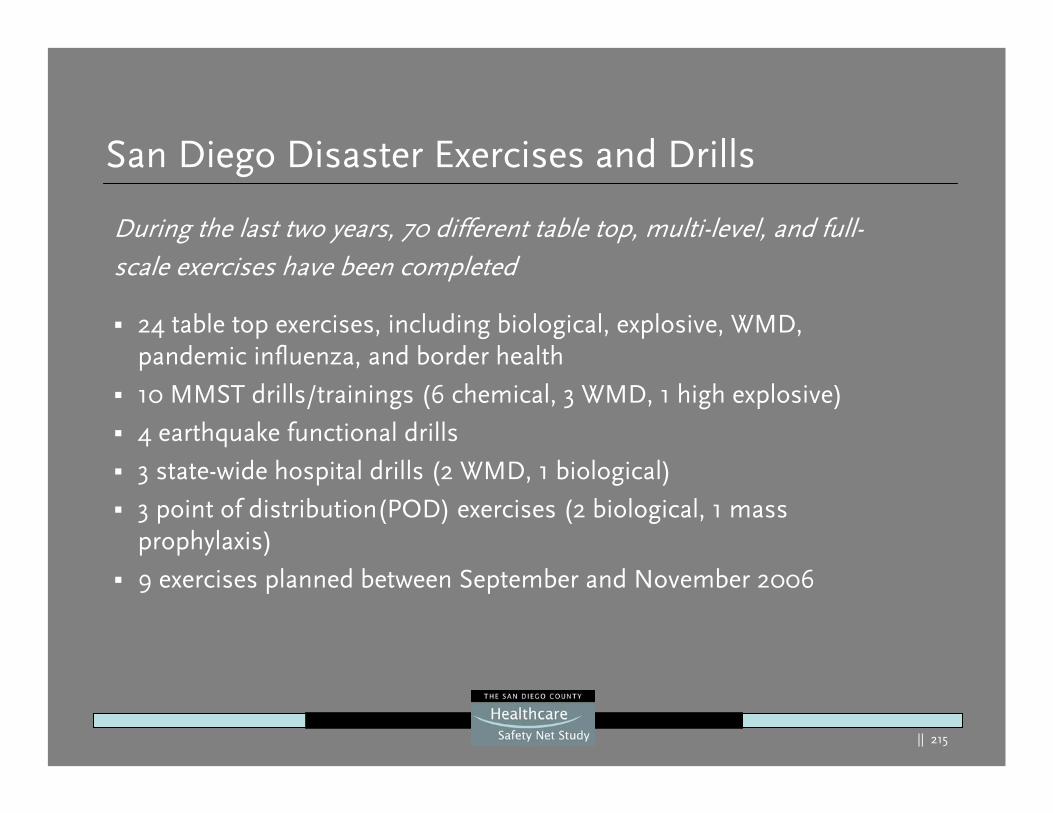
|| 215
During the last two years, 70 different table top, multi-level, and full-scale exercises have been completed
24 table top exercises, including biological, explosive, WMD, pandemic influenza, and border health
10 MMST drills/trainings (6 chemical, 3 WMD, 1 high explosive)
4 earthquake functional drills
3 state-wide hospital drills (2 WMD, 1 biological)
3 point of distribution(POD) exercises (2 biological, 1 mass prophylaxis)
9 exercises planned between September and November 2006
San Diego Disaster Exercises and Drills
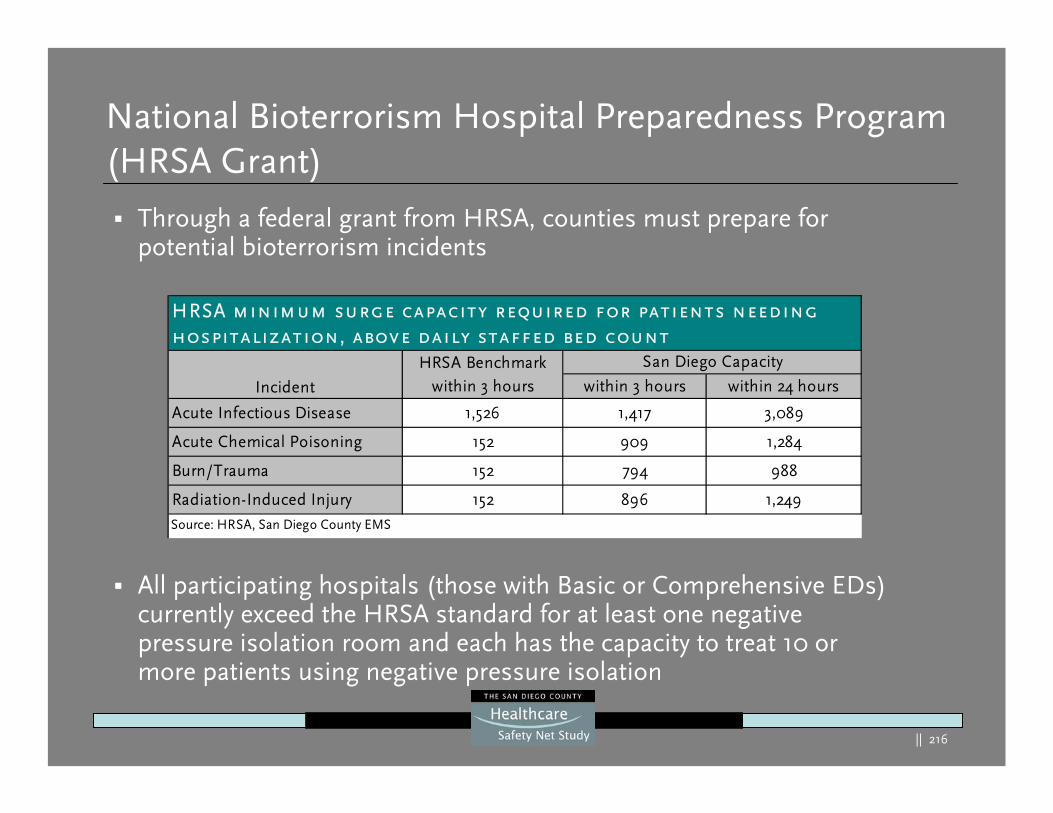
|| 216
National Bioterrorism Hospital Preparedness Program (HRSA Grant)
Through a federal grant from HRSA, counties must prepare for potential bioterrorism incidents
All participating hospitals (those with Basic or Comprehensive EDs) currently exceed the HRSA standard for at least one negative pressure isolation room and each has the capacity to treat 10 ormore patients using negative pressure isolation
within 3 hours within 24 hours
Acute Infectious Disease 1,526 1,417 3,089
Acute Chemical Poisoning 152 909 1,284
Burn/Trauma 152 794 988
Radiation-Induced Injury 152 896 1,249
HRSA minimum surge capacity required for patients needing hospitalization, above daily staffed bed count
Source: HRSA, San Diego County EMS
HRSA Benchmarkwithin 3 hours
San Diego Capacity
Incident
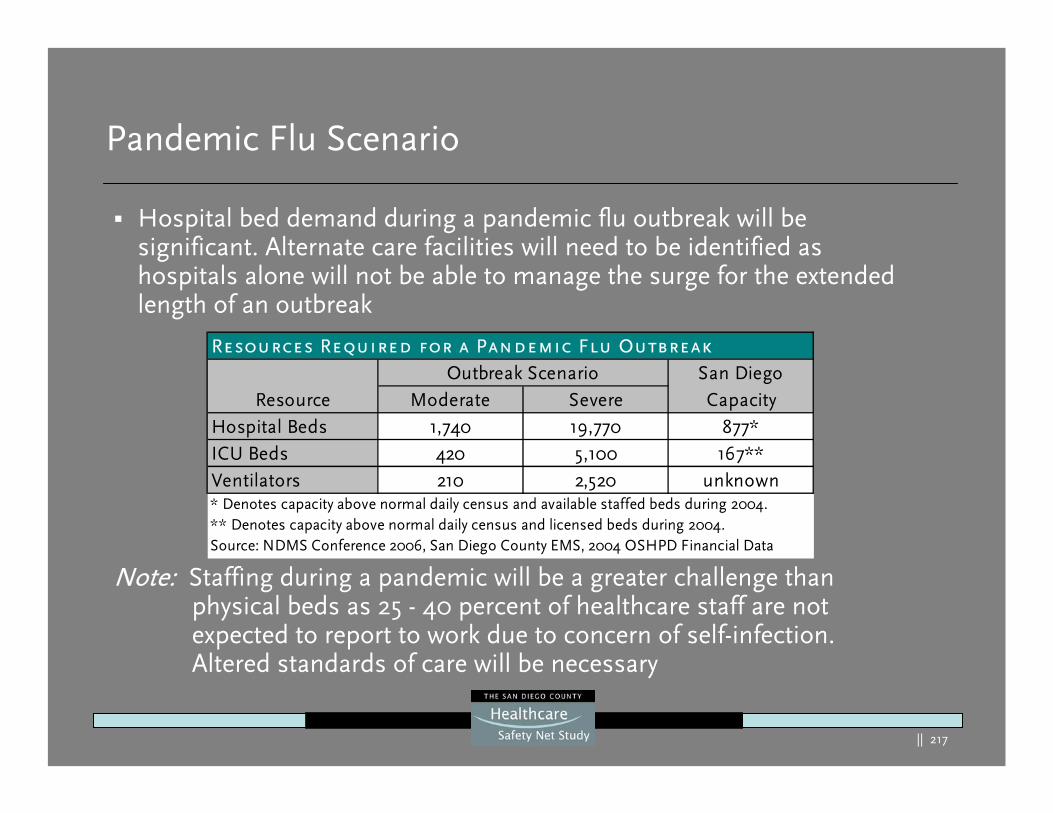
|| 217
Pandemic Flu Scenario
Hospital bed demand during a pandemic flu outbreak will be significant. Alternate care facilities will need to be identified as hospitals alone will not be able to manage the surge for the extended length of an outbreak
Note: Staffing during a pandemic will be a greater challenge than physical beds as 25 - 40 percent of healthcare staff are not expected to report to work due to concern of self-infection. Altered standards of care will be necessary
Moderate SevereHospital Beds 1,740 19,770 877*ICU Beds 420 5,100 167**Ventilators 210 2,520 unknown
Resource
Resources Required for a Pandemic Flu OutbreakSan Diego Capacity
Outbreak Scenario
Source: NDMS Conference 2006, San Diego County EMS, 2004 OSHPD Financial Data
* Denotes capacity above normal daily census and available staffed beds during 2004.** Denotes capacity above normal daily census and licensed beds during 2004.

|| 218
The Safety Net Nationally and Statewide
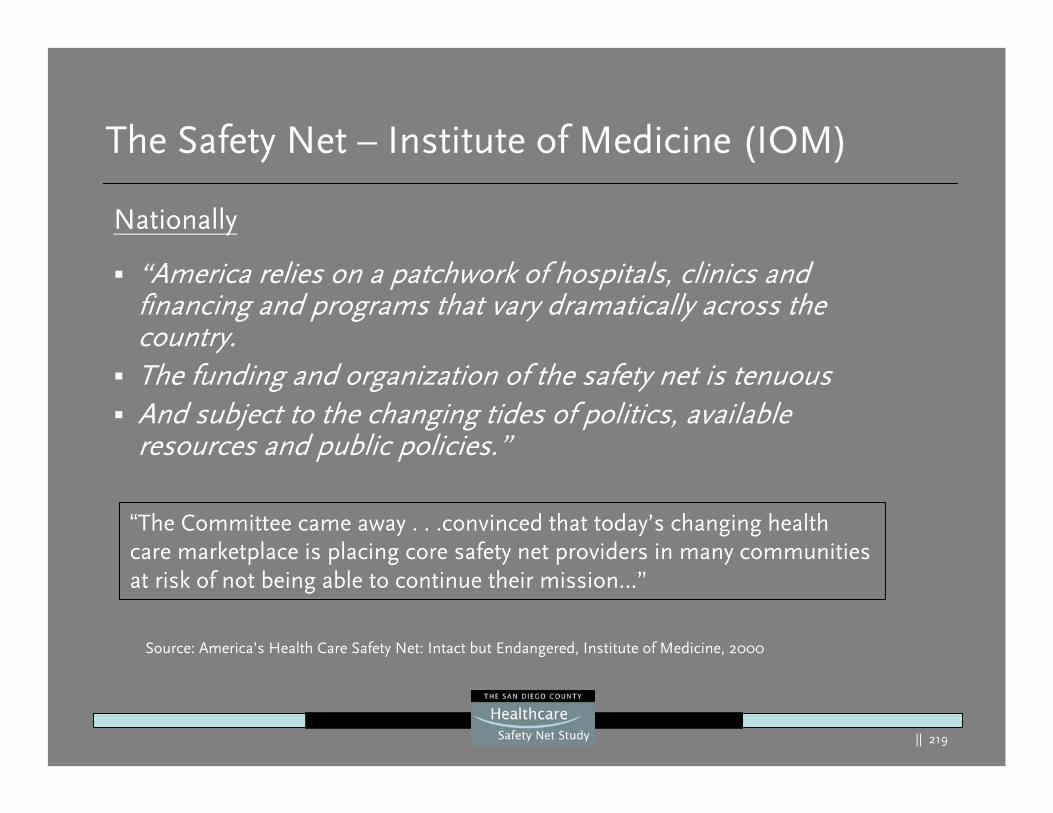
|| 219
The Safety Net – Institute of Medicine (IOM)
Nationally
“America relies on a patchwork of hospitals, clinics and financing and programs that vary dramatically across the country.The funding and organization of the safety net is tenuousAnd subject to the changing tides of politics, available resources and public policies.”
Source: America’s Health Care Safety Net: Intact but Endangered, Institute of Medicine, 2000
“The Committee came away . . .convinced that today’s changing health care marketplace is placing core safety net providers in many communities at risk of not being able to continue their mission…”
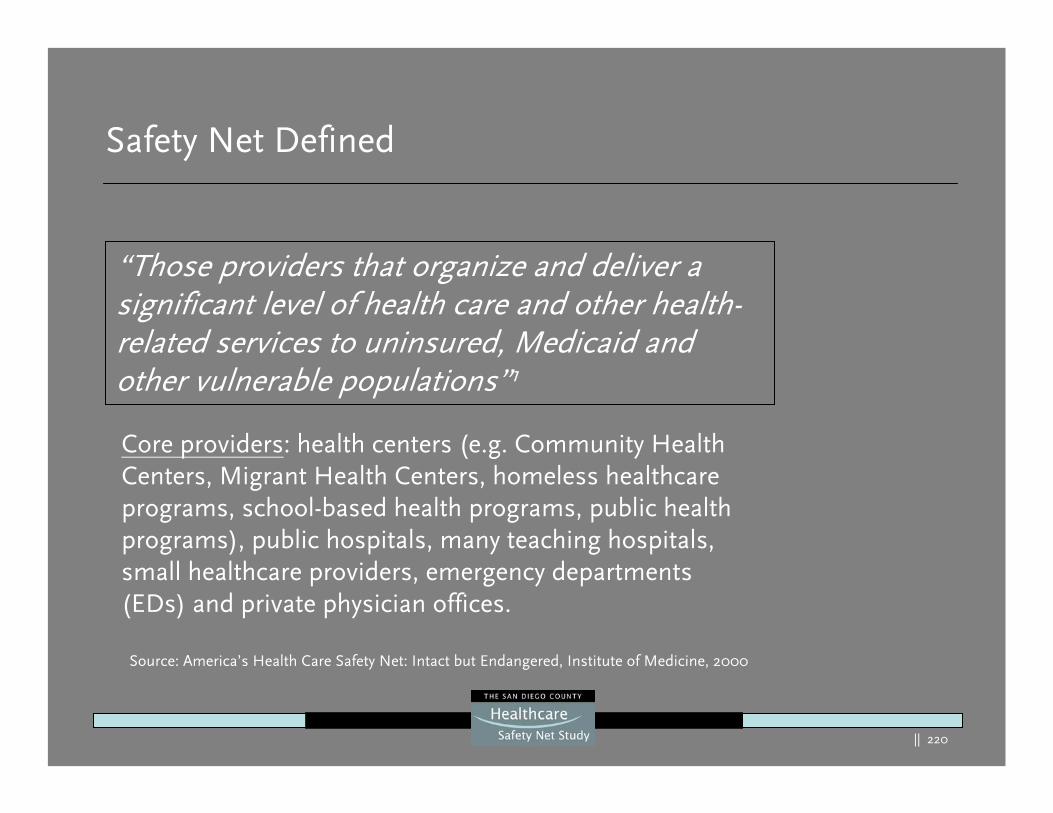
|| 220
Safety Net Defined
“Those providers that organize and deliver a significant level of health care and other health-related services to uninsured, Medicaid and other vulnerable populations”1
Core providers: health centers (e.g. Community Health Centers, Migrant Health Centers, homeless healthcare programs, school-based health programs, public health programs), public hospitals, many teaching hospitals, small healthcare providers, emergency departments (EDs) and private physician offices.
Source: America’s Health Care Safety Net: Intact but Endangered, Institute of Medicine, 2000
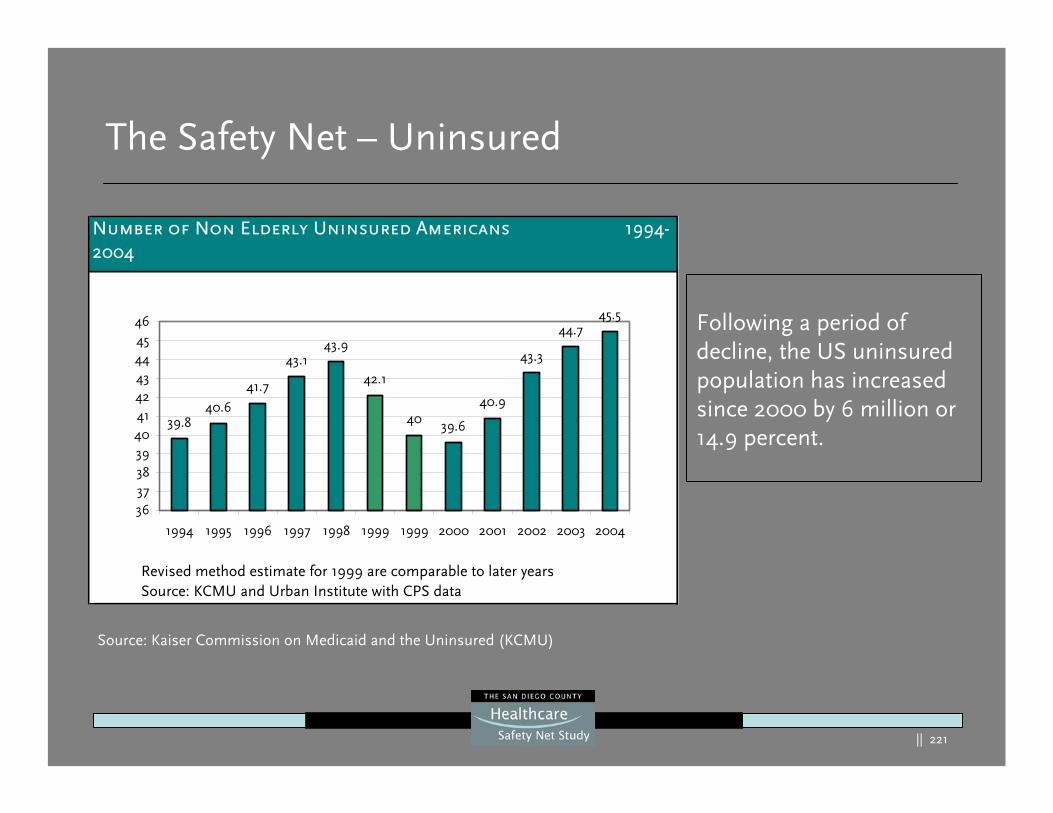
|| 221
The Safety Net – Uninsured
Following a period of decline, the US uninsured population has increased since 2000 by 6 million or 14.9 percent.
Number of Non Elderly Uninsured Americans 1994-2004
39.840.6
41.7
43.143.9
42.1
40 39.6
40.9
43.3
44.745.5
3637383940414243444546
1994 1995 1996 1997 1998 1999 1999 2000 2001 2002 2003 2004
Revised method estimate for 1999 are comparable to later yearsSource: KCMU and Urban Institute with CPS data
Source: Kaiser Commission on Medicaid and the Uninsured (KCMU)
|| 222
The Safety Net – Uninsured
Factors Affecting Change:
Mid to late 1990s, employer-sponsored coverage gradually increased – fueled by a robust economy, low unemployment rates, increases in real wages and slow growth in health premiumsBy 1999 the percentage of people covered by Medicaid stabilized and modest increases in private coverage helped to decrease the number of uninsuredEconomic growth stalled in 2001 causing 7 million more of the population to move to poverty by 2004
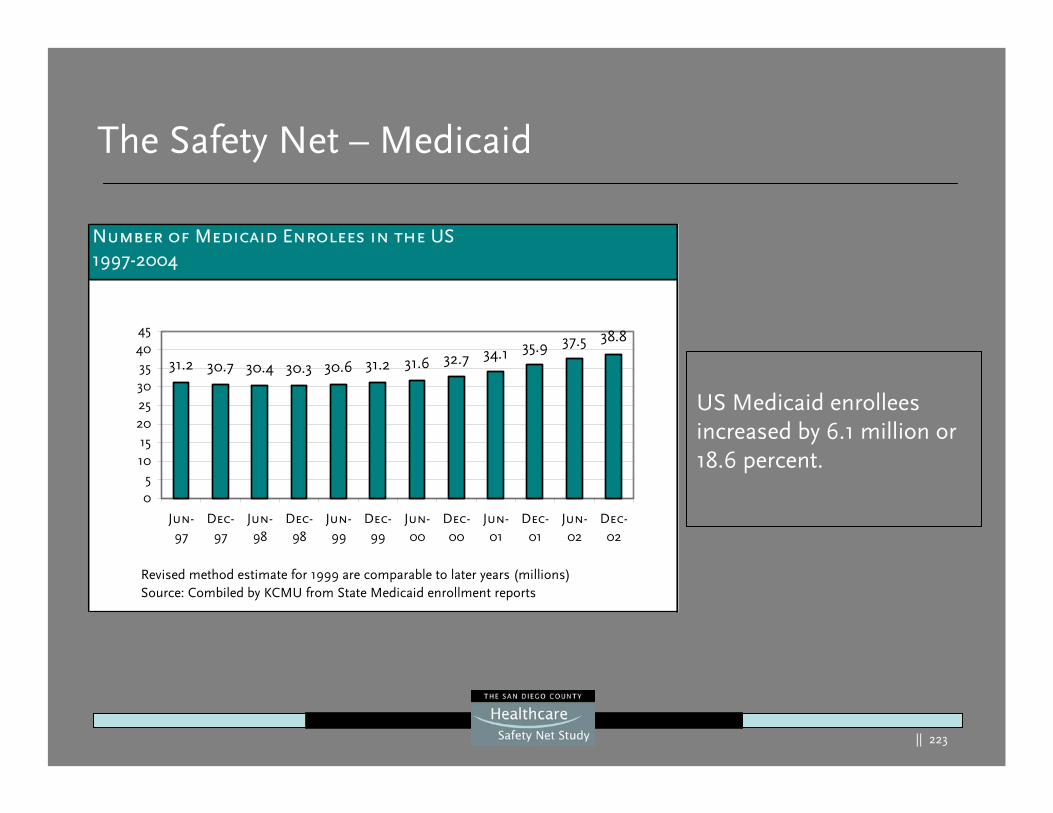
|| 223
The Safety Net – Medicaid
US Medicaid enrollees increased by 6.1 million or 18.6 percent.
Number of Medicaid Enrolees in the US 1997-2004
31.2 30.7 30.4 30.3 30.6 31.2 31.6 32.7 34.1 35.9 37.5 38.8
05
1015
202530354045
Jun-97
Dec-97
Jun-98
Dec-98
Jun-99
Dec-99
Jun-00
Dec-00
Jun-01
Dec-01
Jun-02
Dec-02
Revised method estimate for 1999 are comparable to later years (millions)Source: Combiled by KCMU from State Medicaid enrollment reports
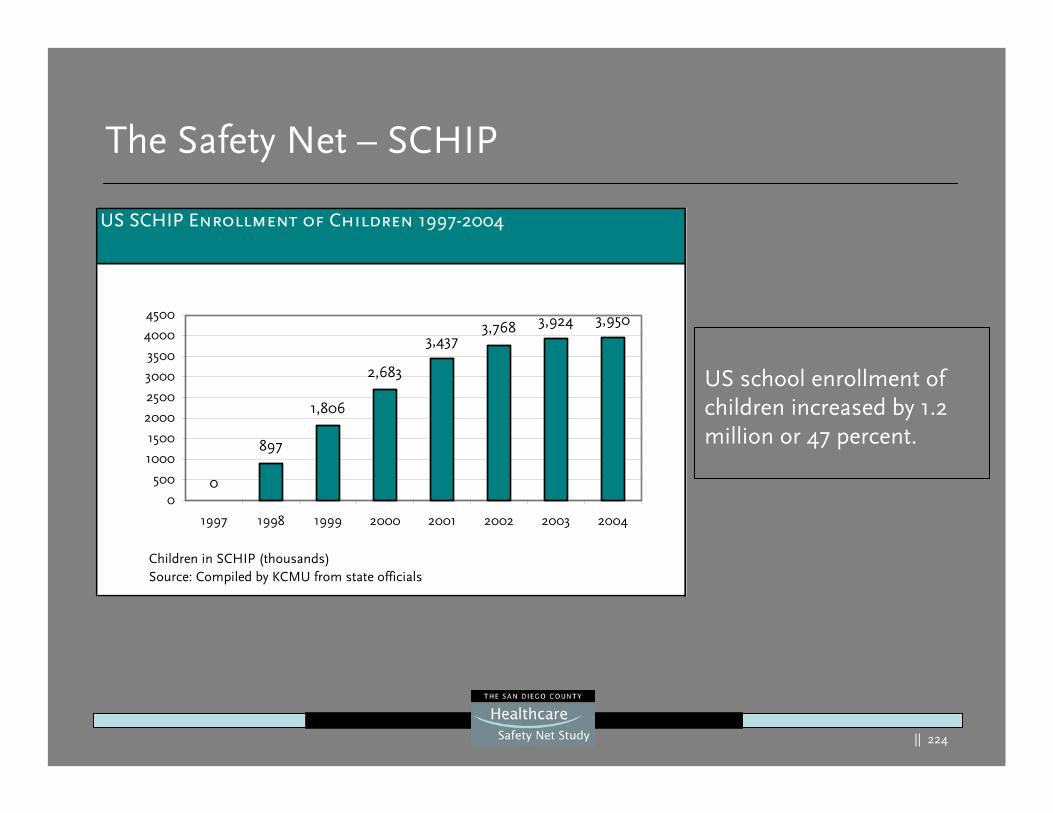
|| 224
The Safety Net – SCHIP
US school enrollment of children increased by 1.2 million or 47 percent.
US SCHIP Enrollment of Children 1997-2004
0
897
1,806
2,683
3,4373,768 3,924 3,950
0
500
1000
1500
2000
2500
3000
3500
4000
4500
1997 1998 1999 2000 2001 2002 2003 2004
Children in SCHIP (thousands)Source: Compiled by KCMU from state officials
|| 225
The Safety Net – Medicaid/SCHIP
Factors Affecting Change:
Enrollment in Medicaid and SCHIP has increased to the greater numbers that qualify Enrollment has also increased in response to significant outreach effortsChildren’s rates of uninsured have actually decreased slightly between 2000-2004 and the number of uninsured children has not grown
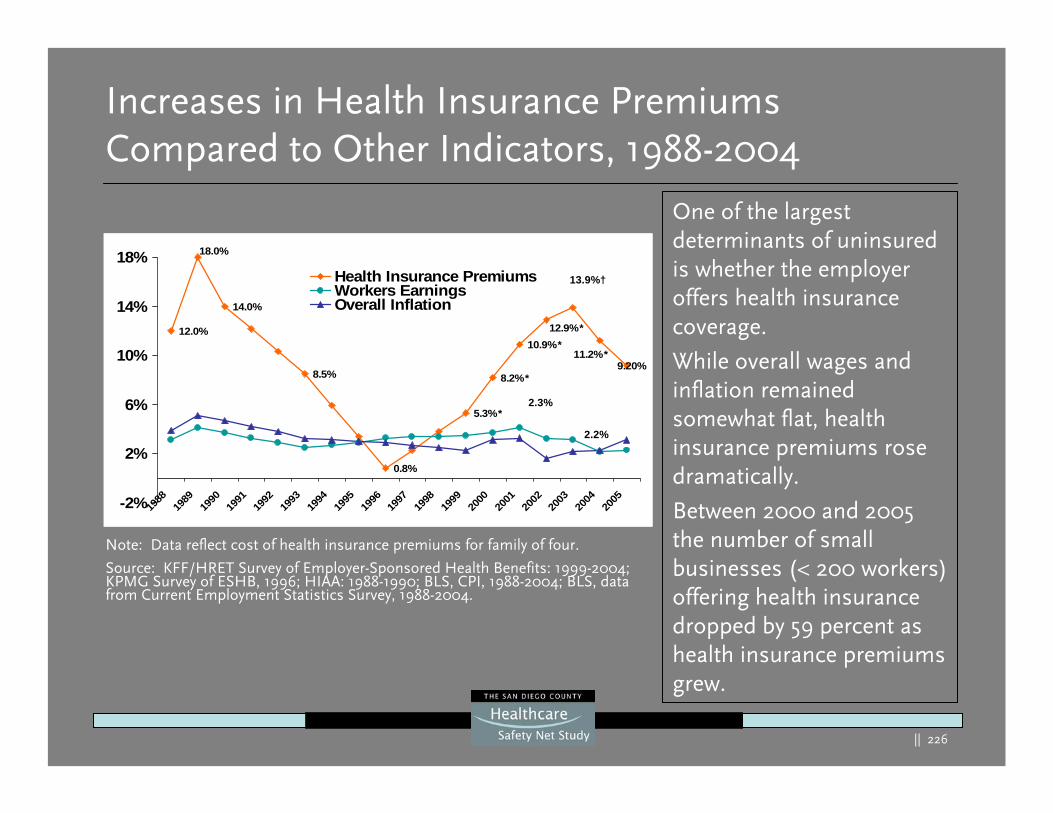
|| 226
12.0%
14.0%
8.5%
0.8%
9.20%11.2%*
5.3%*
8.2%*
10.9%*12.9%*
18.0%
-2%
2%
6%
10%
14%
18%
1988
1989
1990
1991
1992
1993
1994
1995
1996
1997
1998
1999
2000
2001
2002
2003
2004
2005
Health Insurance PremiumsWorkers EarningsOverall Inflation
Increases in Health Insurance Premiums Compared to Other Indicators, 1988-2004
Note: Data reflect cost of health insurance premiums for family of four.
Source: KFF/HRET Survey of Employer-Sponsored Health Benefits: 1999-2004; KPMG Survey of ESHB, 1996; HIAA: 1988-1990; BLS, CPI, 1988-2004; BLS, data from Current Employment Statistics Survey, 1988-2004.
13.9%†
2.3%
2.2%
One of the largest determinants of uninsured is whether the employer offers health insurance coverage.
While overall wages and inflation remained somewhat flat, health insurance premiums rose dramatically.
Between 2000 and 2005 the number of small businesses (< 200 workers) offering health insurance dropped by 59 percent as health insurance premiums grew.
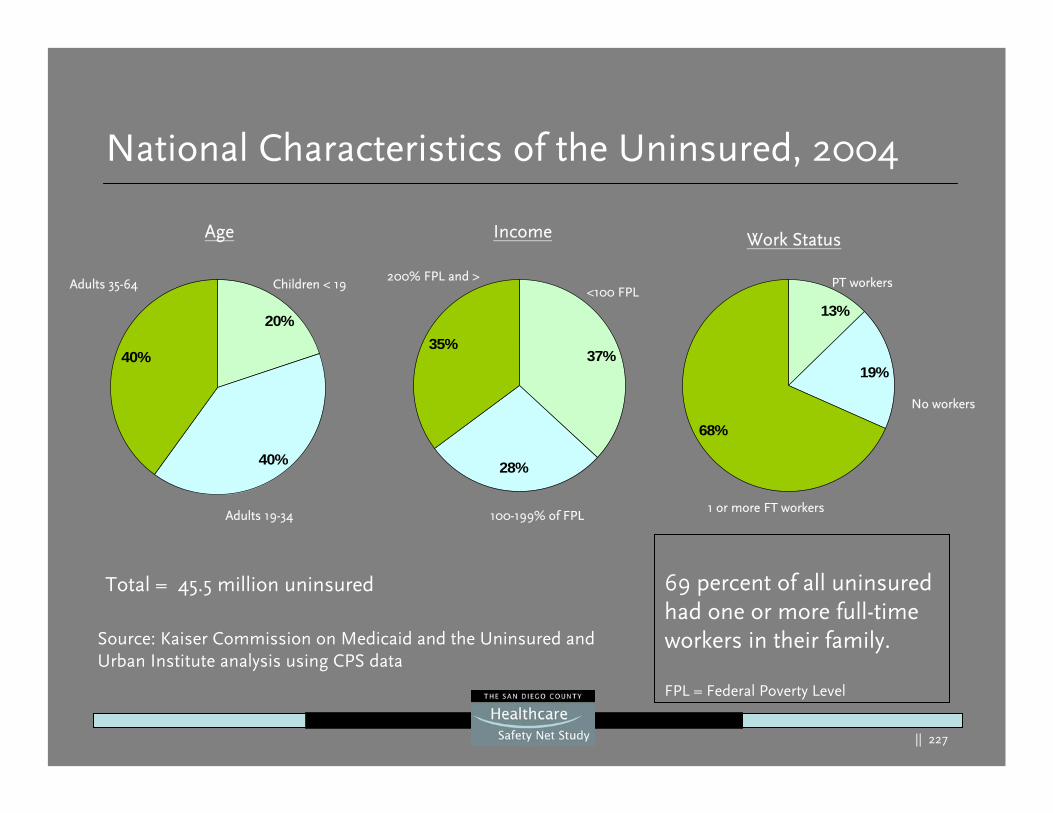
|| 227
National Characteristics of the Uninsured, 2004
Total = 45.5 million uninsured
40%
20%
40%
Adults 35-64 Children < 19
Adults 19-34
Age Income
35%37%
28%
100-199% of FPL
200% FPL and ><100 FPL
Source: Kaiser Commission on Medicaid and the Uninsured and Urban Institute analysis using CPS data
Work Status
68%
13%
19%
1 or more FT workers
No workers
PT workers
69 percent of all uninsured had one or more full-time workers in their family.
FPL = Federal Poverty Level
|| 228
The Safety Net – Uninsured – Nationally
Characteristics:
In 2004, over 8 of 10 uninsured came from working families –nearly 70 percent with one or more full-time workersBecause of the high cost of health insurance, the poor and near poor have the greatest risk of not being insuredWere it not for the Medicaid program more of the poor would be uninsured
Source: Kaiser Commission on Medicaid and the Uninsured
|| 229
Characteristics:
Adults are more likely to be uninsured than childrenMinorities are more likely to be uninsured than white AmericansThe majority of the uninsured (79%) are American citizens
Source: Kaiser Commission on Medicaid and the Uninsured
The Safety Net – Uninsured – Nationally
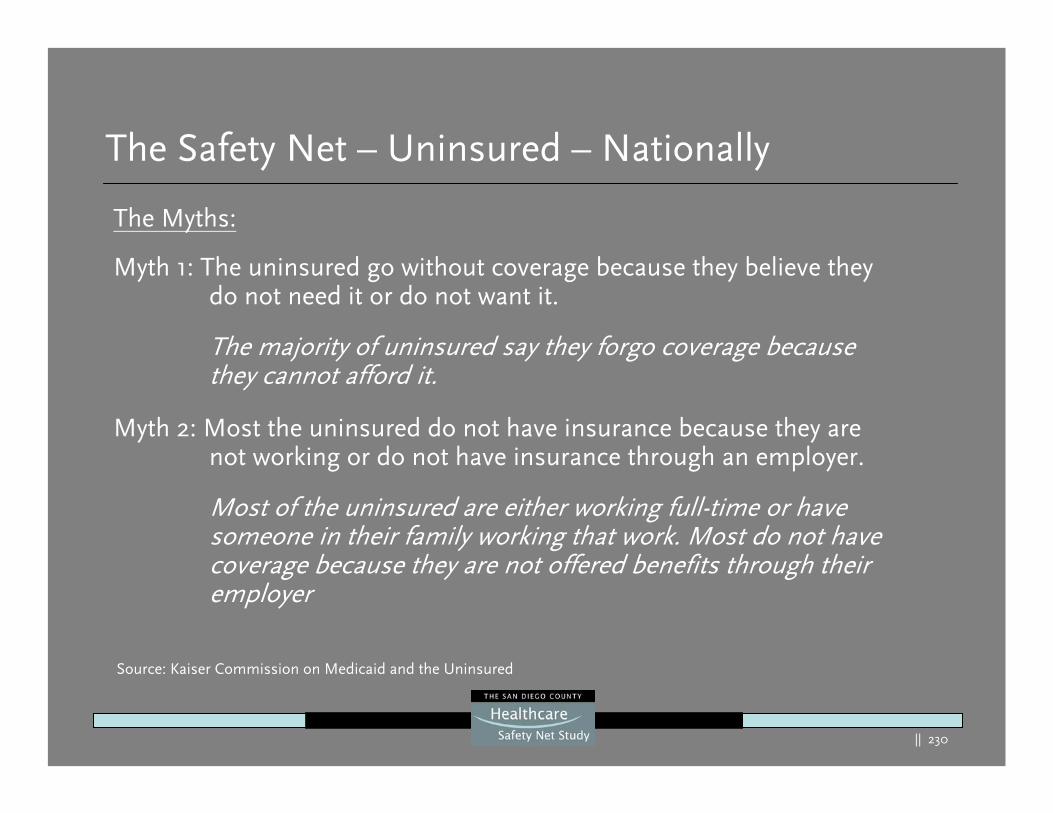
|| 230
The Myths:
Myth 1: The uninsured go without coverage because they believe they do not need it or do not want it.
The majority of uninsured say they forgo coverage because they cannot afford it.
Myth 2: Most the uninsured do not have insurance because they are not working or do not have insurance through an employer.
Most of the uninsured are either working full-time or have someone in their family working that work. Most do not have coverage because they are not offered benefits through their employer
Source: Kaiser Commission on Medicaid and the Uninsured
The Safety Net – Uninsured – Nationally
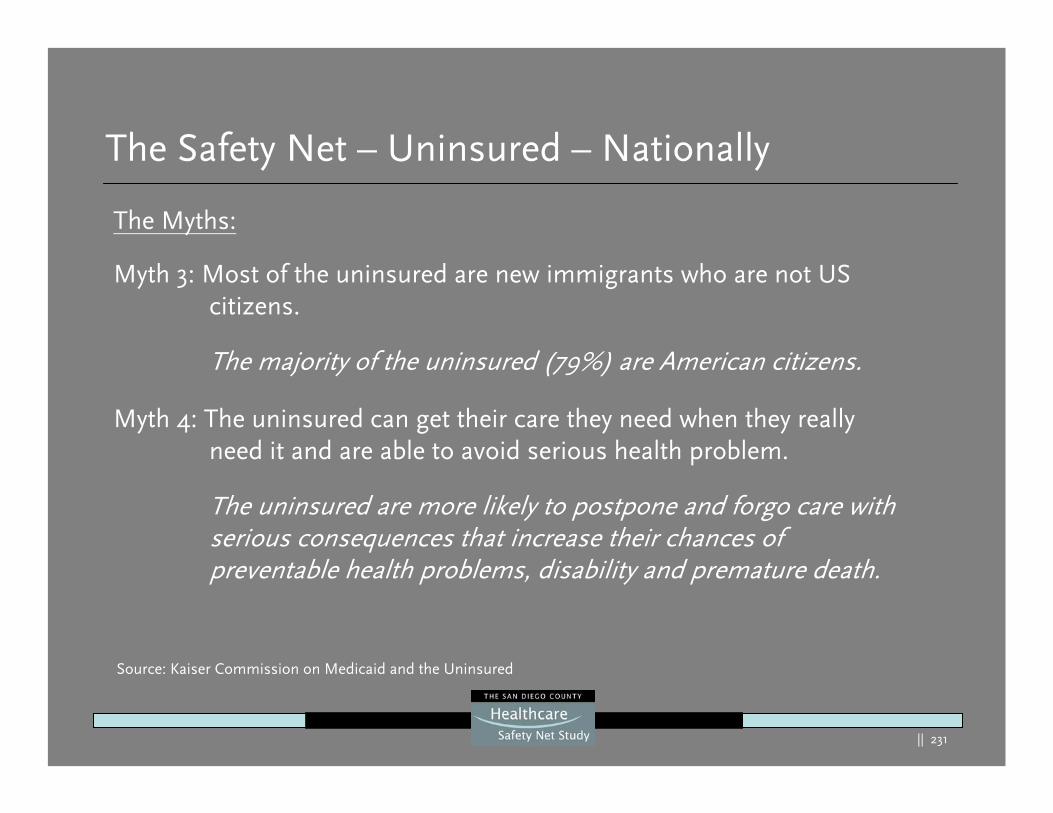
|| 231
The Myths:
Myth 3: Most of the uninsured are new immigrants who are not US citizens.
The majority of the uninsured (79%) are American citizens.
Myth 4: The uninsured can get their care they need when they really need it and are able to avoid serious health problem.
The uninsured are more likely to postpone and forgo care with serious consequences that increase their chances of preventable health problems, disability and premature death.
Source: Kaiser Commission on Medicaid and the Uninsured
The Safety Net – Uninsured – Nationally
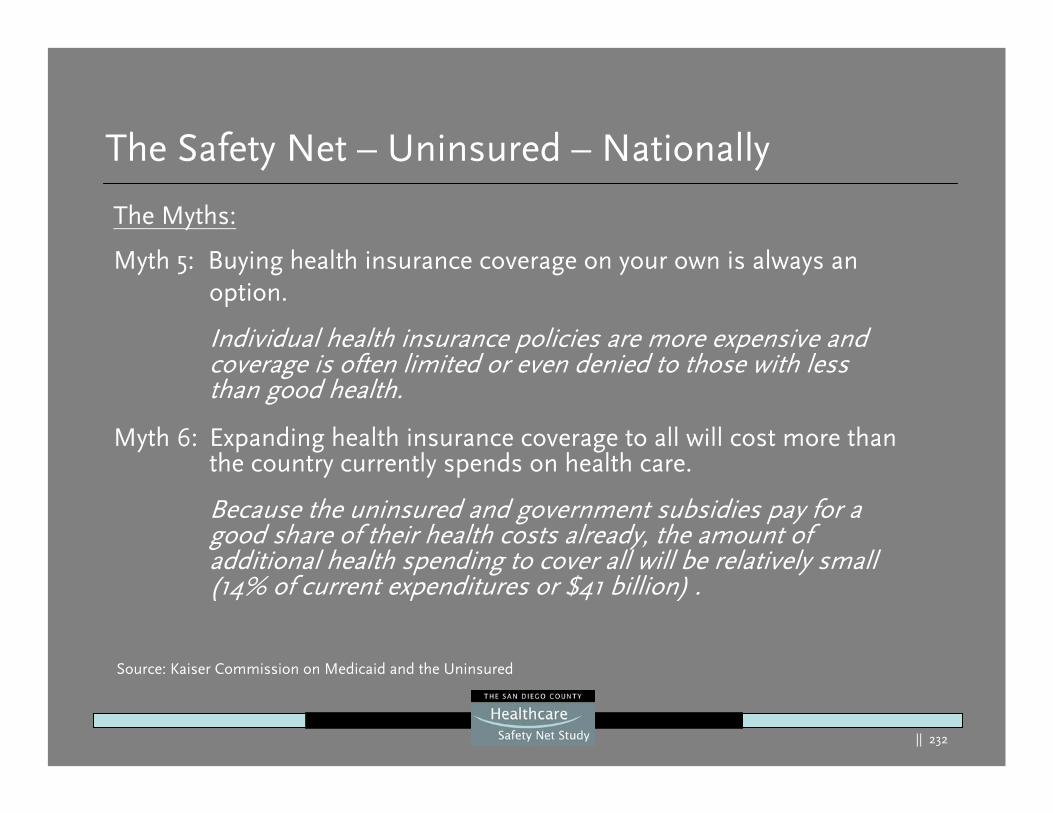
|| 232
The Myths:
Myth 5: Buying health insurance coverage on your own is always anoption.
Individual health insurance policies are more expensive and coverage is often limited or even denied to those with less than good health.
Myth 6: Expanding health insurance coverage to all will cost more than the country currently spends on health care.
Because the uninsured and government subsidies pay for a good share of their health costs already, the amount of additional health spending to cover all will be relatively small(14% of current expenditures or $41 billion) .
Source: Kaiser Commission on Medicaid and the Uninsured
The Safety Net – Uninsured – Nationally
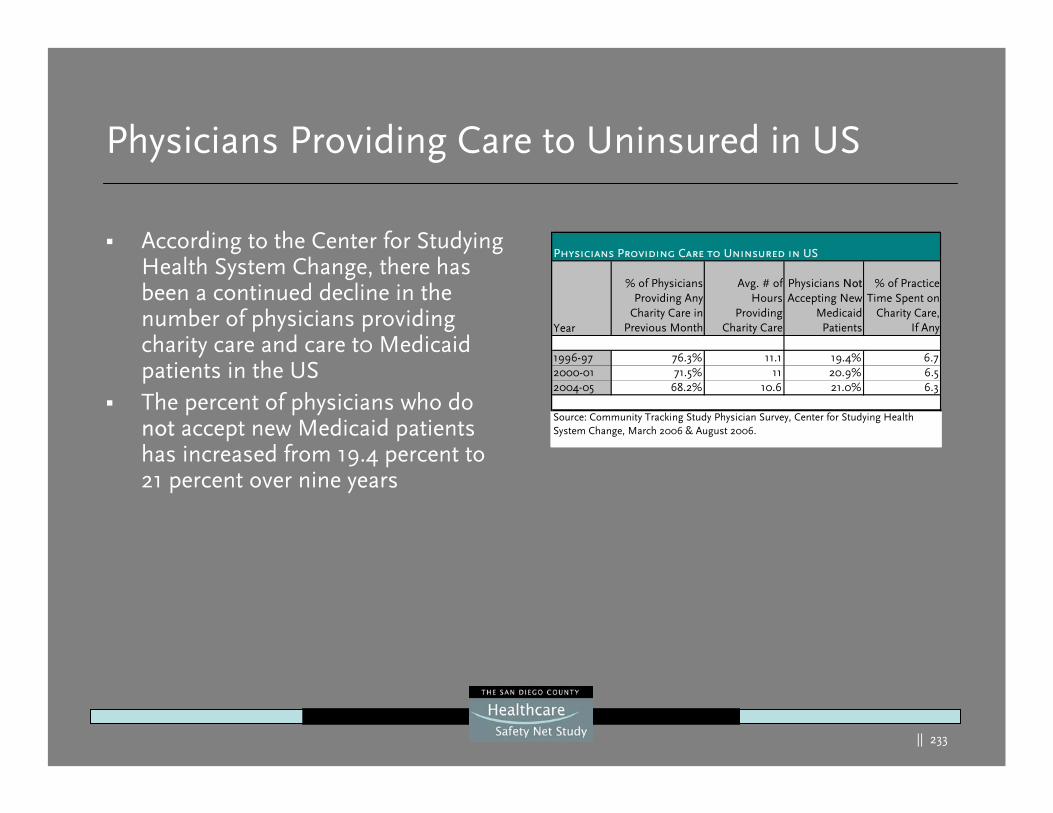
|| 233
Physicians Providing Care to Uninsured in US
According to the Center for Studying Health System Change, there has been a continued decline in the number of physicians providing charity care and care t0 Medicaid patients in the USThe percent of physicians who do not accept new Medicaid patients has increased from 19.4 percent to 21 percent over nine years
Year
% of PhysiciansProviding Any
Charity Care inPrevious Month
Avg. # ofHours
ProvidingCharity Care
Physicians NotAccepting New
MedicaidPatients
% of PracticeTime Spent on
Charity Care,If Any
1996-97 76.3% 11.1 19.4% 6.72000-01 71.5% 11 20.9% 6.52004-05 68.2% 10.6 21.0% 6.3
Source: Community Tracking Study Physician Survey, Center for Studying Health System Change, March 2006 & August 2006.
Physicians Providing Care to Uninsured in US
|| 234
Immigrant Healthcare Use
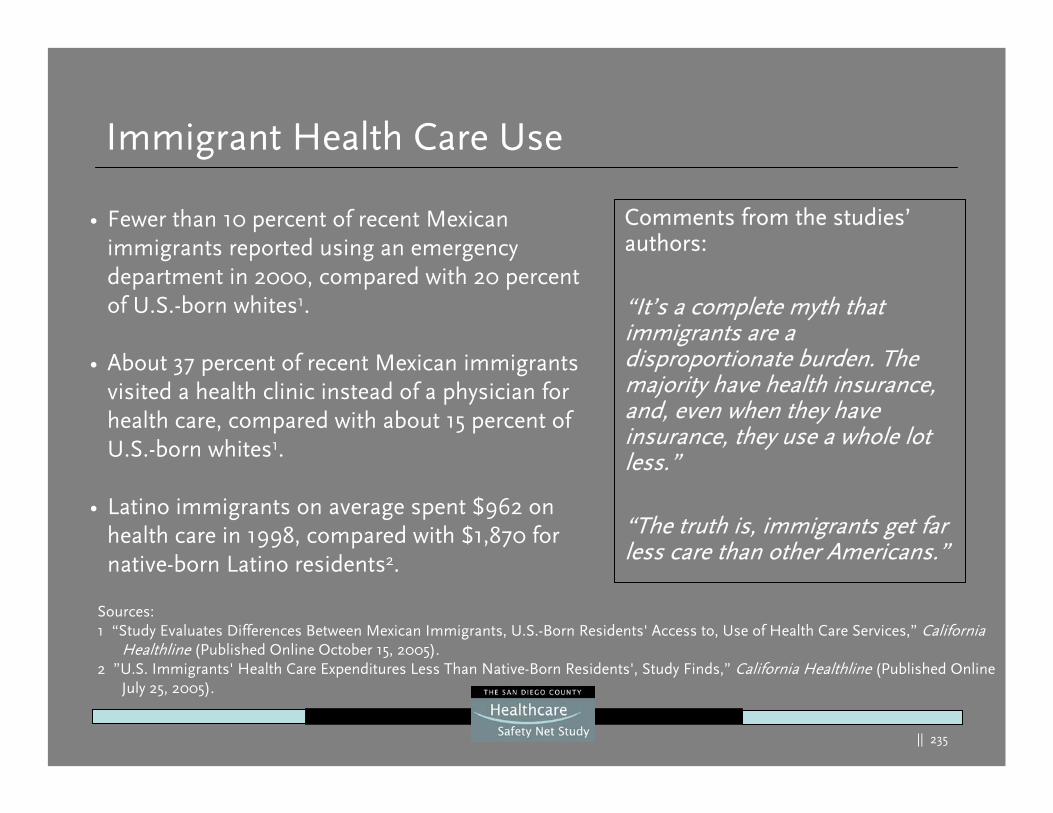
|| 235
Immigrant Health Care Use
Comments from the studies’authors:
“It’s a complete myth that immigrants are a disproportionate burden. The majority have health insurance, and, even when they have insurance, they use a whole lot less.”
“The truth is, immigrants get far less care than other Americans.”
• Fewer than 10 percent of recent Mexican immigrants reported using an emergency department in 2000, compared with 20 percent of U.S.-born whites1.
• About 37 percent of recent Mexican immigrants visited a health clinic instead of a physician for health care, compared with about 15 percent of U.S.-born whites1.
• Latino immigrants on average spent $962 on health care in 1998, compared with $1,870 for native-born Latino residents2.
Sources: 1 “Study Evaluates Differences Between Mexican Immigrants, U.S.-Born Residents' Access to, Use of Health Care Services,” California
Healthline (Published Online October 15, 2005).2 ”U.S. Immigrants' Health Care Expenditures Less Than Native-Born Residents', Study Finds,” California Healthline (Published Online
July 25, 2005).
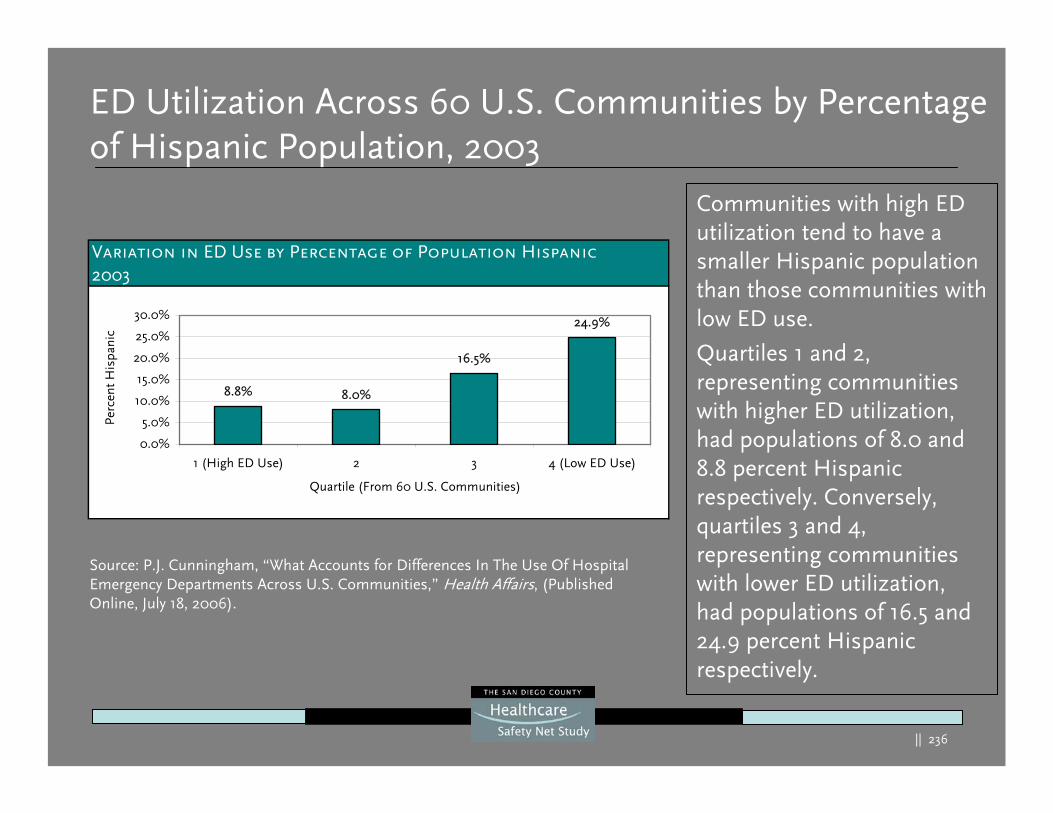
|| 236
ED Utilization Across 60 U.S. Communities by Percentage of Hispanic Population, 2003
Communities with high ED utilization tend to have a smaller Hispanic population than those communities with low ED use.
Quartiles 1 and 2, representing communities with higher ED utilization, had populations of 8.0 and 8.8 percent Hispanic respectively. Conversely, quartiles 3 and 4, representing communities with lower ED utilization, had populations of 16.5 and 24.9 percent Hispanic respectively.
Source: P.J. Cunningham, “What Accounts for Differences In The Use Of Hospital Emergency Departments Across U.S. Communities,” Health Affairs, (Published Online, July 18, 2006).
Variation in ED Use by Percentage of Population Hispanic 2003
8.8% 8.0%
16.5%
24.9%
0.0%
5.0%
10.0%
15.0%
20.0%
25.0%
30.0%
1 (High ED Use) 2 3 4 (Low ED Use)
Quartile (From 60 U.S. Communities)
Perc
ent H
ispa
nic
|| 237
Future Trends for Healthcare
|| 238
Healthcare Trends
Generally:
The population is aging and this will have an impact on utilization Hospitalized patients will have higher acuity Automation will play a more extensive role in healthcare Wireless capability will be “everywhere”Workforce shortages will drive:
– Creative uses of human resources, – More extensive use healthcare worker surrogates (e.g. licensed vs
unlicensed, physician extenders)– More leverage of technology
More extensive use of production methodology: productivity tools, efforts to automate and eliminate waste (Toyota LEAN)
|| 239
Hospital Trends
Hospitals:
Suburban growth through the development of medical villages with high-end housing and retailHealthcare has been shifting from inpatient to outpatient care for two decades and many think this will accelerateThe large for-profit firms have announced a significant shifting of their capital expenditures to outpatient services1
Those hospital beds that are being built are more likely to be universal that is acuity adjustable with each bed able to handleall acuity needs
1 “Tenet spotlights outpatient care”, Modern Healthcare, May 8, 2006
|| 240
Hospital Trends
Hospitals:
The conventional wisdom that aging baby boomers will justify sharp increases in hospital beds may not be true. A recent study shows that population aging will play a relatively small role in rising demand for inpatient care over the next decade1
The study estimates that between 2005-2015, population aging will increase use of inpatient services by only .74 percent per year or 7.6 percent for the decade compared to an overall increase of 64.9 percent for that same period
1 The effect of population aging on future hospital demand. Health Affairs, March 2006
|| 241
Hospital Trends
Hospitals:
Partially this slow inpatient growth is true as the average agewill only grow to 37.9 years from 36.5 but also due to:
– Changes in inpatient care clinical conditions with more cardiovascular and orthopedic inpatient care
– Less inpatient maternal and mental health utilizationAlthough the aging-population affect will accelerate as the population ages further, it will plateau at .86 percent per yearuntil 2022Local population trends and technology will play more important roles than aging
|| 242
General Insurance Trends
Health Savings Accounts (HSAs):
The passage of the Medicare Prescription Drug, Improvement and Modernization Act 2003 encouraged implementation of consumer-directed health care and HSA.However, one study suggests that HSAs will create more uninsured: 3.8 million will gain coverage but another 4.4 million would become uninsured through employers dropping coverage1.Healthcare providers are beginning to prepare for a health consumer with much higher co-pays and deductibles than their traditional health plans thus producing a larger number of “self-pay” clients and higher write offs. As the rise to shift costs to the consumer increases, it raises the question: “Are these people really insured?”
1 Gruber, J, Center on Budget and Policy Priorities April 2006
|| 243
State Insurance Trends
The Case for Coverage:
The Massachusetts new near-universal health plan followed months of debateOther states have taken action:
– Maryland was the first to have an employer mandated health coverage law (which was recently successfully challenged in court)
– West Virginia has a commission with a charge to develop a universal health plan by 2010
– New York has a new law that helps limit medical debt as more costs shift to the consumer
25 states are considering expanding coverage through employee mandates7 states (including CA) are considering bills with different forms of universal coverage. California’s version was recently vetoed by the governorA recent study indicated that CA will have higher hurdles to climb to achieve a Massachusetts-style health plan due to the higher proportion of the population being uninsured an low income1.
1 Massachusetts style coverage expansion: What would it cost California? The California HealthCare Foundation, April 2006
|| 244
State Medicaid/SCHIP Trends
Healthcare Funding:
In November, 2006 California voters are being asked to consider an additional tobacco tax Some of this new funding would be used to expand the Healthy Families Program
Additional funding would be pushed to county health insurance programs for low-income children
|| 245
Medicare/Medicaid Insurance Trends
President Bush FY07 Budget Proposal:
$50 billion in Medicare and Medicaid cuts in the next five yearsReductions in Medicare spending of $37.5 billion by 2011Reductions in Medicaid spending of 15.5 billion through 2011The Deficit Reduction Act (February 2006) also calls for $26.1 billion in Medicaid reductions by 2016Nearly 40 percent of those reductions will come from increased cost charging and co-pays including for non-emergency services provided in EDsMedicare and Social Security trustees now predict the trust fund to be exhausted by 20141
12006 Annual Report of the Board of Trustees of the Federal Old-Age and Survivors Insurance and Disability Insurance Trust Funds
|| 246
California’s Safety Net
Efforts to Cover the Uninsured:
CA lawmakers have proposed legislation that are somewhat similar to the new universal coverage law in Massachusetts
Efforts to insure children continue to have the most momentum with 800 thousand to 1 million children still uninsured in the state
A proposed $2.60 tax per cigarette pack is on the November ballot to improve funding for children’s insurance, fund EDs and other programs
Most efforts do not provide a solution for health coverage to the undocumented immigrant (estimated with 45 percent of the documented and undocumented immigrants in CA are without insurance)
|| 247
Trends for the Poor
Growing Healthcare Disparities for the Poor:
“The inability or unwillingness to ensure equal access to high-quality health care is fueling a widening rift between the rich and poor.1”
1 “A widening rift in access and quality: growing evidence of economic disparities”, Health Affairs, December 2005
Study key findings:
1. Many recent healthcare investments and initiatives are focused in affluent communities
2. Access to basic care for the under or uninsured is worsening in the wake of stalled coverage expansions and service cuts.
|| 248
Trends for the Poor
Study key findings:
3. The lines of lower-income patients have historically been skewed to certain providers with the lines of segregation hardening due todictates of geography and growing disparities in access to physician care
4. Hospitals and physicians are growing their investments in specialized and outpatient services with a burst towards freestanding facilities, and moving diagnostic and surgical procedures to outpatient settings.
5. Hospital expansions in affluent areas have the potential to worsen the disparities on the investment of resources between the rich and poor1.
1 A widening rift in access and quality: growing evidence of economic disparities, Health Affairs, December 2005
|| 249
Trends for the Poor
Study key findings:
6. State and local budget shortfalls resulting in Medicaid freezes and reductions have worsened the problems and access to key serviceslike mental and dental care
7. The move towards more reliance on copays, eliminating benefits and setting arbitrary limits on services are seen by some observers as “cost shirking”.
8. This leads healthcare providers in the position of either dropping these patients or absorbing the cost of their uncompensated care
|| 250
Employee Trends
More CA Workers are Declining Health Coverage:
In 2003, 82 percent accepted coverage compared to 87 percent in 1998Largely because they are being required to contribute more towards their employer sponsored planThe average premium increased by 42 percent from $2,316 in 1998 to $3,293 in 200366 percent of insured Californians were employed at companies that offered health coverage in 2003
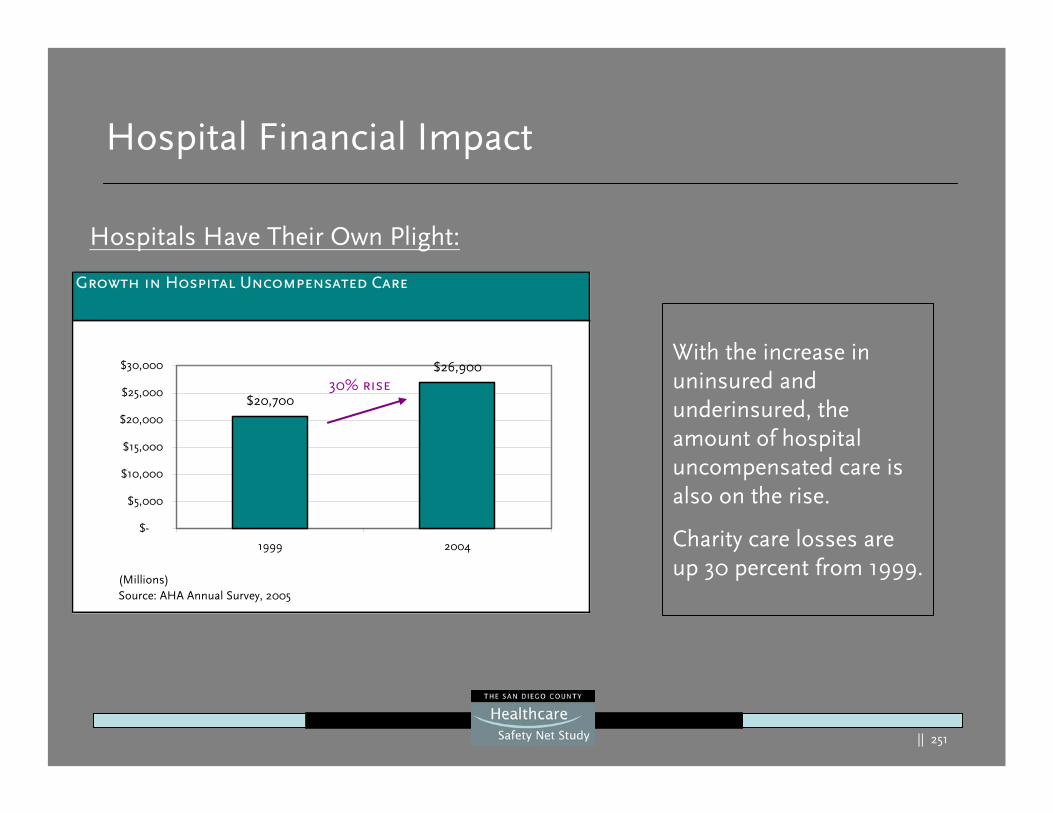
|| 251
Hospital Financial Impact
Hospitals Have Their Own Plight:
With the increase in uninsured and underinsured, the amount of hospital uncompensated care is also on the rise.
Charity care losses are up 30 percent from 1999.
Growth in Hospital Uncompensated Care
$20,700
$26,900
$-
$5,000
$10,000
$15,000
$20,000
$25,000
$30,000
1999 2004
(Millions)Source: AHA Annual Survey, 2005
30% rise
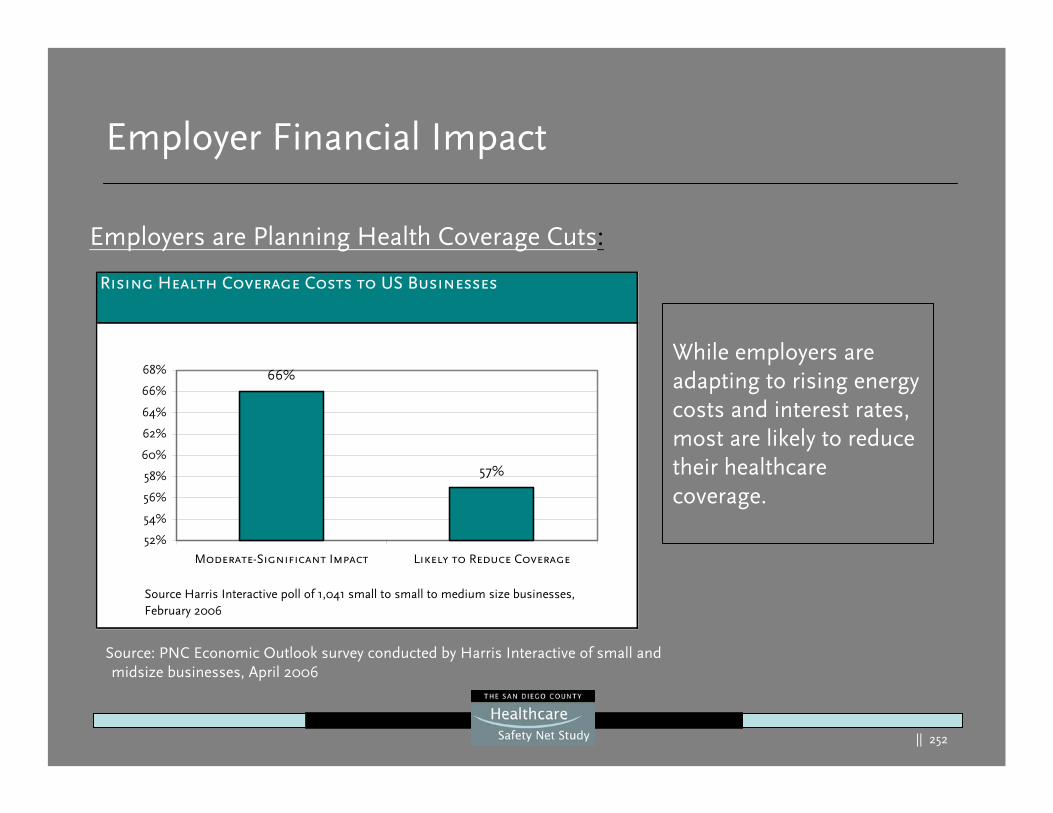
|| 252
Employer Financial Impact
Employers are Planning Health Coverage Cuts:
While employers are adapting to rising energy costs and interest rates, most are likely to reduce their healthcare coverage.
Source: PNC Economic Outlook survey conducted by Harris Interactive of small and midsize businesses, April 2006
Rising Health Coverage Costs to US Businesses
66%
57%
52%
54%
56%
58%
60%
62%
64%
66%
68%
Moderate-Significant Impact Likely to Reduce Coverage
Source Harris Interactive poll of 1,041 small to small to medium size businesses, February 2006
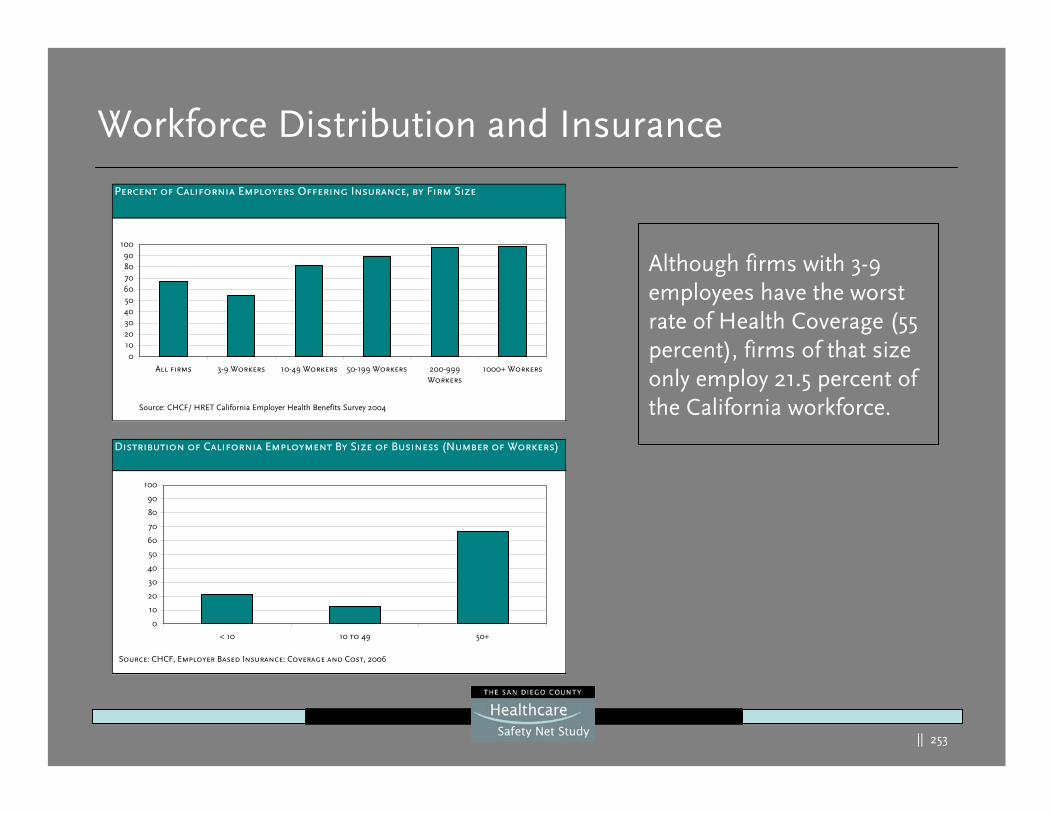
|| 253
Workforce Distribution and Insurance
Although firms with 3-9 employees have the worst rate of Health Coverage (55 percent), firms of that size only employ 21.5 percent of the California workforce.
Percent of California Employers Offering Insurance, by Firm Size
0102030405060708090
100
All firms 3-9 Workers 10-49 Workers 50-199 Workers 200-999Workers
1000+ Workers
Source: CHCF/ HRET California Employer Health Benefits Survey 2004
Distribution of California Employment By Size of Business (Number of Workers)
0
10
20
30
40
50
60
70
80
90
100
< 10 10 to 49 50+
Source: CHCF, Employer Based Insurance: Coverage and Cost, 2006

254
700 Ygnacio Valley Road, Suite 270Walnut Creek, CA. 94596
Tel: (888) 367-0911Fax: (925) 946-0911
abarisgroup.com


