Study of Access and Quality of Care in For-Profit PACE Final Report October 11, 2013 David Jones Nancy Duda Bob Schmitz Sandi Nelson Chelsea Swete Alex Bryce Jared Coopersmith Karen CyBulski
Transcript
Study of Access and Quality of Care in For-Profit PACE
Final Report
October 11, 2013
David Jones Nancy Duda Bob Schmitz Sandi Nelson Chelsea Swete Alex Bryce Jared Coopersmith Karen CyBulski
Submitted to: Centers for Medicare & Medicaid Services 7500 Security Boulevard Baltimore, MD 21244 Project Officer: LT Julia A. Zucco
Submitted by: Mathematica Policy Research 955 Massachusetts Avenue Suite 801 Cambridge, MA 02139 Telephone: (617) 491-7900 Facsimile: (617) 491-8044 Project Director: David Jones
Study of Access and Quality of Care in For-Profit PACE
Final Report
October 11, 2013
David Jones Nancy Duda Bob Schmitz Sandi Nelson Chelsea Swete Alex Bryce Jared Coopersmith Karen CyBulski
iii
CONTENTS
EXECUTIVE SUMMARY ................................................................................................ IX
I INTRODUCTION .............................................................................................. 1
Study Design Overview .................................................................................... 1
II BACKGROUND ............................................................................................... 5
PACE in Pennsylvania ..................................................................................... 6
III METHODS ..................................................................................................... 11
Study Design .................................................................................................. 11
Plan Selection .......................................................................................... 12 Sample Selection ..................................................................................... 14
Analysis of Results ......................................................................................... 16
IV DATA .............................................................................................................. 23
Survey of PACE Enrollees ............................................................................. 23
Survey Design ......................................................................................... 23 Sample Targets ....................................................................................... 25 Survey Administration .............................................................................. 25 Construction of Key Survey Variables ..................................................... 26
CMS Administrative Data Sources ................................................................. 27
Length of Time Enrolled in PACE Plans .................................................. 27 Comparison of Enrollees Prior to PACE Enrollment ................................ 27 Comparison of Health Characteristics and Coverage After
Comparison Prior to Enrollment ............................................................... 29 Comparison of Demographic and Health Characteristics After
Health Characteristics and Coverage ...................................................... 35 Access to and Quality of Care ................................................................. 37
Care Management ................................................................................... 41 Health Utilization ...................................................................................... 42 Satisfaction with Care .............................................................................. 43 Explanatory Variables .............................................................................. 45
VI DISCUSSION ................................................................................................. 47
Discussion of Findings ................................................................................... 48
Lessons Learned: Enrollees Prior to PACE Enrollment and PACE Plan Locations ........................................................................ 49
Lessons Learned: Enrollee Populations................................................... 49 Lessons Learned: Enrollee Health ........................................................... 50 Lessons Learned: Access to and Quality of Care .................................... 50
Extending Lessons Beyond Pennsylvania PACE ........................................... 51
APPENDIX A: DETAILED PLAN AND SAMPLE SELECTION PROCESS
APPENDIX B: ADDITIONAL COMPARISONS OF FOR-PROFIT AND NOT-FOR-PROFIT PACE PLAN SERVICE AREAS
APPENDIX C: WEIGHTS AND VARIANCE ESTIMATION
APPENDIX D: ADDITIONAL DETAILS ON ADMINISTRATION OF THE SURVEY OF PACE ENROLLEES
APPENDIX E: CONSTRUCTION OF KEY VARIABLES
APPENDIX F: RESULTS FOR FULL LIST OF CHRONIC CONDITIONS
v
TABLES
ES.1 Summary of Key Findings ........................................................................................... x
II.1 Names and Locations of For-Profit PACE Plans in Pennsylvania................................ 6
II.2 Names and Locations of Not-For-Profit PACE Plans in Pennsylvania ......................... 7
II.3 Start Dates for PACE Plans Operating in Pennsylvania .............................................. 9
II.4 Number of Enrollees in PACE Plans in Pennsylvania, October 2012 ........................ 10
III.1 Summary of Not-for-Profit PACE Plan Selection, Plan Selection Crieria ................... 13
III.2 Final Sample and Survey Respondents by Length of Time Enrolled in For-Profit and Not-for-Profit PACE Plans ......................................................................... 16
III.3 List of Explanatory Variables Included in the Multivariate Analysis ............................ 21
IV.2 Survey Completion by Type of PACE Plan ............................................................... 26
IV.3 Survey Completion by PACE Plan ............................................................................ 26
V.1 Comparison of Enrollee Health Characteristics and Coverage Prior to Enrollment by For-Profit Status ................................................................................. 29
V.2 Comparison of Enrollee Characteristics After Enrollment by For-Profit Status (percentage) .................................................................................................. 32
V.3 Comparison of Enrollee Health After Enrollment by For-Profit Status (percentage) ............................................................................................................. 34
V.4 Comparison of Enrollee Health Characteristics and Coverage After Enrollment by For-Profit Status ................................................................................. 36
V.5 Descriptive Analysis of Access to and Quality of Care by For-Profit Status (percentage) ............................................................................................................. 38
V.6 Descriptive Analysis of Quality of Care Satisfaction Measures by For-Profit Status (percentage) .................................................................................................. 39
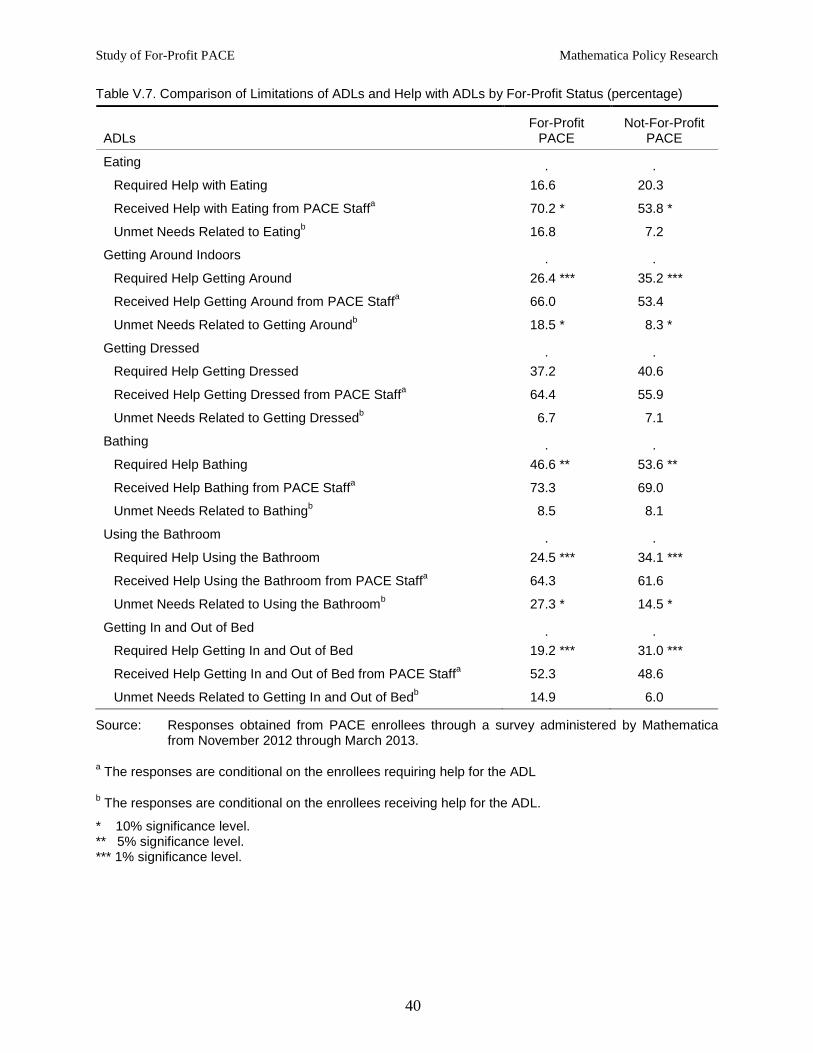
V.7 Comparison of Limitations of ADLs and Help with ADLs by For-Profit Status (percentage) .................................................................................................. 40
V.8 Marginal Associations Between For-Profit Status and Care Management and Health Utilization ................................................................................................ 43
V.9 Marginal Associations Between For-Profit Status and Satisfaction Measures ........... 44
VI.1 Summary of Key Findings ......................................................................................... 47
Tables Mathematica Policy Research
vi
A.1 Length of Time in Operation in Months for PACE Plans in Pennsylvania ................ A-4
A.2 Urban/Rural Status of For-Profit and Not-for-Profit PACE Plans ............................. A-6
A.3 Population Characteristics of For-Profit and Not-for-Profit PACE Plan Service Areas ......................................................................................................... A-8
A.4 Number of Enrollees by Length of Time Enrolled in For-Profit PACE Plans ............ A-9
A.5 Sample Members and Respondents by Length of Time Enrolled in For-Profit PACE Plans ................................................................................................. A-10
A.6 Number of Enrollees by Length of Time Enrolled in For-Profit and Not-for-Profit PACE Plans ................................................................................................. A-11
B.1 Dual Eligibility and Managed Care Penetration in For-Profit and Not-for-Profit PACE Plan Service Areas (percentage) ......................................................... B-3
C.1 Finite Population Correction (FPC) Values by Strata ............................................... C-4
E.1 Definition of Measures of Access and Quality from the Survey of PACE Enrollees ................................................................................................................. E-3
E.2 List of Chronic Conditions Included in the Study ..................................................... E-6
F.1 Comparison of Chronic Conditions at the Time of Enrollment by For-Profit Status (percentage) ................................................................................................ F-3
vii
FIGURES
II.1 Locations of the For-Profit and Not-For-Profit PACE Plan Sites in Pennsylvania .............................................................................................................. 8
B.1 Location of Final PACE Plans Included in the Study and Population Density.................................................................................................................... B-4
D.1 Advance Letter ........................................................................................................ D-5
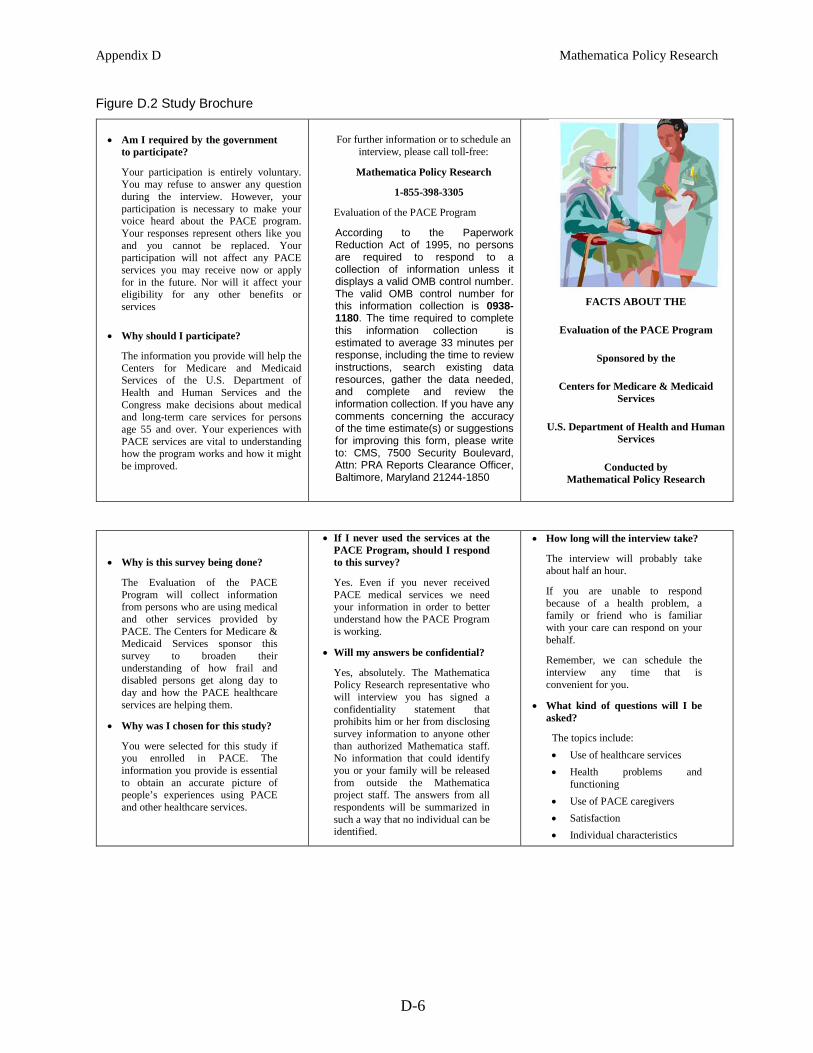
D.2 Study Brochure ....................................................................................................... D-6
D.3 Sample Letter Accompanying Flyer ........................................................................ D-7
D.4 Sample Survey Reminder Letter ............................................................................ D-8
E.1 PACE Plan Service Area Boundaries and Census Tract Boundaries ...................... E-7
This page has been left blank for double-sided copying.
Executive Summary Mathematica Policy Research
ix
EXECUTIVE SUMMARY
The Program of All-Inclusive Care for the Elderly (PACE) aims to provide integrated care and services to the frail elderly at risk of institutionalization to enable them to remain in the community. PACE plans not only offer comprehensive coverage to enrollees but also provide direct services such as care coordination, adult day health services at PACE centers, and home visiting and other supports in the home and community. Thus, PACE plans play a key role in the direct coordination and delivery of health care and related services for their enrollees. The objective of this study is to examine particular aspects of care delivered to enrollees in for-profit PACE plans—more specifically, access to and quality of the types of health care and services provided by PACE plans to their enrollees.
Under the Balanced Budget Act of 1997 (BBA), existing not-for-profit PACE plans were established as permanent providers under the Medicare and Medicaid programs. The BBA also mandated a demonstration of for-profit PACE plans, with a specific mandate to study the results of the for-profit demonstration. In 2008, an evaluation report of the not-for-profit PACE plans was issued (Beauchamp et al. 2008). This evaluation did not include the for-profit plans because at that time there were no for-profit plans in the PACE program. However, since the conclusion of the evaluation, four for-profit PACE plans have enrolled in the demonstration in Pennsylvania, paving the way to study its results.
Potential differences in access to and quality of care in the new for-profit plans are an important policy issue for shaping the future of the PACE program. PACE represents a potentially growing component of the health care delivery system. However, it is unclear whether the quality of care provided by for-profit PACE plans will resemble that of not-for-profit plans. The study provides evidence about access to and quality of care delivered by for-profit PACE plans and compares it to the permanent not-for-profit PACE plans to help policymakers decide the future of for-profit PACE.
Study Design
To study whether care received by PACE enrollees in for-profit plans is different from the care received by enrollees in not-for-profit plans, we assessed the degree to which for-profit plans are providing access to quality services that are expected for a high level of overall care (such as coordination of care, routine screens, and transportation services) and compared the level of care to that delivered by not-for-profit PACE plans in Pennsylvania. A key analytic challenge of this approach is accounting for the potential differences between the patient populations at the for-profit and not-for-profit PACE plans included in the study. To address this challenge, we selected plans located in areas with similar demographic characteristics; accounting for possible differences in the broader local populations. Next, we matched not-for-profit enrollees to for-profit enrollees; ensuring that the for-profit sample is similar to the comparison group along any key factors. Finally, we controlled for enrollee demographic characteristics, health, and social supports in a multivariate analysis to control for observable differences among the enrollees.
Executive Summary Mathematica Policy Research
x
Data
The analyses are supported by information on enrollees obtained from two sources: a survey of PACE enrollees and CMS administrative data sources. Mathematica conducted a telephone survey of the sample of for-profit and not-for-profit enrollees to obtain the information used to define the outcomes of interest, measures of access to and quality of care, as well as measures of enrollee health and functional status, quality of life, and demographic characteristics. The information in the survey is supplemented by enrollee health and coverage characteristics obtained from several CMS data sources, including the MARx database, the Medicare Enrollment Database (EDB), and the Medicare Beneficiary Summary Files (MBSF). We also obtained the health and coverage characteristics for all PACE enrollees prior to enrollment in their PACE plans to determine whether PACE plans, on average, enrolled beneficiaries with different characteristics.
Key Findings
Based on the comparisons examined in this study of self-reported measures of care received by PACE enrollees, there is evidence that the access to and quality of care received by for-profit enrollees in PACE plans in Pennsylvania is lower along several dimensions compared to the care received by their not-for-profit counterparts. In spite of this evidence, satisfaction with care was quite high as reported by for-profit enrollees and similar to satisfaction among not-for-profit enrollees. Thus, in effect, although the findings point to differences between for-profit and not-for-profit PACE plans, the differences might not indicate a consistent and meaningful difference in overall access to and quality of care. We summarize the key findings below in Table ES.1.
Table ES.1. Summary of Key Findings
Health and Coverage Prior to Enrollment
• For-profit enrollees were slightly less likely to be dually eligible for Medicaid and Medicare and much more likely to have been enrolled in a managed care plan prior to enrolling in PACE.
• For-profit enrollees had similar rates of chronic conditions prior to enrollment.
For-Profit PACE Plan Locations
• For-profit plans are located outside of urban centers in Pennsylvania and have less variation in the characteristics of the elderly populations comprising their service areas when compared to not-for-profit plans, which are located outside of urban centers and in urban centers.
• For-profit plans are located in areas with much higher Medicare managed care penetration rates.
Health and Demographic Characteristics of Current Enrolleesa
• For-profit enrollees were more likely to be nonwhite, less likely to have at least graduated from high school, and less likely to live with family, friends, or be checked on regularly by family or friends.
• Although for-profit enrollees were equally likely to report fair or poor health as not-for-profit enrollees, they were more likely to report most of the specific health conditions and limitations in ADLs. They also were less likely to have a proxy respond to the survey.
• For-profit enrollees were more likely to report mental health issues and more likely to have behavioral issues as reported by survey proxies.
• In contrast to the period prior to enrollment, for-profit enrollees were more likely to be dually eligible, although over 90 percent of all enrollees were dually eligible.
Executive Summary Mathematica Policy Research
Table ES.1 (continued)
xi
Care Management a
• There were few differences in care management by for-profit status. For-profit enrollees were more likely to report a fall, being injured in a fall in the past 6 months, and that it takes a great deal of energy to get services.
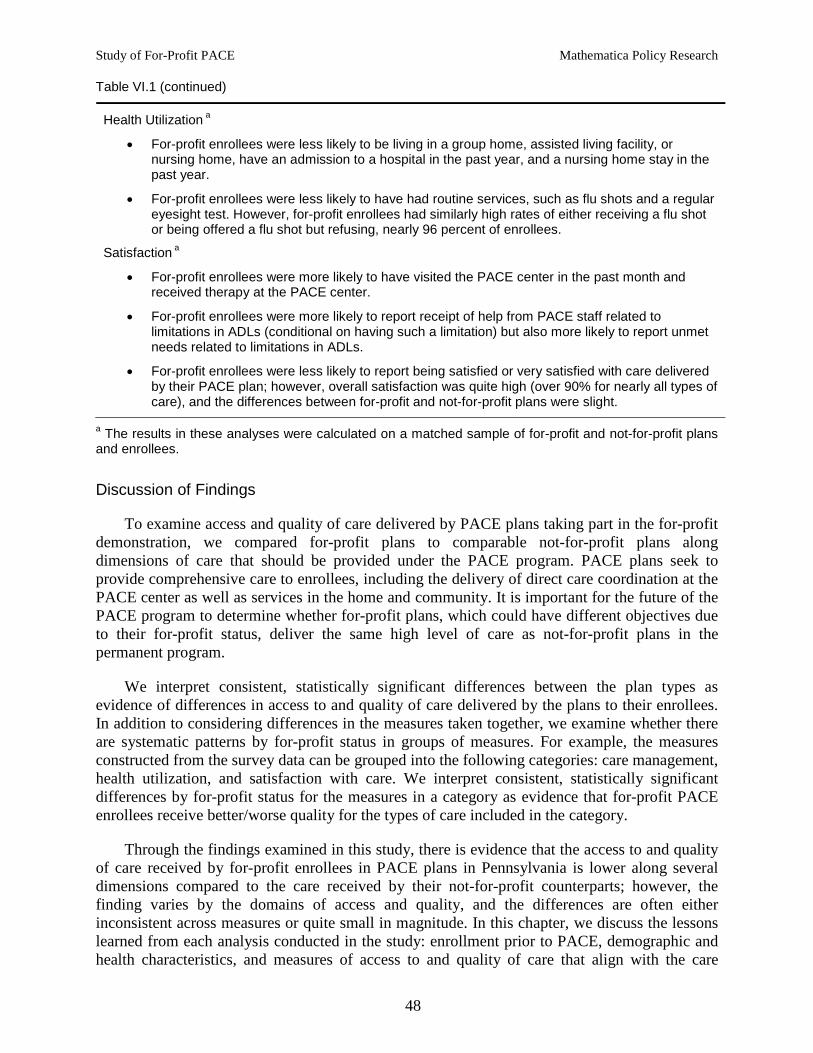
Health Utilization a
• For-profit enrollees were less likely to be living in a group home, assisted living facility, or nursing home, have an admission to a hospital in the past year, and a nursing home stay in the past year.
• For-profit enrollees were less likely to have had routine services, such as flu shots and a regular eyesight test. However, for-profit enrollees had similarly high rates of either receiving a flu shot or being offered a flu shot but refusing, nearly 96 percent of enrollees.
Satisfaction a
• For-profit enrollees were more likely to have visited the PACE center in the past month and received therapy at the PACE center.
• For-profit enrollees were more likely to report receipt of help from PACE staff related to limitations in ADLs (conditional on having such a limitation) but also more likely to report unmet needs related to limitations in ADLs.
• For-profit enrollees were less likely to report being satisfied or very satisfied with care delivered by their PACE plan; however, overall satisfaction was quite high (over 90% for nearly all types of care), and the differences between for-profit and not-for-profit plans were slight.
a The results in these analyses were calculated on a matched sample of for-profit and not-for-profit plans and enrollees.
Extending Lessons Beyond Pennsylvania PACE
The study examines access to and quality of care in the four PACE plans taking part in the for-profit demonstration; all located in Pennsylvania and under common ownership. When compared to the full set of not-for-profit plans, the for-profit plans tend to have somewhat smaller enrollee populations and less time in operation, and they are located outside of the major urban centers in the state. In addition, characteristics of the for-profit plans that are unique to their common ownership or idiosyncratic characteristics of the areas in which they are located could limit the degree to which these plans are representative of future for-profit PACE plans. Therefore, extensions made to potential future for-profit plans should be made considering these potential differences between the current for-profit PACE plans and future plans taking part in the demonstration.
Although conclusions drawn from this information should be couched in the appropriate caveats discussed above, the findings in this study provide valuable new information on differences in enrollees by for-profit status. Although the study is conducted in a specific context, it is a context that is similar to not-for-profit PACE plans in other states and can reasonably be assumed to resemble future for-profit plans. Therefore, the differences observed throughout the study can be used to help inform the future of for-profit PACE with the appropriate caveats regarding potential limitations.
This page has been left blank for double-sided copying.
Study of For-Profit PACE Mathematica Policy Research
1
I. INTRODUCTION
The Program of All-Inclusive Care for the Elderly (PACE) aims to provide integrated care and services to the frail elderly at risk of institutionalization to enable them to remain in the community. Under the Balanced Budget Act of 1997 (BBA), existing not-for-profit PACE plans were established as permanent providers under the Medicare and Medicaid programs. The BBA also mandated a demonstration of for-profit PACE plans, with a specific mandate to study the results of the for-profit demonstration. In 2008, an evaluation report of the not-for-profit PACE plans was issued (Beauchamp et al. 2008). This evaluation did not include the for-profit plans because at that time there were no for-profit plans in the PACE program. However, since the conclusion of the evaluation, for-profit PACE plans have enrolled in the demonstration, paving the way to study its results, including a study of the health care and services delivered to enrollees in the for-profit plans.
This study examines care provided to elderly enrollees in for-profit PACE plans taking part in the demonstration. PACE plans not only offer comprehensive coverage to enrollees but also provide direct services such as care coordination, adult day health services at PACE centers, and home visiting and other supports in the home and community. Thus, PACE plans play a key role in the direct coordination and delivery of health care and related services for their enrollees. The objective of this study is to examine particular aspects of care delivered to enrollees in for-profit PACE plans—more specifically, access to and quality of the types of health care and services provided by PACE plans to their enrollees.1
Potential differences in access to and quality of care in the new for-profit plans are an important policy issue for shaping the future of the PACE program. PACE represents a potentially growing component of the health care delivery system. However, it is unclear whether the quality of care provided by for-profit PACE plans will resemble that of not-for-profit plans. The study provides evidence about access to and quality of care delivered by for-profit PACE plans and compare it to the permanent not-for-profit PACE plans to help policymakers decide the future of for-profit PACE.
To meet this objective, we assessed the degree to which for-profit plans are providing access to quality services that are expected for a high level of overall care (such as coordination of care, routine screens, and transportation services) and compared the level of care to that delivered by not-for-profit PACE plans.
Study Design Overview
The study examines the differences in care by directly comparing measures of access and quality for enrollees in for-profit PACE plans versus enrollees in not-for-profit PACE plans. To make such a comparison and isolate the differences in access and quality from other factors absent a randomized controlled trial, we identified an appropriate comparison group for the for-profit PACE enrollees. Because the only PACE plans participating in the for-profit demonstration are in Pennsylvania, we compared the experiences of enrollees in these plans to not-for-profit enrollees also in Pennsylvania. At the time of this study, four for-profit PACE
1 In this study, we refer to the collective services provided by PACE plans as the care provided to and received by PACE enrollees.
Study of For-Profit PACE Mathematica Policy Research
2
plans were participating in the demonstration. This allows for a comparison of care for enrollees in the four for-profit PACE plans with care provided by other not-for-profit PACE plans located in Pennsylvania.
The general strategy for implementing the analytic approach is to (1) select for-profit and not-for-profit plans in Pennsylvania to compare and (2) draw samples of enrollees from these plans to include in the comparison. The key consideration in selecting the plans and sample enrollees was to select not-for-profit plans and enrollees that are similar to the for-profit plans and enrollees by factors that could be indirectly related to measures of quality of care but are not necessarily indicative of quality of care provided (for example, local sociodemographic and population characteristics or the length of time enrolled in PACE). To help achieve this goal, we first selected four not-for-profit comparison plans that have geographic and population characteristics similar to the four for-profit plans’ and enough enrollees to meet the target for the sample. Next, we drew the sample of for-profit enrollees and a matched sample of not-for-profit enrollees from the universe of enrollees at the selected plans to satisfy the target sample size. The primary comparisons in the study were made using these samples of for-profit and not-for-profit PACE enrollees.
We constructed measures of access and quality using information collected through a survey administered to the sample enrollees in for-profit and not-for-profit PACE plans and supplemented the information with secondary data provided by CMS. A telephone survey of the sampled enrollees included items on the enrollee’s health and social supports, access to and satisfaction with health care services, satisfaction with caregivers, and quality of life. We supplemented the information collected in the survey with information from CMS administrative data sources on dual eligibility, coverage prior to PACE enrollment, end stage renal disease (ESRD), chronic conditions, reason for Medicare eligibility, and length of time enrolled in PACE.
The analysis is broken into two sections: (1) a descriptive analysis of bivariate relationships between for-profit PACE status and demographic, health, and access and quality measures and (2) a multivariate analysis of the relationships between for-profit PACE status and access and quality measures. The multivariate analysis builds on the descriptive analysis by estimating the relationship between access and quality and for-profit status while controlling for differences in the enrollees discovered in the bivariate comparisons that could confound this relationship. Consistent, statistically significant, and meaningfully large differences in the measures of quality and access by for-profit status are interpreted as evidence that there are differences in quality of care provided by for-profit PACE plans.
The primary analytic challenge in determining whether there are differences between for-profit and not-for-profit PACE plans arises from potential differences in patient populations between plan types. The challenge is a concern to the extent that differences in patient populations could lead to differences in access to and quality of care. Given that patients of varying health and backgrounds should receive the same quality of care, this concern is not as pronounced as it would be if we were comparing health outcomes. However, the underlying health of enrollees could influence their response to questions regarding their quality of care, even if there is no direct connection to the actual quality of care delivered. Therefore, differences in the health of enrollees by plan type could obscure the relationship between plan type and quality. This concern is minimized by the plan and sample matching process and controlling for such factors in the multivariate analysis.
Study of For-Profit PACE Mathematica Policy Research
3
In addition to the analytic challenges, the limited variation in the geography and ownership of current for-profit plans limits the ability to draw conclusions about access and quality of for-profit plans nationwide. The only for-profit PACE plans are in Pennsylvania and are under common ownership. To the extent that the current for-profit plans have idiosyncrasies that influence quality of care and are not representative of for-profit plans in general (hypothetical plans in other states and under different ownership), this obstacle will limit the degree to which the results can be generalized.
The remainder of the report proceeds as follows. In Chapter II, Background, we summarize the history of the PACE program and underline the importance of this study. In Chapter III, Methods, we outline the analytic approach to address the primary research questions, including a discussion of plan and sample selection and the methods used to analyze the results. In Chapter IV, Data, we summarize the data sources used in the analytic approach (a survey of PACE enrollees and CMS administrative data sources), and in Chapter V, Results, we present the results of the descriptive and multivariate analyses. We synthesize the key findings in a discussion of how the results answer the study’s research questions in Chapter VI, Discussion.
This page has been left blank for double-sided copying.
Study of For-Profit PACE Mathematica Policy Research
5
II. BACKGROUND
During the 1980s and 1990s, innovative not-for-profit programs were developed to provide services to elderly persons limited by frailty and chronic illness. In particular, the programs aimed to enable elderly people with disabilities to remain in the community by providing care coordination combined with other community support services. The pioneering programs in this area, such as On Lok in California, were not-for-profit organizations developed to serve the elderly at the community level based on the conviction that elderly persons with disabilities could remain in the community for a longer time if an appropriate mix of services and care coordination was provided to them. In 1991, the PACE program was implemented to replicate the On Lok intervention on a national scale, providing a network of not-for-profit facilities.
The model of care for the PACE program nationally and in Pennsylvania is to provide comprehensive coverage for enrollees as well as to coordinate health care and related support services. In addition to covering PACE enrollees’ visits to primary care physicians, specialist visits, hospitalizations, medications, and other care typically provided by other types of plans, PACE plans also provide direct services to enrollees such as care coordination, adult day health services, social supports, meal and chore services, and transportation. All PACE plans are required to provide a comprehensive package of services and a site for adult day services, among other requirements. Furthermore, the coordination of care is overseen by an interdisciplinary team of professionals, including physicians, registered nurses, and geriatric social workers. The program seeks to provide this comprehensive network of care by focusing on the places where enrollees spend their time: their home; their community; and an additional source of care provided by the plan, the PACE center. The PACE center is a crucial component of the model as a site where enrollees can receive nearly all of these services; in fact, many enrollees receive the majority of their health care at the PACE center.2
The BBA established not-for-profit PACE as a permanent program and mandated a study of the impact of implementing the program. In 2008, Mathematica completed a study of the permanent not-for-profit component of the PACE program, and an interim report to Congress based on this study was submitted in January 2009. The BBA also established a demonstration of for-profit PACE plans and mandated a study and report to Congress of the demonstration. The BBA mandated that the study examine the following items:
A. Number of covered lives in for-profit PACE plans.
B. Frailty of for-profit enrollees compared to those in not-for-profit PACE plans.
C. Access to and quality of care of for-profit enrollees compared to those in not-for-profit PACE plans.
D. Has the implementation of the for-profit PACE demonstration led to an increase in expenditures above the expenditures that would have been made if the section did not apply?
2 For more information on the services provided by PACE plans nationally, visit the National PACE
Association (NPA) website (http://www.npaonline.org) and the PACE4You site (http://www.pace4you.org). For more information on the services provided by PACE plans in Pennsylvania, visit the PACE page on the Pennsylvania Department of Aging website: http://www.portal.state.pa.us/portal/server.pt?open=514&objID=733117&mode=2.
Study of For-Profit PACE Mathematica Policy Research
6
However, at the time of the 2008 study conducted by Mathematica, no for-profit plans had enrolled in the program. Therefore, the Mathematica report and Interim report to Congress did not include an analysis of for-profit PACE, and the Interim report did not address the BBA questions related to the for-profit demonstration. Since the conclusion of the 2008 study, for-profit PACE plans have enrolled in the demonstration; all operate in Pennsylvania. The for-profit plans allow for a comparison of care for enrollees in the for-profit PACE plans with care provided by other not-for-profit PACE plans located in Pennsylvania. CMS has information that can answer items A, B, and D. This study examines whether access to and quality of care at the for-profit PACE plans in Pennsylvania differ from that of the not-for-profit PACE plans in Pennsylvania (item C).
A commonly cited concern in the long-term care field is that for-profit entities might favorably select enrollees who have potentially lower costs or might provide less accessible, lower quality care. Although no studies have assessed the delivery of care by for-profit PACE plans, there is some evidence that for-profit status is correlated with access to and quality of care in related settings. For example, some studies have documented that for-profit nursing homes provide lower quality care than their not-for-profit peers. In a comprehensive literature review, Hillmer et al. (2005) find that not-for-profit nursing homes are less likely than for-profit nursing homes to have poor quality-of-care practices and outcomes. This study provides evidence about differences in enrollee characteristics prior to and during enrollment to assess potential differences in patterns of enrollment by plan type.
PACE in Pennsylvania
At the time of this study (using the selection of plans and sample enrollees, October 2012, as the study date), four for-profit PACE plans were operating in Pennsylvania.3 A single organization, Senior LIFE, operates four plans with five sites across the state.4
Table II.1. Names and Locations of For-Profit PACE Plans in Pennsylvania
Table II.1 presents the names of the for-profit PACE plans and the locations of the five sites. Senior LIFE Washington was the only for-profit plan operating multiple sites: Washington and Uniontown.
Plan Name Location(s)/City Name(s)
Senior LIFE Washington Washington, Uniontown Senior LIFE York York Senior LIFE Altoona Altoona Senior LIFE Johnstown Johnstown
3 The PACE program is referred to as Living Independence for the Elderly (LIFE) program in Pennsylvania. 4 A fifth for-profit PACE plan, operated by LIFE at Home, was terminated on May 1, 2012.
Study of For-Profit PACE Mathematica Policy Research
7
At the time of this study, 11 not-for-profit PACE plans were operating 21 sites across Pennsylvania.5
Table II.2. Names and Locations of Not-For-Profit PACE Plans in Pennsylvania
Table II.2 presents the names of the not-for-profit PACE plans and the locations of the 21 sites. Figure II.1 maps the locations of the 5 for-profit sites and the 21 not-for-profit sites. The for-profit plans are located outside of Pittsburgh and in the center of the state. The not-for-profit plans are located throughout the state, with concentrations in Philadelphia in the eastern part of the state and Pittsburgh in the western part of the state. We discuss the implications of plan location in detail in Chapter III, Methods.
Plan Name Location(s)/City Name(s)
Albright LIFE Williamsport, Lebanon, Lancaster New Courtland LIFE Philadelphia LIFE St. Mary Trevose Everyday LIFE Bethlehem LIFE Beaver County Aliquippa LIFE Lutheran Chambersburg LIFE Geisinger Scranton, Kulpmont Mercy LIFE Philadelphia (3 sites) LIFE Pittsburgh Pittsburgh (3 sites) Community LIFE Pittsburgh, McKeesport, Homestead, Tarentum LIFE UPenn Philadelphia
5 The combination of 15 PACE plans operating in Pennsylvania is more than any other state. In total, there are
roughly 100 PACE plans operating nationally. Information on the plans can be found at the NPA’s website: http://www.npaonline.org/.
Study of For-Profit PACE Mathematica Policy Research
8
Figure II.1. Locations of the For-Profit and Not-For-Profit PACE Plan Sites in Pennsylvania
Sources: PACE locations obtained from CMS. County borders obtained from U.S. Census Bureau 2010 county shapefiles. Map generated using ArcMap (ESRI (Environmental Systems Resource Institute). ArcMap 10.0. Redlands, CA: ESRI, 2011.).
Table II.3 presents the start dates for each PACE plan in Pennsylvania. The first PACE plans in Pennsylvania were not-for-profit plans; the first being LIFE UPenn in Philadelphia, which started in January 2002 (129 months in operation measured to October 1, 2012). The first for-profit PACE plan, Senior LIFE Johnstown, began operations in November 2007 (59 months in operation). The other three for-profit plans began operations in May 2011 (17 months in operation). The newest PACE plan is a not-for-profit plan, Albright LIFE, which began operating in January 2012 (9 months in operation). We discuss how length of time in operation was used as a factor in selecting the not-for-profit plans for inclusion in the study in Chapter III, Methods.
Study of For-Profit PACE Mathematica Policy Research
9
Table II.3. Start Dates for PACE Plans Operating in Pennsylvania
Plan Name Start Date
For-Profit . Senior LIFE Washington 5/1/2011 Senior LIFE York 5/1/2011 Senior LIFE Altoona 5/1/2011 Senior LIFE Johnstown 11/1/2007
Not-for-Profit . Albright LIFE 1/1/2012 New Courtland LIFE 10/1/2010 LIFE St. Mary 3/1/2010 Everyday LIFE 2/1/2009 LIFE Beaver County 11/1/2008 LIFE Lutheran 9/1/2008 LIFE Geisinger 6/1/2008 Mercy LIFE 10/1/2005 LIFE Pittsburgh 5/1/2005 Community LIFE 3/1/2004 LIFE UPenn 1/1/2002
Source: Start dates provided by CMS.
Table II.4 presents the number of enrollees in each PACE plan in Pennsylvania. Enrollment figures were obtained from CMS’s Medicare Advantage Part D Inquiry System (MARx) database and reflect enrollment on October 1, 2012. Total enrollment in the for-profit plans is 585; total enrollment in the not-for-profit plans is 2,787. The not-for-profit plans are larger on average, with 253 enrollees versus 146 enrollees per for-profit plan. In general, the plans with more time in operation have more enrollees; however, one of the newer for-profit plans, Senior LIFE Washington, has the most enrollees among for-profit plans, likely due to its two locations. We discuss how plan enrollment was used as a factor in selecting the not-for-profit plans and not-for-profit sample for inclusion in the study in Chapter III, Methods.
Study of For-Profit PACE Mathematica Policy Research
10
Table II.4. Number of Enrollees in PACE Plans in Pennsylvania, October 2012
Plan Name Number of Enrollees (October 1, 2012)
For-Profit . Senior LIFE Washington 272 Senior LIFE York 71 Senior LIFE Altoona 68 Senior LIFE Johnstown 174
Total For-Profit 585
Not-for-Profit . Albright LIFE 161 New Courtland LIFE 261 LIFE St. Mary 144 Everyday LIFE 68 LIFE Beaver County 271 LIFE Lutheran 72 LIFE Geisinger 183 Mercy LIFE 414 LIFE Pittsburgh 383 Community LIFE 407 LIFE UPenn 423
Total Not-for-Profit 2,787
Total PACE 3,372
Source: Enrollment obtained from CMS MARx database.
Study of For-Profit PACE Mathematica Policy Research
11
III. METHODS
To study whether care received by PACE enrollees in for-profit plans is different from the care received by enrollees in not-for-profit plans, we measured differences in access to and quality of care indicators between the for-profit plans and not-for-profit plans in Pennsylvania. Lacking the ability to randomly assign beneficiaries to enroll in for-profit and not-for-profit plans, we instead compared enrollees in the four for-profit PACE plans in Pennsylvania to four selected not-for-profit PACE sites in the state. The counterfactual of interest is whether the experiences of for-profit PACE enrollees would be different had they instead enrolled in not-for-profit PACE plans in Pennsylvania.
A key analytic challenge of this approach is accounting for the potential differences between the patient populations at the for-profit and not-for-profit PACE plans included in the study. This concern is somewhat mitigated by the fact that we are comparing PACE enrollees with other PACE enrollees. By selecting plans located in areas with similar demographic characteristics, we take the first step in accounting for possible differences in the broader local populations. The enrollee matching process is the next step in ensuring that the for-profit sample is similar to the comparison group along any key factors. Finally, by controlling for enrollee characteristics in the multivariate analysis, we control for observable differences among the enrollees.
The selection process for the four not-for-profit comparison plans was conducted in two steps. First, we selected not-for-profit plans based on the length of time in operation; geographic characteristics (urban/rural); and population characteristics (age, race, ethnicity, and income, among others). The second step in the sampling process was to match individual enrollees within the not-for-profit plans to for-profit enrollees based on the length of time enrolled in their PACE plan. We discuss the sampling process in greater detail in the Study Design section below.
We implemented descriptive and multivariate analyses to examine whether for-profit PACE plans deliver access to and quality of care that differ from access and quality provided by not-for-profit plans. The descriptive analysis focuses on three topics: (1) an examination of enrollee characteristics at the time of enrollment in their PACE plan to determine whether for-profit sites enroll patients that are different on average (termed “cream skimming” in the literature if intentional), (2) a comparison of demographic and health characteristics between the two types of PACE plans to further examine whether for-profit PACE plans have enrollees that are different in key dimensions that could be correlated with quality, and (3) a comparison of access and quality measures as a first glimpse of whether for-profit enrollees receive care that is different on average when compared to that received by not-for-profit enrollees. The multivariate analysis builds on the descriptive analysis by estimating the relationship between access and quality and for-profit status while accounting for differences in enrollee health and demographic characteristics discovered in the bivariate comparisons. We discuss in detail the analytic methods used to generate the descriptive and multivariate results and the approach for interpreting the results in the Analysis of Results section later in this chapter.
Study Design
The overall study design is a two-step matched design: (1) match not-for-profit PACE plans to the four for-profit PACE plans and (2) match for-profit and not-for-profit enrollee samples from the selected PACE plans. The approach is designed to meet the objectives of the study, to compare access to and quality of care of the for-profit PACE plans taking part in the
Study of For-Profit PACE Mathematica Policy Research
12
demonstration to that of not-for-profit plans. To this end, we selected four not-for-profit plans and enrollees that were similar to the four for-profit plans and sampled along key dimensions that are likely indirectly related to access and quality but are not a direct representation of the care delivered by the plans, such as local population characteristics of the potential enrollee pool and the length of time enrollees are enrolled in their PACE plan. We describe the processes for plan selection and sample selection below with greater detail provided in Appendix A.
Plan Selection
Selection of not-for-profit plans. The matching of not-for-profit PACE plans to the for-profit plans reduces the likelihood that there are factors not directly related to the provision of high quality care that differ between the two types of plans. For example, as mentioned previously, the for-profit plans in Pennsylvania are typically newer, which could lead to lower quality care in the short-term while the sites gain experience. A comparison of these plans to more established not-for-profit plans (which also could have delivered lower quality care when they first began operations) could lead to spurious conclusions about the quality of care in for-profit and not-for-profit PACE. In addition, the pools of potential enrollees available to the PACE plans could differ by characteristics that are strongly associated with health status (for example, income and education). If for-profit PACE plans enroll healthier individuals on average simply because of the pool of patients in the community and healthier patients report greater access to and higher quality of care, the comparisons could once again lead to spurious conclusions about differences by plan type.
The primary challenge in selecting the not-for-profit plans to serve as a comparison group is identifying plans with comparable enrollees and pools of eligible enrollees. First, since the for-profit plans tend to be newer, and length of time in operation could be related to quality with no relation to for-profit status, it is important that we selected not-for-profit plans that have been in operation for an amount of time similar to their for-profit counterparts’ and therefore have enrollees with similar tenure in the plans. We also aimed to choose plans with similar pools of potential enrollees based on population-level demographic characteristics and located in similar regions so that we could study differences in the populations enrolled in for-profit versus not-for-profit plans and minimize any potential confounding factors in our analysis of differences in quality.6
• Be age 55 or older
PACE plans in Pennsylvania have the following participant eligibility requirements:
7
• Meet the level of care needs for a skilled nursing facility or a special rehabilitation facility
• Meet the financial requirements as determined by the local County Assistance Office or be able to privately pay
• Reside in an area served by a PACE provider
6 Confounding factors would be characteristics proven to be correlated with underlying health, such as poverty
and educational attainment. 7 The requirements for PACE eligibility in Pennsylvania can be found on the Pennsylvania Department of
Study of For-Profit PACE Mathematica Policy Research
13
• Be able to be safely served in the community as determined by a PACE provider
Based on the objectives of matching plans with similar length of time in operation, located in similar regions, and with similar populations according to the list of eligibility requirements, we considered the following criteria in the not-for-profit PACE plan selection process: (1) the length of time the plans have been in operation, (2) the location of the plans—urban versus rural settings, and (3) the population characteristics of those living in the plan service areas (particularly the elderly population 65 years of age and older).8
Final not-for-profit plans. Based on the three criteria discussed above, the following not-for-profit plans were selected for inclusion in the study:
• LIFE St. Mary
• LIFE Beaver County
• LIFE Lutheran
• LIFE Geisinger
Three not-for-profit plans stood apart from the rest in terms of overall comparability to the for-profit PACE plans: LIFE Beaver County, LIFE Lutheran, and LIFE Geisinger. These plans had similar lengths of time in operation, urban/rural status, and population characteristics when compared to the for-profit plans (Table III.1).
Table III.1. Summary of Not-for-Profit PACE Plan Selection, Plan Selection Crieria
Not-for-Profit Plan Name
Criteria 1: Length of Time in Operation
Criteria 2: Urban/Rural Status
Criteria 3: Population Characteristics
Albright LIFE . x x New Courtland LIFE x . . LIFE St. Mary x . . Everyday LIFE x . . LIFE Beaver County x x x LIFE Lutheran x x x LIFE Geisinger x x x Mercy LIFE . . . LIFE Pittsburgh . . . Community LIFE . . . LIFE UPenn . . .
Sources: Start dates provided by CMS. June 2003 Office of Management and Budget (OMB) urban/rural continuum codes; U.S. Census Bureau 2006–2010 American Community Survey (ACS). U.S. Census Bureau 2006–2010 ACS.
8 We analyzed populations 65 years and older rather than 55 years and older as the eligibility requirements
stipulate because roughly 90 percent of PACE enrollees in Pennsylvania are 65 years and older. Therefore, the 65 and older population in Pennsylvania is a better representation of likely PACE enrollees.
Study of For-Profit PACE Mathematica Policy Research
14
Four other not-for-profit plans compared favorably to the for-profit plans for some but not all of the three criteria discussed thus far. Albright LIFE is similar in urban/rural status and population characteristics but had only been in operation for nine months. New Courtland LIFE had been in operation for 24 months but is located in an urban setting with higher poverty and a different racial and ethnic composition than the for-profit sites. LIFE St. Mary and Everyday LIFE had been in operation for 31 and 44 months, respectively, and are in settings that are similar to the for-profit sites; however, there are a few differences in population characteristics. The final four remaining not-for-profit plans (Mercy LIFE, LIFE Pittsburgh, Community LIFE, and LIFE UPenn) were not considered further due to their relatively long periods of time in operation, their location in urban settings, and differences in population characteristics.
Because the length of time in operation and the enrollment tenure of enrollees are the primary matching variables in the plan/sample selection, Albright LIFE was removed from consideration due to its brief time in operation. In addition, although New Courtland LIFE had been in operation for 24 months, this plan was removed from consideration because of the substantial differences in setting and patient population. LIFE St. Mary was the final plan selected for the study because the plan had enough enrollees with sufficient time enrolled in PACE to match the for-profit sample, whereas Everyday LIFE did not. The selection of LIFE St. Mary based on ensuring that the plans had enough enrollees to match the for-profit sample by time enrolled is discussed in detail in the Sample Selection section below.
In Appendix A, we discuss each step in the selection process in detail. Also, in Appendix B, we compare the for-profit and not-for-profit plans service areas by two additional characteristics to demonstrate that the populations of potential enrollees are similar by plan type: percentages of the age 65 years and older populations that were (1) dually eligible for Medicaid and Medicare and (2) enrolled in managed care plans (Appendix B, Table B.1). The proportions of the elderly populations that were dually eligible were similar for the for-profit and not-for-profit service areas, roughly 10 to 20 percent. The proportions of the elderly population in managed care plans varied somewhat by plan type. Although the range of managed care penetration among the elderly was quite similar, the for-profit service areas typically had higher rates of managed care enrollment when compared to the not-for-profit service areas. We also present a map with the final plans selected for the study showing their locations by the population density of the local area and proximity to major urban centers (Appendix B, Figure B.1).
Sample Selection
The sample selection process was designed to facilitate the objective of the study, comparing access to and quality of care for enrollees in the for-profit PACE plans taking part in the for-profit demonstration to those in not-for-profit PACE plans in Pennsylvania. The overall approach was to draw matched samples of for-profit and not-for-profit enrollees. The goal of the matching process was to match not-for-profit enrollees by any characteristics that were systematically different between for-profit and not-for-profit enrollees and correlated with quality but not directly related to the quality provided by the PACE sites. If the matching goal is achieved, any remaining differences in access and quality by PACE type (after controlling for enrollee characteristics in the multivariate analysis) can be attributed to differences in the care delivered by the plans.
The samples were matched based on the length of time enrollees were enrolled in their PACE plans. Because the for-profit PACE plans tend to be newer than the not-for-profit plans,
Study of For-Profit PACE Mathematica Policy Research
15
average length of enrollment is lower. The average length of enrollment in for-profit PACE plans was 17.4 months, compared to 28.7 months in not-for-profit plans. If length of enrollment is correlated with attitudes on access and quality of care, the comparisons in the study could lead to spurious conclusions about the relationship between for-profit status and quality.9
Health status at admission is another potential key difference between for-profit and not-for-profit enrollees that could be correlated with access and quality but not indicative of the level of quality provided by the plans. It is often suggested that for-profit entities enroll healthier individuals on average, a practice termed “cream skimming” (Perry and Stone 2011, Friesner and Rosenman 2009, Mukamel et al. 2009, Ferrier and Valdmanis 2006). If this is the case, and healthier enrollees tend to report higher access and quality regardless of quality provided by the sites, a simple comparison of for-profit and not-for-profit enrollees would be biased toward finding higher quality at for-profit sites. Although it is imperative to control for any differences in underlying health, we do so by including measures of health (health information collected in the survey) as control variables in the multivariate analysis (described further in the Analysis of Results section of this chapter) rather than by matching the samples based on indicators of health. This allows us to compare whether for-profit enrollees, particularly in the period prior to enrollment in PACE, are healthier on average, providing evidence for or against “cream skimming.”
The plan and sample selection processes produced a sample of enrollees with similar lengths of time enrolled in PACE plans with similar lengths of time in operation.
The first step in the sample selection was to select the for-profit sample and divide it into strata based on the distribution of the number of months enrollees were enrolled in their PACE plan (measured as of October 2012).10
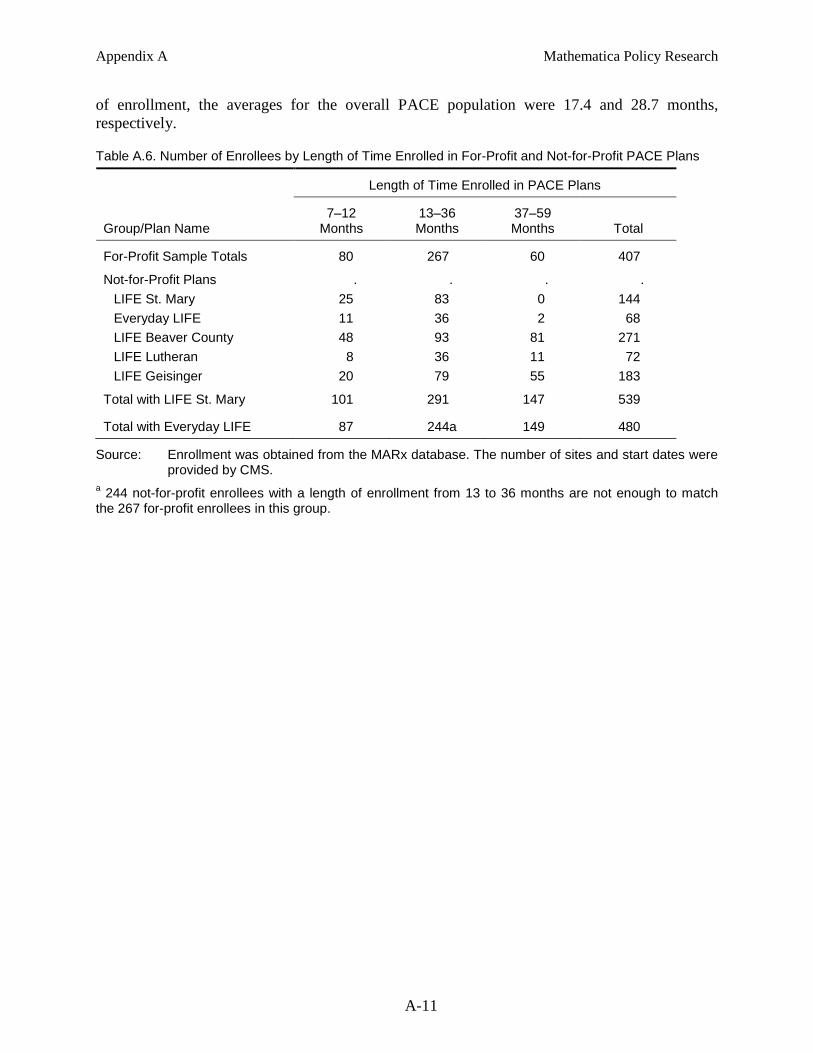
The next step was to similarly divide the not-for-profit enrollees according to the length of enrollment strata and proportionately sample them to match the for-profit distribution for length of enrollment. We determined that of the two remaining not-for-profit candidate plans, only LIFE St. Mary had enough enrollees in the three strata to produce a match to the not-for-profit sample. After selecting LIFE St. Mary as the final plan included in the study, we randomly selected not-for-profit enrollees from the three strata, providing for-profit and not-for-profit samples with the same distributions of length of enrollment. Table III.2 provides the number of not-for-profit enrollees by length of time enrolled in PACE plans. The table also reports the final
Because enrollees with six or fewer months in their plan are less likely to have the experiences receiving care in PACE plans that are necessary to assess the access to and quality of care, we removed them from the pool of potential sample enrollees. Next, we randomly selected enrollees from the three strata approximating short-, medium-, and long-term enrollment: 7 to 12 months, 13 to 36 months, and 37 to 59 months. Table III.2 provides the number of for-profit enrollees by length of time enrolled in PACE plans.
9 For example, newer enrollees could be more likely to respond favorably to satisfaction questions because
PACE represents an improvement to their previous coverage, regardless of the level of quality provided by the plan. Conversely, newer enrollees could be less likely to respond favorably if they are still adjusting to the new care model.
10 The sampling frames for the for-profit and not-for-profit PACE enrollees included all individuals who were enrolled in PACE plans in Pennsylvania when the sample was drawn in October 2012 and alive when the initial survey was administered from November 2012 to March 2013.
Study of For-Profit PACE Mathematica Policy Research
16
distributions of for-profit and not-for-profit survey respondents by length of time enrolled in PACE plans, demonstrating that the length of time enrolled is similar among respondents and the final samples. We provide a detailed description of the sample selection process in Appendix A.
Table III.2. Final Sample and Survey Respondents by Length of Time Enrolled in For-Profit and Not-for-Profit PACE Plans
Length of Time Enrolled in PACE Plans
Group of Enrollees 7–12
Months 13–36 Months
37–59 Months Total
For-Profit Enrollees in the Final Sample . . . . Number of enrollees 80 267 60 407 Percentage of enrollees 19.7 65.6 14.7 .
Not-for-Profit Enrollees in the Final Sample . . . . Number of enrollees 80 266 60 406 Percentage of enrollees 19.7 65.5 14.8 .
For-Profit Enrollees Survey Respondents . . . . Number of enrollees 69 215 49 333 Percentage of enrollees 20.7 64.6 14.7 .
Not-for-Profit Enrollees Survey Respondents . . . . Number of enrollees 67 208 51 326 Percentage of enrollees 20.6 63.8 15.6 .
Source: Enrollment was obtained from the MARx database. The number of sites and start dates were provided by CMS.
Analysis of Results
The analytic approach comprises two steps designed to uncover differences in the access to and quality of care received by for-profit and not-for-profit PACE enrollees. The first step is a descriptive analysis to examine bivariate relationships between a wide array of enrollee characteristics and for-profit status. The second step is a multivariate analysis that accounts for enrollee characteristics that could confound these relationships. Taken together, the evidence from the analyses provides a rich picture of the differences between care delivered to for-profit and not-for-profit enrollees.
Descriptive Analysis
Comparison of enrollees prior to PACE enrollment. In the first piece of the descriptive analysis, we examine differences in for-profit and not-for-profit enrollees at the time they enrolled in their PACE plans. Differences could be indicative of “cream skimming” enrollees that are healthier. Such behavior could be explained if healthier enrollees require lower expenditures by the plans per dollar of reimbursement provided to the plans. The “cream skimming” of enrollees would have to be achieved through the targeting of lower-cost enrollees (although the mechanism through which plans would achieve this is unclear) rather than the denial of higher cost enrollees because the plans are required to enroll eligible individuals. In addition to the potential “cream skimming” of individual enrollees, there is also the potential that plans choose to locate in areas where they are more likely to attract healthier and lower cost
Study of For-Profit PACE Mathematica Policy Research
17
enrollees, such as areas with higher income and healthier enrollees with greater family and community supports. Although not the direct selection of enrollees, the practice could have the same effect of enrolling healthier individuals on average.11
To examine potential “cream skimming” of enrollees, we compared all for-profit and not-for-profit enrollees in Pennsylvania prior to enrollment.
Evidence of differences prior to enrollment is informative not only to provide evidence of this practice but also to begin to inform enrollee-level characteristics to include in the multivariate analysis.
12 We included characteristics that could be indicative of healthier and lower cost enrollees: existence of chronic conditions prior to enrollment, original reason for Medicare entitlement is disability or ESRD, and whether the enrollee was previously enrolled in a managed care plan (enrollees switching from another private plan could be perceived to be lower cost by the plans). The timing of information on enrollees available in CMS data sources was ideal for this analysis, allowing us to compare enrollees in the time just prior to enrollment in PACE. In addition, we were able to include all PACE enrollees in the state compared to the subsequent analyses comparing samples of enrollees in plans with similar service area populations; therefore, we provide evidence of the total effect of potential “cream skimming” through strategic plan location plus direct selection of enrollees (although we cannot differentiate between the two). However, the enrollee characteristics obtained from CMS data sources to characterize the period prior to enrollment are limited when compared to the much richer set of enrollee health and demographic characteristics provided through the survey for sample members.13
Comparison of demographic and health characteristics after enrollment. In the second piece of the descriptive analysis, we compared the health and demographic characteristics of the for-profit and not-for-profit samples using information collected from the survey and CMS administrative data sources. We began with an analysis of responses to the survey questions on basic demographic characteristics and a host of questions to assess the health of the enrollees (for example, self-reported health status, health conditions, and health care utilization). The primary purpose of these comparisons is to identify variables that are correlated with access and quality but not indicative of quality of care delivered by the plans, with the intention of including a subset of these variables as explanatory variables in the multivariate analysis. Although the comparisons of the rich set of health characteristics can also be used to examine “cream skimming,” the timing is not ideal for this purpose; too much time elapsed for many of the enrollees since they enrolled in the plan, allowing for substantial changes in their health,
We discuss the construction of these characteristics at enrollment in detail in Chapter IV, Data.
11 In the process of selecting plans to include in the study, we observed several differences in the service area
populations of for-profit and not-for-profit plans in Pennsylvania—greater poverty, lower education, and larger minority populations for the not-for-profit plans—particularly for the not-for-profit plans located in urban centers.
12 The populations are defined as all individuals enrolled in a PACE plan in October 2012, the same date that we pulled the frame of enrollees to use for sample selection.
13 Because we are measuring these factors at the time of enrollment, which in practice means just prior to enrollment, we are limited to the characteristics available for all Medicare beneficiaries prior to enrollment, that is, those in FFS or Medicare managed care (a third group, those not eligible for Medicare prior to enrollment in PACE, is a very small fraction of the PACE population). For example, we cannot compare expenditures and utilization at the time of enrollment from CMS claims data because the information is not available for PACE enrollees that were not in FFS prior to enrollment in PACE.
Study of For-Profit PACE Mathematica Policy Research
18
particularly in a population where declines in health over a short period of time are not uncommon. We compared enrollees in plans matched based on the service area population characteristics, which means that any evidence of “cream skimming” would be indicative of direct selection of enrollees rather than strategic location of the plans.
We supplemented the analysis of differences in the samples by health and demographic characteristics with enrollee characteristics from CMS administrative data sources. We compared health characteristics and coverage information, such as ESRD, and the current reason for entitlement, between the for-profit and not-for-profit plans. The measures of dual eligibility are the same as those examined in the analysis of enrollees prior to enrollment. In this case, however, the variables are defined around the time of the survey (rather than the period prior to each enrollee’s enrollment in PACE), and the comparisons are made using the for-profit and not-for-profit samples (rather than the full population).
Comparison of access and quality. The final piece of the descriptive analysis is a comparison of measures of access and quality by for-profit status. The measures of access and quality are derived from questions included in the enrollee survey (for example, questions on patients’ ability to access various services and their satisfaction with care). The results present the first picture of whether there are differences in the access to and quality of care received by for-profit enrollees as compared to not-for-profit enrollees in the state.
In each of the pieces of the descriptive analysis, we compare the mean values of each characteristic for the for-profit and not-for-profit enrollees. For the analysis of enrollees prior to enrollment, we compare unweighted population means.14
Multivariate Analysis
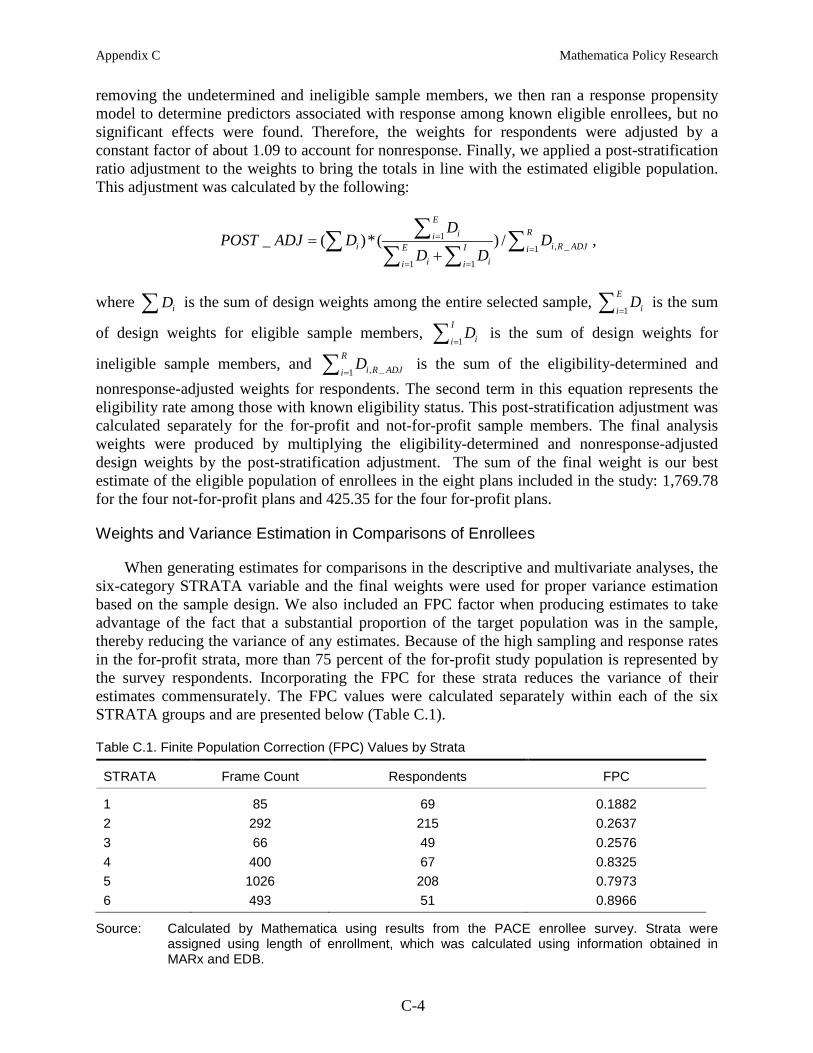
In the two analyses of differences in the for-profit and not-for-profit samples, we report the statistical significance of the differences while accounting for the effects of the sample design on the precision of the test statistics. This process included calculating means weighted for survey nonresponse, accounting for the sample selection strata, and adding a finite population correction (FPC) for the for-profit enrollees. We discuss the survey parameters in greater detail in Appendix C.
The final component of the analytic framework is a multivariate analysis, which estimates the differences in quality and access received by for-profit and not-for-profit enrollees while accounting for enrollee characteristics. The multivariate analysis builds off of the bivariate relationships estimated in the descriptive analysis by accounting for observed differences among the enrollees—in particular, any characteristics that are associated with for-profit status and the measure of access and quality, but not an aspect of access to or quality of care delivered by the plans. The PACE plans may differ by plan structural characteristics (such as tenure and size), by eligible patient populations in their area, and by enrollee characteristics. For example, an enrollee with lower health status, and therefore more complexities to his or her care, could perceive the same level of care as lower when compared to someone with better overall health. If for-profit plans have more enrollees with lower health status, it could appear that for-profit enrollees have
14 We did not test the statistical significance of the observed population differences given that we are
examining the universe of all PACE enrollees in the state. Any observed differences by for-profit status are interpreted as the actual differences between the two groups.
Study of For-Profit PACE Mathematica Policy Research
19
lower quality of care. Therefore, we included such characteristics in the multivariate analysis to help isolate the relationship between for-profit status and measures of access and quality.
In the conceptual model of access to and quality of care, the objective is to include an indicator for enrollment in a for-profit plan and any factors that influence an enrollee’s responses to questions on these issues but are not necessarily reflective of the care that plans deliver to enrollees. Based on this objective, we included the following factors in the model specifications: proxy respondent for the enrollee; length of time enrolled in the PACE plan; an indicator for being enrolled in a managed care plan prior to enrollment; demographic characteristics; health status and utilization of care; and social supports (for example, involvement with and support from family, spouse, and community). An indicator for proxy was included because proxies could have different views of the quality of care delivered, and the need for a proxy is likely correlated with functional limitations caused by poor health. Longer tenure in a plan could be correlated with perceptions of higher quality of care as enrollees become more accustomed to the care model and have time to adjust to the changes that come with a new type of coverage. Enrollees coming from another managed care plan could perceive access and quality of care in PACE differently than those coming from FFS (in addition to potential differences in health between those in managed care compared to FFS that could be correlated with perceptions of access and quality).
In addition, we included in the regression models demographic characteristics that have demonstrated to be correlated with health in countless studies, such as age, gender, race, ethnicity, education, and income, as well as measures of enrollee health. If healthier enrollees are more likely to respond that they are satisfied or very satisfied with the quality of their care regardless of the actual level of care delivered, it is important to examine controlling for these factors as well as direct measures of health in the multivariate analysis. Social and family supports and mental health are also important factors that could be directly or indirectly related to quality of care. Enrollees with fewer supports or poor mental health could be more likely to rate their satisfaction as low regardless of the quality of care. However, few supports and poor mental health could also be a direct indication of low quality of care, depending on the degree to which care delivered by PACE plans can influence these factors.
To estimate the models of access and quality, we ran separate regressions for each measure. Because the measures of access to and quality of care are binary outcome variables, we estimated logistic regression models and calculated the marginal associations between for-profit status and access and quality.15,16 We accounted for survey nonresponse and the sampling strata and included an FPC in each regression.17
15 We used the logit command in Stata to run the logistic regressions. We ran the margins command to
calculate the average marginal effects for the logistic regressions. We used the svyset command to incorporate the weights, strata, and FPC (StataCorp. Stata Statistical Software: Release 12. College Station, TX: StataCorp LP, 2011).
The general form of the regression models estimated in the multivariate is as follows:
16 We discuss the set of dependent variables studied in this analysis in Chapter IV, Data and Appendix E. 17 We present a detailed description of the inclusion of survey parameters in the regressions in Appendix C
under the heading Weights and Variance Estimation in Comparisons of Enrollees.
Study of For-Profit PACE Mathematica Policy Research
20
' ' '1 2 3 4i o i i i i iY FP X H Sβ β β β β ε= + + + + +
where iY is a measure of access to and quality of care for enrollee i; iFP is an indicator for whether enrollee i is in a for-profit PACE plan; iX is a vector of enrollee characteristics, such as demographic characteristics, proxy respondent, length of time enrolled in the PACE plan, and enrollment in a managed care plan prior to enrollment in PACE; iH is a vector of enrollee health characteristics for the enrollees; and iS is a vector of social supports for the enrollees.
As in the descriptive analysis, we constructed the measures of access to and quality of care from information collected in the survey. The enrollee characteristics employed as control variables were collected primarily through the survey (for example, admission to a hospital in the past year and self-reported health status), although variables such as length of time enrolled in the PACE plan and enrollment in managed care prior to enrollment in PACE were obtained from CMS administrative data sources. We drew from the comparisons of enrollees by plan type in the descriptive analysis to help inform the decisions regarding which enrollee-level characteristics to include in the multivariate analysis.18
The marginal association between an enrollee being in a for-profit plan and the level of the access and quality measures is calculated from the coefficient
Table III.3 lists the explanatory variables included in the final model specification.
1β on the for-profit indicator, iFP . For example, a value of 5.0 for the marginal association would mean that enrollees in the for-profit plans were five percentage points more likely to report that they were satisfied or very satisfied with care at the PACE sites, which could be in the context of a mean percentage of 80 percent for the entire sample.
18 We looked for large and statistically significant differences in the factors by for-profit and not-for-profit
enrollees; however, we also included factors that had a strong conceptual rationale for inclusion in the models but did not show large differences at the sample level. It is still important to account for such factors even if the overall means do not differ at the sample level because they could demonstrate substantial variation by for-profit status once we begin accounting for other factors. Factors that did not demonstrate a relationship with the access and quality measures were removed from the final model specification. We deemed there to be no relationship if the estimated coefficients for a factor were not precisely measured (not statistically significant) across any or very few of the measures of access and quality.
Study of For-Profit PACE Mathematica Policy Research
21
Table III.3. List of Explanatory Variables Included in the Multivariate Analysis
Variable Description Data Source
Indicator for For-Profit PACE MARx
Enrollee Demographic and Other Characteristics . Proxy Respondent PACE survey Age PACE survey Gender (female) PACE survey Nonwhite PACE survey Hispanic PACE survey Education—High School Graduate or Greater PACE survey Income—Less than $15,000 PACE survey Number of Months in PACE MARx, EDB In Managed Care Plan Prior to Enrollment in PACE MARx, EDB
Health Characteristics . Admitted to a Hospital in the Past Year PACE survey Nursing Home Stay in the Past Year PACE survey Health Fair or Poor PACE survey
Social Supports . Married or Living with Partner PACE survey Live with Family or Friends, or Checked on in Last Week PACE survey Life Pretty or Completely Satisfying PACE survey
This page has been left blank for double-sided copying.
Study of For-Profit PACE Mathematica Policy Research
23
IV. DATA
The descriptive and multivariate analyses are supported by information on enrollees obtained from two sources: a survey of PACE enrollees and CMS administrative data sources. Mathematica conducted a telephone survey of the sample of for-profit and not-for-profit enrollees to obtain the information used to define the outcomes of interest, measures of access to and quality of care, as well as measures of enrollee health and functional status, quality of life, and demographic characteristics. The information in the survey is supplemented by enrollee health and coverage characteristics obtained from several CMS data sources, including the MARx database, the Medicare Enrollment Database (EDB), and the Medicare Beneficiary Summary Files (MBSF). In this chapter, we describe the process of collecting the variables from the data sources and the methods for defining the key variables used in the analyses.
Survey of PACE Enrollees
To gather the information needed to measure differences in access to and quality of care between for-profit and not-for-profit sites, we conducted a survey of selected PACE enrollees in the eight selected PACE plans in Pennsylvania. The survey was designed to collect information on different dimensions of access to care and the quality of care provided by PACE plans, such as care management, utilization of preventive/routine services, and satisfaction with a variety of services provided by PACE. The information collected in the survey is used to define measures of access to and quality of care that can be used to assess the degree to which plans are delivering services that are expected for a high level of overall care. The survey also collected health and functional status, quality of life, and demographic data. These data are used to describe differences, if any, between enrollees in the two different types of plans and to account for differences in health status when comparing access to and quality of care in the multivariate analysis.
Survey Design
The survey developed for this study draws heavily upon the survey instrument that was administered in 2006 by Mathematica for the 2008 evaluation of the not-for-profit PACE programs with several key modifications. In redesigning the survey, we balanced the need to add questions to collect information on a fuller range of PACE services with the need to minimize respondent burden. First, we modified several questions that were directed to a comparison group of non-PACE enrollees in the previous study so that they refer specifically to the PACE plans. Second, to minimize respondent burden, we removed questions about the source and use of caregivers that were not relevant to the research objectives of the study. We also removed follow-up questions about use of special equipment to help with activities of daily living (ADLs) because of low item response in the 2006 survey. Finally, we added several questions, adapted from the Consumer Assessment of Healthcare Providers and Systems (CAHPS) Adult Commercial Questionnaire and Supplemental Items, to measure satisfaction with other services, including use of rehabilitative care, care delivered by specialist doctors, and transportation services. The additional items were chosen based on a literature review of studies focusing on differences in for-profit and not-for-profit health care as well as general PACE studies and a review of the services provided by PACE plans in Pennsylvania. We also met with representatives from the National Pace Association in December 2011 to discuss potential topics to include in the survey.
Study of For-Profit PACE Mathematica Policy Research
24
The domains covered by the survey are presented in Table IV.1. The information collected under each domain aligns with care and services provided by PACE plans, either at the PACE sites or coordinated by the plans outside of the sites. Domains A (care management measures) and B (health utilization measures) contain questions that can be used to assess the degree to which plans are delivering services that are expected for a high level of overall care, such as unmet needs, screens, and hospital and nursing home stays). Similarly, improved care management and utilization of health services will likely lead to greater satisfaction with care. If the for-profit PACE plans manage the care of their enrollees differently than not-for-profit PACE plans do, their enrollees could experience different levels of satisfaction with the care they receive. Domain C (satisfaction measures) contains questions to assess the satisfaction with care and services provided by the PACE plan. The survey also includes questions to assess health and functional status, quality of life, and enrollee demographic characteristics (domains D and E).
Table IV.1. Survey Domains
Presence of advanced directive/living will A. Care Management Measures
Pain management Falls Unintentional weight loss Unmet needs
Hospitalizations within last year B. Health Utilization Measures
Nursing home stays within last year Hearing screening Vision screening Influenza vaccine Pneumonia vaccine
Satisfaction with quality of care C. Satisfaction Measures
Satisfaction with medical care Satisfaction with personal assistance Satisfaction with transportation services
Self-rated health status D. Health Status Measures
ADLs (getting out of bed, dressing, bathing, toileting, getting around, eating) Depression Behavioral problems
Social and family supports E. Quality of Life and Demographics
Enrollee demographics Socioeconomic status
Study of For-Profit PACE Mathematica Policy Research
25
Sample Targets
The target number of completed surveys of for-profit and not-for-profit enrollees was chosen to approximate the universe of for-profit enrollees in Pennsylvania and achieve a level of statistical power in detecting differences by PACE plan type. The target number of completes was set at 650, allocated equally across for-profit and not-for-profit plans—325 for-profit enrollees and 325 not-for-profit enrollees. Assuming an 80 percent response rate, the initial sample size was set at 813 enrollees, with 407 for-profit enrollees and 406 not-for-profit enrollees.19,20
Survey Administration
The target for-profit sample was quite close to the total population of for-profit enrollees (measured at the time the sample was drawn in October 2012) after removing those with zero to six months in the PACE plan (458).
The survey was administered by telephone (fielded for 16 weeks from November 2012 through March 2013) with in-person follow-up for non-respondents. At-home interviews were conducted in the last week of the field period with sample members who we were unable to be reached by telephone or who requested in-person administration because of difficulty speaking or hearing on the phone. Appendix D contains additional details on the administration of the survey in addition to information on locating, interviewer training, and quality assurance processes.
We completed 659 interviews to achieve an overall response rate of 82.8 percent (Table IV.2). Response rates were essentially the same for the not-for-profit and for-profit PACE respondents (82.9 and 82.8 percent, respectively), with 326 not-for-profit enrollees and 333 for-profit enrollees completing the survey. The two groups differed in level of use of proxy respondents; rate of proxy response was lower among the for-profit respondents (32 percent of completed surveys) compared to the not-for-profit respondents (43 percent). Of the 659 interviews, 11 were administered in person, 9 interviews were conducted for enrollees in a single not-for-profit plan, and 2 interviews were conducted for enrollees in a single for-profit plan. The average time to complete the survey was approximately 30 minutes. The response rates were high and generally consistent around 80 percent for the individual PACE plans, with a low of 79.1 percent and a high of 87.4 percent (Table IV.3).
19 An 80 percent response rate was deemed realistic based on the response rate for the telephone survey in the
2008 PACE evaluation (77 percent) and planned coordination with the Pennsylvania PACE Association to obtain accurate address and telephone information.
20 When the sample targets were set in July 2011, there were only 460 for-profit PACE enrollees. Therefore, 407 for-profit enrollees was a reasonable limit for the size of the sample, considering that additional enrollees might have to be added to the sample to achieve the target number of completes in the case of higher than expected nonresponse or deceased enrollees. We chose for-profit PACE for the higher targeted sample of 407 enrollees (compared to 406 for the not-for-profit sample) to slightly increase the likelihood of achieving the targeted 325 completes (given that this is the group of interest for the study).
Study of For-Profit PACE Mathematica Policy Research
26
Table IV.2. Survey Completion by Type of PACE Plan
Not-for-Profit For-Profit Combined
Number of Completed Interviews 326 333 659 Number (%) completed by sample member 185 (56.7%) 226 (67.9%) 411 (62.4%) Number (%) completed by proxya 141 (43.3%) 107 (32.1%) 248 (37.6%)
Response Rate (unweighted)b 82.9% 82.8% 82.8%
Source: Survey of PACE enrollees conducted by Mathematica from November 2012 to March 2013. a Used a proxy respondent at any point during the survey b The response rates were calculated using industry standards (RR3 in The American Association for Public Opinion Research, 2011. Standard Definitions: Final Dispositions of Case Codes and Outcome Rates for Surveys. 7th edition. AAPOR) with the calculation being the number of completed interviews divided by the number of eligible sample members. If we confirmed that a sample member was deceased, then he or she was considered ineligible for the study. Because we had 81 sample members with undetermined eligibility, we estimated their eligibility rate based on the rate among those with determined eligibility status (within the for-profit and not-for-profit groups).
Table IV.3. Survey Completion by PACE Plan
PACE Plans Completed Interviews Response Rate (Unweighted)a
For-Profit . . Senior LIFE Washington 156 79.1 Senior LIFE York 41 87.4 Senior LIFE Altoona 32 84.2 Senior LIFE Johnstown 104 86.5
Not-for-Profit . . LIFE St. Mary 75 81.2 LIFE Beaver County 127 82.6 LIFE Lutheran 38 86.6 LIFE Geisinger 86 83.1
Source: Survey of PACE enrollees conducted by Mathematica from November 2012 to March 2013. a The response rates were calculated using industry standards (RR3 in The American Association for Public Opinion Research, 2011. Standard Definitions: Final Dispositions of Case Codes and Outcome Rates for Surveys. 7th edition. AAPOR) with the calculation being the number of completed interviews divided by the number of eligible sample members. If we confirmed that a sample member was deceased, then he or she was considered ineligible for the study. Because we had 81 sample members with undetermined eligibility, we estimated their eligibility rate based on the rate among those with determined eligibility status (within the for-profit and not-for-profit groups).
Construction of Key Survey Variables
The descriptive and multivariate analyses assess differences in for-profit and not-for-profit PACE plans using discrete measures of access and quality. We used the same information to define binary variables of whether the enrollees were satisfied or very satisfied (versus unsatisfied or very unsatisfied) for each satisfaction question in the survey. We provide a more detailed description of how each measure of access and quality obtained from the survey was defined in Table E.1 in Appendix E.
Study of For-Profit PACE Mathematica Policy Research
27
CMS Administrative Data Sources
Length of Time Enrolled in PACE Plans
Once we identified all PACE enrollees in Pennsylvania and their plan identifiers using MARx data, we matched all enrollees to the EDB to determine the date they enrolled in their current PACE plans. We calculated the length of time enrolled in a PACE plan as the number of months from the enrollment date to October 1, 2012 (the date of the match to the EDB). CMS provided the operation start dates for each plan. The number of months in operation was calculated as the number of months from the start date to October 1, 2012.
Comparison of Enrollees Prior to PACE Enrollment
We defined health and coverage variables for every PACE enrollee in the state using the MBSF from 2005 to 2012 and coverage dates on the EDB. The variables were defined for each enrollee prior to the date of enrollment in their current PACE plan. The enrollment dates were obtained from the EDB as described above. The variables included in this analysis are flags for chronic conditions, dual eligibility for Medicaid and Medicare, in a managed care plan prior to PACE, and whether the original reason for Medicare entitlement was disability or ESRD (as opposed to turning age 65). We defined three types of chronic conditions variables: whether the enrollee had any chronic conditions, the count of chronic conditions, and indicators for 27 individual chronic conditions.21
Comparison of Health Characteristics and Coverage After Enrollment
Dual eligibility was defined as both full and full or partial eligibility in any of the 12 months prior to enrollment and the number of months eligible over the same 12 months. We defined three indicators of managed care coverage prior to enrollment in PACE: enrollment in a managed care plan in the month prior to PACE enrollment, in any of the six months prior to PACE enrollment, or ever enrolled in a managed care plan. We provide additional detail on the construction of the measures of health and coverage prior to PACE enrollment as well as a list of the 27 chronic conditions in Appendix E.
To supplement the descriptive analysis of health and demographic characteristics measured at the time of the survey, we defined additional variables on the health and health coverage of those responding to the survey using information provided in the MBSF. Because the 2012 MBSF is not yet available, we defined these variables using information from the 2011 file, a date that is a year or more prior to when the surveys were administered. Thus, these variables reflect a period slightly earlier than the information provided through the survey and a period prior to enrollment for those that enrolled in PACE in 2012. We defined the same dual eligibility flags (fully and fully or partially eligible in any month) and counts (number of months fully and
21 Because chronic condition information is only available in months in which beneficiaries are in FFS, we
restricted the comparison of chronic conditions to those in FFS for 7 to 12 months out of the 12 months prior to enrollment in PACE to minimize the chance that we are missing information for those enrolled in managed care plans for much of this time period. This is an important distinction when comparing chronic conditions between for-profit and not-for-profit plans because for-profit enrollees are more likely to have been in managed care plans prior to enrollment in PACE. It is possible that any beneficiary with at least one month in FFS during their Medicare eligibility will have accurate chronic conditions flags; however, fewer months in FFS lower the likelihood that a beneficiary will have enough claims information to produce flags that accurately reflect current chronic conditions.
Study of For-Profit PACE Mathematica Policy Research
28
partially or fully eligible), although the variables were defined over the 12 months in 2011 to reflect information from a period in time close to the survey. We also defined indicators of whether the current reason for Medicare eligibility was disability or ESRD (or both) and whether the enrollee had ESRD using information obtained in the 2011 MBSF.
Study of For-Profit PACE Mathematica Policy Research
29
V. RESULTS
Descriptive Analysis
In this section, we compare the characteristics of the for-profit and not-for-profit PACE enrollees. We begin with comparisons of health characteristics and coverage prior to enrollment in the current PACE plans. Next, we compare demographic characteristics and additional health characteristics of the enrollees. Finally, we introduce the comparisons of access to and quality of care, which will be expanded in the multivariate section of this chapter.
Comparison Prior to Enrollment
Examination of administrative data suggests that enrollees in for-profit PACE plans may have been slightly more advantaged in socioeconomic terms relative to enrollees in not-for-profit PACE plans (Table V.1). They were slightly less likely to be enrolled in both Medicare and Medicaid. They were also substantially more likely to have been enrolled in Medicare Advantage prior to PACE enrollment, possibly indicating somewhat greater health status. However, the rates of chronic conditions were nearly identical.
Table V.1. Comparison of Enrollee Health Characteristics and Coverage Prior to Enrollment by For-Profit Status (percentage unless otherwise noted)
Measures of Enrollee Health and Coverage For-Profit
PACE Not-For-Profit
PACE
Original Reason for Medicare Eligibility Disability or ESRD 29.5 28.7
Plan Prior to PACE Enrollment . . Managed Care in Month Prior to Enrollment 64.1 48.8 Managed Care in 6 Months Prior to Enrollment 65.6 50.5 Managed Care in Any Month Prior to Enrollment 76.6 66.2
Dual Eligibility for Medicaid and Medicare . . Dual Eligibility (full dual in at least 1 of the past 12 months) 70.7 77.1 Dual Eligibility (full or partial dual in at least 1 of the past 12 months)
79.2 82.2
Past 12 Months Dual Eligibility (full, average number of months) 5.5 6.4 Past 12 Months Dual Eligibility (full or partial, average number of months)
6.9 7.3
Chronic Conditionsa . . Any Chronic Conditions 96.7 95.6 Chronic Conditions (average number of conditions) 8.4 8.5
Sources: MARx, EDB, MBSF. a Chronic conditions were measured only among those enrollees in FFS for 7 to 12 months out of the 12 months prior to enrollment in PACE.
Study of For-Profit PACE Mathematica Policy Research
30
Eligibility based on disabilities and ESRD could indicate a higher level of health care needs when compared to eligibility based on turning age 65. For-profit PACE enrollees were similarly likely to have been originally eligible for Medicare based on a disability or ESRD, 29.5 percent compared to 28.7 percent (Table V.1).22
Traditionally, managed care plans have attracted healthier and thus lower cost enrollees on average than FFS plans (McWilliams et al. 2012). Therefore, potential PACE enrollees in managed care plans could be seen as lower cost and healthier on average than those in FFS. For-profit PACE enrollees were much more likely to have been enrolled in a managed care plan prior to enrolling in PACE than were not-for-profit enrollees (Table V.1). This is true in the month prior to enrollment (64.1 percent compared to 48.8 percent), in any of the six months prior to enrollment (65.6 percent compared to 50.5 percent), and in any month prior to enrollment (76.6 percent compared to 66.2 percent). Almost all of the enrollees not in managed care prior to enrollment in PACE were in FFS, although a small number of enrollees was not eligible for Medicare prior to enrollment.
Therefore, roughly the same proportions of the populations for the two plan types were aging into Medicare versus those eligible prior to age 65 because of a disability or ESRD.
In the Medicare population as a whole, enrollees dually eligible for Medicaid and Medicare are less healthy and have lower incomes on average (Henry J. Kaiser Family Foundation 2011). For-profit PACE plans enrolled dual eligibles at a lower rate than did the not-for-profit plans (Table V.1). In for-profit plans, 70.7 percent of enrollees were full duals in at least one month prior enrollment (an average of 5.5 months fully eligible), compared to 77.1 percent of not-for-profit enrollees (an average of 6.4 months fully eligible). When considering full or partial duals, 79.2 percent of for-profit enrollees were fully or partially eligible (an average of 6.9 months) compared to 82.2 percent for not-for-profit enrollees (an average of 7.3 months). When we compare dual eligibility during enrollment in PACE in the following section of this chapter, we find that more than 90 percent of for-profit and not-for-profit enrollees were dually eligible. It is possible that the enrollees were eligible but only identified as such after enrollment or that they became eligible after enrollment because their income and assets declined below the eligibility cutoff for Medicaid. Another interesting finding is that beneficiaries enrolling in either PACE plan type in later years were less likely to be dually eligible; that is, plans enrolled lower proportions of dual eligibles over time (figures not reported). However, as mentioned previously, nearly all enrollees were dually eligible after enrollment in PACE, measured in 2011.
Using chronic conditions prior to enrollment as an indication of the health of individuals prior to enrolling in PACE, we find little difference in the health of for-profit enrollees were compared to not-for-profit enrollees. The percentage of enrollees with at least one chronic condition prior to enrollment was slightly higher among for-profit enrollees (96.7 percent compared to 95.6 percent), although nearly all enrollees of both types had a chronic condition. For-profit enrollees had slightly fewer chronic conditions on average (8.4 compared to 8.5 for not-for-profit enrollees; Table V.1). In addition, for-profit enrollees had lower rates for only 11 of 27 chronic conditions (see Table F.1 in Appendix F for comparisons of the complete list of
22 We do not test for statistically significant differences because the differences are calculated on the full population of for-profit and not-for-profit PACE enrollees in Pennsylvania (determined in October 2012). Therefore, any observed differences are the actual differences in the population.
Study of For-Profit PACE Mathematica Policy Research
31
chronic conditions by plan type); the rates were much lower in the case of Alzheimer’s disease (32.4 percent compared to 47.2 percent), anemia (59.4 percent compared to 68.0 percent) and stroke/transient ischemic attack (23.2 percent compared to 32.2 percent).
Comparison of Demographic and Health Characteristics After Enrollment
In this section, we compare the demographic and health characteristics of for-profit and not-for-profit enrollees using information collected in the survey of PACE enrollees. Using CMS administrative data sources, we supplement this information with comparisons of health characteristics and coverage of the same enrollees that responded to the survey. Uncovering differences in enrollee demographic and health characteristics between plan types is important to the extent that these factors could be correlated with differences in quality but are not directly related to the care delivered by plans. Such factors will be considered for inclusion in the multivariate analysis to isolate differences in access and quality by plan type.
Demographic Characteristics
Demographic characteristics as measured by survey responses present a somewhat different picture of enrollees in for-profit and not-for-profit PACE plans (Table V.2). Survey respondents enrolled in for-profit plans were more likely to be nonwhite, less likely to have completed high school, and less likely to report that they lived with family or friends or someone checked on them regularly in the past week. Moreover, they were less likely to require a proxy to respond to the survey. Enrollees were similar in the remainder of demographic and socioeconomic characteristics and family and social supports.23
The age and gender of for-profit and not-for-profit enrollees were quite similar. The average age of for-profit enrollees was slightly lower, 78.8 compared to 79.8 years for not-for-profit enrollees (Table V.2). Both plan types had high proportions of female enrollees, although the percentage was slightly lower for for-profit plans, 74.5 percent, compared to 77.0 percent for not-for-profit plans.
For-profit plans had a higher percentage of nonwhite enrollees, 9.9 percent compared to 6.3 percent in not-for-profit plans (Table V.2). Both plan types had lower percentages of Hispanic enrollees; for-profit plans had a slightly lower percentage, 1.4 percent compared to 1.6 percent, although the difference was not statistically significant. In contrast, a higher percentage of for-profit respondents completed the survey in Spanish, although this was quite rare for both plan types, 0.3 percent of for-profit enrollees compared to none of the not-for-profit enrollees.
23 We tested whether the differences in the mean values between the for-profit and not-for-profit enrollee
samples were statistically different, accounting for the sample weights, strata, and FPC.
Study of For-Profit PACE Mathematica Policy Research
32
Table V.2. Comparison of Enrollee Characteristics After Enrollment by For-Profit Status (percentage unless otherwise noted)
Enrollee Characteristics For-Profit
PACE Not-For-Profit
PACE
Enrollee Demographics . . Age (average) 78.8 79.8 Gender, female 74.5 77.0 Nonwhite 9.9 ** 6.3 ** Hispanic 1.4 1.6 Language other than English 0.3 * 0.0 * Married or Living with Partner 3.9 5.4 Health of Spouse Fair or Poor 41.8 30.3
Socioeconomic Status . . Education, High School Graduate or Greater 57.9 *** 67.2 *** Income < $15k 75.0 73.4
Family and Social Supports . . Life Pretty or Completely Satisfying 73.1 74.9 Great Deal of Choice Over When and What You Do 46.5 45.1 Lives with Family or Friends or Checked On in the Last Week by Family or Friends
92.4 *** 96.4 ***
Lives with Family or Friends or Talks to Family and Friends as Much as They Want
83.1 84.7
Attends Events as Often as They Want 52.3 52.9
Did the Respondent Use a Proxy? 31.8 *** 43.8 ***
Source: Responses obtained from PACE enrollees through a survey administered by Mathematica from November 2012 through March 2013.
Living with a spouse or partner can be a valuable support for the frail elderly in providing care and other less tangible supports that lead to a better quality of life. A small percentage of enrollees were living with a spouse or partner at the time of the survey, 3.9 percent of for-profit enrollees compared to 5.4 percent of not-for-profit enrollees; the difference was not statistically significant (Table V.2). Among those living with a spouse or partner, 41.8 percent of the for-profit enrollees’ spouses of partners were in fair or poor health compared to 30.3 percent of not-for-profit enrollees. Although large, the difference was not statistically significant because of the very small number of enrollees living with their spouse or partner.
According to the reported metrics of education and income, for-profit enrollees had a lower level of education on average, but roughly the same income, on average. Among for-profit enrollees, 57.9 percent graduated from high school compared to 67.2 percent for not-for-profit enrollees (Table V.2). Roughly three-fourths of enrollees in both plan types had an income less
Study of For-Profit PACE Mathematica Policy Research
33
than $15,000. This high rate of low-income enrollees is not surprising given that a high percentage of PACE enrollees are eligible for Medicaid based on their income.24
There was little difference between the five measures of quality of life and family and social supports by the type of plan. Roughly three-fourths of both types of enrollees responded that their lives were pretty or completely satisfying, and nearly half of both types of enrollees responded that they had a great deal of choice over what they do and when they do it (Table V.2). Regarding enrollee supports, a high percentage of enrollees reported that they lived with family or friends or family of friends regularly checked on them during the last week for both types of plans; however, the percentage was lower for for-profit enrollees, 92.4 percent compared to 96.4 percent for not-for-profit enrollees. The percentages of enrollees responding that they talk to family and friends and attend events as often as they want were similar for both plan types.
For-profit enrollees were less likely to use a proxy to respond to the survey, 31.8 percent compared to 43.8 percent for not-for-profit enrollees (Table V.2).25
Health Characteristics
It is possible that proxy respondents are more or less likely than the enrollees to respond that access and quality are higher. It is also likely that proxies were needed for enrollees with more serious and limiting health conditions. The literature on this topic suggests that there is typically a high level of agreement between proxy and subject responses among elderly populations (particularly for physical health and functioning, but less so for mental health (Ostbye et al. 1997, MRC-CFA 2000, Neumann et al. 2000). When differences occur, proxies tended to report higher levels of impairment and need. We examine the inclusion of an indicator for proxy respondent in the multivariate analysis to study these issues further.
Self-reported health as measured by survey responses differed somewhat between enrollees in for-profit and not-for-profit PACE plans (Table V.3). Although survey respondents by plan type were equally likely to report fair or poor health, survey respondents enrolled in not-for-profit plans were more likely to report higher rates of specific health conditions. Conversely, respondent in for-profit plans were more likely to report mental health issues and behavioral issues (reported by proxies). Overall, the differences in self-reported health were small.
24 The discrepancy between lower education and roughly equal income for for-profit enrollees is persistent for
different education and income cutoffs; for instance, the discrepancy exists if we define education by college completion and income as lower than $20,000.
25 Roughly 67 percent of proxy respondents were the children of the enrollees, 14 percent were other relatives, and the remaining proxy respondents had various other relationships with the enrollees (for example, friend, spouse, and paid caregivers).
Study of For-Profit PACE Mathematica Policy Research
34
Table V.3. Comparison of Enrollee Health After Enrollment by For-Profit Status (percentage)
Measures of Enrollee Health For-Profit
PACE Not-For-Profit
PACE
Health Status . . Health Fair or Poor 45.0 45.2 Health Compared to a Year Ago is Worse or Much Worse 24.0 22.6 Health Compared to a Year Ago is Better or Much Better 29.9 27.9
If Doctor has Told You that You Have: . . Arthritis 77.2 ** 71.7 ** Hip Fracture 10.8 ** 15.2 ** Bed Sores or Leg Ulcers 11.8 *** 5.2 *** Alzheimer's Disease or Dementia 23.6 *** 31.3 *** A Mental or Psychiatric Disorder other than Alzheimer's Disease or Dementia
12.5 15.7
Diabetes or Sugar Diabetes 35.5 40.2 Strokes 23.7 24.2 Parkinson's Disease 3.6 ** 6.9 ** Impaired Vision 53.8 52.0 Special Vision Problems such as Glaucoma, Cataracts, or Problems with Retina
58.3 61.1
Hearing Problems 35.8 *** 43.5 *** Angina or Coronary Heart Disease 27.2 30.9 Heart Attacks or Myocardial Infarctions 17.5 20.9 Emphysema, Chronic Bronchitis or Chronic Obstructive Pulmonary Disease (COPD)
26.3 28.9
Cancer or Malignancy (besides skin cancers that only grow on the skin)
13.8 ** 18.7 **
Kidney Disease or Failure 10.5 12.9
Behavior (answered by proxy) . . Wanders, Strays, or Becomes Lost in Community 32.5 ** 19.5 ** Verbally Disruptive 30.1 26.3 Physically Aggressive 11.3 11.3 Hallucinations or Delusions 65.1 * 54.6 *
Mental Health . . Felt Down in Past Month 44.5 42.6 Little Interest in Doing Things in Past Month 49.0 ** 42.5 ** Worried a Lot in Past Month 44.0 39.9 Keyed Up or on Edge in Past Month 37.2 33.0
Source: Responses obtained from PACE enrollees through a survey administered by Mathematica from November 2012 through March 2013.
Study of For-Profit PACE Mathematica Policy Research
35
The overall health status of the enrollees was similar by plan type. Roughly 45 percent of enrollees reported that their health was fair or poor (Table V.3). In addition, similar percentages reported that their health compared to a year ago changed, either for better or worse, although for-profit enrollees were slightly more likely to indicate that their health changed overall. Table V.3 also reports a host of enrollee-reported specific conditions by plan type. For-profit enrollees were less likely to have 13 of the 16 conditions, although only 5 of the 13 differences were statistically significant. The five conditions where the differences were statistically significant were hip fracture, Alzheimer’s or dementia, Parkinson’s disease, hearing problems, and cancer other than skin cancer. The two conditions that for-profit enrollees were more likely to report and the differences were statistical significant were arthritis and bed sores or leg ulcers. Differences in health by plan type have two potential implications: they could indicate poor underlying health that is not tied to the care delivered by PACE plans (for instance, cancer or Parkinson’s disease) or they could indicate changes in health that could be tied to care (such as bed sores).
Proxies responding for the for-profit enrollees were more likely to respond that the enrollees had several behavioral issues when compared to proxies responding for not-for-profit enrollees. Among enrollees for which a proxy responded, 32.5 percent of the for-profit enrollees wandered, strayed, or became lost in the community because of impaired judgment, compared to 19.5 percent of not-for-profit enrollees (Table V.3). In addition, higher percentages of for-profit enrollees were verbally disruptive (30.1 percent compared to 26.3 percent, although the difference is not statistically significant) and had hallucinations or delusions (65.1 percent compared to 54.6 percent). Roughly 11 percent of both types of enrollees were physically aggressive as reported by proxy respondents.
For-profit and not-for-profit enrollees responded similarly for measures of mental health, although for-profit enrollees reported slightly higher rates of mental health issues for each measure. Thirty to forty percent of enrollees responded that they felt down in the past month, worried a lot in the past month, or felt keyed up or on edge in the past month, and none of the differences were statistically significant. The largest difference was observed for responses on whether enrollees had little interest in doing things in the past month; 49.0 percent of for-profit enrollees responded that this was the case compared to 42.5 among not-for-profit enrollees.
Health Characteristics and Coverage
For-profit enrollees were slightly more likely to be dually eligible for both Medicaid and Medicare, but slightly less likely to be eligible for Medicare due to disability or ESRD. After matching plans and samples based on length of enrollment in PACE, the average enrollment period for survey respondents in for-profit plans was only slightly lower than not-for-profit enrollees (measured as the number of months enrolled in PACE).
Study of For-Profit PACE Mathematica Policy Research
36
Table V.4. Comparison of Enrollee Health Characteristics and Coverage After Enrollment by For-Profit Status
Measures of Enrollee Health and Coverage For-Profit
PACE Not-For-Profit
PACE
Number of Months Enrolled in PACE 21.0 *** 25.3 ***
ESRD (percentage) 0.3 1.0
Current Reason for Eligibility DIB or ESRD (percentage) 8.3 * 11.8 *
Dual Eligibility . . Dual Eligibility (full dual in at least 1 month in 2011) (percentage)
94.0 *** 90.0 ***
Dual Eligibility (full or partial dual in at least 1 month in 2011) (percentage)
95.2 ** 91.7 **
Number of Months in 2011 Dual Eligible (full) 9.5 9.2 Number of Months in 2011 Dual Eligible (full or partial) 10.2 *** 9.6 ***
We compare a set of health characteristics and coverage variables similar to those used in the analysis of enrollees prior to enrollment. However, in this analysis, the variables are measured in 2011 to indicate how the enrollees compared while enrolled in PACE and at a time closer to the collection of the health information reported from the survey and presented in Table V.3. We compare for-profit enrollees using two new variables, the number of months enrolled in the current PACE plan and whether the enrollees have ESRD, a condition related to Medicare eligibility. For-profit enrollees were enrolled in their PACE plan for 21.0 months on average compared to 25.3 months for not-for-profit enrollees (Table V.4). Although the difference is statistically significant, a difference of 4 months is much less than the 11-month difference observed in the full PACE population prior to matching at the enrollee and plan levels. Furthermore, the percentage of enrollees with ESRD was quite low for both plan types, 0.3 percent for for-profit enrollees and 1.0 percent for not-for-profit enrollees.
A lower percentage of for-profit enrollees were eligible for Medicare due to a disability or ESRD, 8.3 percent compared to 11.8 percent (Table V.4). Although the overall finding is similar to the analysis of enrollees prior to enrollment, these percentages are less than half the percentages prior to enrollment because more of the enrollees became eligible based on age after turning 65.
In contrast to the analysis of enrollees prior to enrollment, those in for-profit PACE were more likely to be dually eligible for Medicaid and Medicare, both fully eligible and fully or partially eligible. However, more than 90 percent of both types of enrollees were dually eligible (Table V.4). The average number of months dually eligible is also greater than in the analysis prior to enrollment; 9.5 months fully eligible on average for for-profit enrollees compared to 9.2 months for not-for-profit enrollees (the difference is not statistically significant) and 10.2 months fully or partially eligible compared to 9.6 months. As mentioned previously, the increase in the percentage of enrollees dually eligible from the period prior to enrollment could be due to beneficiaries not showing up as dually eligible prior to PACE enrollment when they were in fact
Study of For-Profit PACE Mathematica Policy Research
37
eligible, and thus they enrolled in Medicaid and Medicare once in the PACE plan. The increase could also be caused by enrollees becoming eligible over time as their income and assets decline and they become eligible for Medicaid.
Access to and Quality of Care
In this section, we discuss results from the bivariate comparisons of measures of access to and quality of care between for-profit and not-for-profit enrollees. We discuss the findings in brief, as we present a more detailed discussion of these comparisons while controlling for other factors in the multivariate analysis section to follow.
While the for-profit enrollees reported lower values for measures of care management on average, few of the differences were statistically significant, and there were a few exceptions where for-profit enrollees reported better care management (lower unintentional weight loss and a higher rate of personal needs taken care of all of the time - Table V.5). Regarding self-reported measures of health utilization, for-profit enrollees reported lower rates of routine services. They were also less likely to report that they lived in a group home, assisted living facility, or nursing home, admission to a hospital in the past year, and a nursing home stay in the past year. These findings could reflect better underlying enrollee health or higher quality of care through minimizing hospitalizations and keeping enrollees in the community and out of nursing homes.
In general, satisfaction with care was quite high among for-profit and not-for-profit enrollees, with greater than 90 percent of enrollees reporting that they were satisfied or very satisfied with the various aspects of care delivered by the plans (Table V.6). However, there were quite a few differences in the reporting of satisfaction with care between the for-profit and not-for-profit enrollees. For-profit enrollees reported lower rates of being satisfied or very satisfied with eight of ten measures when compared to the not-for-profit enrollees (six of eight differences were statistically significant). Similarly, for-profit enrollees were less likely to report that they could always see a specialist when needed and more likely to report that the PACE program does not have enough specialists needed by enrollees and that there was a time in the past year when they needed to but could not see a specialist.
It is also important to note that for-profit enrollees were more likely to have visited the PACE center in the past month (Table V.6). They were also less likely to receive therapy outside of the PACE center and much more likely to receive therapy at the PACE center. These discrepancies could indicate differences in quality of care by PACE plan type or differences in the need for care by plan type. However, after considering patient health status and health needs in the multivariate analysis, for-profit plans are still more likely to provide care at the PACE center, which is one of the primary aims of the PACE program.
Study of For-Profit PACE Mathematica Policy Research
38
Table V.5. Descriptive Analysis of Access to and Quality of Care by For-Profit Status (percentage)
Measures of Access and Quality For-Profit
PACE Not-For-Profit
PACE
Care Management . . Pain Most or All of the Time 33.3 29.0 Severe Pain 19.3 ** 14.0 ** Fallen in Past 6 Months 41.1 37.4 Injured by a Fall in Past 6 Months 17.3 13.9 Lost 10 or More Pounds (unintentional) 16.8 ** 22.7 ** Takes a Great Deal of Energy to Get Services 57.2 *** 48.8 *** Good or Very Good Reassurance/Emotional Supporta 7.9 9.9 PACE Caregivers Paid Attention All of the Timea 54.6 60.8 Personal Care Needs Taken Care of All of the Timea 70.8 66.6 PACE Caregivers Completed All Work Most or All of the Timea 90.5 92.4 PACE Caregivers Rushed Through their Work None of the Timea 48.2 56.2 Signed Durable Power of Attorney or Living Will 79.8 82.5
Health Utilization . . Living in Group Home, Assisted Living Facility, or Nursing Home 7.7 *** 18.2 *** Admitted to a Hospital in the Past Year 22.0 *** 29.1 *** Nursing Home Stay in the Past Year 14.2 *** 29.1 *** Flu Shot since Sept. 2012 (6 months, coincides with winter) 78.3 *** 85.0 *** Flu Shot or Offered and Refused 95.5 96.0 Pneumonia Vaccination 78.6 82.3 Hearing Tested Regularly (at least once per year) 53.6 55.7 Eyesight Tested Regularly (at least once per year) 71.1 *** 83.0 ***
Source: Responses obtained from PACE enrollees through a survey administered by Mathematica from November 2012 through March 2013.
a The questions are conditional on the respondent receiving some type of direct assistance from a PACE caregiver.
Study of For-Profit PACE Mathematica Policy Research
39
Table V.6. Descriptive Analysis of Quality of Care Satisfaction Measures by For-Profit Status (percentage)
Measures of Quality For-Profit PACE Not-For-Profit
PACE
Satisfaction Measures . . Visited the PACE Center in the Past Month 89.5 *** 80.9 ***
- Satisfied or very satisfied with overall care at PACE 91.4 ** 94.8 ** Received Therapy at PACE Center 75.3 *** 59.5 ***
- Satisfied or very satisfied with therapy 96.3 96.4 Received Therapy Outside of PACE 13.2 * 17.1 *
- Satisfied or very satisfied with therapy 93.0 94.0 Satisfied or Very Satisfied with Information from MDs 90.9 ** 94.0 ** Satisfied or Very Satisfied with Information on meds 96.1 ** 98.2 ** Satisfied or Very Satisfied with Coordination 93.2 *** 96.7 *** Always Received Transportation Help when Needed 89.7 90.0 Satisfied or Very Satisfied with Transportation Help 96.1 * 98.0 * Satisfied or Very Satisfied with Respect 93.2 95.3 Satisfied or Very Satisfied with How Viewed as a Persona 96.8 95.6 Always Specialist Appt. when Needed 56.1 * 64.2 * Not Enough Specialists 54.8 *** 34.6 *** Could not See a Specialist 24.0 ** 16.4 ** Satisfied or Very Satisfied with Specialist Care 94.0 * 97.1 *
Source: Responses obtained from PACE enrollees through a survey administered by Mathematica from November 2012 through March 2013.
a The question is conditional on the respondent receiving some type of direct assistance from a PACE caregiver.
We also compared for-profit and not-for-profit enrollee responses on the need for help with ADLs, receipt of help from PACE caregivers, and unmet needs from PACE caregivers. For-profit PACE enrollees were less likely to report that they needed help with ADLs (for all six ADLs examined), but conditional on responded that they received help for an ADL, they were more likely to report receipt of help from a PACE caregiver (Table V.7). However, among those receiving help from PACE caregivers, for-profit enrollees were more likely to report unmet needs regarding the receipt of help for five of six ADLs.
Study of For-Profit PACE Mathematica Policy Research
40
Table V.7. Comparison of Limitations of ADLs and Help with ADLs by For-Profit Status (percentage)
ADLs For-Profit
PACE Not-For-Profit
PACE
Eating . . Required Help with Eating 16.6 20.3
Received Help with Eating from PACE Staffa 70.2 * 53.8 *
Unmet Needs Related to Eatingb 16.8 7.2
Getting Around Indoors . . Required Help Getting Around 26.4 *** 35.2 ***
Received Help Getting Around from PACE Staffa 66.0 53.4
Unmet Needs Related to Getting Aroundb 18.5 * 8.3 *
Getting Dressed . . Required Help Getting Dressed 37.2 40.6
Received Help Getting Dressed from PACE Staffa 64.4 55.9
Unmet Needs Related to Getting Dressedb 6.7 7.1
Bathing . . Required Help Bathing 46.6 ** 53.6 **
Received Help Bathing from PACE Staffa 73.3 69.0
Unmet Needs Related to Bathingb 8.5 8.1
Using the Bathroom . . Required Help Using the Bathroom 24.5 *** 34.1 ***
Received Help Using the Bathroom from PACE Staffa 64.3 61.6
Unmet Needs Related to Using the Bathroomb 27.3 * 14.5 *
Getting In and Out of Bed . . Required Help Getting In and Out of Bed 19.2 *** 31.0 ***
Received Help Getting In and Out of Bed from PACE Staffa 52.3 48.6
Unmet Needs Related to Getting In and Out of Bedb 14.9 6.0
Source: Responses obtained from PACE enrollees through a survey administered by Mathematica from November 2012 through March 2013.
a The responses are conditional on the enrollees requiring help for the ADL
b The responses are conditional on the enrollees receiving help for the ADL.
Study of For-Profit PACE Mathematica Policy Research
41
Multivariate Analysis
In this section, we examine the direction and magnitude of associations between for-profit status and measures of access to and quality of care received by PACE enrollees (grouped by care management, health utilization, and satisfaction). We also consider the relationships between the explanatory variables and access and quality.
Care Management
The results do not provide a consistent conclusive pattern of differences between care management reported by for-profit and not-for-profit PACE enrollees. For most of the measures of quality related to care management, for-profit enrollees reported lower rates on average;. However, the marginal association between the measures and for-profit status is not precisely measured in most cases; that is, it is not statistically different from zero (at the 10 percent level; Table V.8).26
The results are similarly inconsistent for measures of care management that indicate the quality of direct services provided to PACE enrollees. For-profit enrollees were 9.5 percentage points more likely to report that it takes a great deal of energy to get services (compared to roughly half of not-for-profit enrollees, unadjusted). For-profit enrollees were less likely to report all of the following aspects of high quality care, although none of the differences are statistically significant: PACE caregivers provided good or very good reassurance/emotional support, paid attention all of the time, completed all work most or all of the time, and rushed through their work none of the time. For-profit enrollees were more likely to report that their personal care needs were taken care of all of the time and slightly more likely to report that they have signed a durable power of attorney or a living will, although neither association is statistically significant. The latter is considered an indication of high quality care management for a frail elderly population.
In addition, for-profit enrollees reported higher quality for several of the measures, although the associations are also not statistically significant. For example, considering outcomes that could be associated with high quality management of care, for-profit enrollees were more likely to report (after we controlled for demographic, health, and support characteristics) that they were in pain most or all of the time and that they were in severe pain; however, neither of these associations is statistically significant. Conversely, for-profit enrollees were less likely to report an unintentional weight loss of 10 or more pounds (also not statistically significant). An outcome related to care management that differed by for-profit and not-for-profit enrollees was falls; for-profit enrollees were 10.5 percentage points more likely to report a fall in the past six months and 5.8 percentage points more likely to report being injured in a fall in the past six months compared to not-for-profit enrollees (roughly 40 percent of not-for-profit enrollees reported falls and 14 percent reported being injured in a fall, unadjusted).
26 The values reported in the table represent the percentage point change in the measure of access or quality
associated with an enrollees being in a for-profit PACE plan.
Study of For-Profit PACE Mathematica Policy Research
42
Health Utilization
Next, we examined differences in measures of reported health utilization that are indicative of access to care and high quality care. Similar to the care management results, the findings do not reveal a single unified picture of differences by for-profit status. For-profit enrollees were 9.8 percentage points less likely to live in a group home, assisted living facility, or nursing home after controlling for the full range of demographic, health, and support variables. Given that a primary objective of the PACE program is to allow enrollees to remain in the community, lower rates of institutionalization could be an indication of high quality of care delivered by PACE plans.27
In general, for-profit enrollees were less likely to report that they were satisfied or very satisfied with various aspects of care delivered by the PACE plans; however, overall satisfaction was quite high for enrollees of both plan types, and the differences by plan type were typically small. Before we summarize the responses to questions of satisfaction, we first examine differences in the utilization of care at the PACE center. A primary objective of the PACE program is to offer comprehensive care to PACE enrollees at the PACE center whenever possible to minimize the effort required for enrollees to receive the care they need. For-profit enrollees were 12.9 percentage points more likely to receive therapy at the PACE center and less likely to receive therapy outside of the PACE center, although the latter association is not statistically significant (Table V.9). The differences in therapy in and outside of the PACE center do not necessarily indicate differences in quality of care and could also reflect differences in the need for therapy by plan type. However, more importantly, for-profit enrollees were 4.3 percentage points more likely to report that they visited the PACE center in the past month for any reason (compared to roughly 80 percent of not-for-profit enrollees, unadjusted).
Conversely, it is possible that some of these enrollees’ needs could be better served in a group home, assisted living facility or nursing home. Regarding utilization of routine preventive health services, for-profit enrollees were 9.8 percentage points less likely to report that they had a flu shot in the past six months, 5.7 percentage points less likely to report that they had a pneumonia vaccination, and 13.9 percentage points less likely to report that they had their eyesight tested regularly. For-profit enrollees were less likely to report that they either had a flu shot or were offered a flu shot but declined, but they were slightly more likely to report that they had their hearing tested regularly (although neither association is statistically significant).
Regarding the satisfaction with care provided at the PACE center, for-profit enrollees were 3.3 percentage points less likely to report that they were satisfied or very satisfied with the overall care at the PACE center (conditional on visiting the PACE center in the past month). Similarly, for-profit enrollees were slightly less likely to report that they were satisfied or very satisfied with therapy at the PACE center (conditional on receiving therapy at the PACE center), although the association is not statistically significant. Conversely, for-profit enrollees reported higher rates of satisfaction for therapy reported outside of the PACE center (conditional on receiving therapy outside of PACE).
27 We did not estimate models of whether enrollees were admitted to a hospital in the past year or nursing
home stays in the past year (even though they were included in the discussion of health utilization in the descriptive analysis) because they are included as explanatory variables in models of access to and quality of care.
Study of For-Profit PACE Mathematica Policy Research
43
Table V.8. Marginal Associations Between For-Profit Status and Care Management and Health Utilization
Access/Quality Variables
Association with For-Profit PACE Statusa Standard Error
Care Management . . Pain Most or All of the Time 2.7 3.4 Severe Pain 1.8 2.7 Fallen in Past 6 Months 10.5 3.5*** Injured by Fall in Past 6 Months 5.8 2.7** Lost 10 or More Pounds (unintentional) -4.7 3.0 Takes a Great Deal of Energy to Get Services 9.5 3.8** Good or Very Good Reassurance/Emotional Supportb -1.2 3.7 PACE Caregivers Paid Attention All of the Timeb -11.7 7.4 Personal Care Needs Taken Care of All of the Timeb 5.0 6.9 PACE Caregivers Completed All Work Most or All of the Timeb -0.1 4.1 PACE Caregivers Rushed Through Their Work None of the Timeb
-7.4 7.5
Signed Durable Power of Attorney or Living Will 0.3 2.4 Health Utilization .
Living in Group Home, Assisted Living Facility, or Nursing Home
-9.8 2.4***
Flu Shot since Sept. 2012 (6 months, coincides with winter) -9.8 3.0*** Flu Shot or Offered and Refused -2.1 1.8 Pneumonia Vaccination -5.7 2.9** Hearing Tested Regularly (at least once per year) 0.2 3.7 Eyesight Tested Regularly (at least once per year) -13.9 2.9***
Source: Responses obtained from PACE enrollees through a survey administered by Mathematica from November 2012 through March 2013.
a The values represent the percentage point change in the measure of access or quality associated with an enrollees being in a for-profit PACE plan.
b The questions are conditional on the respondent receiving some type of direct assistance from a PACE caregiver.
In addition, for-profit enrollees were less likely than not-for-profit enrollees to report high satisfaction with information provided by physicians and information on medications. They were 3.2 percentage points less likely to report that they were satisfied or very satisfied with information provided by physicians. Similarly, for-profit enrollees were 3.4 percentage points less likely to report that they were satisfied or very satisfied with information provided about medications. In the context of the unadjusted rates of satisfaction reported by not-for-profit enrollees for information provided by physicians and information on medications, 94.0 and 98.2, respectively, the observed differences by for-profit status are quite small.
Study of For-Profit PACE Mathematica Policy Research
44
For-profit enrollees were also slightly less likely to report high satisfaction with care coordination and transportation services. They were 3.1 and 1.0 percentage points less likely to report that they were satisfied or very satisfied with care coordination and transportation services, respectively. Once again, in the context of high satisfaction among enrollees in both plan types (greater than 90 percent of all enrollees reported that they were satisfied or very satisfied with care coordination and transportation services), the differences were quite small. We also examined whether enrollees received transportation services when needed; there was virtually no difference between the average responses by plan type.
Table V.9. Marginal Associations Between For-Profit Status and Satisfaction Measures
Access/Quality Variables
Association with For-Profit PACE
Statusa Standard Error
Satisfaction Measures . . Visited the PACE Center in the Past Month 4.3 2.4*
- Satisfied or very satisfied with overall care at PACE -3.3 1.9* Received Therapy at PACE Center 12.9 3.5***
- Satisfied or very satisfied with therapy -0.4 1.7 Received Therapy Outside of PACE -2.4 2.8
- Satisfied or very satisfied with therapy 5.2 2.5** Satisfied or Very Satisfied with Information from MDs -3.2 1.8* Satisfied or Very Satisfied with Information on Meds -3.4 1.0*** Satisfied or Very Satisfied with Coordination -3.1 1.3** Always Received Transportation Help when Needed 0.7 2.1 Satisfied or Very Satisfied with Transportation Help -1.0 1.2 Satisfied or Very Satisfied with Respect -4.2 1.7** Satisfied or Very Satisfied with How Viewed as a Personb
0.0 2.2
Always Specialist Appt. when Needed -16.0 4.9*** Not Enough Specialists 16.2 5.1*** Could not See a Specialist 8.1 4.0** Satisfied or Very Satisfied with Specialist Care -1.0 2.0
Source: Responses obtained from PACE enrollees through a survey administered by Mathematica from November 2012 through March 2013.
a The values represent the percentage point change in the measure of access or quality associated with an enrollees being in a for-profit PACE plan. b The question is conditional on the respondent receiving some type of direct assistance from a PACE caregiver.
Responses regarding satisfaction with the respect given by those providing care at the PACE center and with how enrollees were viewed as people by PACE caregivers were slightly lower among for-profit enrollees. For-profit enrollees were 4.2 percentage points less likely to report that they were satisfied or very satisfied with the respect they received from providers at the
Study of For-Profit PACE Mathematica Policy Research
45
PACE center. In the context of more than 95 percent of not-for-profit enrollees reporting that they were satisfied or very satisfied with the respect they received from PACE caregivers, the observed difference by plan type is quite small. Furthermore, there was no difference in reporting of satisfaction with how they were viewed as people by PACE caregivers.
Finally, for-profit enrollees reported lower satisfaction consistently with each measure of access to and quality of specialist care. They were 16.0 percentage points less likely to report that they were always able to get a specialist appointment when needed (compared to 64.2 percent for not-for-profit enrollees, unadjusted). Similarly, for-profit enrollees were 16.2 and 8.1 percentage points more likely to report that there were not enough specialists available and that they could not see a specialist when they wanted to, respectively (compared to 34.6 and 16.4 percent among not-for-profit enrollees, unadjusted). Furthermore, for-profit enrollees were slightly less likely to report that they were satisfied or very satisfied with specialist care, although the association was not statistically significant.28
The multivariate results are largely consistent with the findings in the descriptive analysis. There are a few exceptions where the observed differences were no longer statistically significant or became statistically significant, and the magnitude of the marginal associations can increase or decrease after controlling for the host of enrollee characteristics. In addition, the results are robust to the set of demographic, health, and support factors included in the model specifications. We tested a series of alternative specifications and examined any changes in the marginal associations between for-profit status and the measures of access and quality. In particular, we estimated models with (1) limited demographic variables (income only) but the full range of health and support variables, (2) limited health and support variables (number of chronic conditions and not checked on in the last month by family or friends) but the full range of demographic variables, (3) only variables with coefficients that are statistically significant, and (4) additional health variables (the count of self-reported health conditions and an indicator for having a limitation with at least one ADL). The direction and statistical significance of the differences were nearly identical in each model specification, and there were only small fluctuations in the magnitude of the differences among model results (results now shown). Therefore, we report the results from the model with the full set of demographic, health, and support factors.
Explanatory Variables
We also examine the associations between the control variables and the measures of access and quality to uncover any important patterns in the variation of care by these factors, such as whether length of time enrolled and number of chronic conditions are important predictors of quality care. There are a handful of patterns in the relationships between the explanatory
28 Differences in responses to questions of access to specialist care could be in part due to differences in the supply of specialist physicians in for-profit and not-for-profit service areas. However, this is not likely the case as the numbers of physicians in patient care per population are quite similar in the for-profit and not-for-profit service areas. The number of physicians per 1,000 total population in counties that overlap with the for-profit services areas ranges from 1.2 to 2.0 compared to 1.1 to 2.1 for not-for-profit service areas and 0.3 to 5.1 across all counties in the state. (Area Resource File, 2007 Release. The number of physicians is defined for 2006 from the American Medical Association Physician Master File. Population estimates are defined for 2006 from the U.S. Census Bureau County Characteristics File.)
Study of For-Profit PACE Mathematica Policy Research
46
variables and the measures of access and quality that are worth noting; however, many of the coefficients for the explanatory variables were imprecisely measured and inconsistent across the many measures of access and quality.
Enrollees with incomes less than $15,000 and those admitted to the hospital in the past year were less likely to report that they were satisfied or very satisfied with care. Stresses apart from health care such as financial stresses and the stress of a hospitalization could lead to an overall lower quality of life and to a lower likelihood that an enrollee would respond favorably to satisfaction questions regardless of the level of care. Conversely, enrollees reporting that they found their lives pretty or completely satisfying were more likely to report a high degree of satisfaction. If enrollees reported that they find their lives satisfying for reasons unrelated to the care delivered by their PACE plan (such as supports from friends and family), then it is reasonable to control for this in the regressions. However, it could also be the case that they report high satisfaction at least in part because of high quality of care delivered by PACE. In this case, including this variable in the model specification could obscure differences in the measures of access and quality by for-profit status. We estimated versions of the models without this factor and found virtually no fluctuations in the differences by for-profit status.
An admission to a hospital in the past year was associated with a greater likelihood of visiting the PACE center in the past month and receiving therapy at the PACE center, whereas a nursing home stay was associated with a lower likelihood of visiting and receiving therapy at the PACE center and a greater likelihood of receiving therapy outside of the PACE center. Hospitalizations likely reflect a need for services at the PACE center including therapy. The higher rate of therapy outside of the PACE center for enrollees with a nursing home stay is likely due to enrollees receiving therapy that is coordinated through the nursing home.
Not surprisingly, there is a strong positive association between measures such as falls, pain, and unintentional weight loss and the health and overall satisfaction of the enrollees. Enrollees with fair or poor health and those with a hospitalization in the past year were more likely to report these types of events, whereas those who reported that their lives were pretty or completely satisfying were less likely to report these events. However, it is feasible that enrollees report poor health, hospitalizations, and not being satisfied with their lives as a direct result of one or more of these adverse events. We estimated versions of the model specification without these health and support variables and found virtually no fluctuations in the findings for differences by for-profit status. Finally, enrollees reporting that they were not checked on during the past month and did not live with family, friends, or in a nursing home were less likely to report having a flu shot and that they had their hearing and sight checked regularly. The lack of support from family and friends appears to have a negative effect on the receipt of routine preventive services, although the lack of support for those living alone could also be an indication of lower quality of care.
In general, the enrollee demographic characteristics did not demonstrate consistent and statistically significant relationships with the measures of access and quality. The coefficients for age, gender, race, ethnicity, and education were rarely precisely measured and the directions of the associations were not consistent across the many measures of access and quality. We estimated versions of the model removing these demographic characteristics and found that there were virtually no fluctuations in the differences in the measures of access and quality by for-profit status.
Study of For-Profit PACE Mathematica Policy Research
47
VI. DISCUSSION
The study examines access to and quality of care in the four PACE plans taking part in the for-profit demonstration; all located in Pennsylvania and under common ownership. When compared to the full set of not-for-profit plans, the for-profit plans tend to be somewhat smaller and with less time in operation, and they are located outside of the major urban centers in the state. Therefore, extensions made to potential future for-profit plans should be made with caution. Considering this caveat, there are indications that access to and quality of care delivered by for-profit plans in Pennsylvania may be slightly lower than the matched not-for-profit plans in the state based on survey responses of enrollees. Despite these indications, satisfaction with care was quite high as reported by for-profit plans and similar to satisfaction among not-for-profit enrollees. Thus, in effect, although the findings point to differences between for-profit and not-for-profit PACE plans, the differences might not indicate a consistent and meaningful difference in overall access to and quality of care. We summarize the key findings below in Table VI.1.
Table VI.1. Summary of Key Findings
Health and Coverage Prior to Enrollment
• For-profit enrollees were slightly less likely to be dually eligible for Medicaid and Medicare and much more likely to have been enrolled in a managed care plan prior to enrolling in PACE.
• For-profit enrollees had similar rates of chronic conditions prior to enrollment
For-Profit PACE Plan Locations
• For-profit plans are located outside of urban centers in Pennsylvania and have less variation in the characteristics of the elderly populations comprising their service areas when compared to not-for-profit plans, which are located outside of urban centers and in urban centers.
• For-profit plans are located in areas with much higher Medicare managed care penetration rates.
Health and Demographic Characteristics of Current Enrolleesa
• For-profit enrollees were more likely to be nonwhite, less likely to have at least graduated from high school, and less likely to live with family, friends, or be checked on regularly by family or friends.
• Although for-profit enrollees were equally likely to report fair or poor health as not-for-profit enrollees, they were more likely to report most of the specific health conditions and limitations in ADLs. They also were less likely to have a proxy respond to the survey.
• For-profit enrollees were more likely to report mental health issues and more likely to have behavioral issues as reported by survey proxies.
• In contrast to the period prior to enrollment, for-profit enrollees were more likely to be dually eligible, although over 90 percent of all enrollees were dually eligible.
Care Management a
• There were few differences in care management by for-profit status. For-profit enrollees were more likely to report a fall, being injured in a fall in the past 6 months, and that it takes a great deal of energy to get services.
Study of For-Profit PACE Mathematica Policy Research
Table VI.1 (continued)
48
Health Utilization a
• For-profit enrollees were less likely to be living in a group home, assisted living facility, or nursing home, have an admission to a hospital in the past year, and a nursing home stay in the past year.
• For-profit enrollees were less likely to have had routine services, such as flu shots and a regular eyesight test. However, for-profit enrollees had similarly high rates of either receiving a flu shot or being offered a flu shot but refusing, nearly 96 percent of enrollees.
Satisfaction a
• For-profit enrollees were more likely to have visited the PACE center in the past month and received therapy at the PACE center.
• For-profit enrollees were more likely to report receipt of help from PACE staff related to limitations in ADLs (conditional on having such a limitation) but also more likely to report unmet needs related to limitations in ADLs.
• For-profit enrollees were less likely to report being satisfied or very satisfied with care delivered by their PACE plan; however, overall satisfaction was quite high (over 90% for nearly all types of care), and the differences between for-profit and not-for-profit plans were slight.
a The results in these analyses were calculated on a matched sample of for-profit and not-for-profit plans and enrollees.
Discussion of Findings
To examine access and quality of care delivered by PACE plans taking part in the for-profit demonstration, we compared for-profit plans to comparable not-for-profit plans along dimensions of care that should be provided under the PACE program. PACE plans seek to provide comprehensive care to enrollees, including the delivery of direct care coordination at the PACE center as well as services in the home and community. It is important for the future of the PACE program to determine whether for-profit plans, which could have different objectives due to their for-profit status, deliver the same high level of care as not-for-profit plans in the permanent program.
We interpret consistent, statistically significant differences between the plan types as evidence of differences in access to and quality of care delivered by the plans to their enrollees. In addition to considering differences in the measures taken together, we examine whether there are systematic patterns by for-profit status in groups of measures. For example, the measures constructed from the survey data can be grouped into the following categories: care management, health utilization, and satisfaction with care. We interpret consistent, statistically significant differences by for-profit status for the measures in a category as evidence that for-profit PACE enrollees receive better/worse quality for the types of care included in the category.
Through the findings examined in this study, there is evidence that the access to and quality of care received by for-profit enrollees in PACE plans in Pennsylvania is lower along several dimensions compared to the care received by their not-for-profit counterparts; however, the finding varies by the domains of access and quality, and the differences are often either inconsistent across measures or quite small in magnitude. In this chapter, we discuss the lessons learned from each analysis conducted in the study: enrollment prior to PACE, demographic and health characteristics, and measures of access to and quality of care that align with the care
Study of For-Profit PACE Mathematica Policy Research
49
delivered by PACE plans. We conclude with a discussion of how the findings can be extended outside of PACE plans in Pennsylvania to inform the future of for-profit PACE.
Lessons Learned: Enrollees Prior to PACE Enrollment and PACE Plan Locations
For-profit PACE plans were much more likely to enroll beneficiaries that were in a managed care plan prior to enrollment. The higher rate could reflect targeting of managed care enrollees by for-profit plans in an attempt to enroll lower cost and healthier enrollees on average. Alternatively, the finding could reflect that managed care enrollees were drawn to private for-profit plans because they best mirrored the care they received in their managed care plans. The study does not provide direct evidence to support either of these explanations. In addition, for-profit plans are located in areas with much higher managed care plan penetration among the elderly when compared to the not-for-profit PACE plan service areas and the state as a whole. The location decisions could have been influenced by the pool of eligible managed care enrollees available to be enrolled in the for-profit plans. Alternatively, managed care plans, including PACE plans could be attracted to these locations due to the composition of the local populations, which would lead to higher proportions of managed care enrollees living in the areas.
For-profit enrollees were slightly less likely than were not-for-profit enrollees to be dually eligible prior to enrollment (fully and fully or partially dual eligibles) with fewer average months dually eligible. Although the differences are not large, these for-profit enrollees could have been lower cost prior to enrollment because of a combination of greater financial supports and better health. Conversely, for-profit enrollees were more likely to have been originally eligible for Medicare because of a disability or ESRD, which suggests that they could have been slightly higher cost and less healthy on average prior to enrollment. For-profit enrollees have similar rates of chronic conditions compared with not-for-profit enrollees prior to enrollment in PACE.
In addition to differences at the enrollee level prior to enrollment, we note that for-profit plans are located in areas with populations that are quite different when compared to some of the not-for-profit plans in the state. The for-profit plans are located in areas with lower population density, poverty, minority populations, and lower educational attainment when compared to the not-for-profit plans excluded from the study (primarily those plans in Philadelphia and Pittsburgh). The location decisions made by PACE plans could include the relative socioeconomic status of eligible populations in the service areas surrounding the candidate sites. A wealthier population with greater community and family supports could yield enrollees that are lower in cost on average. Alternatively, the location decisions could be strictly due to a locating process by the common ownership across all sites or a preference of the for-profit plans for a less urban setting, as none of the for-profit plans are located in the urban centers in the state.
Lessons Learned: Enrollee Populations
Enrollees in the for-profit and not-for-profit PACE plans in Pennsylvania were similar according to most demographic characteristics. There were no differences in the average age, gender, ethnicity, marital status, and incomes by plan type. However, for-profit enrollees were more likely to be nonwhite and less likely to have at least graduated from high school. Measures of social support were also similar for enrollees in both plan types, with the exception of whether the enrollees were checked on in the last week or living with family or friends, which was less likely among for-profit enrollees. In addition to lower social supports, the lower rates of
Study of For-Profit PACE Mathematica Policy Research
50
reporting someone checking on the enrollee in the last week could also reflect lower quality care management by the for-profit PACE plans. The similarities between enrollees by plan type were borne out in the multivariate analysis, where few of the factors proved to have statistically significant associations with the measures of access and quality once demographic, health, and support factors were included in the regression models. Finally, for-profit enrollees were less likely to use a proxy respondent for the survey, which also turned out to have little association with responses related to access and quality.
Lessons Learned: Enrollee Health
Although the average values for self-reported health and changes in health were similar by plan type, for-profit enrollees had lower rates of 13 of 16 conditions examined. In contrast, for-profit enrollees were more likely to report issues related to mental health, although the observed differences for three of the four measures are not statistically significant. For-profit enrollees were also more likely to have behavioral problems (conditional on having a proxy respond to the survey). Because of the timing of the information, it is not clear whether differences in health were present at enrollment or developed over the course of enrollment in the PACE plans; the latter could indicate lower quality of care. Similar to the findings for the demographic characteristics, few of the measures of enrollee health proved to have strong relationships with access and quality once we controlled for demographic, health, and support variables in the multivariate analysis.
Lessons Learned: Access to and Quality of Care
Care Management. Although for-profit enrollees reported lower quality for most of the care management measures, many of the differences are not statistically significant. In addition, for-profit enrollees reported higher quality of care management for 3 of 12 measures; none of the differences are statistically significant. The two aspects of care management for which enrollees reported statistically significant and sizable differences (after controlling for enrollee demographic, health, and support factors) were higher rates of falls (including being injured in a fall) in the past month and reporting that it took a great deal of energy to get services. Even though many of the differences were not statistically significant, the fairly consistent pattern of lower quality reported by for-profit enrollees (9 of 12 measures) provides some evidence of an overall lower quality of care management received by for-profit enrollees.
Health Utilization. The findings suggest that for-profit enrollees were less likely to live in a group home, assisted living facility, or nursing home. It follows that they were more likely to live with family, with friends, or on their own in the community, which is a key objective of the PACE program. Conversely, it is feasible that some of these enrollees’ needs would be better served in a group home, assisted living facility, or nursing home. Regarding utilization of routine services, for-profit enrollees were less likely to report a flu shot, a pneumonia vaccination, and that they had their eyesight tested regularly. Utilization of routine services can indicate lower access to these services or lower care management by the PACE plans. The differences in rates of flu shot or having declined a flu shot and having hearing tested regularly are not statistically significant.
Satisfaction Measures. For-profit enrollees consistently reported lower satisfaction with services delivered by the PACE plans; however, the overall level of satisfaction was very high for both plan types (more than 90 percent of enrollees reported being satisfied or very satisfied
Study of For-Profit PACE Mathematica Policy Research
51
with nearly every type of care assessed), and the observed differences by plan type were quite small. One type of care stood out as being particularly low among for-profit enrollees: specialist care. For-profit enrollees reported lower rates of always being able to get a specialist appointment when needed and of satisfaction with specialist care; they also reported higher rates of not enough specialists available and not being able to see a specialist when needed. Although direct care by specialists is not under the control of PACE plans, coordinating all aspects of care is an important component of the program, including coordinating specialist visits for a population of enrollees who are likely to have a high level of need for specialist care on average. Conversely, for-profit enrollees were more likely to have visited the PACE center in the past month. Receipt of care at the PACE center is another important component of the PACE program’s model in coordinating a comprehensive care plan for enrollees. Thus, visiting the PACE center regularly is likely a key component of maximizing access to care and the quality of care delivered to PACE enrollees.
Extending Lessons Beyond Pennsylvania PACE
The findings on differences in access and quality presented in the study can be informative for future policy decisions regarding for-profit PACE, but the findings should be interpreted considering the limitations imposed by the take-up of the for-profit demonstration. At the least, the study uncovers the differences in access to and quality of care currently provided to for-profit and not-for-profit enrollees in similar settings. The comparisons of plans in Pennsylvania also provide new insight into how potential future for-profit plans could differ from existing not-for-profit PACE plans. However, to the degree that the for-profit plans are not representative of hypothetical future plans in Pennsylvania or in other states, the findings have somewhat limited application beyond the current set of PACE plans.
The key factors limiting the generalizability of the findings to future PACE plans in different states are that the study is conducted in a single state and the four for-profit plans are under common ownership. Both limitations are imposed because the only plans that took part in the for-profit demonstration were the four plans in Pennsylvania included in the study. First, to the extent that PACE plans in Pennsylvania are different from PACE plans in other states in how they deliver care to their enrollees (e.g., variation in state Medicaid policies could affect the level and quality of services provided by plans), the observed differences in the study might not be indicative of how differences will unfold in other states. Because we are comparing PACE plans to PACE plans, the state-to-state differences would need to differentially affect for-profit and not-for-profit plans to truly limit the applications of the findings to other states. Second, to the extent that the administration of the for-profit PACE plans by Senior LIFE differs from any hypothetical future for-profit plans in terms of the delivery of care, the findings in the study have limited extensions to future PACE plans. For example, if Senior LIFE delivers high quality care because of some feature of the organization that is not shared by hypothetical future for-profit plans, the findings in this study could overvalue the care provided by for-profit plans relative to not-for-profit plans.
An additional limitation to the generalizability of the results is introduced by the plan and sample selection process. We matched not-for-profit plans and enrollees to the for-profit plans and enrollees based on the population characteristics of the service areas, length of time in operation, and length of time enrolled in current PACE plans. The matching process was intended to equate the samples of PACE enrollees included in the study along these key dimensions to minimize confounding factors and isolate the differences in access and quality by
Study of For-Profit PACE Mathematica Policy Research
52
plan type. The matching was necessary because of differences in the for-profit plans and enrollees. However, the matching process excludes plans in more urban locations from the analysis, which have service area populations with higher proportions of minority and low-income populations. Plans with longer time in operation and enrollees with longer tenure in PACE were also excluded from the analysis. To the extent that the not-for-profit plans excluded from the study deliver care that differs by access and quality when compared to the other not-for-profit plans in the state, the findings could overstate or understate the differences in overall care provided by the for-profit plans.
The reliability of self-reported information by a frail elderly population and by proxy when the enrollee could not respond is another potential concern. If enrollees were unable to recall information that happened more than a week or month prior to the interview, such as whether they had been admitted to a hospital in the past year, the overall sample means could be higher or lower than they would be using accurate detailed information. However, such a limitation would only affect the observed differences by for-profit status if the recall limitation had a differential effect on for-profit versus not-for-profit enrollees, which is unlikely given the measured similarities between the demographics and health of the groups on average. In addition, there were few variables that required recall of an event over more than a month, and most of the variables were used as controls rather than key measures of access and quality. The benefit of using self-reported information is that we could obtain a much richer set of characteristics than are consistently available for all enrollees through other sources. The matter of differential responses by proxies versus respondents is mitigated by including an indicator for proxy response in the regression model specifications, which was typically not a statistically significant predictor of access and quality.
It could be argued that observed differences in access and quality and plan type are more likely indicative of the care provided by health care workers outside of the PACE center and not necessarily tied to services provided by PACE plans. This would likely be the case under a more traditional model of care; however, PACE plans provide a high degree of coordination of care and even direct services, primarily through the PACE center. In fact, many PACE enrollees receive the majority of their care at the PACE center. In addition, we chose measures of access and quality that best reflect the mix of services delivered by PACE plans.
The limited generalizability of the findings due to the inclusion of a single state is somewhat mitigated given that Pennsylvania is an ideal state for such an analysis. Pennsylvania has more PACE plans than any other state and more than 10 percent of PACE plans nationally. In addition, PACE is a national program with guidelines governing the operations and services delivered by plans. Greater consistency in guidance to plans and plan structure will help maximize the value of lessons learned from PACE plans in Pennsylvania for other states.
Although the experiences of for-profit enrollees in plans in a single state and under common ownership are limited in making definitive conclusions about all potential future for-profit plans, they do allow us to examine the current state of access and quality in the for-profit demonstration. Although conclusions drawn from this information should be couched in the appropriate caveats discussed above, PACE plans in Pennsylvania are not operating in a vacuum separated from all other PACE plans. The findings in this study provide valuable new information on differences in enrollees, and although the study is conducted in a specific context, it is a context that is similar to not-for-profit PACE plans in other states and can reasonably be assumed to resemble future for-profit plans. Therefore, the differences observed throughout the
Study of For-Profit PACE Mathematica Policy Research
53
study can be used to help inform the future of for-profit PACE with the appropriate caveats regarding potential limitations.
This page has been left blank for double-sided copying.
Study of For-Profit PACE Mathematica Policy Research
55
REFERENCES
Beauchamp, Jody, Valerie A. Cheh, Robert J. Schmitz, Peter Kemper, and John W. Hall. “The Effect of the Program of All-Inclusive Care for the Elderly (PACE) on Quality.” Princeton, NJ: Mathematica Policy Research, February 12, 2008.
Ferrier, G., and V. Valdmanis. “‘Cream-Skimming’ Psychiatric Patients,” 2006. Available at [http://waltoncollege.uark.edu/econ/news.asp?article=430]
Friesner, D. L., and R. Rosenman. “Do Hospitals Practice Cream Skimming?” Health Services Management Research, vol. 22, no. 1, 2009, pp. 39–49.
Henry J. Kaiser Family Foundation. “Medicaid’s Role for Low-Income Medicare Beneficiaries.” Menlo Park, CA: The Kaiser Commission on Medicaid Facts, May 2011.
Hillmer, M. P., W. P. Wodchis, S. S. Gill, G. M. Anderson, and P. A. Rochon. “Nursing Home Profit Status and Quality of Care: Is There Any Evidence of an Association?” Medical Care Research and Review, vol. 62, no. 2, 2005, pp. 139–166.
McWilliams, M. J., J. Hsu, and J. P. Newhouse. “New Risk-Adjustment System Was Associated With Reduced Favorable Selection In Medicare Advantage.” Health Affairs, vol. 31, no. 12, 2012, pp. 2630–2640.
The Medical Research Council Cognitive Function and Ageing Study (MRC-CFA). “Survey into Health Problems of Elderly People: a Comparison of Self-Report with Proxy Information.” International Journal of Epidemiology, vol. 29, no. 4, 2000, pp. 684–697.
Mukamel, D. B., H. Ladd, D. L. Weimer, W. D. Spector, and J. S. Zinn. “Is There Evidence of Cream Skimming Among Nursing Homes Following the Publication of the Nursing Home Compare Report Card?” The Gerontologist, vol. 49, no. 6, 2009, pp. 793–802.
Neumann, P. J., S. S. Araki, and E. M. Gutterman. “The Use of Proxy Respondents in Studies of Older Adults: Lessons, Challenges, and Opportunities.” Journal of the American Geriatrics Society, vol. 48, no. 12, 2000, pp. 1646–1654.
Ostbye, T., S. Tyas, I McDowell, and J. Koval. “Reported Activities of Daily Living: Agreement Between Elderly Subjects With and Without Dementia and Their Caregivers.” Age and Ageing, vol. 26, no. 2, 1997, pp. 99–106.
Perry, J. E., and R. C. Stone. “In the Business of Dying: Questioning the Commercialization of Hospice.” The Journal of Law, Medicine and Ethics, vol. 39, no. 2, 2011, pp. 224–234.
This page has been left blank for double-sided copying.
APPENDIX A
DETAILED PLAN AND SAMPLE SELECTION PROCESS
This page has been left blank for double-sided copying.
Appendix A Mathematica Policy Research
A-3
Plan Selection
Number of PACE plans included in the study
The first key consideration in selecting the PACE plans for inclusion in the study was to determine the number of for-profit and not-for-profit plans to include. All four for-profit PACE plans were selected to achieve the desired sample (407 enrollees targeted and 325 completed surveys) and maximize the representativeness of the for-profit plans. The target sample could have been achieved with only two sites (Senior LIFE Johnstown, 174, and Senior LIFE Washington, 272; Chapter II, Table II.4). However, the number of plans was also chosen to maximize the variation in operations at the plan level that could influence access to and quality of care and thus to maximize the degree to which these plans could be representative of hypothetical future for-profit plans (a key point, given the low number of plans in operation). In addition, even though all four plans were not required to meet the sample target in October 2012 when enrollment was determined, adding the additional plans helped guard against the possibility that a drop in enrollment before the completion of the survey would cause the sample to drop below the target. Therefore, all available for-profit plans were included in the study.29
The number of not-for-profit PACE plans was chosen to meet the target sample (406 enrollees targeted and 325 completed surveys), to ensure that the comparison plans had similar lengths of time in operation, and to allow for follow-up visits to complete surveys while keeping within the constraints of the project. Eleven not-for-profit PACE plans operate throughout the state, with enrollments ranging from 68 to 423 (Chapter II, Table II.4). Many plan combinations with varying numbers of plans listed in Chapter II, Table II.4 would yield a sample sufficiently large to meet the target sample of 406 while maintaining the objectives of selecting plans with similar length of time in operation. Because the sample enrollees were matched based on the length of time enrolled in PACE plans (discussed in detail in the Sample Selection section below), we aimed to have a total enrollment much greater than 406 to maximize the likelihood that we would have enough enrollees with similar length of enrollment to match to the for-profit enrollees. Additionally, we aimed to maintain the ability to conduct in-person follow-up visits to each of the sites in case surveys administered by phone did not meet the target number of completed surveys.
We discuss the target sample in more detail in the Survey of PACE Enrollees section of Chapter IV, Data.
Taking these factors into consideration, four not-for-profit plans were included in the study. The upper bound of possible total enrollment with four plans was 1,627 (Chapter II, Table II.4),
29 Although we proposed to use all for-profit plans, we considered whether the characteristics of each for-profit plan were sufficiently different from any of the not-for-profit sites to warrant exclusion from the study. The principal example of such a site characteristic is the length of time in operation. The for-profit sites are “newer” on average, and this could be correlated with lower quality in the early stages of operation but not with long-term quality once the sites have more experience. Similarly, the for-profit sites could be located in communities with far different population characteristics than any of the not-for-profit sites, which could lead to enrollee pools that are healthier or sicker on average. Ultimately, this was not necessary because none of the for-profit plans had outliers for any key factor, and we were able to identify not-for-profit plans similar to the four for-profit plans for each factor.
Appendix A Mathematica Policy Research
A-4
and there are more than four plans with lengths of time in operation that overlap with the time in operation of the for-profit plans, 17 to 59 months. In addition, selecting four sites allowed for one follow-up visit to each plan within the project constraints to interview enrollees that could not participate by phone if needed. Selecting fewer plans would have reduced the variation in plan-level characteristics and thus limit the degree to which the plans were representative of all not-for-profit plans and the generalizability of the findings. Furthermore, four not-for-profit sites creates a balance with the for-profit plans and the number of for-profit enrollees per plan.
Table A.1. Length of Time in Operation in Months for PACE Plans in Pennsylvania
Plan Name Start Date Months in Operation
(measured from October 1, 2012)
For-Profit . . Senior LIFE Washington 5/1/2011 17 Senior LIFE York 5/1/2011 17 Senior LIFE Altoona 5/1/2011 17 Senior LIFE Johnstown 11/1/2007 59
Not-for-Profit . . Albright LIFE 1/1/2012 9 New Courtland LIFE a 10/1/2010 24 LIFE St. Mary a 3/1/2010 31 Everyday LIFE a 2/1/2009 44 LIFE Beaver County a 11/1/2008 47 LIFE Lutheran a 9/1/2008 49 LIFE Geisinger a 6/1/2008 52 Mercy LIFE 10/1/2005 84 LIFE Pittsburgh 5/1/2005 89 Community LIFE 3/1/2004 103 LIFE UPenn 1/1/2002 129
Source: Start dates provided by CMS. a For-profit plans with length of time in operation that overlap with the range of time in operation for for-profit plans, 17–59 months.
Length of time in operation
As of October 1, 2012, three for-profit PACE plans were in operation for 17 months (Senior LIFE Washington, York, and Altoona) and one plan was in operation for 59 months (Senior LIFE Johnstown; Table A.1). Of the 11 not-for-profit plans, 6 plans have been in operation between 17 and 59 months, ranging from 24 months for New Courtland LIFE to 52 months for LIFE Geisinger (Table A.1). The remaining five not-for-profit plans are either quite new (Albright LIFE at 9 months) or have been in operation for several years longer than the oldest for-profit plan (Mercy LIFE, 84 months; LIFE Pittsburgh, 89 months; Community LIFE, 103 months; and LIFE UPenn, 129 months).
Based on length of time in operation alone, the six not-for-profit plans were all viable candidates for inclusion in the study. The objective for this criterion was to identify plans that
Appendix A Mathematica Policy Research
A-5
had been operating for similar lengths of time, and therefore, had a similar opportunity to implement their processes and establish a certain quality of care. In contrast, newer plans such as Albright LIFE, might still have been going through the “growing pains” of establishing a new plan, which could be reflected in the quality of care but not necessarily reflective of their status as a not-for-profit plan. Similarly, the four plans with longer lengths of time in operation could have higher quality of care due to their experience in running the plans over seven or more years, but not necessarily due to their not-for-profit status.
Another potential obstacle in choosing the newest and oldest not-for-profit plans is the number of sites at each plan. When selecting sample members from these plans, we could not identify which site within the plan they typically visit for care. The selection of these plans would require that the survey specialists travel to multiple sites for each plan to conduct any necessary in-person follow-up visits. Of these five plans, four have three or more sites. In contrast, five of the six plans with similar lengths of time in operation have one site, with the sixth having two sites. This is similar to the number of sites for the for-profit plans: three plans have a single site, whereas Senior LIFE Washington operates two sites.
Urban/rural status
The for-profit PACE plans have sites located in areas that are not near the major urban centers in the state (primarily Philadelphia and Pittsburgh) but also not considered rural areas. For example, according to the urban/rural continuum codes developed in June 2003 by the Office of Management and Budget (OMB), three of the four plans are located in counties that are not the most urban settings but that are still classified as metropolitan (Senior LIFE York, Altoona, and Johnstown have values of two or three; Table A.2).30,31
Five not-for-profit PACE plans have urban/rural classifications and population densities similar to those of the for-profit plans (Table A.2). The population densities for these five plans range from 166.1 to 591.4 people per square mile compared to 109.7 to 460.0 people per square mile for the for-profit plans. These plans have urban/rural classifications ranging from one to four compared to a range of one to three for the for-profit sites. In contrast, three of the six remaining not-for-profit sites are located in Philadelphia, with densely population service areas between 6,682.8 and 8,828.7 people per square mile (New Courtland LIFE, Mercy LIFE, and LIFE UPenn) and another two sites are located in Pittsburgh (LIFE in Pittsburgh and Community LIFE). The final plan, LIFE St. Mary, has a relatively high population density (1,977.3 people
Similarly, the service areas for the four plans have relatively low population densities, below 200 people per square mile for three of the plans, when compared to thousands of people per square mile in urban settings.
30 Urban/rural status is defined for each plan according to the June 2003 OMB urban/rural continuum codes for
the counties in which they are located. For plans that have more than one site, the urban/rural value is an average of the values for those sites. The codes range from 1 through 9, with lower values denoting more urban counties. Counties with values 1 through 3 are typically considered metropolitan, whereas counties with values above 3 are considered nonmetropolitan.
31 The fourth plan, Senior LIFE Washington, is located in a county with the highest urban classification because of the county’s proximity to Pittsburgh. However, the plan’s sites are located far from the city in a service area with a relatively low population density of 177.4 people per square mile.
Appendix A Mathematica Policy Research
A-6
per square mile); however, unlike the other highly populated service areas, the site is not located in a major urban center (it is in Trevose, PA).
Table A.2. Urban/Rural Status of For-Profit and Not-for-Profit PACE Plans
Plan Name Urban/Rural
Continuum Code a Population Density
(people per square mile)b
For-Profit . . Senior LIFE Washington 1 177.4 Senior LIFE York 2 460.0 Senior LIFE Altoona 3 109.7 Senior LIFE Johnstown 3 131.3
Not-for-Profit . . Albright LIFE c 2.7 178.6 New Courtland LIFE 1 7,636.7 LIFE St. Mary 1 1,977.3 Everyday LIFE 2 591.4 LIFE Beaver County c 1 288.9 LIFE Lutheran c 4 169.4 LIFE Geisinger c 3 166.1 Mercy LIFE 1 6,682.8 LIFE Pittsburgh 1 1,221.8 Community LIFE 1 1,166.5 LIFE UPenn 1 8,828.7
Sources: June 2003 Office of Management and Budget (OMB) urban/rural continuum codes; U.S. Census Bureau 2006–2010 American Community Survey (ACS).
a Urban/rural status is defined for each plan according to OMB urban/rural continuum codes for the counties in which they are located. For plans that have more than one site, the urban/rural value is an average of the values for those sites. The codes range from 1 through 9, with lower values denoting more urban counties. Counties with values 1 through 3 are typically considered metropolitan, whereas counties with values above 3 are considered nonmetropolitan. b Population density is measured for each plan's service area, defined as the population divided by total area in square miles from the 2006–2010 ACS. c Not-for-profit plans with urban/rural codes and population density similar to the for-profit plans.
Appendix A Mathematica Policy Research
A-7
Population characteristics
In general, the not-for-profit plan service areas have similar overall population characteristics when compared to the for-profit sites (populations are restricted to those age 65 years and older).32 Four not-for-profit plans stand out in this regard , having no population characteristics more than one standard deviation from the corresponding characteristics of the for-profit plans (Albright LIFE, LIFE Beaver County, LIFE Lutheran, and LIFE Geisinger – Table A.3). Four other not-for-profit plans have two or fewer population characteristics that differ from the for-profit plans (LIFE St. Mary, Everyday LIFE, LIFE Pittsburgh, and Community LIFE). The service area for LIFE St. Mary has higher housing values on average and higher educational attainment when compared to the for-profit service areas, whereas the service area for Everyday LIFE has a higher proportion of the population that is Hispanic and higher housing values.33
32 To assess the similarities of the population characteristics of not-for-profit plans compared to the for-profit
plans, we first combined the service areas of the four for-profit plans into a single region, which we divided into subregions according the U.S. Census Bureau’s census tract boundaries (421 census tracts in the aggregation of the service areas). We then calculated the mean and standard deviation of the 421 census tracts and compared the population characteristics for each not-for-profit service area to determine whether they were within one standard deviation of the mean for the for-profit plans. The population characteristics of each not-for-profit service area were calculated by summing the population characteristics of the census tracts that overlap with the service area. Figure E.1 in Appendix E shows the service area boundaries for all PACE plans and how they overlap with census tract boundaries. We obtained population characteristics for the census tracts from the U.S. Census Bureau’s 2006–2010 ACS.
The service areas for the two plans located in Pittsburgh (LIFE Pittsburgh and Community LIFE) have higher educational attainment when compared to the population living in the for-profit service areas. The final three not-for-profit plans (New Courtland LIFE, Mercy LIFE, and LIFE UPenn), all located in Philadelphia, have higher rates of elderly residents living in poverty, larger elderly minority populations, and higher rates of elderly residents without access to a vehicle.
33 Educational attainment is the only population characteristic that is not reported for the elderly population (not available by age in the ACS). Therefore, these figures represent the educational attainment of the population as a whole (25 years of age and over) and not necessarily the educational attainment of the elderly population.
A-8
Table A.3. Population Characteristics of For-Profit and Not-for-Profit PACE Plan Service Areas
Plan ID Total
Population Population Age 65+
Percentage Age 65+
Percentage Age 65+ Living in Poverty
Percentage Age 65+
Non-White
Percentage Age 65+ Hispanic
Percentage with at
Most a HS Education
Percentage Age 65+ without
Access to a Vehicle
Percentage Age 60+
Receiving Food
Stamps/ SNAP
Median Housing Value
Median Income in HHs with Age 65+ Member
For-Profit . . . . . . . . . . . Senior LIFE Washington
LIFE St. Mary 483,926 70,165 14.5* 5.6* 5.1* 1.2* 41.9 10.4* 3.7* 311,285 43,733* Everyday LIFE 727,120 109,459 15.1* 6.8* 4.2* 3.3 49.0* 14.2* 4.8* 207,571 33,964* LIFE Beaver County a
LIFE Lutheran a 189,882 29,155 15.4* 6.0* 2.0* 0.7* 59.9* 9.3* 3.3* 170,186* 32,089* LIFE Geisinger a 743,969 130,824 17.6* 9.1* 1.2* 0.6* 58.2* 15.9* 5.4* 121,654* 27,869* Mercy LIFE 835,919 99,103 11.9* 15.7 33.0 5.4 54.5* 38.3 14.6* 160,447* 28,901* LIFE Pittsburgh 765,792 121,566 15.9* 9.2* 6.7* 0.5* 39.2 21.6* 5.6* 127,412* 32,479* Community LIFE 863,731 151,307 17.5* 8.1* 9.6* 0.5* 42.6 19.3* 5.9* 113,933* 30,987* LIFE UPenn 601,274 73,162 12.2* 16.3 55.5 1.4* 47.8* 41.2 13.0* 168,945* 29,336*
Source: U.S. Census Bureau 2006–2010 ACS.
HS = high school; SNAP = Supplemental Nutrition Assistance Program; HHs = households. a Not-for-profit plans with all population characteristics within one standard deviation of the for-profit mean values.
* Denotes that the not-for-profit plan characteristic is within one standard deviation of the for-profit mean. The for-profit means are the mean population characteristics of all census tracts within the for-profit service areas.
Appendix A Mathematica Policy Research
A-9
Sample Selection
Length of enrollment at for-profit plans
The first step in the sample process, prior to drawing the random sample of for-profit PACE enrollees, was to remove enrollees with six or fewer months in their plan. The rationale for removing these relatively new enrollees is that they are less likely to have the experiences receiving care in PACE plans that are necessary to assess the access to and quality of care.34 Once these enrollees were removed from consideration, there were 458 for-profit candidate sample members with more than six months in their plan—86 (18.8%) had 7 to 12 months, 302 (65.9%) had 13 to 36 months, and 70 (15.3%) had 37 to 59 months (Table A.4).35
Table A.4. Number of Enrollees by Length of Time Enrolled in For-Profit PACE Plans
Length of Time Enrolled in PACE Plans
Plan Name 0–3
Months 4–6
Months 7–12
Months 13–36 Months
37–59 Months Total
Senior LIFE Washington 31 24 37 180 0 272 Senior LIFE York 5 16 17 33 0 71 Senior LIFE Altoona 12 13 17 26 0 68 Senior LIFE Johnstown 12 14 15 63 70 174
Total 60 67 86 302 70 585
Sources: Enrollment was obtained from the MARx database. The number of sites and start dates were provided by CMS.
A random sample of enrollees from each of the enrollment tenure groups should maintain the general properties of the for-profit population among those with more than six months enrolled in a plan. In other words, the proportions of the sample from each tenure group are expected to match the proportions in the population. In fact, Table A.5 shows that the distribution of length of time enrolled for the for-profit sample matches the distribution in the population. The breakdown of length of time enrolled for the sample was 80 (19.7%) with 7 to 12 months, 267 (65.6%) with 13 to 36 months, and 60 (14.7%) with 37 to 59 months. Furthermore, the breakdown was maintained for the final survey respondents: 69 (20.7%) had 7 to 12 months, 215 (64.6%) had 13 to 36 months, and 49 (14.7%) had 37 to 59 months. We discuss the response to the survey in greater detail in Chapter IV, Data.
34 There were no other major systematic differences between the for-profit and not-for-profit enrollees that
would lead us to take a targeted sample of for-profit enrollees. An example of such a systematic difference would be if the comparison group was composed of fee-for-service (FFS) Medicare beneficiaries that could be systematically different from PACE enrollees. Because both groups are comprised of PACE enrollees, such a targeted sampling of the for-profit enrollees is not required. Other differences between the two groups, such as age, gender, and basic health status, will be accounted for in the multivariate analysis.
35 The groups were defined to approximate short-, medium-, and long-term enrollment (six months, six months to three years, and more than three years) and to facilitate a matched sample in the for-profit plans.
Appendix A Mathematica Policy Research
A-10
Table A.5. Sample Members and Respondents by Length of Time Enrolled in For-Profit PACE Plans
Length of Time Enrolled in PACE Plans
Group of Enrollees 7–12
Months 13–36 Months
37–59 Months Total
All For-Profit PACE Enrollees . . . . Number of enrollees 86 302 70 458 Percentage of enrollees 18.8 65.9 15.3 .
For-Profit Enrollees in the Final Sample . . . . Number of enrollees 80 267 60 407 Percentage of enrollees 19.7 65.6 14.7 .
For-Profit Enrollees Survey Respondents . . . . Number of enrollees 69 215 49 333 Percentage of enrollees 20.7 64.6 14.7 .
Source: Enrollment was obtained from the MARx database. The number of sites and start dates were provided by CMS.
Length of enrollment at not-for-profit plans
Before drawing the sample of not-for-profit enrollees, we used the enrollee distributions of time enrolled to select the final not-for-profit plan between LIFE St. Mary and Everyday LIFE. A combination of the other three not-for-profit plans and LIFE St. Mary yielded a not-for-profit sample that matched the for-profit sample by length of enrollment (Table A.6). The not-for-profit sample including LIFE St. Mary provided 101 enrollees with 7 to 12 months in their PACE plan (target: 76), 291 with 13 to 36 months (target: 269) and 147 with 37 to 59 months (target: 62). In contrast, there were not enough enrollees in Everyday LIFE to match the target for-profit sample. Including Everyday LIFE instead of LIFE St. Mary did not provide enough enrollees from 13 to 36 months to match the for-profit target—244 enrollees for a target of 269. To provide a set of enrollees sufficient to match the for-profit sample by enrollment tenure, we included LIFE St. Mary as the fourth not-for-profit PACE plan.
We drew random samples of not-for-profit enrollees from each of the three length of enrollment strata presented in Table A.6 to match the totals by strata for the for-profit sample. By design, the not-for-profit sample was nearly identical to the for-profit sample by length of enrollment (Chapter III, Table III.2).36
36 The target total for the not-for-profit sample was 406, one enrollee less than the for-profit sample. We
sampled one fewer enrollee in the 13- to 36-month stratum because it contains more than twice as many enrollees as each of the other strata. The uneven targets were the result of the final total sample target being 813. We discuss the methods for setting the sample target in detail in Chapter IV, Data.
Furthermore, the distribution of enrollment remained similar for the for-profit and not-for-profit final survey respondents. In addition, the average length of time enrolled for the for-profit respondents was 21.0 months compared to 23.5 months for the not-for-profit respondents (figures not presented in a table); prior to matching by length
Appendix A Mathematica Policy Research
A-11
of enrollment, the averages for the overall PACE population were 17.4 and 28.7 months, respectively.
Table A.6. Number of Enrollees by Length of Time Enrolled in For-Profit and Not-for-Profit PACE Plans
Length of Time Enrolled in PACE Plans
Group/Plan Name 7–12
Months 13–36 Months
37–59 Months Total
For-Profit Sample Totals 80 267 60 407
Not-for-Profit Plans . . . . LIFE St. Mary 25 83 0 144 Everyday LIFE 11 36 2 68 LIFE Beaver County 48 93 81 271 LIFE Lutheran 8 36 11 72 LIFE Geisinger 20 79 55 183
Total with LIFE St. Mary 101 291 147 539
Total with Everyday LIFE 87 244a 149 480
Source: Enrollment was obtained from the MARx database. The number of sites and start dates were provided by CMS.
a 244 not-for-profit enrollees with a length of enrollment from 13 to 36 months are not enough to match the 267 for-profit enrollees in this group.
This page has been left blank for double-sided copying.
APPENDIX B
ADDITIONAL COMPARISONS OF FOR-PROFIT AND NOT-FOR-PROFIT
PACE PLAN SERVICE AREAS
This page has been left blank for double-sided copying.
Appendix B Mathematica Policy Research
B-3
We compare the for-profit and not-for-profit plans by two additional characteristics of their service areas, percentages of the 65 years and older populations that were (1) dually eligible for Medicaid and Medicare (full or partial) in 2011 and (2) enrolled in managed care plans in 2011. These are additional population factors that are likely to be positively correlated with PACE enrollment, given that more than 90 percent of PACE enrollees are dually eligible (measured in 2011; Table V.4) and high managed care plan penetration in an area could indicate a more developed market for managed care plans and a greater willingness of beneficiaries to choose a managed care plan over fee-for-service. In the for-profit plan service areas, 12.6 to 19.9 percent of the population over age 65 are dually eligible for Medicaid (the percentage for the state is 17.9, not presented in Table B.1). This range is similar to the four not-for-profit plans included in the study, in which dual eligibility ranges from 11.8 to 21.3 percent. The range is also similar to the percentages for the other not-for-profit plans, with the exception of three plans located in Philadelphia (New Courtland LIFE, Mercy LIFE, and LIFE UPenn), which have service areas with higher percentages of dually eligible elderly populations, ranging from 32.8 to 33.2 percent.
Table B.1. Dual Eligibility and Managed Care Penetration in For-Profit and Not-for-Profit PACE Plan Service Areas (percentage)
Plan Name
Percentage of Age 65+ Population Dually Eligible for Medicaid and
Medicare Percentage of Age 65+ Population Enrolled in Managed Care Plans
For-Profit . . Senior LIFE Washington 19.9 58.7 Senior LIFE York 12.6 31.5 Senior LIFE Altoona 19.6 51.1 Senior LIFE Johnstown 18.6 60.6
Not-for-Profit . . Albright LIFE 15.0 30.4 New Courtland LIFE 32.8 43.8 LIFE St. Mary a 11.8 33.0 Everyday LIFE 15.7 26.3 LIFE Beaver County a 17.3 60.8 LIFE Lutheran a 13.7 21.4 LIFE Geisinger a 21.3 27.2 Mercy LIFE 32.9 41.2 LIFE Pittsburgh 16.6 61.2 Community LIFE 16.1 61.0 LIFE UPenn 33.2 38.7
Sources: Dual eligibility and managed care status are obtained from the 2011 MBSF. PACE plan service areas (list of zip codes comprising the areas) were obtained from CMS.
a The final four not-for-profit PACE plans included in the study.
In three of the four for-profit plan service areas, roughly 50 to 60 percent of the elderly population were enrolled in managed care plans in 2011. This is substantially higher than the elderly population in managed care statewide (38.6 percent, not presented in Table B.1). The final for-profit plan is located in a service area where 31.5 percent of the population was enrolled in a managed care plan. In three of the four not-for-profit plan service areas, roughly 20 to 30
Appendix B Mathematica Policy Research
B-4
percent of the elderly population were enrolled in managed care plans. However, the final not-for-profit plan is located in a service area where more than 60 percent of the elderly population was enrolled in a managed care plan. The differences in managed care penetration between the for-profit and not-for-profit plans are also reflected in the differences in PACE enrollees prior to enrollment (Chapter V, Table V.1).
Figure B.1 shows the locations of the final eight PACE plans (10 sites in total) included in the study overlaid against the population density of the local area (measured as the number of population age 65 years and older per by square mile at the census tract level). Philadelphia and Pittsburgh are clearly denoted in the east and west of the state, respectively, by the cluster of high population density tracts. The PACE plans included in the study are located in areas with sizable elderly population density, but outside of major urban centers and areas with the highest population density. There are for-profit and not-for-profit plans located nearby Pittsburgh, but only one not-for-profit PACE plan located near Philadelphia.
Figure B.1. Location of Final PACE Plans Included in the Study and Population Density
Sources: PACE locations obtained from CMS. Census tract borders obtained from the U.S. Census Bureau 2010 census tract shapefiles. Population density obtained from the U.S. Census Bureau 2006–2010 ACS summary files. Map generated using ArcMap (Environmental Systems Resource Institute [ESRI]. ArcMap 10.0. Redlands, CA: ESRI, 2011.).
APPENDIX C
WEIGHTS AND VARIANCE ESTIMATION
This page has been left blank for double-sided copying.
Appendix C Mathematica Policy Research
C-3
Calculation of Weights and Variance Estimation
Each observation in the data set has an associated analysis weight that is applied when producing estimates or performing any other type of data analysis. These weights reflect the probability of each enrollee being selected for the survey as well as adjustments for known eligibility status, nonresponse, and overall population totals. As such, use of the analysis weights allows for estimates to be produced that reflect the population distribution of for-profit and not-for-profit PACE enrollees. Any analysis that does not incorporate the analysis weights is subject to bias and may produce misleading results. More detail on the calculation of the analysis weights can be found below.
We assigned individual enrollees a design weight based their probability of selection within one of six possible strata:
• 1 = For-profit, 7 to 12 months enrolled in the current PACE plan
• 2 = For-profit, 13 to 36 months enrolled in the current PACE plan
• 3 = For-profit, 37 to 59 months enrolled in the current PACE plan
• 4 = Not-for-profit, 7 to 12 months enrolled in the current PACE plan
• 5 = Not-for-profit, 13 to 36 months enrolled in the current PACE plan
• 6 = Not-for-profit, 37 to 59 months enrolled in the current PACE plan
As mentioned previously, enrollees with fewer than 7 months or more than 59 months of tenure in the plan were excluded from the sample. The primary sample was drawn in October 2012, with 813 enrollees selected from a total of 2,362 enrollees. Two supplemental samples were then drawn in January and February 2013 to account for the loss in sample size due to selected enrollees who were confirmed as deceased. Twenty-five additional enrollees were sampled in January and 5 more in February from the remaining sample pools in each strata for a total of 843 enrollees released into the sample. In order to account for multiple rounds of sample selection, the design weights were calculated using the following formula:
, , ,1/[1 ((1 )*(1 )*(1 ))]i O i J i F iD π π π= − − − − ,
where iD is the design weight for sample unit i, and ,O iπ , ,J iπ , ,F iπ are the probabilities of selection in October, January, and February, respectively, for sample unit i.
Among the 843 enrollees sampled, 659 were eligible survey respondents, 60 were eligible nonrespondents, 43 were ineligible, and 81 were nonrespondents with unknown eligibility. We adjusted the design weight for unknown eligibility using a propensity model predicting known eligibility status using enrollees’ age and gender.37
37 We used a stepwise logistic regression model to determine the significant predictors of eligibility
determination. The pool of predictor variables were plan tenure, age, for-profit versus not-for-profit, race, and gender. For the eligibility determination model, only age and gender were found to be significant predictors.
We applied the inverse of the resulting probabilities to the design weights to adjust for those with undetermined eligibility. After
Appendix C Mathematica Policy Research
C-4
removing the undetermined and ineligible sample members, we then ran a response propensity model to determine predictors associated with response among known eligible enrollees, but no significant effects were found. Therefore, the weights for respondents were adjusted by a constant factor of about 1.09 to account for nonresponse. Finally, we applied a post-stratification ratio adjustment to the weights to bring the totals in line with the estimated eligible population. This adjustment was calculated by the following:
1, _1
1 1
_ ( )*( ) /E
Riii i R ADJE I i
i ii i
DPOST ADJ D D
D D=
=
= =
=+
∑∑ ∑∑ ∑
,
where iD∑ is the sum of design weights among the entire selected sample, 1
Eii
D=∑ is the sum
of design weights for eligible sample members, 1
Iii
D=∑ is the sum of design weights for
ineligible sample members, and , _1
Ri R ADJi
D=∑ is the sum of the eligibility-determined and
nonresponse-adjusted weights for respondents. The second term in this equation represents the eligibility rate among those with known eligibility status. This post-stratification adjustment was calculated separately for the for-profit and not-for-profit sample members. The final analysis weights were produced by multiplying the eligibility-determined and nonresponse-adjusted design weights by the post-stratification adjustment. The sum of the final weight is our best estimate of the eligible population of enrollees in the eight plans included in the study: 1,769.78 for the four not-for-profit plans and 425.35 for the four for-profit plans.
Weights and Variance Estimation in Comparisons of Enrollees
When generating estimates for comparisons in the descriptive and multivariate analyses, the six-category STRATA variable and the final weights were used for proper variance estimation based on the sample design. We also included an FPC factor when producing estimates to take advantage of the fact that a substantial proportion of the target population was in the sample, thereby reducing the variance of any estimates. Because of the high sampling and response rates in the for-profit strata, more than 75 percent of the for-profit study population is represented by the survey respondents. Incorporating the FPC for these strata reduces the variance of their estimates commensurately. The FPC values were calculated separately within each of the six STRATA groups and are presented below (Table C.1).
Table C.1. Finite Population Correction (FPC) Values by Strata
Source: Calculated by Mathematica using results from the PACE enrollee survey. Strata were assigned using length of enrollment, which was calculated using information obtained in MARx and EDB.
APPENDIX D
ADDITIONAL DETAILS ON ADMINISTRATION OF THE SURVEY OF PACE
ENROLLEES
This page has been left blank for double-sided copying.
Appendix D Mathematica Policy Research
D-3
SURVEY ADMINISTRATION
When interviewers learned that sample members were unable to complete the interview themselves because of a physical or mental condition such as dementia, a proxy respondent was designated to complete the interview on that person’s behalf. Eligible proxies included individuals familiar with the health care experiences of the sample member. They were often the spouses, children, or other relatives and friends of the sample member. Next-of-kin were not surveyed for those who died, and therefore decedents were not included in the survey.
We applied a multistage contact strategy for the survey. A few days before the start of the telephone interviews, we mailed advance letters on CMS letterhead and information brochures to sample members with confirmed addresses to notify them about the study and survey and to encourage participation (see Figures D.1 through D.4 for the mailing materials). The cover letter explained the purpose and importance of the study, emphasized that participation was voluntary, and provided assurance that responses were confidential. These materials also referred to a toll-free number established for the study so that members could call with questions. Because the response rate for the not-for-profit group was slightly lagging behind the for-profit group, we sent a reminder mailing to the nonrespondents in the not-for-profit group in February. At the end of this month, flyers were distributed to all PACE plans to distribute to sample members at their visit to the PACE sites to improve the response rate. We conducted locating efforts to obtain correct address and telephone numbers prior to the advance mailing and throughout the field period.
Locating, Training, and Quality Assurance
Although we used the MARx database to select the enrollee samples, the addresses in the MARx database are typically where the explanation of benefits and reimbursements are sent and might not correspond to the actual residence of the sample member. Moreover, MARx data do not include telephone numbers. After selection of the sample, the sample was sent to LexisNexis® Accurint® (Accurint) to obtain current telephone and address information for the initial mailing. On the advance mailing envelopes, we asked for ADDRESS SERVICE REQUESTED to obtain up-to-date addresses for those who may have moved. During the field period, letters returned with no additional postal information and cases identified with out-of-date telephone numbers were sent directly to our internal locating staff, who conducted an expanded search with Accurint and other online databases. We also received updated contact information for the sample members and their caregivers from the PACE plans.
Prior to the survey, 23 interviewers and supervisors were trained to administer the survey instrument. All of the interviewers and supervisors had prior experience conducting telephone interviews. Trainers explained the background and purpose of the study, reviewed the questionnaire, provided instructions for asking each question, and discussed methods for contacting respondents. To gain respondent cooperation, interviewers were trained on how to address common questions and to provide sample members the PACE plan contact information when they were unsure of the legitimacy of the survey. In addition, we trained the interviewers on the challenges of interviewing a frail elderly population. The training also provided extensive guidance on how to recognize situations in which the sample member was cognitively unable to participate meaningfully in the survey, identify the appropriate proxy respondent, and gain the proxy respondent’s cooperation. The training was interactive and required interviewers to
Appendix D Mathematica Policy Research
D-4
practice delivering the questions, responding to sample member questions, and selecting the correct response option.
All telephone interviews were conducted using Mathematica’s computer-assisted telephone interviewing (CATI) system. The survey management team used the reports generated from the system to monitor survey completion progress and interviewer productivity. Both qualitative and quantitative indicators of interviewer performance were used to monitor data quality. Quantitative indicators, such as productivity and refusal rates, were assessed from reports generated by the CATI system. During the first week of the project, at least one completed interview was monitored for each telephone interviewer using Mathematica’s central monitoring system. Overall, approximately 10 percent of all interviews were monitored. The in-person interviews were conducted by the survey director of the 2006 PACE survey for the 2008 not-for-profit PACE evaluation with a hard copy of the survey for this study.
Appendix D Mathematica Policy Research
D-5
Figure D.1 Advance Letter
DEPARTMENT OF HEALTH & HUMAN SERVICES Centers for Medicare & Medicaid Services 7500 Security Boulevard, Mail Stop S2-24-25 Balitmore, Maryland 21244-1850
CMS Privacy Office
DATE
FIRSTNAME MIDDLENAME LASTNAME ADDRESS 1 ADDRESS 2 CITY, STATE, ZIPCODE
Dear FIRSTNAME MIDDLENAME LASTNAME:
I am writing to ask for your help with an important new study, The Evaluation of a Program of All-Inclusive Care for the Eldery (PACE), sponsored by the U.S. Department of Health and Human Services, Centers for Medicare & Medicaid Services (CMS). The PACE program you are enrolled with is called PROGRAM_NAME. The study will help us to better understand how the medical and other services provided by the PACE program, PROGRAM_NAME, are helping you. Your name was randomly selected from a list of people receiving healthcare services through a PACE program in Pennsylvania.
CMS has hired Mathematica Policy Research, a private national research firm, to conduct this evaluation. Mathematica will call you to ask you to participated in a short telephone survey. Your participation is very important. Your responses will help us undertand how the PACE program works and how it might be improved.
We assure you that all information collected through the survey will be completely confidential and will not be reported in any way that identifies you personally.
Your participation in the survey will not affect your eligibility for the healthcare services you currently receive, either now or in the future. We are collecting this information for research purposes only.
If you are unable to respond because of a health problem, a family member or friend who is familiar with your condition and use of healthcare services can respond on your behalf.
Please help us by responding to the interview when the telephone interviewer calls. The enclosed brochure provides more information about the survey. If you have any questions, or wish to set up a time for the telephone interview, please contact the study team at Mathematica by telephone (toll-free) at 1-855-398-3305.Thank you for your help.
Sincerely,
Walter Stone CMS Privacy Officer
Appendix D Mathematica Policy Research
D-6
Figure D.2 Study Brochure
• Am I required by the government to participate?
Your participation is entirely voluntary. You may refuse to answer any question during the interview. However, your participation is necessary to make your voice heard about the PACE program. Your responses represent others like you and you cannot be replaced. Your participation will not affect any PACE services you may receive now or apply for in the future. Nor will it affect your eligibility for any other benefits or services
• Why should I participate?
The information you provide will help the Centers for Medicare and Medicaid Services of the U.S. Department of Health and Human Services and the Congress make decisions about medical and long-term care services for persons age 55 and over. Your experiences with PACE services are vital to understanding how the program works and how it might be improved.
For further information or to schedule an interview, please call toll-free:
Mathematica Policy Research
1-855-398-3305
Evaluation of the PACE Program
According to the Paperwork Reduction Act of 1995, no persons are required to respond to a collection of information unless it displays a valid OMB control number. The valid OMB control number for this information collection is 0938-1180. The time required to complete this information collection is estimated to average 33 minutes per response, including the time to review instructions, search existing data resources, gather the data needed, and complete and review the information collection. If you have any comments concerning the accuracy of the time estimate(s) or suggestions for improving this form, please write to: CMS, 7500 Security Boulevard, Attn: PRA Reports Clearance Officer, Baltimore, Maryland 21244-1850
FACTS ABOUT THE
Evaluation of the PACE Program
Sponsored by the
Centers for Medicare & Medicaid Services
U.S. Department of Health and Human Services
Conducted by Mathematical Policy Research
• Why is this survey being done?
The Evaluation of the PACE Program will collect information from persons who are using medical and other services provided by PACE. The Centers for Medicare & Medicaid Services sponsor this survey to broaden their understanding of how frail and disabled persons get along day to day and how the PACE healthcare services are helping them.
• Why was I chosen for this study?
You were selected for this study if you enrolled in PACE. The information you provide is essential to obtain an accurate picture of people’s experiences using PACE and other healthcare services.
• If I never used the services at the PACE Program, should I respond to this survey?
Yes. Even if you never received PACE medical services we need your information in order to better understand how the PACE Program is working.
• Will my answers be confidential?
Yes, absolutely. The Mathematica Policy Research representative who will interview you has signed a confidentiality statement that prohibits him or her from disclosing survey information to anyone other than authorized Mathematica staff. No information that could identify you or your family will be released from outside the Mathematica project staff. The answers from all respondents will be summarized in such a way that no individual can be identified.
• How long will the interview take?
The interview will probably take about half an hour.
If you are unable to respond because of a health problem, a family or friend who is familiar with your care can respond on your behalf.
Remember, we can schedule the interview any time that is convenient for you.
• What kind of questions will I be asked?
The topics include: • Use of healthcare services • Health problems and
functioning • Use of PACE caregivers • Satisfaction • Individual characteristics
Appendix D Mathematica Policy Research
An Affirmative Action/Equal Opportunity Employer D-7
Thank you for all your efforts to support the Evaluation of the PACE program. I have enclosed flyers for the PACE survey sample members. As mentioned in the email, we request that you place a flyer in the file of each of the sample members and hand it to the sample member upon their visit to the center. The list of sample members was attached to the email.
We greatly appreciate your assistance to ensure a successful study. If you have any questions, please do not hesitate to contact me at [email protected] or at 609-945-3340.
DEPARTMENT OF HEALTH & HUMAN SERVICES Centers for Medicare & Medicaid Services 7500 Security Boulevard, Mail Stop S2-24-25 Balitmore, Maryland 21244-1850
CMS Privacy Office
[DATE] NAME ADDRESS 1 ADDRESS 2 CITY, STATE, ZIP
Dear NAME:
You may have recently received a letter and a telephone call asking for your help with an important new study, The Evaluation of a Program of All-Inclusive Care for the Elderly (PACE), sponsored by the U.S. Department of Health and Human Services, Centers for Medicare & Medicaid Services (CMS). The PACE program you are enrolled with is called [PROGRAM NAME]. We are asking you to participate in a telephone survey about your experiences with [PROGRAM NAME]. Mathematica Policy Research is conducting this survey for the study. The information you provide will help us to better understand how PACE programs like [PROGRAM NAME] work and how they might be improved.
We assure you that all information collected through the survey will be completely confidential and will not be reported in any way that identifies you personally.
Your participation in the survey will not affect your eligibility for the healthcare services you currently receive, either now or in the future. We are collecting this information for research purposes only.
If you are unable to respond because of a health problem, a family member or friend who is familiar with your condition and use of healthcare services can respond on your behalf.
Please help us by responding to the interview when the telephone interviewer calls. The enclosed brochure provides more information about the survey. If you have any questions, or wish to set up a time of the telephone interview, please contact the study team at Mathematica by telephone (toll-free) at 1-855-398-3305.
Thank you for your help.
Sincerely,
Walter Stone CMS Privacy Officer
APPENDIX E
CONSTRUCTION OF KEY VARIABLES
This page has been left blank for double-sided copying.
Appendix E Mathematica Policy Research
E-3
Construction of Key Measures of Access and Quality from the Survey of PACE Enrollees
Table E.1. Definition of Measures of Access and Quality from the Survey of PACE Enrollees
Variable Definition
Care Management . Pain Most or All of the Time Versus some of the time or only occasionally Severe Pain Versus no pain, very mild, mild, or moderate pain Fallen in Past 6 Months Yes (yes/no) Injured in a Fall in Past 6 Months Yes (yes/no), not conditional on reporting a fall Lost 10 or More Pounds (unintentional) Yes response to having lost 10 or more pounds
and responded no to whether they were trying to lose the weight
Takes a Great Deal of Energy to Get Services Agree or strongly agree versus disagree or strongly agree
Good or Very Good Reassurance/Emotional Support
Versus fair or poor
PACE Caregivers Paid Attention All of the Time Versus most, some, or none of the time Personal Care Needs Taken Care of All of the Time
Versus usually, sometimes, or never
PACE Caregivers Completed All Work Most or All of the Time
Versus some or none of the time
PACE Caregivers Rushed Through Their Work None of the Time
Versus some, most, or all of the time
Signed Durable Power of Attorney or Living Will Versus neither durable power of attorney or living will
Health Utilization . Living in Group Home, Assisted Living Facility, or Nursing Home
Versus house, apartment, or other
Admitted to a Hospital in the Past Year Yes (yes/no) Nursing Home Stay in the Past Year Yes (yes/no) Flu Shot Since Sept. 2012 (6 months, coincides with winter)
Yes (yes/no)
Flu Shot or Offered and Refused Versus not offered Pneumonia Vaccination Yes (yes/no) Hearing Tested Regularly Yes (yes/no), among those that can hear Eyesight Tested Regularly Yes (yes/no), among those that can see
Satisfaction Measures . Received Therapy Outside of PACE Yes (yes/no) -Satisfied or very satisfied with therapy Versus unsatisfied or very unsatisfied
Visited the PACE Center in the Past Month Yes (yes/no) Satisfied or Very Satisfied with Overall Care at PACE
Versus unsatisfied or very unsatisfied
Received Therapy at PACE Center Yes (yes/no) -Satisfied or very satisfied with therapy Versus unsatisfied or very unsatisfied, conditional
on receiving therapy at the PACE center Satisfied or Very Satisfied with Info from MDs Versus unsatisfied or very unsatisfied
Appendix E Mathematica Policy Research
Table E.1 (continued)
E-4
Variable Definition
Satisfied or Very Satisfied with Info on Meds Versus unsatisfied or very unsatisfied, conditional on taking prescription medicines
Satisfied or Very Satisfied with Coordination Versus unsatisfied or very unsatisfied Satisfied or Very Satisfied with Respect Versus unsatisfied or very unsatisfied Always Received Transportation Help when Needed
Versus usually, sometimes, or never, conditional on receiving help with transportation
Satisfied or Very Satisfied with Transportation Help
Versus unsatisfied or very unsatisfied, conditional on receiving help with transportation
Always Specialist Appt. when Needed Versus usually, sometimes, or never, conditional on needing to see a specialist
Not Enough Specialists Agree or strongly agree, versus disagree or strongly disagree, conditional on needing to see a specialist
Could not See a Specialist Yes (yes/no), in the past year, conditional on needing to see a specialist
Satisfied or Very Satisfied with Specialist Care Versus unsatisfied or very unsatisfied, conditional on needing a specialist
Satisfied or Very Satisfied with Viewed as a Person
Versus unsatisfied or very unsatisfied
Source: Survey of PACE enrollees conducted by Mathematica from November 2012 to March 2013.Construction of Health and Coverage Prior to PACE Enrollment Variables
Chronic Conditions
We defined flags for the 27 chronic conditions included in the MBSF using dates denoting the first occurrence of the conditions (see Table E.2 for the full list of the conditions). If the date of occurrence was prior to an enrollee’s date of enrollment, he or she was considered to have the given chronic condition prior to enrollment. For example, if enrollee A had a date of occurrence for acute myocardial infarction on January 1, 2009, and she enrolled in the PACE plan on January 2, 2009, she was considered to have the chronic condition when she enrolled in the plan. In addition to the specific condition flags, we also designed two variables to summarize the conditions: a binary indicator for whether each enrollee had any chronic conditions prior to enrollment and a continuous variable indicating the number of chronic conditions prior to enrollment. As mentioned in Chapter IV, Data, we restricted the analysis of chronic conditions prior to enrollment in PACE to those in FFS 7 to 12 months of the 12 months prior to enrollment in PACE to minimize measurement error due to missing chronic condition information during periods of enrollment in managed care plans.
Dual eligibility
We defined several different methods for indicating dual eligibility for Medicaid and Medicare based on partial or full eligibility and the number of months that the enrollee was eligible. First, we defined a flag denoting whether enrollees were fully eligible in at least one of
Appendix E Mathematica Policy Research
E-5
the 12 months prior to enrollment.38,39
Coverage prior to PACE
In addition, we defined a flag denoting whether enrollees were partially or fully eligible in at least one of the 12 months prior to enrollment. Because the number of months eligible can vary greatly over the 12 month period, we also defined two additional variables: the number of months fully eligible in the 12 months prior to enrollment and the number of months partially or fully eligible over the same period.
We defined three variables to indicate the coverage of enrollees prior to enrollment in PACE. Because PACE plans are private Medicare Advantage plans as part of Medicare Part C, it is possible that enrollees are more likely to have been in another private plan (including a different PACE plan) prior to enrollment in their current PACE plan. First, we defined a variable denoting whether enrollees were in a managed care plan prior to enrollment in their PACE plan. We used the Group Health Organization (GHO) plan coverage dates in the EDB to determine whether enrollees were in a managed care plan, in Medicare fee-for-service (FFS), or not eligible for Medicare. However, it is possible that individuals were in a managed care plan but switched briefly to FFS just prior to enrolling in a PACE plan. Thus, we also defined a flag for enrollment in a managed care plan at any point in the six months prior to PACE enrollment and for a count of the number of months in the previous 12 months enrolled in a managed care plan to give a fuller picture of managed care enrollment prior to PACE.
Original reason for entitlement
We used information in the 2011 MBSF to define a flag for the original reason that each enrollee was eligible for Medicare coverage. The flag is defined as originally being eligible based on a disability (disability insurance benefits [DIB]) or having ESRD (or both). All other enrollees first became eligible when they turned 65 years old.
38 An enrollee was fully eligible if any of the following were coded: (1) Qualified Medicare Beneficiary
(QMB) and Medicaid coverage including prescription medications, (2) Specified Low-Income Medicaid Beneficiary (SLMB) and Medicaid coverage including prescription medications, or (3) Other Dual Eligibles (Non-QMB, SLMB, Qualified Working Disable Individuals [QWDI], or Qualified Individuals [QI]) with Medicaid coverage including prescription medications (for more information, visit the Research Data Assistance Center website (RESDAC): http://www.resdac.org/cms-data/variables/Dual-Status-Code-occurs-12-times). An enrollee was partially eligible if any of the following are coded: (1) QMB only, (2) SLMB only, (3) QDWI, or (4) QI.
39 The detailed dual eligibility variable was not available in the 2005 MBSF, and the 2012 MBSF is not available, so we used the 12 months in 2006 to define dual eligibility for individuals enrolling in 2006 or earlier and the 12 months in 2011 for individuals enrolling in 2012. Therefore, the period prior to enrollment for those enrolling in 2006 will contain months that overlap with enrollment and months after enrollment for those enrolling prior to 2006, and the period prior to enrollment for those enrolling in 2012 will not coincide with the months just prior to enrollment.
Table E.2. List of Chronic Conditions Included in the Study
Chronic Conditions
Alzheimer's Disease Alzheimer's Disease and Related Disorders or Senile Dementia Acute Myocardial Infarction Anemia Asthma Atrial Fibrillation Breast Cancer Colorectal Cancer Endometrial Cancer Lung Cancer Prostate Cancer Cataract Heart Failure Chronic Kidney Disease Chronic Obstructive Pulmonary Disease Depression Diabetes Glaucoma Hip/Pelvic Fracture Hyperlipidemia Benign Prostatic Hyperplasia Hypertension Acquired Hypothyroidism Ischemic Heart Disease Osteoporosis Rheumatoid Arthritis/Osteoarthritis Stroke/Transient Ischemic Attack
Source: MBSF.
Other Data Sources
Plan Service Area Characteristics
As discussed in Chapter III, Methods, we utilized a wide range of population characteristics of the plans’ local service areas to inform the selection of the not-for-profit plans. The demographic characteristics of the populations were obtained from the 2006–2010 five-year ACS summary files from the U.S. Census Bureau. The information was obtained for each census tract in the state, and all census tracts that overlapped the plan service area boundaries were aggregated to form an approximation of the populations living in the service areas (Figure A.1). When available, we defined the variables using the populations age 65 and older rather than the entire population (for example, the percentage of the population age 65 and older living below the poverty level). We also defined the population density for plan service areas using total
Appendix E Mathematica Policy Research
E-7
population and total land area from the ACS using the same methodology for assigning the characteristics of the service areas. In addition, we defined a continuous variable indicating whether the plan site was located in an urban versus a rural county based on the urban/rural continuum codes generated by OMB at the county level.
Figure E.1 shows the service areas for all PACE plans in Pennsylvania and how they overlap with U.S. Census Bureau census tract boundaries. The population characteristics for a service area are defined as the aggregate of the characteristics for all census tracts that overlap with the service area using 2006–2010 ACS data at the census tract level. The service areas range from 10.3 to 35.6 square miles for the for-profit plans and 0.4 to 32.0 square miles for the not-for-profit plans (area figures not reported). The average sizes of the service areas for plans included in the study are similar for the for-profit and not-for-profit plans, 21.9 and 17.3 square miles, respectively.
Figure E.1. PACE Plan Service Area Boundaries and Census Tract Boundaries
Sources: PACE locations obtained from CMS. Census tract borders from U.S. Census Bureau 2010 census tract shapefiles. PACE plan service areas obtained from CMS at the zip code-level and aggregated using U.S. Census Bureau 2010 County Shapefiles and using ArcMap. Map generated using ArcMap (Environmental Systems Resource Institute [ESRI]. ArcMap 10.0. Redlands, CA: ESRI, 2011.).
This page has been left blank for double-sided copying.
APPENDIX F
RESULTS FOR FULL LIST OF CHRONIC CONDITIONS
This page has been left blank for double-sided copying.
Appendix F Mathematica Policy Research
F-3
Table F.1. Comparison of Chronic Conditions at the Time of Enrollment by For-Profit Status (percentage)
Chronic Conditions For-Profit PACE
Not-For-Profit PACE
Specific Chronic Conditions Flags . . Alzheimer's Disease 32.4% 47.2%
Alzheimer's Disease and Related Disorders or Senile Dementia 18.3% 19.2%
Acute Myocardial Infarction 5.9% 6.0%
Anemia 59.4% 68.0%
Asthma 14.5% 15.8%
Atrial Fibrillation 19.4% 18.0%
Breast Cancer 5.4% 6.3%
Colorectal Cancer 4.3% 3.4%
Endometrial Cancer 1.0% 1.0%
Lung Cancer 1.6% 1.0%
Prostate Cancer 4.3% 3.1%
Cataract 60.0% 56.5%
Heart Failure 43.7% 43.4%
Chronic Kidney Disease 35.1% 33.9%
Chronic Obstructive Pulmonary Disease 38.3% 34.5%
Depression 49.1% 47.0%
Diabetes 49.1% 51.2%
Glaucoma 16.2% 21.0%
Hip/Pelvic Fracture 4.8% 7.2%
Hyperlipidemia 72.4% 70.7%
Benign Prostatic Hyperplasia 11.8% 10.4%
Hypertension 89.1% 87.7%
Acquired Hypothyroidism 22.1% 19.9%
Ischemic Heart Disease 62.1% 59.0%
Osteoporosis 31.3% 24.9%
Rheumatoid Arthritis/Osteoarthritis 65.9% 60.4%
Stroke/Transient Ischemic Attack 23.2% 32.2%
Sources: MARx, EDB, MBSF
www.mathematica-mpr.com
Improving public well-being by conducting high quality, objective research and surveys
Princeton, NJ ■ Ann Arbor, MI ■ Cambridge, MA ■ Chicago, IL ■ Oakland, CA ■ Washington, DC
Mathematica® is a registered trademark of Mathematica Policy Research