1 STUDY OF CEMENT – EPOXY INTERFACES, ACCELERATED TESTING, AND SURFACE MODIFICATION By ANDREW STEWART A DISSERTATION PRESENTED TO THE GRADUATE SCHOOL OF THE UNIVERSITY OF FLORIDA IN PARTIAL FULFILLMENT OF THE REQUIREMENTS FOR THE DEGREE OF DOCTOR OF PHILOSOPHY UNIVERSITY OF FLORIDA 2012
Transcript
1
STUDY OF CEMENT – EPOXY INTERFACES, ACCELERATED TESTING, AND SURFACE MODIFICATION
By
ANDREW STEWART
A DISSERTATION PRESENTED TO THE GRADUATE SCHOOL OF THE UNIVERSITY OF FLORIDA IN PARTIAL FULFILLMENT
OF THE REQUIREMENTS FOR THE DEGREE OF DOCTOR OF PHILOSOPHY
This dissertation is dedicated to my parents, Dorothy and Marty, and my girlfriend, Jennifer. I would not have been able to complete my body of work without your
consistent love and support.
4
ACKNOWLEDGMENTS
I would like to take a moment to thank my encouraging family and inspiring
girlfriend. The completion of this body of work would not have been possible without
their continued support, reassurance, and unconditional love. My thesis advisor, Dr.
Elliot Douglas is a great mentor, and I am grateful to have had the opportunity to work
under his guidance and direction. I would also like to thank Dr. Batich, Dr. Brennan, Dr.
Craciun, Dr. Hamilton, and Dr. Mecholsky, for their suggestions and support in serving
as members of my committee. In addition, I am appreciative of Dr. Lambert and Dr.
Gervais for their guidance and assistance during my brief stay in Paris. Without Dr.
Gervais’ assistance in running the high frequency MAS NMR experiments, much of this
work would not have been possible. Eric Lambers and Gary Scheiffele were also very
helpful in acquiring XPS and FTIR spectra. Finally, I would like to thank the
undergraduate students, Brett Schlosser and Matt Faatz, who helped me with my
Civil Vs Chemistry Perspective ............................................................................... 17 Goals of This Research .......................................................................................... 19
2 ACCELERATED DEGRADATION OF EPOXY AND FRPS .................................... 20
What is Cement? .................................................................................................... 20 Cement Chemistry and Nomenclature ............................................................. 21
Hydration Products ........................................................................................... 22 Modeling of CSH .............................................................................................. 22
Accelerated Testing of Concrete ............................................................................. 26 What is Epoxy? ....................................................................................................... 28
Effect of Temperature ....................................................................................... 29
Effects of Water ................................................................................................ 32 Accelerated Testing of Epoxies .............................................................................. 33
Change in Properties ........................................................................................ 33 Degradation Mechanisms of Epoxies ............................................................... 40
Accelerated Testing of FRPs .................................................................................. 49
Change in Properties ........................................................................................ 49 Change in Properties of FRPs with Concrete ................................................... 52
Degradation Mechanisms of FRPs ................................................................... 59 Summary of Accelerated Testing of Epoxy and FRP Systems ......................... 64
3 NATURE OF THE CONCRETE-EPOXY INTERFACE ........................................... 66
Experimental Procedure ......................................................................................... 69 FTIR Theory and Technique ............................................................................. 70
6
NMR Theory and Technique ............................................................................ 72
Results and Discussion........................................................................................... 75 FTIR ................................................................................................................. 75
Experimental Procedure ......................................................................................... 99 Results and Discussion......................................................................................... 101
Change in Mechanical Properties of the Model Epoxy System During Hygrothermal Exposure .............................................................................. 101
Change in Mechanical Properties of the Model Epoxy System During UV and Water Exposure ................................................................................... 107
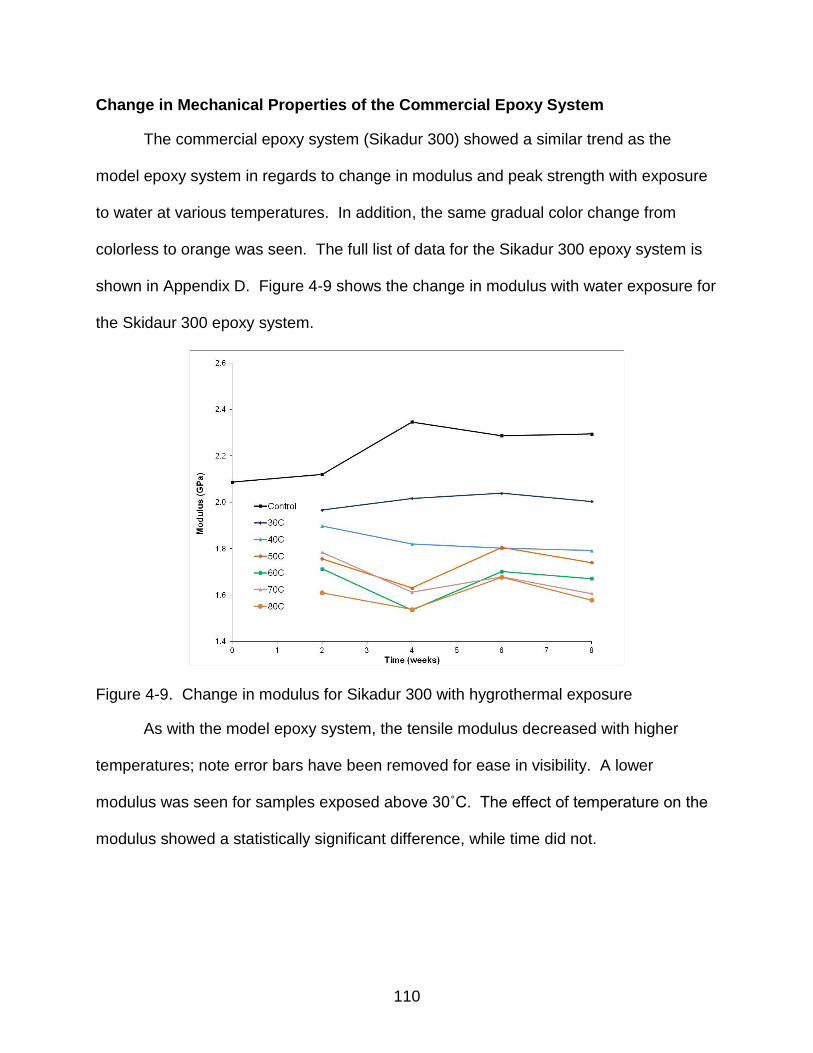
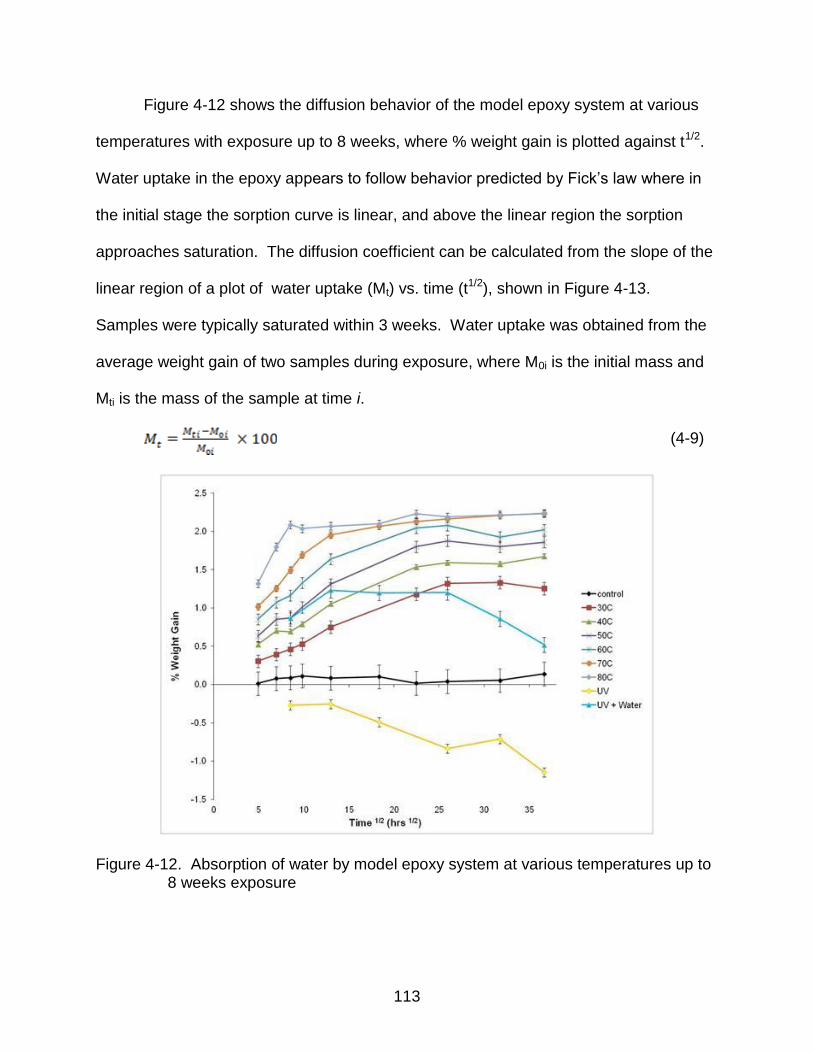
Change in Mechanical Properties of the Commercial Epoxy System ............. 110 Diffusion of Water Into the Model Epoxy System ........................................... 112
IR Characterization of Degradation ................................................................ 116 Summary .............................................................................................................. 121
5 MODIFICATION OF CEMENT PASTE SURFACES WITH SILANE COUPLING AGENTS ............................................................................................................... 122
6 GENERAL CONCLUSIONS AND FUTURE WORK ............................................. 145
APPENDIX
A MECHANICAL PROPERTIES OF THE MODEL EPOXY SYSTEM DURING HYGROTHERMAL EXPOSURE ........................................................................... 148
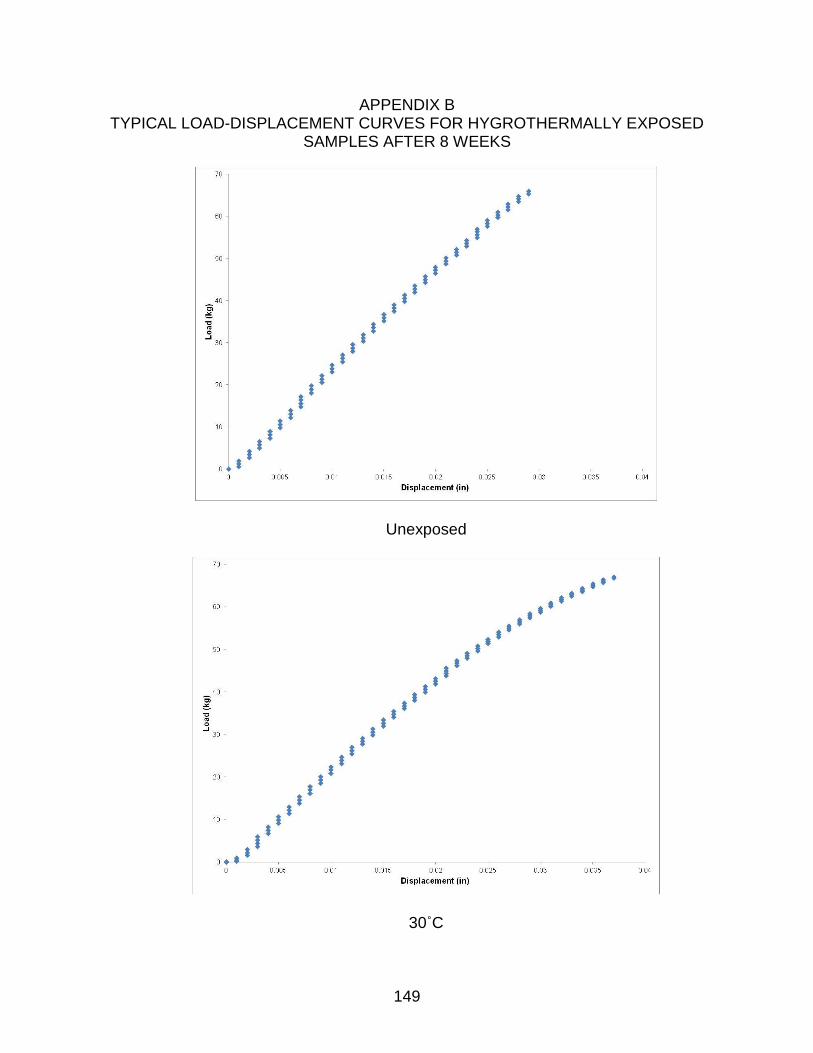
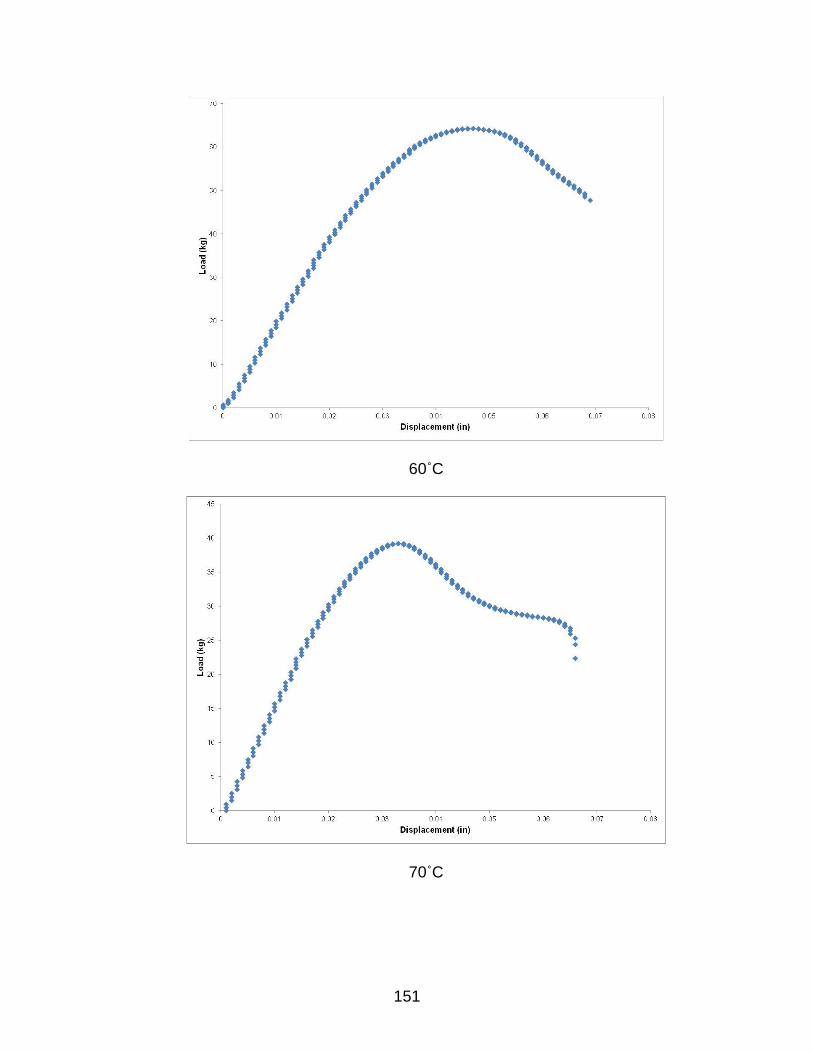
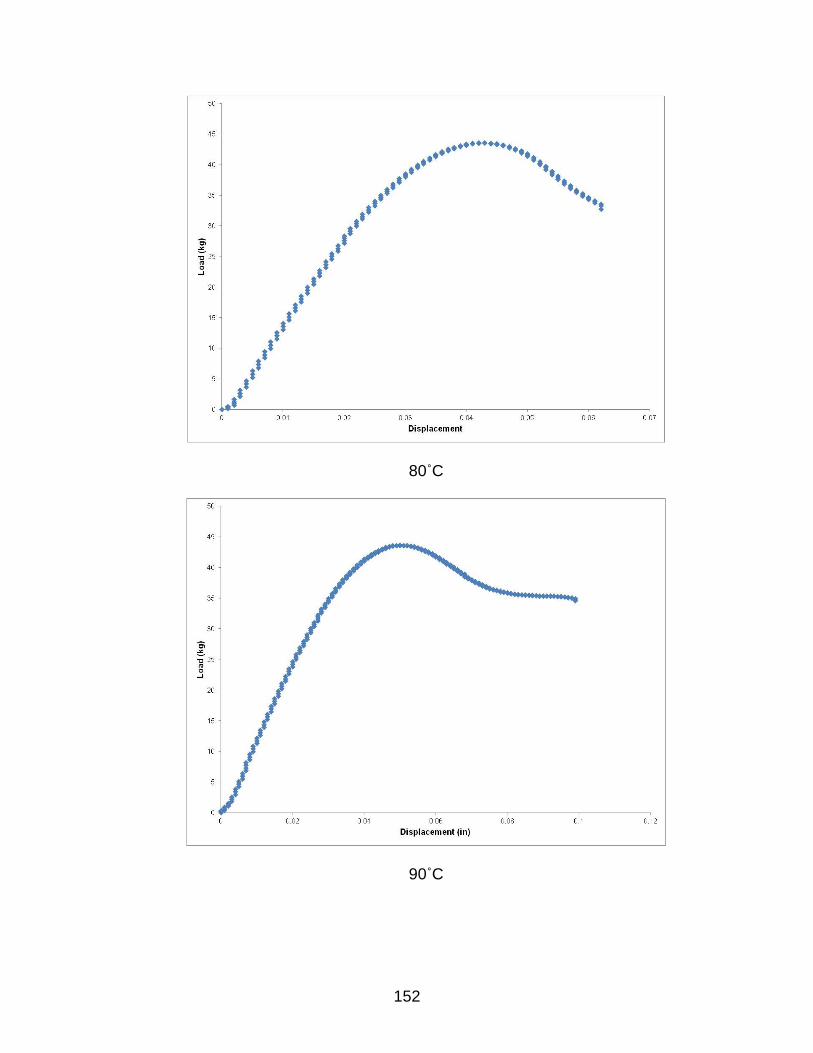
B TYPICAL LOAD-DISPLACEMENT CURVES FOR HYGROTHERMALLY EXPOSED SAMPLES AFTER 8 WEEKS ............................................................. 149
C MECHANICAL PROPERTIES OF THE MODEL EPOXY SYSTEM DURING UV EXPOSURE .......................................................................................................... 153
D MECHANICAL PROPERTIES OF SIKADUR 300 DURING HYGROTHERMAL EXPOSURE .......................................................................................................... 154
7
E MANOVA RESULTS FOR MODULUS VALUES FOR THE MODEL EPOXY SYSTEM WITH HYGROTHERMAL EXPOSURE ................................................. 155
LIST OF REFERENCES ............................................................................................. 156
2-2 Change in Tg of DGEBA cured with different curing agents ............................... 31
2-3 Summary of changes in properties for accelerated testing of epoxy systems .... 39
2-4 Summary of mechanisms of degradation for accelerated testing of epoxy systems .............................................................................................................. 47
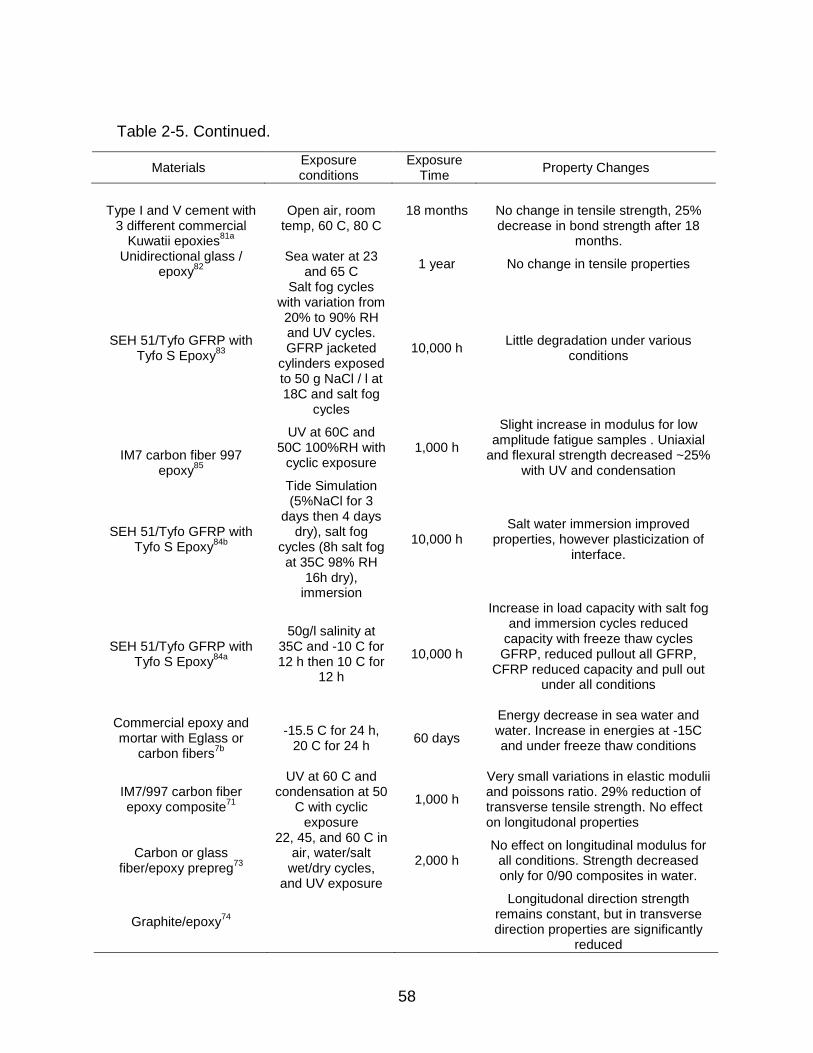
2-5 Summary of changes in properties for accelerated testing of FRP systems ....... 56
2-6 Summary of mechanisms of degradation for accelerated testing of FRP systems .............................................................................................................. 63
2-7 Summary of property changes and mechanisms for epoxy and FRP systems ... 65
3-1 Assignment of observed peaks for cured cement paste ..................................... 76
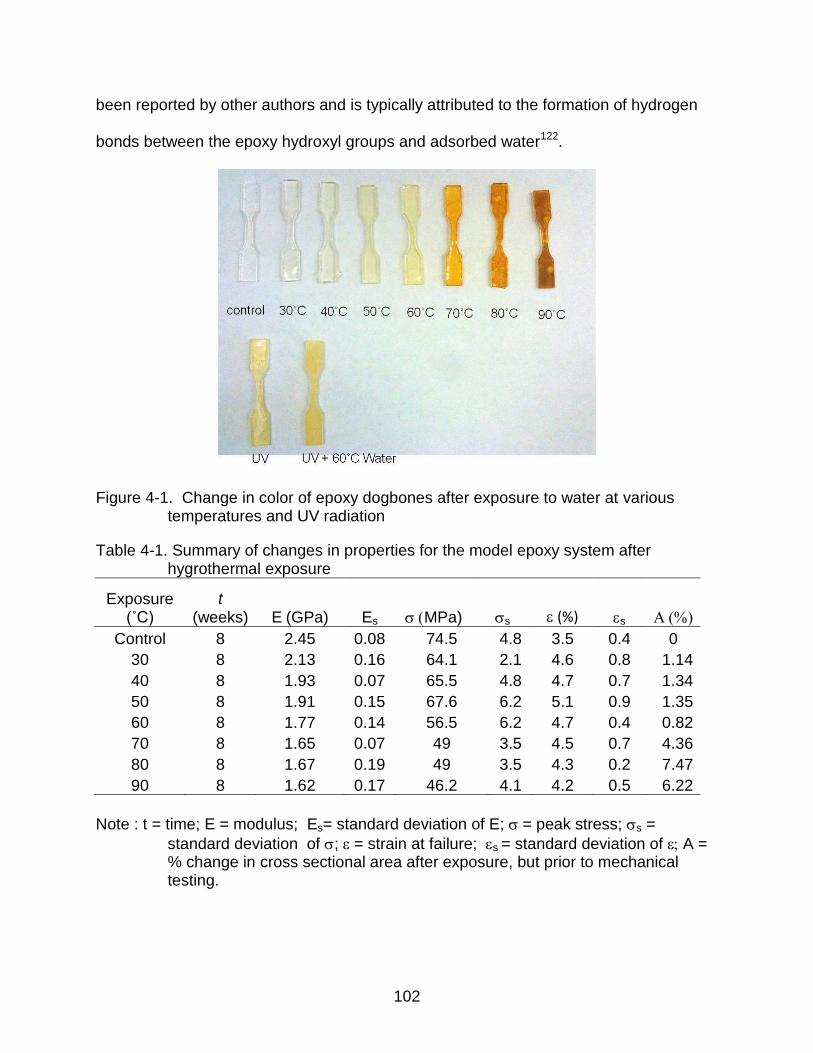
4-1 Summary of changes in properties for the model epoxy system after hygrothermal exposure ..................................................................................... 102
4-2 Diffusion coefficients at different water temperatures for the model epoxy system .............................................................................................................. 115
4-3 IR peak assignment of the absorption bands in the model epoxy system ........ 116
4-4 Area comparisons of water absorption peaks relative to the phenyl ring for exposure at various water temperatures .......................................................... 118
4-5 Area comparisons of various absorption peaks relative to the phenyl ring for exposure to UV radiation with and without water .............................................. 121
5-1 Measurement of contact angles using different techniques on various concrete sample types ...................................................................................... 132
5-2 Apparent surface composition and binding energies of treated and untreated cement pastes .................................................................................................. 137
5-3 Binding energy positions and relative amounts of bridging and non-bridging atoms ................................................................................................................ 137
9
LIST OF FIGURES
Figure page 2-1 Simplified model for hydrated Portland cement proposed by Feldman and
2-2 Jennings model for LD and HD CSH formed after drying ................................... 24
2-3 (A) TEM image of clusters of CSH (B) the modecular model of CSH ................. 25
2-4 Reaction between an epoxide and primary amine .............................................. 28
2-5 DGEBA and Jeffamine D230 chemical structures .............................................. 31
2-6 Transport of water through nanopore network in epoxy proposed by Soles ....... 32
2-7 DSC measurement of a highly crosslinked epoxy during hygrothermal exposure aging at 60˚C ...................................................................................... 35
2-8 Evolution of tan () as a function of temperature for an epoxy with and without water ...................................................................................................... 36
2-9 2D and 3D AFM images of samples exposed to different environmental conditions ........................................................................................................... 38
2-10 Asynchronous 2D correlation IR spectra of water in epoxy in the spectral range 2800–3700 cm-1 ....................................................................................... 43
2-11 ATR-IR spectra of various stoichiometries of epoxy and amine curing agent
after 25 days of aging at 120˚C on the surface and a depth of 350 m .............. 45
2-12 Hydrolysis degradation mechanism of DDA cured epoxy ................................... 46
2-13 FTIR of the DDA cured epoxy system at 60˚C up to 101 days ........................... 46
2-14 Change in pull off strength of bonded interfaces of concrete composites after 628 days ............................................................................................................. 53
2-15 FTIR spectra of IM7/997 specimens after 500 hours of UV or condensation ..... 62
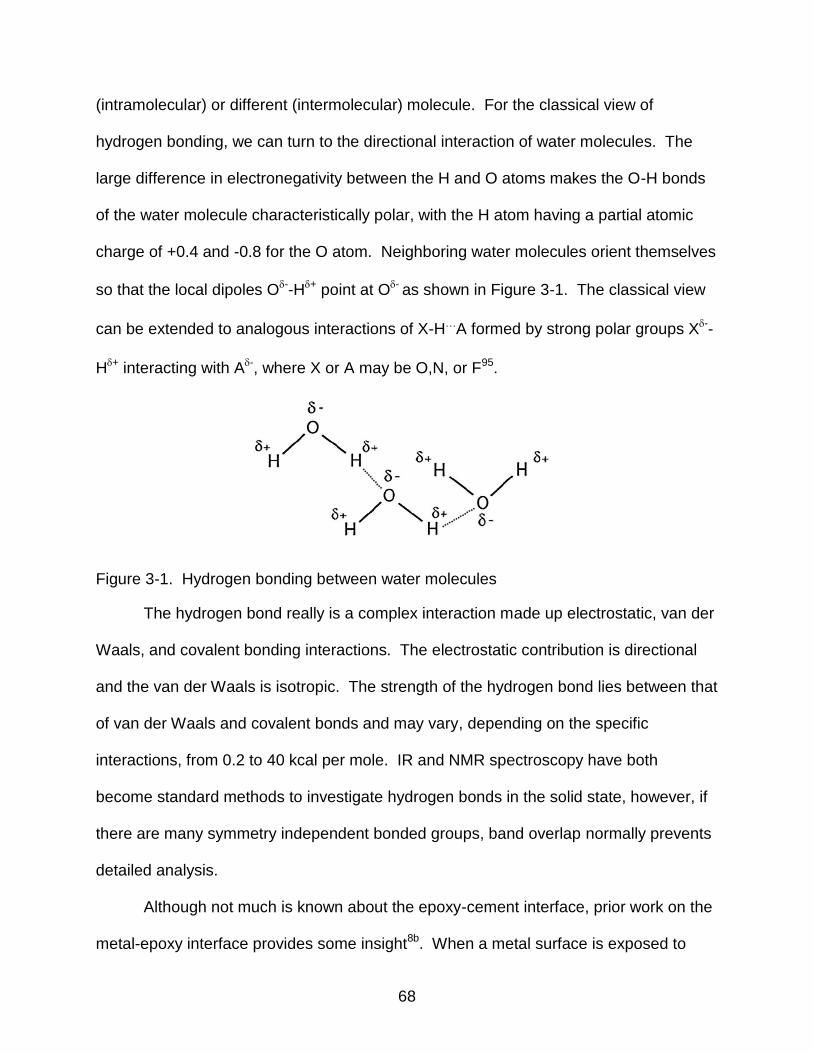
3-1 Hydrogen bonding between water molecules ..................................................... 68
3-2 Chemical structures of Bisphenol A, gylcidyl phenyl ether, and n-ethyldiethanolamine ............................................................................................ 70
3-3 ATR IR spectrum of cured cement paste ............................................................ 76
3-4 ATR spectra of the neat small molecule epoxy analogs and cement paste ........ 77
10
3-5 ATR spectra of the hydroxyl region of cement samples after treatment ............. 78
3-6 ATR IR spectra of BPA treated samples ............................................................ 79
3-7 Subtracted ATR spectra of BPA treated samples ............................................... 80
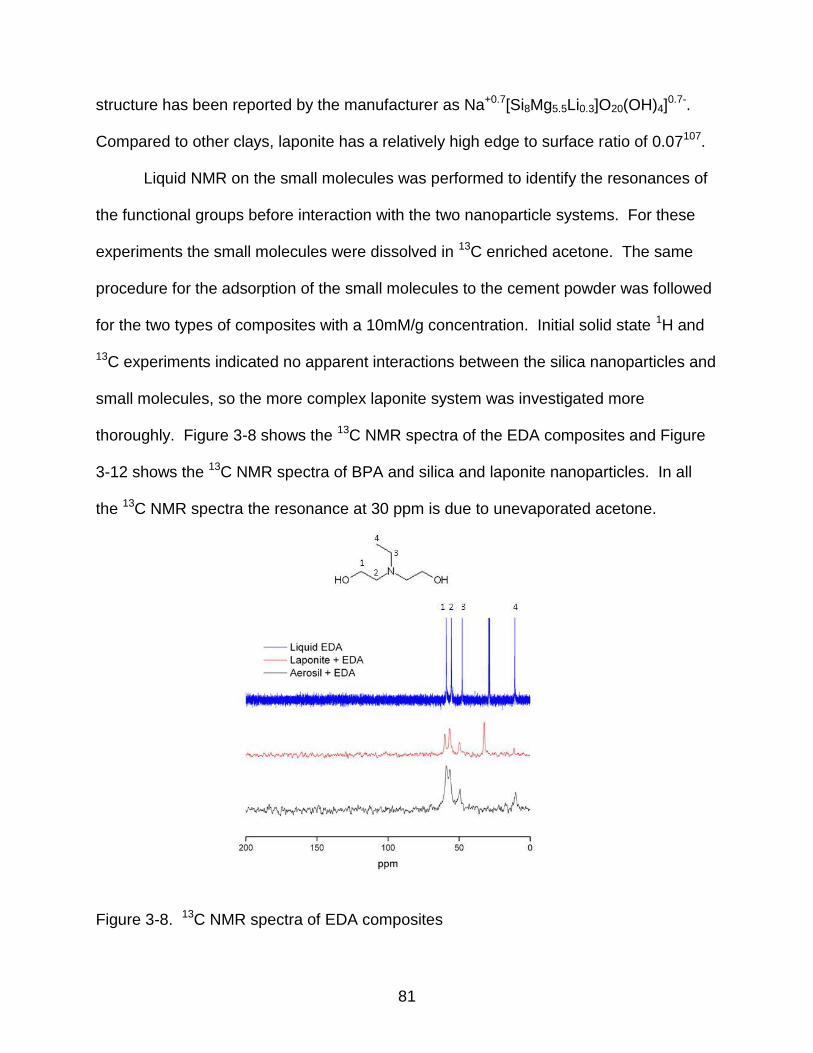
3-8 13C NMR spectra of EDA composites ................................................................. 81
3-9 1H MAS NMR spectra of BPA – laponite composites ......................................... 82
3-12 13C MAS NMR spectra of BPA composites ........................................................ 84
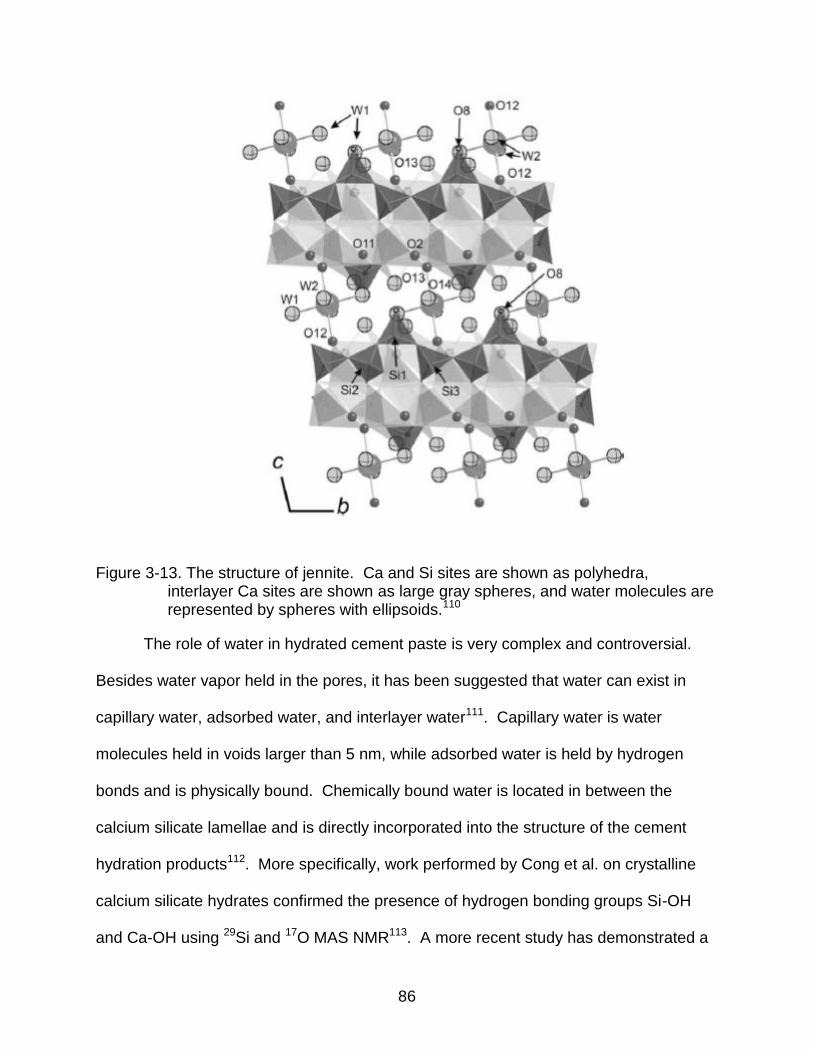
3-13 The structure of jennite ....................................................................................... 86
3-14 1H Solid State MAS NMR spectra of cement paste composites ......................... 88
3-15 1H Solid State MAS NMR spectra of additional BPA loadings ............................ 89
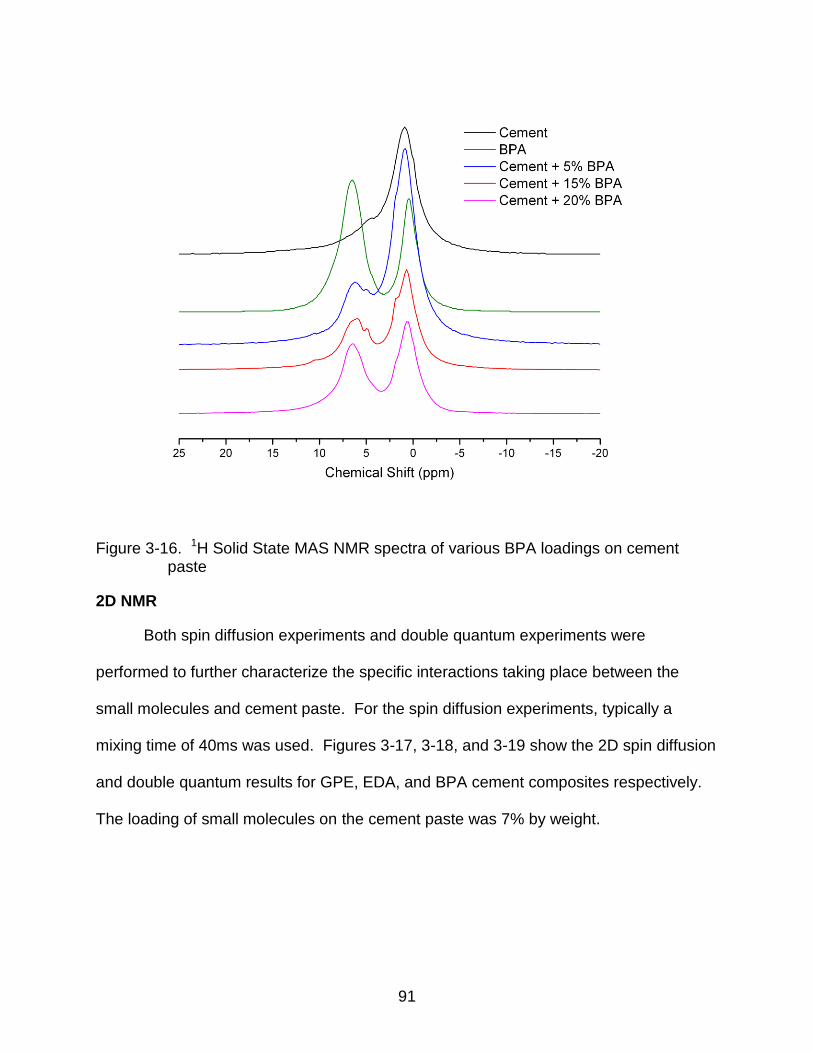
3-16 1H Solid State MAS NMR spectra of various BPA loadings on cement paste .... 91
3-17 2D 1H NMR spin diffusion and double quantum results for cement + GPE ........ 92
3-18 2D 1H NMR spin diffusion and double quantum results for cement + EDA ......... 92
3-19 2D 1H NMR spin diffusion and double quantum results for cement + BPA ......... 92
3-20 2D 1H NMR spin diffusion experiments for 20 and 30% BPA. ............................ 94
3-21 29Si NMR spectra of cement paste before and after treatment with BPA. ........... 96
4-1 Change in color of epoxy dogbones after exposure to water at various temperatures and UV radiation ......................................................................... 102
4-2 Stress-strain curve for control and 70˚C sample after 8 weeks ........................ 104
4-3 Change in modulus for the model epoxy system with hygrothermal exposure . 106
4-4 Change in peak stress for the model epoxy system with hygrothermal exposure ........................................................................................................... 106
4-5 Change in strain for the model epoxy system with hygrothermal exposure ...... 107
4-6 Change in modulus with UV and water exposure for the model epoxy system 108
11
4-7 Change in peak stress with UV and water exposure for the model epoxy system .............................................................................................................. 109
4-8 Change in strain with UV and water exposure for the model epoxy system ..... 109
4-9 Change in modulus for Sikadur 300 with hygrothermal exposure ..................... 110
4-10 Change in peak stress with hygrothermal exposure for Sikadur 300 ................ 111
4-11 Change in strain with hygrothermal exposure for Sikadur 300 ......................... 111
4-12 Absorption of water by model epoxy system at various temperatures up to 8 weeks exposure ................................................................................................ 113
4-13 Fitting of the linear region of the various samples ............................................ 114
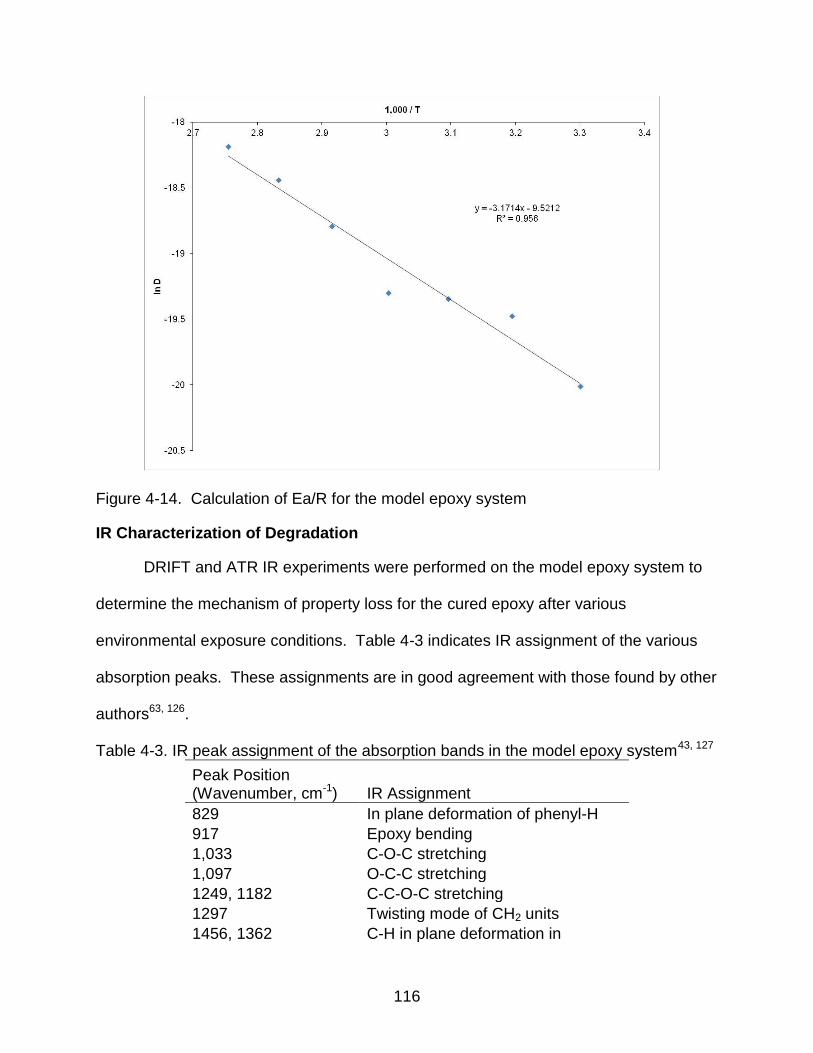
4-14 Calculation of Ea/R for the model epoxy system .............................................. 116
4-15 DRIFT IR spectra of the model epoxy system .................................................. 117
4-16 ATR IR spectra of samples after 8 weeks of exposure ..................................... 119
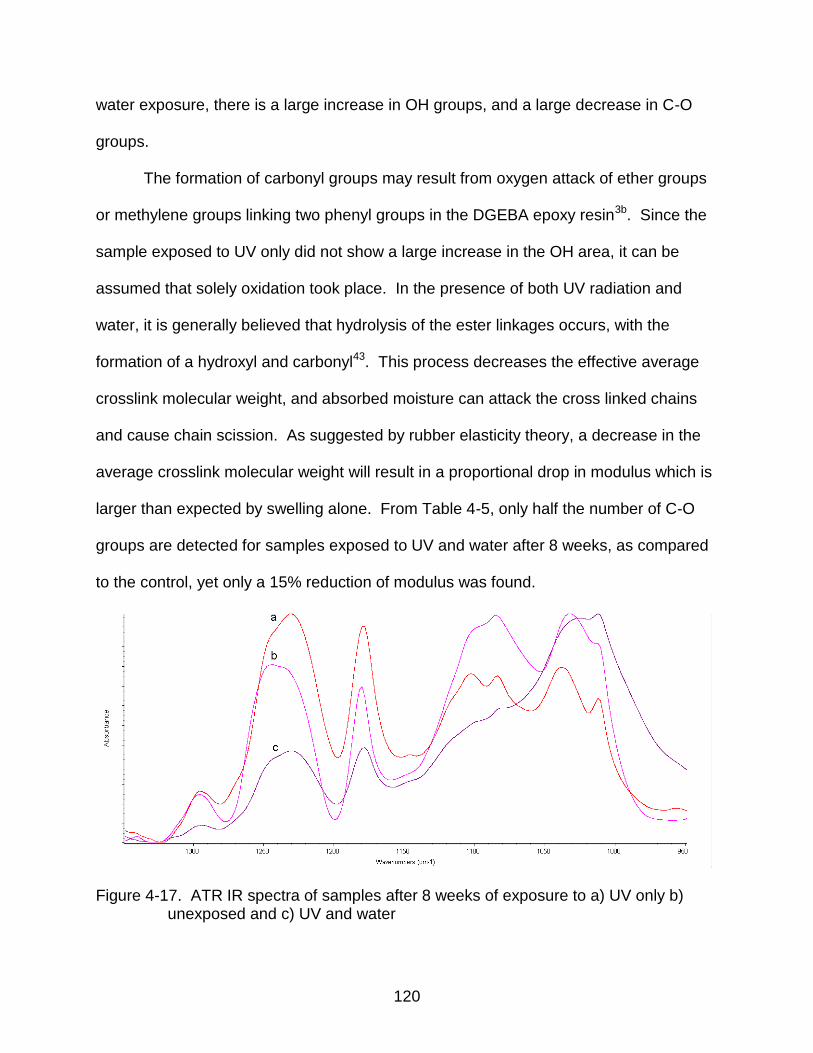
4-17 ATR IR spectra of samples after 8 weeks of exposure ..................................... 120
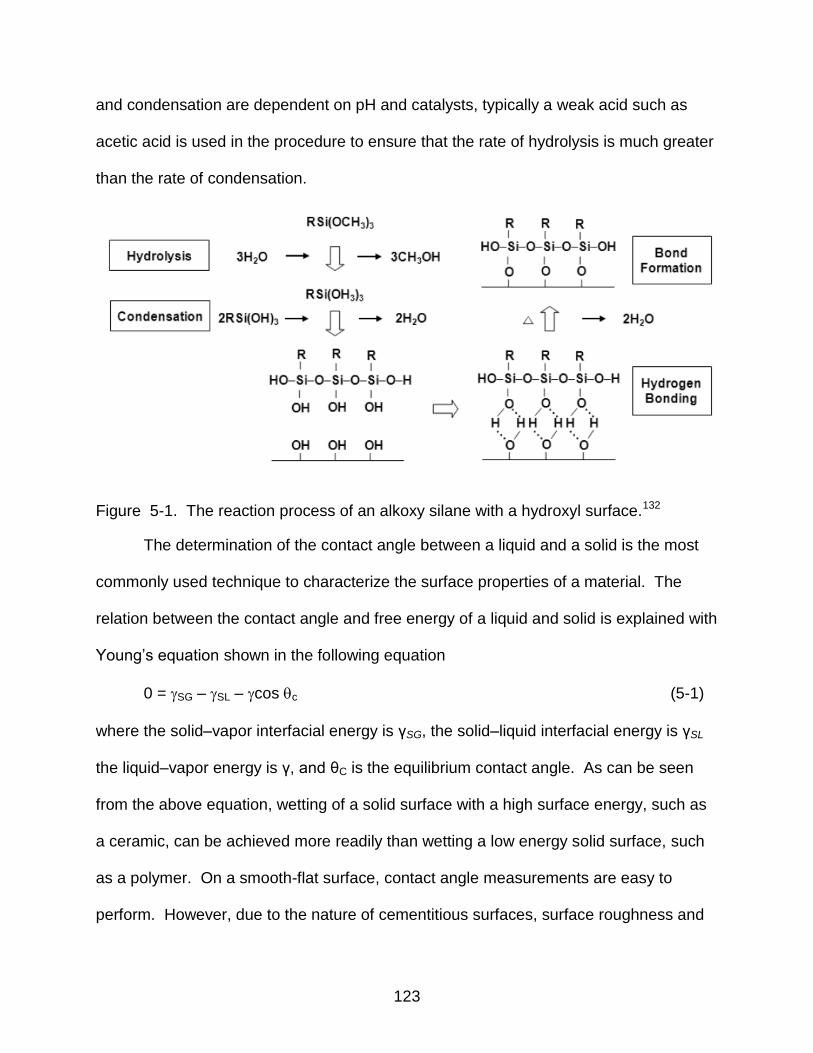
5-1 The reaction process of an alkoxy silane with a hydroxyl surface .................... 123
5-2 Variation in contact angle as a result of surface roughness ............................. 125
5-3 Near mirror finish of a cement paste sample after polishing ............................. 128
5-4 2D and 3D AFM height images of polished cement paste ................................ 131
5-6 DRIFT IR spectra of 0.4 and 0.5 w/c ratio cement pastes ................................ 133
5-7 XPS survey of treated and untreated cement pastes ....................................... 135
5-8 C1s electron orbital XPS spectra including curve fitting of untreated cement paste ................................................................................................................. 138
5-9 C1s electron orbital XPS spectra including curve fitting of ATEPS treated cement paste .................................................................................................... 139
5-10 Ca2p3 electron orbital XPS spectra including curve fitting of untreated cement paste .................................................................................................... 139
5-11 N1s electron orbital XPS spectra including curve fitting of ATEPS treated cement paste .................................................................................................... 140
12
5-12 O1s electron orbital XPS spectra including curve fitting of untreated cement paste ................................................................................................................. 142
5-13 Si2p electron orbital XPS spectra including curve fitting of untreated cement paste ................................................................................................................. 142
Abstract of Dissertation Presented to the Graduate School of the University of Florida in Partial Fulfillment of the Requirements for the Degree of Doctor of Philosophy
STUDY OF CEMENT – EPOXY INTERFACES, ACCELERATED
TESTING, AND SURFACE MODIFICATION
By
Andrew Stewart
May 2012
Chair: Elliot P. Douglas Major: Materials Science and Engineering Adhesion between concrete and fiber reinforced polymer (FRP) repair materials
is of great importance for increasing the longevity of damaged surfaces in civil
infrastructure in the US. This adhesion is dominated by a relatively weak interfacial
bond that is attacked by environmental agents including water and UV radiation.
Therefore, a strong bond between the two materials is essential in making a successful,
long lasting repair. In this study, the fundamental question of the epoxy-concrete
interface is investigated in terms of how it exists, how it is attacked by the environment,
and how it may be improved to resist the elements.
In this study, interactions between epoxy analogs and cement paste were
investigated to get a fundamental understanding of the elusive interfacial bond. Various
FTIR and NMR techniques were utilized to demonstrate the nature of this interaction.
Only one of the small molecules (Bisphenol A), suggested a small interaction, however,
based on the results it appeared that hydrogen bonding did not take place.
The second part of this work focused on accelerated aging two epoxy systems,
including a model DGEBA-POPDA system, and a commercial system. Mechanical
testing was performed along with IR spectroscopy and diffusion modeling to determine
16
the change in properties and mechanisms of degradation. The absorption of water up
to 90˚C resulted in a decrease in modulus and stress, along with an increase in strain.
IR data confirmed the absorption of water within the epoxy network. With UV exposure,
oxidation was demonstrated by the appearance of carbonyl peaks in the FTIR spectra.
UV and water exposure gave evidence of hydrolysis through a decrease in ether groups
and an increase in hydroxyl groups. While samples exposed to UV showed less of a
loss in modulus as compared to those only exposed to water at the same temperature,
the peak stress of samples exposed to UV was lower than those exposed to water.
However, the data from the mechanical testing of the UV exposed samples was not
statistically significant.
The final section of this work used silane coupling agents to modify cement
pastes. AFM measurements were performed to demonstrate the effectiveness of the
polishing technique and uniformity of the surface, which the literature indicated was
necessary for comparison purposes. The contact angle was shown to increase for the
PDMS based silane, decrease for the amino based silane, and not change for the epoxy
based silane. XPS data confirmed successful covalent linkages between the cement
paste and silane coupling agents as evidenced by an increase in bridging O1s and Si2p
electron orbitals after curve fitting.
17
CHAPTER 1 INTRODUCTION
Background
In 2003 the American Society of Civil Engineers reported that 27.1% of the
nation’s bridges were structurally deficient. Therefore, they suggested significant
changes need to be made to repair America’s bridges. One possible repair solution
could be the use of fiber reinforced polymers (FRPs). Compared to tearing down and
rebuilding a bridge, this method represents substantial time and cost savings. The FRP
can be wrapped around columns or applied to the tension side of a beam, using a wet
layup approach or by bonding a pre cured laminate. Epoxy resins have been widely
used for this application due to their high performance in strength, stiffness1, and
resistance to creep2. Despite the advantages to FRP repair, questions still exist
regarding the composite’s durability as evidenced in a recent catastrophe in 2006 where
concrete panels fell on a car at the Big Dig in Boston. The concrete panels were
attached to the ceiling using an adhesive anchor, which appeared to fail at the epoxy
concrete interface. Another important concern is the issue of bond degradation due to
environmental exposure. Many investigations have been done on how environmental
exposure affects metal/epoxy3, glass/epoxy4, carbon/epoxy5, and glass/vinylester6 FRP,
but little is known regarding the chemical nature of the bond between epoxy and
concrete.
Civil Vs Chemistry Perspective
Civil engineering, by definition, deals with the design, construction, and
maintenance of physical and naturally occurring structures. Therefore, the size of the
materials and dimensions they must consider can range from millimeters to kilometers.
18
Civil engineers have to have a practical consideration of the variables and components
of the systems they deal with as they affect things on the macro scale. On the other
hand, chemists are concerned with atoms and interactions at the nano scale, which
determine some of the most important properties of materials. The fact that these two
disciplines examine different length scales, results in different theories regarding the
nature of adhesion between epoxy and concrete. The two main mechanisms are
mechanical interlock and chemical bonding.
The mechanical interlocking theory assumes that good adhesion between two
materials occurs when an adhesive penetrates into the pores, holes, and irregularities of
the surface, and locks mechanically to the substrate. Numerous investigations have
shown enhanced bond strength of concrete systems as a result of rough surface
preparation using a variety of test methods7. On the other hand, since good adhesion
has been reported between epoxy and smooth surfaces, such as copper or aluminum8,
another theory must also be considered.
It is highly possible that a chemical bond between epoxy and concrete exists.
While the exact stoichiometry and chemical makeup of cement is still debated, many
scientists have acknowledged that hydroxyl and silanol groups exist within the material.
The presence of highly polar aliphatic hydroxyl and ether groups in epoxy chains can
serve as sites for the formation of strong hydrogen bonds between the epoxy and cured
cement. A few studies that have examined the chemical nature of the interface
suggested hydrogen bonds are formed between epoxy and concrete9, and water tends
to cluster at the interface and form hydrogen bonds4a.
19
Goals of This Research
In this study, the fundamental question of the epoxy-concrete interface is
investigated in terms of how it exists, how it is attacked by the environment, and how it
may be improved to resist the elements. The epoxy-amine system used in this study is
a common DGEBA and polyoxypropylene diamine, and one other commercial system.
In the first part of this work, interactions between epoxy analogs and cement
paste were investigated to get a fundamental understanding of the elusive interfacial
bond. Various spectroscopic techniques were utilized to investigate if a chemical bond
exists (Chapter 3).
The second part of this work focused on accelerated aging of the two epoxy
systems. Mechanical testing was performed along with IR spectroscopy and diffusion
modeling to determine the change in properties and mechanisms of degradation
(Chapter 4).
The last section of this work used silane coupling agents to modify cement
pastes. By measuring the contact angle and characterizing the functionalized surface, a
quantitative measure of the chemical bond was shown (Chapter 5).
The specific aims of this work are as follows: (1) to test the hypothesis that
hydrogen bonding exists between epoxy and cement paste; (2) to investigate the
change in chemical and mechanical properties of epoxy using accelerated techniques;
(3) to functionalize cement surfaces by the use of different silane coupling agents. We
hope that this study leads us to advance our fundamental understanding of epoxy-
concrete systems, allowing us to improve the performance and durability of these
composite systems in the construction industry.
20
CHAPTER 2 ACCELERATED DEGRADATION OF EPOXY AND FRPS
What is Cement?
The most general meaning of cement is a substance that hardens and can bind
other materials together. The word “cement” was first used by the Romans to describe
a masonry building material that was composed of crushed rock with burnt lime as a
binder. While cement and concrete are commonly used interchangeably, there are key
technical differences. Cement is the key ingredient in concrete. It is a finely made
powder, that when mixed with water creates cement paste that hardens during
hydration and curing. During this process it can bind with rocks, called aggregates, to
form concrete. When only sand particles are used as aggregates, the cured material is
referred to as mortar, while when bigger stones are used it is referred to as concrete. In
1824, Joseph Aspdin patented a cement that he called Portland due to the similarity in
color with the stone quarried on the Isle of Portland off the British coast. His method of
producing cement, which he developed in his kitchen, was based on a precise ratio of
finely ground limestone and clay10.
Current day Portland cement manufacturing is a complex process. The first step
in the manufacturing process is obtaining raw materials consisting of limestone, chalk,
clay, sand or iron oxide mined from a quarry. Two different methods, wet and dry, are
used in the heating process. In the dry process, dry raw materials are proportioned,
ground to a powder, blended together and fed to the kiln in a dry state. In the wet
process, a slurry is formed by adding water to the properly proportioned raw materials.
The grinding and blending operations are then completed with the materials in slurry
form. After blending, the mixture of raw materials is fed into a tilted rotating, cylindrical
21
kiln where the mixture passes through the kiln at a rate controlled by the slope and
rotational speed of the kiln. Inside the kiln, raw materials reach temperatures of up to
1650˚C. Heating releases H2O and CO2 and causes reactions between the solids. The
dry process uses more energy in grinding, but less in the heating process in the kiln. At
1480˚C, a series of chemical reactions cause the materials to fuse and create cement
clinker pellets. Clinker is poured from the lower end of the kiln and transferred to various
types of coolers to lower the clinker to handling temperatures11. Cooled clinker is
combined with gypsum and ground into a fine gray powder that passes through a 75m
sieve. The result of this process is a fine gray powder called Portland cement12.
Cement Chemistry and Nomenclature
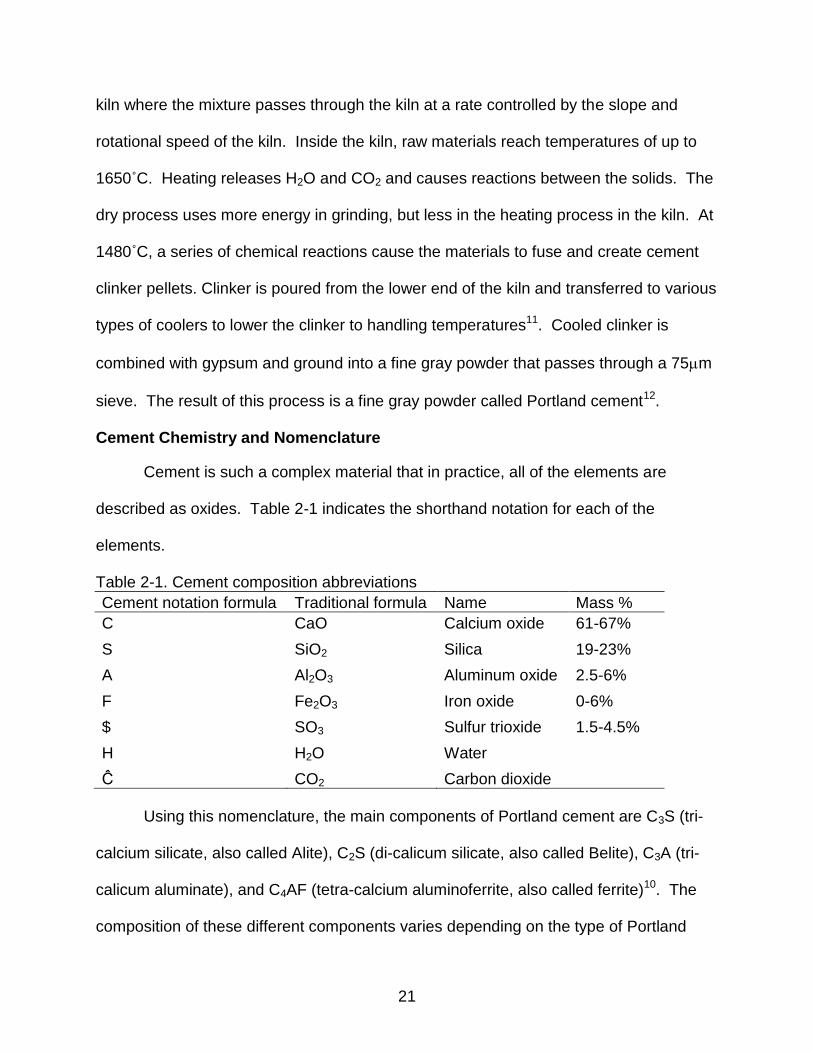
Cement is such a complex material that in practice, all of the elements are
described as oxides. Table 2-1 indicates the shorthand notation for each of the
elements.
Table 2-1. Cement composition abbreviations
Cement notation formula Traditional formula Name Mass %
C CaO Calcium oxide 61-67%
S SiO2 Silica 19-23%
A Al2O3 Aluminum oxide 2.5-6%
F Fe2O3 Iron oxide 0-6%
$ SO3 Sulfur trioxide 1.5-4.5%
H H2O Water
Ĉ CO2 Carbon dioxide
Using this nomenclature, the main components of Portland cement are C3S (tri-
calcium silicate, also called Alite), C2S (di-calicum silicate, also called Belite), C3A (tri-
calicum aluminate), and C4AF (tetra-calcium aluminoferrite, also called ferrite)10. The
composition of these different components varies depending on the type of Portland
22
cement (Type I, II, III, IV, or V). C3S is responsible for the early strength of concrete and
composes 45 to 75% of the total mass. C2S contributes to later age strength and
hydrates and hardens slowly, occupying 7 to 32% of the total mass. C3A releases a
large amount of heat during the first few days of cure and slightly contributes to early
strength development. C4AF hydrates rapidly but contributes little to the strength and is
responsible for the gray color of hydrated cement12.
Hydration Products
The reaction between cement and water produces “hydration products.” During
the reaction of C3S and C2S with water, two important products are formed: CSH
(calcium silicate hydrate) and CH (calcium hydroxide). CSH provides the main source
of concrete’s strength, and has a variable ratio between SiO2 and CaO. It forms a gel
with limited local crystalline domains, but no long range order13. CH is the only
hydration product with a well defined stoichiometry and crystal structure. When C3A
and C4AF react with gypsum, they form two important groups of products: AFt (alumina
ferric oxide trisulphate) and AFm (alumina ferric oxide monosulphate). AFt has the
general formula [Ca3(Al,Fe)(OH)6·12 H2O]2·X3·nH2O where X represents a doubly
charged anion or, sometimes, two singly charged anions12. Ettringite is the most
common and most important member of the AFt phase, in which sulfate is the X. AFm
has the general formula 3 CaO·(Al,Fe)2O3·CaSO4·nH2O and is also known as
monosulfate.
Modeling of CSH
The most abundant reaction product, and main binding phase in cement is the
CSH gel. It governs fundamental properties such as strength, ductility, fracture
behavior, and durability. It has poor crystallinity and is highly variable in chemical
23
composition, nanostructure, and morphology. For this reason, it has been extremely
challenging to characterize at the nanoscale and an ongoing debate surrounding its
exact nature continues. Therefore, numerous models for CSH paste exist.
Powers and Brownyard were the first to systematically investigate cement paste
in the late 1940s. Their model did not distinguish between the different solid phases in
cement paste, but referred to them collectively as “cement gel.” This model can be
described as “volumetric phase distribution in a hardening cement paste,” in which the
water is divided into three types: chemically bound, physically bound, and free water 14.
Chemically bound water is non evaporable below 105˚C and is directly incorporated in
the structure of the hydration products, physically bound water is adsorbed on the
surfaces of the hydration products, and free water is contained in the capillary and gel
pores of the hydrated cement paste.
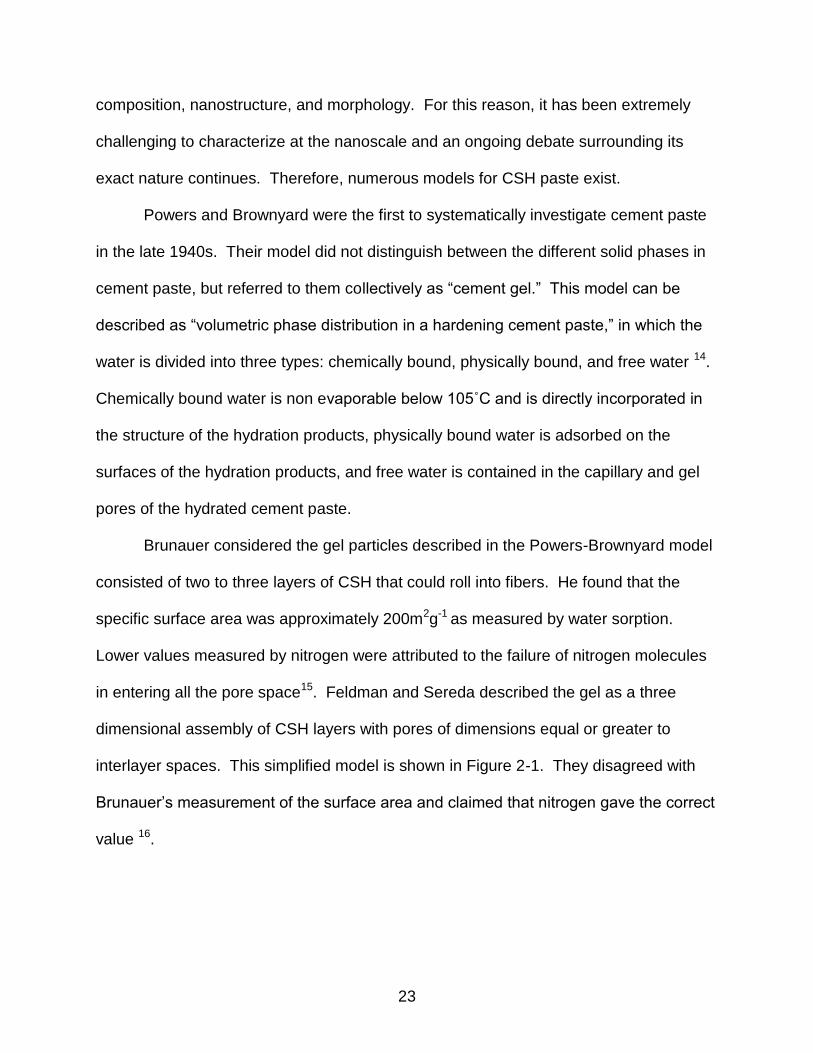
Brunauer considered the gel particles described in the Powers-Brownyard model
consisted of two to three layers of CSH that could roll into fibers. He found that the
specific surface area was approximately 200m2g-1 as measured by water sorption.
Lower values measured by nitrogen were attributed to the failure of nitrogen molecules
in entering all the pore space15. Feldman and Sereda described the gel as a three
dimensional assembly of CSH layers with pores of dimensions equal or greater to
interlayer spaces. This simplified model is shown in Figure 2-1. They disagreed with
Brunauer’s measurement of the surface area and claimed that nitrogen gave the correct
value 16.
24
Figure 2-1. Simplified model for hydrated Portland cement proposed by Feldman and Sereda16
The Jennings and Tennis model considers two forms of CSH: high density and
low density17. Their model suggests surface area measurements using nitrogen are a
result of mostly low density CSH and assumes high density CSH is not accessible by
nitrogen, as shown in Figure 2-2. The main feature of their model is that the CSH is
made of globules, which pack together to form LD and HD CSH structures, and finally
these units pack together to form the microstructure of CSH.
Figure 2-2. Jennings model for LD and HD CSH formed after drying18
25
The crystalline calcium silicate hydrate that is considered to be most similar to
CSH in cement is tobermorite with an interlayer spacing of 1.4 nm19. Taylor’s model
assumes CSH gel consists of a mixture of 14Å tobermorite and jennite domains on the
nanometer scale20. Results of both Fuji and Kondo21 and Cong and Kirkpatrick22 show
evidence that CSH gel exists as a solid solution between tobermorite and Ca(OH)2.
These models are good at describing synthetic CSH phases, while the Taylor model
address CSH obtained through hydration processes of cement. More recently, in 2009,
Pellenq et al. developed a molecular model of cement paste from the bottom up
beginning with tobermorite with an interlayer space of 11 Å23. The model was further
optimized with Monte Carlo and molecular dynamics simulations and validated against
XRD, FTIR, and nanoindentation data. The chemical composition of their model was
(CaO)1.65(SiO2)(H2O)1.75 and is visualized below in Figure 2-3.
Figure 2-3. (A) TEM image of clusters of CSH (B) the modecular model of CSH. Blue and white spheres are oxygen and hydrogen atoms of water molecules, respectively. Green and gray spheres are inter and intra-layer calcium ions respectively. Yellow and red sticks are silicon and oxygen atoms in silica tetrahedra.23
26
Accelerated Testing of Concrete
The hydration process of concrete is a series of complex reactions which occur
rapidly at first and slow down over time. The ultimate strength of concrete, therefore,
cannot be measured immediately so standards have been developed to estimate the
strength, typically after 28 days. Numerous techniques have been developed to
decrease this waiting time, however they have their limits. The 3 main methods
accepted by ASTM C684 are: 1) Warm Water Method; 2) Boiling Water Method; and 3)
Autogenous Method.
The warm water method consists of curing standard cylinders (200mm long with
a diameter of 100mm) in a 35˚C water bath for 24h immediately after molding. The
specimens are then demolded and tested in compression. The main limitation of this
method is that the strength gain is less than half, as compared to 28 day moist cured
concrete at standard conditions, so job site testing may be required24. The boiling water
method consists of standard curing of concrete for 24h, followed by a 3.5h cure in
boiling water at 100˚C, then is tested 1h later. This method may produce products of
hydration that are slightly different from normal curing conditions. In the autogenous
method, specimens are placed in insulated molds made of polyurethane foam
immediately after casting, and are tested 48h later. No external heat is provided. The
strength gain of this method is not high, and is the least accurate method of the three.
Modified techniques for both the warm and boiling water methods have been
demonstrated in the literature. Udoeyo et al. followed a modified boiling method in
which they cured samples in moist conditions for 23h, immersed the samples into
boiling water for 3.5h, then tested the samples at 28.5h for compression24. In addition,
they replaced up to 50% of sand with laterite. The compressive strength increased with
27
the addition of laterite with accelerated samples having between 72 to 84% of the 28
day strength. However, their sample size was relatively small. Naik also used a
modified boiling water method in which samples were moist-cured for 23h then put in
96˚C water for 3.5h, beginning at the 23.5h stage. These samples were tested in
compression at 28h after being allowed to cool for 1h. Naik found that there was little to
no influence on the strength due to admixtures, aggregates, or type of cement.
However, there was some variation in the strength, as 5% of the test results were in
error of 15 to 20% when compared to the actual 28 day strength25.
The standard boiling water technique, ASTM C 684, was validated by Resheidat
and Ghanma on blended cements manufactured in Jordan26. Their results were
compared to other findings using linear regression models, which indicated good
correlation between accelerated and 28 day samples. High values of coefficients of
variation were found for both normal and accelerated samples, but this finding was
expected since the samples were not prepared in the laboratory. Tantawi and
Gharaibeh made cubes that were placed in an oven ramped up to 93˚C in 1h then kept
at this temperature for a total of 6h. The samples were demolded, allowed to cool for 30
minutes,and then tested in compression. The water to cement ratio was varied from
0.45 to 0.6 and two cement doses, 300 and 350 kg m-3, were used27. Good accuracy in
prediction of the 28 day strength was found using the accelerated technique.
Meyer compared 2 data sets from two different locations and time periods in
Wellington and Auckland, New Zealand. A straight line fit and a dynamic linear model
were used to evaluate the data sets, which both indicated smaller residual variances for
the warm water method than the hot water method. This work also suggested that the
28
methods could be improved by the incorporation of cement chemistry into a master
equation and that for super-high strength concrete a linear model is not appropriate28.
While accelerated testing of concrete usually is performed to determine if the
ceramic has met compressive strength requirements, there are many more
considerations for accelerated testing of polymers. The chemistry and structure-
properties of epoxy are completely different than concrete, and will be discussed below.
What is Epoxy?
Epoxy resins are a class of thermosetting polymers that have a broad range of
applications depending on the chemical makeup and curing condition of the epoxy
system. Most epoxy resins are produced by a reaction between epichlorohydrin and
bisphenol A, in which two glycidyl groups, called oxirane or epoxy groups, are attached
to the ends of bisphenol A. The molecular weight of this resulting molecule depends on
the ratio of epicholorhydrin and bisphenol A. In the ring opening reaction, the active
epoxide groups react with a curing agent, or hardener, to form a highly cross-linked,
three dimensional structure. Amine curing agents are the most commonly used and the
structure and number of amino groups determine the rate of crosslinking and final
properties. The reaction between the epoxide group of the epoxy resin with a primary
amine is shown below in Figure 2-4.
Figure 2-4. Reaction between an epoxide and primary amine
While epoxy resins have many applications, this work focuses on their use in
construction materials, specifically FRP repair. FRP (Fiber-reinforced polymer)
29
composites are increasingly becoming the materials of choice for the repair of damaged
concrete structures. These high performance materials, using epoxy as the matrix,
have unique properties that make them especially attractive for use in civil applications
due to their quick cure time, good mechanical strength, and easy processing.
Prediction of the lifetime and performance of the repairs using these materials requires
accelerated testing which can include variables such as temperature, humidity, aqueous
solutions, or UV exposure which will be further discussed.
Effect of Temperature
The physical properties of epoxies are highly sensitive to the effect of
temperature. Increasing the temperature typically produces a decrease in elastic
modulus, reduction in tensile strength, and an increase in ductility. As the temperature
increases past the glass transition temperature (Tg) almost all of the properties related
to its processing and performance are drastically affected29. The Tg is the most
important transition and relaxation phenomenon observed for amorphous polymers. It
is a reversible structural change between a hard and relatively brittle state and flexible,
rubbery state. At lower temperatures, in the glassy state, conformational changes are
severely restricted, but as the temperature increases past the Tg, motion of side groups
begins, followed by large segments, until the entire chain can flow.
Free volume theory can be used to explain the physical changes that happen
during a glass transition process. At the beginning of the glass transition, a part of the
solid polymer turns into a liquid, and the free volume, or the sum of the holes in a
polymer due to atomic packing irregularities, increases. The increase in free volume
corresponds to changes in the interatomic and intermolecular spacing within the
polymer. In general, as the viscosity decreases, the free volume increases. With a
30
decrease in viscosity, or increase in the mobility of polymer chains, there is a change in
the heat capacity. The heat capacity in the liquid phase above the Tg is greater than in
the solid state below the Tg. This property can be measured by numerous techniques
including differential scanning calorimetry (DSC), dynamic mechanical analysis (DMA),
and thermomechanical analysis (TMA).
In DSC, the instrument monitors heat flow, or the energy release on heating,
between a sample and reference . As the heat capacity changes during the transition,
there is also a change in heat flow. DMA works by applying a sinusoidal deformation
(either a controlled stress or strain) to a sample of a known geometry. DMA measures
the ratio of the loss to storage modulus, and the Tg can be seen in the E” or tan delta
curve. Lastly, TMA applies a static force and reports dimensional changes.
Coefficients of thermal expansion can be easily measured with TMA when the sample
carries a zero or negligible load and the material is allowed to freely expand or contract.
TMA is significantly more sensitive than DSC for measuring the Tg of crosslinked
materials. This difference in measurement is manifested by the variables inherent in the
instrument. Since DSC measures heat capacity, the heating rate is a critical
parameter, while in TMA, the sample thickness is a critical component. Therefore,
correlation of the Tg using the two instruments is not possible because both methods
have their own considerations.
The glass transition temperature of epoxies can vary greatly depending on the
curing agent. Table 2-2 shows the change in the glass transition temperature for
diglycidyl ether of bisphenol A (DGEBA) epoxy cured with different curing agents.
There is a significant dependence of the Tg on the molecular weight of a polymer
31
system. A linear polymer has higher mobility at the chain ends than the center of the
molecule because the chain ends are only bonded to one repeat unit, while the inner
repeat units are bonded on both sides. Decreasing the molecular weight of this system
results in an increase in the concentration of chain ends, and therefore the average
mobility of all the repeats units is increased, resulting in a decrease in Tg30. This
relationship has been shown in the Fox-Flory equation in equation 2-1 where K is an
empirical parameter and M is the molecular weight.
(2-1)
Table 2-2. Change in Tg of DGEBA cured with different curing agents31
Curing Agent Tg (˚C)
DETDA 217
DDM 190
DDS 189
TETA 139
Jeffamine-130 65
Jeffamine-230 47
Jeffamine-800 0
Throughout this dissertation, DGEBA, or EPON 826, and Jeffamine D230, or
poly(oxypropylene) diamine (POPDA) were used. EPON 826 has an epoxy equivalent
weight of 178 to 186g/equiv, and Jeffamine D230 has an average molecular weight of
230 g/mol, as reported by the manufacturer. Their chemical structures are found below
in Figure 2-5.
Figure 2-5. DGEBA and Jeffamine D230 chemical structures
32
Effects of Water
Epoxy resins can easily absorb up to 7% of their weight, due to moisture from
humid environments32. This is due to the creation of polar hydroxyl groups from the
epoxide ring opening reaction, and tertiary amines during the reaction, which form its
cross-linked structure. Water can form hydrogen bonds with other water molecules or
polar groups in the polymer. It acts as a plasticizing agent, reducing the intermolecular
forces which hold the macromolecule together.
Soles and Yee33 investigated sub Tg moisture transport in epoxy resins.
Although direct experimental observation remains to be performed to verify some
details, they suggested that water moves through the epoxy through a network of
nanopores, which have an average size of 5 to 6 Å. Polar sites, such as amine
functional groups, regulate transport of water molecules through the nanopores
depending on the orientation of the resin. Figure 2-6 demonstrates how polar sites can
either block or allow moisture to traverse the epoxy resin.
Figure 2-6. Transport of water through nanopore network in epoxy proposed by Soles33
33
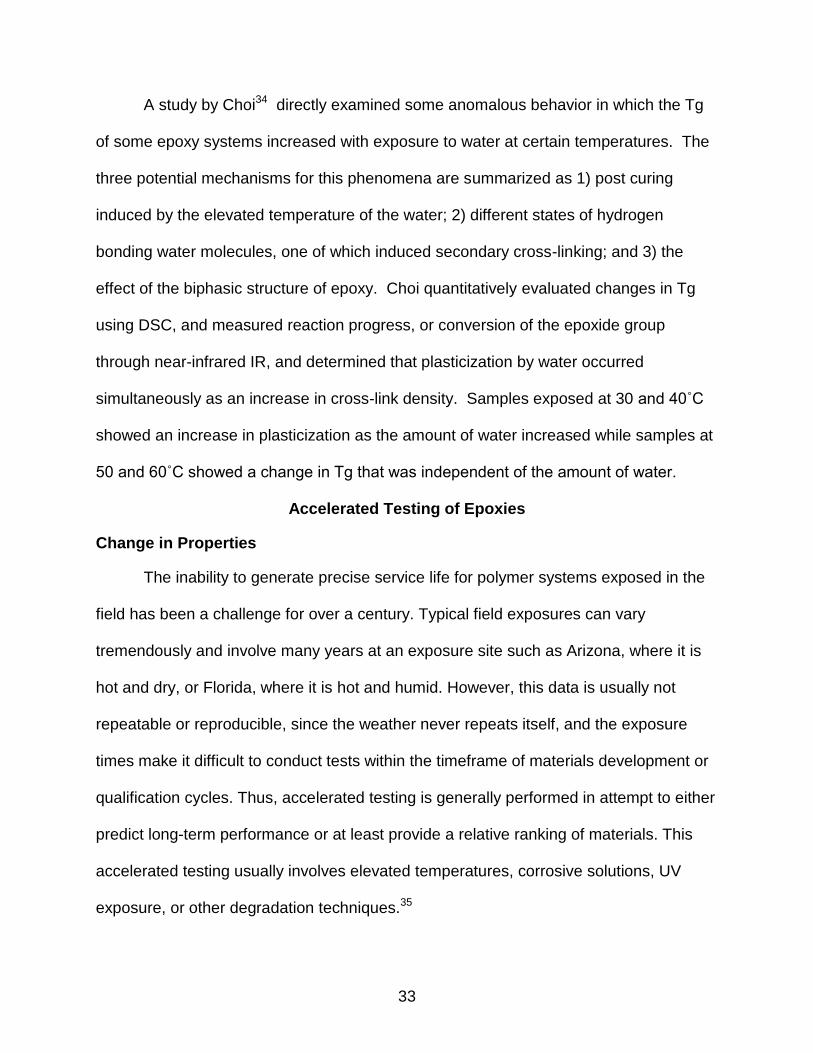
A study by Choi34 directly examined some anomalous behavior in which the Tg
of some epoxy systems increased with exposure to water at certain temperatures. The
three potential mechanisms for this phenomena are summarized as 1) post curing
induced by the elevated temperature of the water; 2) different states of hydrogen
bonding water molecules, one of which induced secondary cross-linking; and 3) the
effect of the biphasic structure of epoxy. Choi quantitatively evaluated changes in Tg
using DSC, and measured reaction progress, or conversion of the epoxide group
through near-infrared IR, and determined that plasticization by water occurred
simultaneously as an increase in cross-link density. Samples exposed at 30 and 40˚C
showed an increase in plasticization as the amount of water increased while samples at
50 and 60˚C showed a change in Tg that was independent of the amount of water.
Accelerated Testing of Epoxies
Change in Properties
The inability to generate precise service life for polymer systems exposed in the
field has been a challenge for over a century. Typical field exposures can vary
tremendously and involve many years at an exposure site such as Arizona, where it is
hot and dry, or Florida, where it is hot and humid. However, this data is usually not
repeatable or reproducible, since the weather never repeats itself, and the exposure
times make it difficult to conduct tests within the timeframe of materials development or
qualification cycles. Thus, accelerated testing is generally performed in attempt to either
predict long-term performance or at least provide a relative ranking of materials. This
accelerated testing usually involves elevated temperatures, corrosive solutions, UV
exposure, or other degradation techniques.35
34
Laboratory weathering experiments are an attempt to simulate and accelerate
real world degradation conditions. Generally these tests involve exposure to
temperatures above those experienced in the field and immersion in water. However, if
the exposure temperature is close to or exceeds the glass transition temperature of the
polymer (Tg), the mechanism of degradation may be different than under the field
condition. Immersion in water can also change the Tg, further complicating the testing.
This can make it difficult to compare results obtained from accelerated testing to those
from the field.
Numerous studies have shown a decrease in the Tg with exposure to elevated
temperature and/or water. Ellis and Karasz measured the Tg for a number of epoxy
systems, and found that the reduction in the Tg for stoichiometric compositions could be
matched with a compositional model for the Tg depression 36. Notably, they found that
for epoxy-rich samples that were exposed to water at 90˚ C, the Tg after drying was
higher than the original Tg. This was explained by the formation of a glycol unit by
reaction of the water with the epoxide group. However, an elevated Tg was not found
with exposure at room temperature. Amine-rich samples showed a greater depression
in the Tg than was predicted in the model. In a follow up article, they went on to claim
that there is no evidence for tightly bound water and that it is unlikely that water disrupts
the hydrogen bond network in the epoxy resin 37.
In contrast, Zhou and Lucas claimed two types of bound water can exist in epoxy
resins 38. Type I bound water acts as a plasticizer, causing a decrease in Tg and Type II
bound water promotes secondary cross linking with hydrophilic groups and limits Tg
depression. In their epoxy system they found an initial depression of the Tg that was
35
fully recoverable upon drying. This same phenomena was also reported by
Bockenheimer et al. in a series of papers which examined a high and low crosslinked
system under thermal and hydrothermal aging 39. Under hydrothermal conditions
reversible phase separation occurred for both systems as well as the appearance of a
new, second Tg. In a follow up article, Fata and Possart found that the primary Tg of the
thermally aged epoxy initially decreases then remains constant and a substantially
lower, secondary Tg is formed that increased with time, as can be seen in Figure 2-7.
This secondary Tg vanishes upon heating above the primary Tg. Reheating this system
does not recover the primary Tg, and is explained by irreversible plasticization due to
bonded water40. Unfortunately DMA experiments were not performed to verify these
conclusions, and it is possible that the heating process was not to a high enough
temperature or a long enough time to remove the water.
Figure 2-7. DSC measurement of a highly crosslinked epoxy during hygrothermal
exposure aging at 60˚C40
Fredj et al. also found the development of two phases with exposure of epoxy to
water, as evidenced by two peaks in the DMA (dynamic mechanical analysis) tan
36
curve in Figure 2-8. The primary Tg slightly increased over time and the secondary Tg
decreased. This was explained by high and low crosslinking zones. They also found a
decrease in the Young’s modulus which remained constant after the saturation limit was
reached 41.
Figure 2-8. Evolution of tan () as a function of temperature for an epoxy with and without water41
Papanicolou et al. characterized the mechanical and viscoelastic properties of
a DGEBA / DETA (diglycidylether of bisphenol / diethylenetriamine) system using 3
point bend DMA in combination with differential scanning calorimetry (DSC). As
expected, there was a decrease in flexural strength and modulus with exposure at
increased time and temperature42. The samples’ Tg increased and tan peak
decreased with increased exposure time, and was explained by the secondary network
theory proposed by Zhou and Lucas. A decrease in the shear strength of epoxies aged
at 85˚C and 85% relative humidity was found by Lin et al., who explained their results
through the common belief that adsorbed moisture attacks the crosslinks in the epoxy
37
network. However, as shown in their Fourier transform infrared spectroscopy (FTIR)
data the epoxy was not fully cured before exposure43.
Other studies have performed accelerated testing of epoxies in different
solutions. Yang et al. investigated a commercial epoxy system during exposure to
water, salt, and alkali environments. As expected, exposure led to a decrease in the
tensile strength, modulus, and tan delta peak height with increased exposure. A slight
depression in the Tg was found initially after which there was insignificant change. Alkali
environments showed the most reduction in properties 44. A different study exposed a
blended epoxy system to dichloromethane, aviation fuel, propylene glycol, hydraulic
fluid, DI water, urea, and simulated seawater at 65˚C45. The blended epoxy system
showed virtually no change in shear strength when exposed to propylene glycol and
hydraulic fluid. Epoxy systems exposed to other solutions showed a reduction in
properties over time, with the highest degradation due to dicholoromethane.
Cyclic exposure is another method of accelerated testing of materials and is
often coupled with UV exposure. Recently, Singh et al. found that alternating 3 hour
cycles of UV radiation and water vapor condensation at 50˚C degraded the flexural
strength of epoxy up to 81% and induced the removal of surface layers 46. Exposure to
a constant relative humidity of 80% at 50˚C resulted in a 47% reduction in the flexural
strength, but interestingly, increased the flexural modulus, while the cyclic exposure
decreased the modulus. Shi et al. exposed Epon 828 to alternating cycles of UV at 55˚C
and water spray at 25˚C with varying times47. Besides a depression of the Tg with
increasing relative humidity, higher indentation recovery using AFM was found at higher
relative humidities. They explained this result by relaxation of the plasticized network.
38
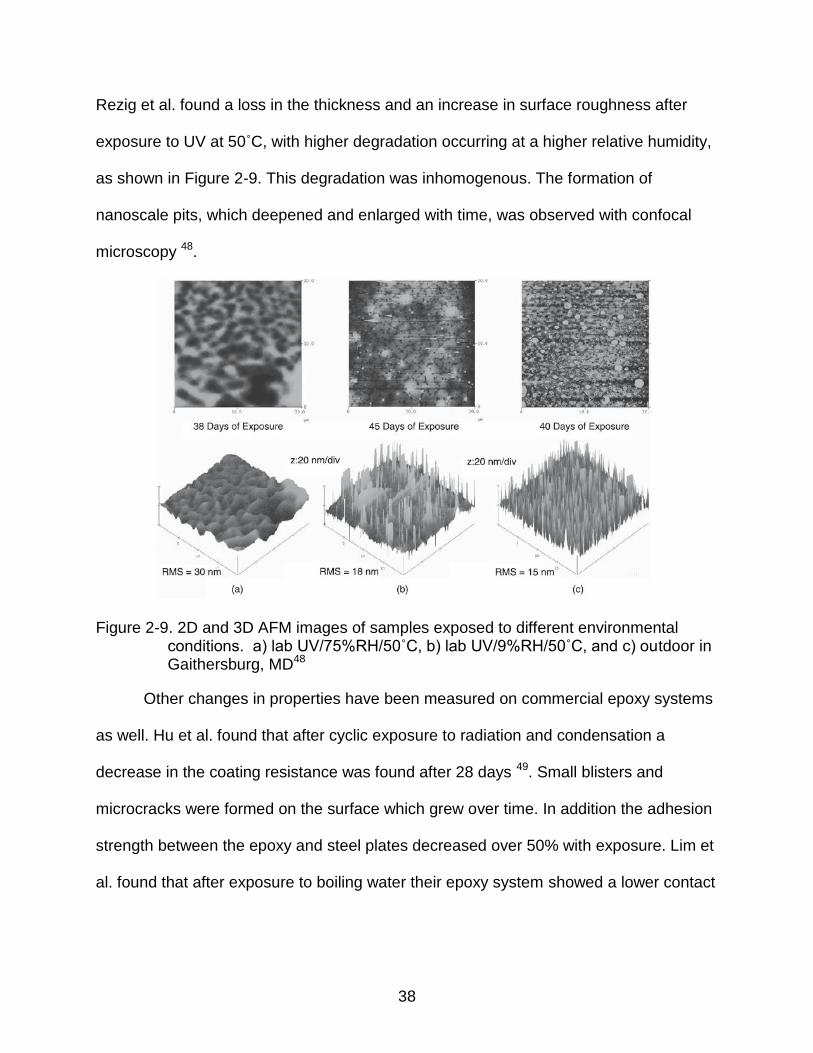
Rezig et al. found a loss in the thickness and an increase in surface roughness after
exposure to UV at 50˚C, with higher degradation occurring at a higher relative humidity,
as shown in Figure 2-9. This degradation was inhomogenous. The formation of
nanoscale pits, which deepened and enlarged with time, was observed with confocal
microscopy 48.
Figure 2-9. 2D and 3D AFM images of samples exposed to different environmental conditions. a) lab UV/75%RH/50˚C, b) lab UV/9%RH/50˚C, and c) outdoor in Gaithersburg, MD48
Other changes in properties have been measured on commercial epoxy systems
as well. Hu et al. found that after cyclic exposure to radiation and condensation a
decrease in the coating resistance was found after 28 days 49. Small blisters and
microcracks were formed on the surface which grew over time. In addition the adhesion
strength between the epoxy and steel plates decreased over 50% with exposure. Lim et
al. found that after exposure to boiling water their epoxy system showed a lower contact
39
angle, surface potential, and surface resistivity. They explained these findings by the
formation of carboxyl groups which cause rapid deterioration of electrical properties 50.
In summary, most research found a change in the glass transition temperature
and a decrease in properties with exposure to temperatures up to 100˚C, with and
without water or other liquids. A summary of the literature in this area can found below
in Table 2-3 in which the type of epoxy, exposure conditions, exposure time, and
property changes can be found.
Table 2-3. Summary of changes in properties for accelerated testing of epoxy systems
Materials Exposure conditions Exposure
Time Property Changes
DGEBA/mPDA, TGDDM/DDS, Fiberite 934:TGDDM/DDS
38a
Water at 45, 60, 75, and 90 C
1530 h Initial decrease in Tg, then
increase. Tg fully recoverable upon drying
DGEBA/DETA39
40 C and 60 C in air 112 days Decrease of Tg, recoverable on
drying
DGEBA/DETA40
Water at 40C and
60C 79 days
Increase in Tg for low crosslinked epoxy, the high crosslinked epoxy shows a new second Tg with aging and reversible phase separation.
DGEBA/TETA42
in water at 60 and
80C 1536 h
Increase in Tg with exposure, decrease in tan d
Amino amide-epoxy and polyamide-epoxy with 25%
filler41
DI water and Saline at RT
200 days Increase in Tg1 decrease in Tg2,
35-40% decrease in modulus
DGEBA/DDA51
Exposure of epoxy to air and water at 60C
100 days New secondary glass transition and reversible phase separation
Epoxy/Ni-Au composite43
85C 85%RH 550 h 50% loss of shear strength
Sikadur 30: aromatic hydrocarbon and aliphatic
amine44
Exposure of epoxy to water, alkali, NaCl,
23 C or 60 C 2years
E loss of 30-60%,tensile loss of 40-70%
Blend of epoxies and
amine curing agents45
Dichloromethane, aviation fuel,
propylene glycol, hydraulic fluid, DI
water, urea, simulted seawater at 65 C
730 days
Aqueous based system showed a 30% decrease in strength,
propylene glycol and hydraulic fluid virutally no change
Epon 862/Epikure 327446
50C 80%RH, cycles
of UV and condensation at 50 C
4098 h
Decrease in flexural strength up to 47% in moisture, 81% in UV /
condensation
Epon 828/Epikcure 311547
Various wet and dry
cycles at 25 C 56h
Higher indentation recovery at higher RH
UV radiation at 50C with 9% or 75% RH
40
Materials Exposure conditions Exposure
Time Property Changes
Dow DER 332/bisaminomethyl
cyclohexane48
140 days
Up to 38% loss in thickness under chamber, 18% outdoor, RMS
increase up to 0.7um
Commercial 2 part epoxy varnish
49
UV radiation at 60C for 8 h then
condensation at 50C for 4 h
35 days Decrease in coating resistance
after 28 days
DGEBA/MNA with BDMA accelerator
50
Boiling water 1000h Decrease in contact angle, surface
potential, surface resistivity
Degradation Mechanisms of Epoxies
In the literature many mechanisms are suggested to explain results of
accelerated degradation experiments. One of the most common explanation for the
decrease in properties is the plasticization of the epoxy network. Water swells the
polymer and reduces the polymer-polymer chain secondary bonding, resulting in a
decrease in Tg.
Doyle and Pethrick found that for epoxy exposed to water based solvents there
was a depression in the Tg. This indicates reduced cohesive forces between polar
chains and an increase in polymer motion45. For non-polar solvents, plasticization was
coupled with swelling of the resin and was the main suggested mechanism for the
change in bond strength. Bockenheimer et al. also cite water as the source of
plasticization of the epoxy network in which the water molecules interrupt the physical
crosslinks by interacting with the polar groups of the epoxy.
Another research group examining epoxies determined that a splitting of the tan
peak correlated to the formation of a biphasic structure. The lower temperature tan
peak was due to the water plasticized fraction of the specimen, while the higher
temperature peak was due to the dried fraction of the specimen which reflects the
Table 2-3.Continued
41
amount of crosslinking44, 52. They also mention the competing effects of cure
progression and plasticization in the early periods of exposure, followed by hydrolysis at
longer periods of exposure. Frigione et al. also mentions the concept of plasticization
competing with post cure crosslinking at early periods of exposure53. The lowering of
the Tg with the absorption of moisture allows the polymer chains to become mobile
which allows a limited displacement of chain segments which promote post curing. This
could explain higher values of Tg for longer periods of time and higher exposure
temperatures accompanied with an initial increase then decrease in ductility over time.
In general, while many authors cite plasticization as a mechanism for the decrease in
properties, they do not confirm that the effect is reversible. Thus, the claims of
plasticization as a mechanism are somewhat tenuous and overall require further
investigation.
Another commonly cited explanation for a decrease in properties is centered
around the idea that multiple types of bound water can exist in the epoxy network. NMR
and FTIR have been used on epoxy resins to determine that water can be bound to the
epoxy resin with a mobility between solid and free water38a, 54. In a series of papers,
Zhou and Lucas questioned the polymer-diluent model’s ability to accurately predict the
glass transition temperature of epoxy systems because the depression of the Tg of
epoxies is not a simple matter of the amount of water uptake of the material. They
suggested that the Tg is influenced by a dual mechanism process. Type I bound water
causes a depression of the Tg due to interruption of interchain bonds and Type II bound
water offsets that drop through secondary crosslinking resulting from a water-resin
interaction. Type I bound water forms single hydrogen bonds while Type II forms
42
multiple hydrogen bonds and has a higher activation energy, making it harder to remove
from the resin. Papanicolou et al. used the two types of bound water model to explain
their findings. Exposure of their epoxy to DI water at elevated temperatures resulted in
no variation in E’, but an increase in the Tg, while the strength was decreased with
exposure 42.
Li et al. used FTIR to analyze water absorbed into 6 different epoxies and fit the
hydroxyl stretching region with four different components. These regions corresponded
to water molecules without a hydrogen bond, one hydrogen bond, and double hydrogen
bonds (loose or tight)55. 2D correlation analysis suggested that diffusion was
accomplished by water molecules with loose double hydrogen bonds and the impeding
step originated from the rearrangement of local chains to open additional polar sites and
the energy required by water molecules to dissociate from the epoxy network.
Wu and Siesler used 2D ATR-FTIR to investigate the diffusion of water in epoxy
networks at room temperature.56 The basic concept of 2D IR experiments are
somewhat similar to 2D NMR experiments, but since vibrational relaxation rates are
many orders of magnitude faster than spin relaxations, the double Fourier
transformation technique developed for 2D NMR experiments is not really applicable. In
2D IR experiments an external perturbation, such as a change in concentration, is
applied to the sample which selectively induces time-dependent reorientations of
electric dipole transition moments associated with the individual modes of vibration in
the system57. Individual dipole transition moments respond differently to the external
perturbation and have unique reorientations rates which can be used to identify highly
overlapped IR bands. Wu et al. fit the hydroxyl stretching region with 3 components:
43
weak water-water hydrogen bonds, strong water-water hydrogen bonds, and water-
epoxy hydrogen bonds as shown in the shaded regions in Figure 2-10. They explained
a positive shift in the OH stretching band as an indication of interactions between water
molecules and the carbonyl oxygen in the epoxy matrix, as a result of water diffusion
into the epoxy network. Over time the epoxy structure limits the movement of water
molecules and forces the water molecules to form clusters with other water molecules.
Figure 2-10. Asynchronous 2D correlation IR spectra of water in epoxy in the spectral range 2800–3700 cm-1 56
2D FTIR spectroscopy was also used by Musto on epoxies exposed to thermal
degradation at 200˚ C58. He found the disappearance of hydroxyl, CH2, and CH groups
with increasing exposure. The oxygen attack led to the formation of two groups, amide
and aldehyde/ketone groups.
Oxidation is another mechanism suggested for degradation of epoxy resins.
Monney et al. exposed an epoxy system to UV radiation at 42˚C in air and confirmed
the existence of a thin photo-oxidation layer that evolved at a constant rate 59. This was
monitored by ATR-IR which indicated the loss of CH and CH2 groups which form
44
radicals which aid in the production of carbonyl groups, particularly ketone and ester
groups. Hong performed thermal degradation of epoxy films on various metal
substrates and also found the formation of carbonyl groups and the degradation of CH2
groups using IR spectroscopy3b. He also found evidence for cleavage of nitrogen-
phenyl bonds in the epoxy backbone. XPS fitting of the C1s spectra indicated carboxyl
species were produced and that the degradation occurred more rapidly on the copper
substrate than the steel or aluminum. Lim and Lee also found the presence of carboxyl
groups after exposure to boiling water 50. After exposure they found an increase in the
O1s peak height and changes in the C1s peak, along with a decrease in contact angle,
indicating a change in the hydrophilic property of the surface. Meiser et al. also found
that exposure in air at 60˚ and 120˚C with moisture created alkyl radicals which
produced carbonyl groups, amide groups, and chain scissions60. Chain scission was
indicated by a decrease in the stretching band of ether groups at 1034 cm-1 as shown in
Figure 2-11. In this image, the solid lines are on the surface and the dashed lines are at
350 m below the surface. Maljati et al. found that water exposure resulted in the
oxidation of CH2 groups which leads to the formation of carboxylic acids, while the
combination of water and UV light caused hydrolysis 61. Similar short network fragment
products were found in both works.
45
Figure 2-11. ATR-IR spectra of various stoichiometries of epoxy and amine curing agent
after 25 days of aging at 120˚C on the surface and a depth of 350 m60
Hydrolysis is an irreversible process that results in chain scission in epoxies
reported in the literature as a result of exposure to water. After 6 day of exposure to DI
water at 90˚C, Xiao et al. found that the intercrosslinking chain segment containing
nitrogen was cut or leeched out during the aging process. This XPS result was
confirmed by FTIR results which found the absence of a characteristic peak of the DDA
curing agent. They suggested that water interacted with the tertiary amine groups in the
resin to form N-H and –OH bonds in the polymer chain62. Fata and Possart also
examined a DDA cured system and discovered evidence of both plasticization and
hydrolysis. They found that thermal aging at 60˚C did not cause any chemical
modifications, but a new phase was formed that was reversible upon heating above the
Tg. Hydrothermal aging also produced a new phase, but simultaneously, hydrolysis
cleaved crosslinks specific to DDA-cured epoxy. The hydrolysis cleaved only imino-
ether like crosslinks, but amine-like or ether-like crosslinks were unaffected51. This
mechanism is depicted below in Figure 2-12, with the corresponding wavelengths for
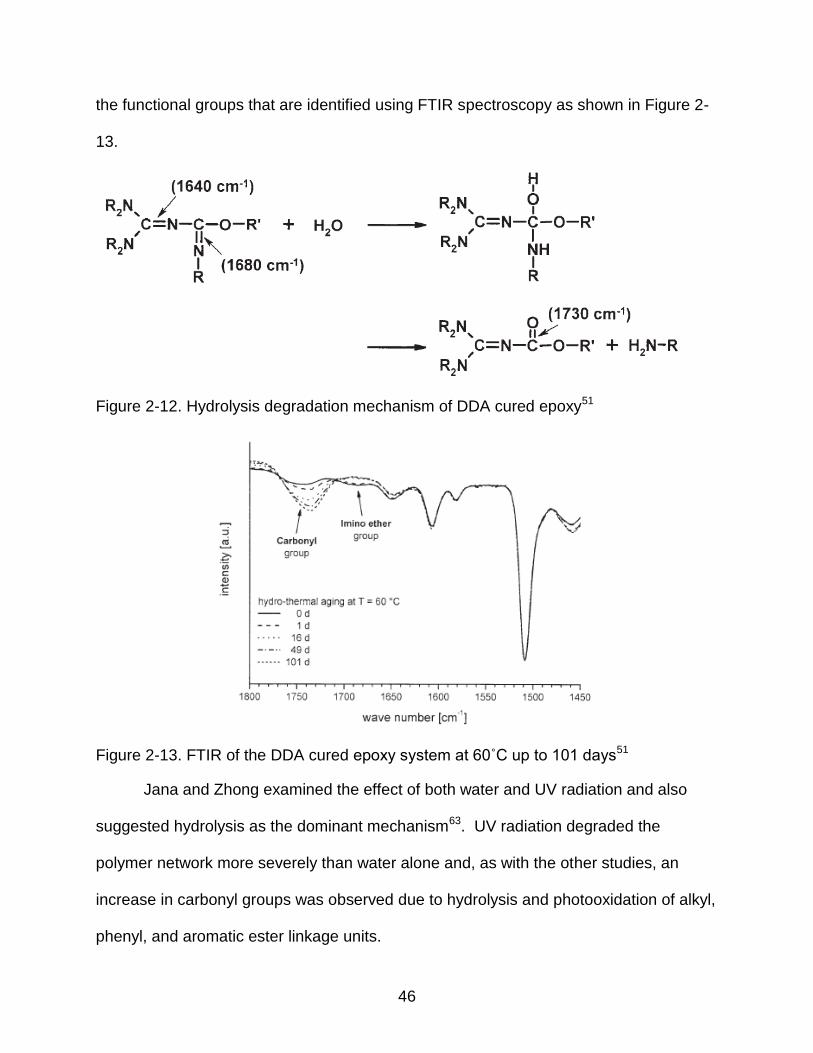
46
the functional groups that are identified using FTIR spectroscopy as shown in Figure 2-
13.
Figure 2-12. Hydrolysis degradation mechanism of DDA cured epoxy51
Figure 2-13. FTIR of the DDA cured epoxy system at 60˚C up to 101 days51
Jana and Zhong examined the effect of both water and UV radiation and also
suggested hydrolysis as the dominant mechanism63. UV radiation degraded the
polymer network more severely than water alone and, as with the other studies, an
increase in carbonyl groups was observed due to hydrolysis and photooxidation of alkyl,
phenyl, and aromatic ester linkage units.
47
A different mechanism was suggested by Hu et al. who exposed their
commercial epoxy to UV and water49. They hypothesized that the water and oxygen
exposure created soluble degradation products from the epoxy which penetrated into
the network along with water to form osmotic cells. The cycling of the UV and water
caused osmotic pressure effects which led to the formation of blisters which in turn
ruptured, which correspond to a deterioration of properties.
Table 2-4 gives a brief summary of the degradation mechanisms for epoxy
systems. Essentially, at lower exposure temperatures in the presence of water
plasticization is proposed as the dominant mechanism, however, true plasticization
requires reversibility, which is generally not demonstrated in these studies. At higher
temperatures and with UV exposure oxidation and hydrolysis are cited as the primary
degradation mechanism.
Table 2-4. Summary of mechanisms of degradation for accelerated testing of epoxy systems
Materials Exposure conditions
Exposure Time
Mechanism
Blend of resins and amine cure agents cured on aluminum
45
Dichloromethane, aviation fuel,
propylene glycol, hydraulic fluid, DI
water, urea, simulted seawater
at 65 C
730 days Plasticization/Swelling
DGEBA/DETA39-40
Water at 40C and
60 C 79 days Plasticization
4,40-isopropylidenephenol-epichlorohydrine with an
aliphatic amine hardener52
DI water at 23, 40, 60 C
24 months Plasticization competing with
postcuring in early stages, followed by hydroylsis
Sikadur 30: aromatic hydrocarbon and aliphatic
amine44
Exposure of epoxy to water, alkali,
NaCl at 23 or 60 C 2 years Post cure vs plasticization
Sika S50, M16, M2053
DI water at RT 28 days
Plasticization and water-substrate interaction vs
crosslinking
DGEBA/mPDA, TGDDM/DDS, Fiberite 934:TGDDM/DDS
38a
Water at 45, 60, 75, and 90 C
1530 h
Type I bound water forms a single hydrogen bond with epoxy, Type II bound water
forms multiple hydrogen bonds.
48
Materials Exposure conditions
Exposure Time
Mechanism
DGEBA/mPDA, TGDDM/DDS, Fiberite 934:TGDDM/DDS
38b
Water at 45, 60, 75, and 90 C
1530 h
Type I bound water plasticizes the network, Type II bound water
forms a secondary crosslink.
DGEBA/TETA42
in water at 60 and
80 C 1536 h
Single or double hydrogen bonds, Type I plasticizes, Type II
forms secondary crosslink
Novolac epoxy resin56
DI water at RT 16 min
Carbonyl and hydroxyl groups form hbonds with water at low
concentrations, but at high concentrations water clusters
DGEBA, TGAP, TGDDM, DDS, DDM
55
20 C and 75 C in DI water
13 h Loose double bound water
molecules diffuse throug the network
TGDDM/DDS58
200 C in air 1,000 min
2 competitive pathways forming amide or aldehyde and/or
ketone. Molecular breakdown with dissapearance of hydroxyl,
CH2, and CH groups.
DGEBA/MTHPA59
UV and 42 C
250, 500, and 1000 h
Oxidation of matrix and formation of carbonyl groups.
Magnobond 6388-3:TGDDM/amidoamine
3b
Cu, Al, and steel at 150 C
1, 45, and 90 h
Nitrogen - phenyl groups broken and carbonyl and amides formed
DGEBA/MNA with BDMA accelerator (Lim and Lee
2000) Boiling water 1000 h
Oxidation of matrix and formation of carbonyl groups.
DGEBA/DETA60
90%RH, 60 C
120C 300 days
Oxidation, hyperperoxide decomposition and Cope
elimination, resulting in chain scission.
Phenoxy resin61
UV and salt water
cycles 100 h
Water cause oxidation of CH2 groups with formation of
carboxylic acids. UV and water caused hydrolysis of phenyl
formates.
DGEBA/DDA62
DI water at 90 C 6 days Chain scission through
hydrolysis
DGEBA/DDA51
Exposure of epoxy to air and water at
60 C 100 days
Plasticization and Hydrolysis cleaves imino-ether crosslinks
Epon 828/Epikure and reactive graphite nanofibers
63
water at 60C and UV
30 days Hydrolysis
Commercial 2 part epoxy varnish
49
UV radiation at 60C for 8 h then condensation at
50C for 4 h
35 days Soluble degradation products
penetrate the matrix with water, which forms osmotic cells.
Table 2-4. Continued
49
Accelerated Testing of FRPs
Change in Properties
The presence of the fiber in a composite can have a strong effect on the aging
behavior of the system compared to neat epoxies. Ramirez et al. exposed their carbon
fiber epoxy composite to salt water and DI water at 40˚ and 60˚C and found a decrease
in Tg up to 19˚C, a 50% decrease in the flexural strength, 25% decrease in the
transverse strength, and an 18% decrease in the modulus6d. They claimed that since
carbon fibers do not absorb moisture, absorption took place at the interface through
wicking and possibly through cracks. Since concrete was not part of the study, they only
examined fiber-matrix interactions. Nakada and Miyano’s results confirmed the
irreversible loss in properties with exposure in their CFRP-epoxy system64. However,
they found that the vinylester CFRP systems could regain their flexural strength upon re
drying. Adams and Singh found all but one of their epoxy composites had a
recoverable loss in shear modulus and interlaminar shear stress5. The one composite
that was not recoverable did not exhibit degradation in thermal conditioning, but only
with exposure to steam in the form of delamination along the fibers. This set of
composites was not post-cured, unlike the other systems, so it was most likely more
easily plasticized. Unfortunately, chemical analysis was not performed in the study.
Another study by Zhang et al. showed reversible property loss of flexural strength,
modulus, and interlaminar shear strength after exposure to boiling water at 100˚C for 2
days, then drying at 105˚C for 1 day65.
When exposed to other solutions, such as salts or alkali, FRP composites
showed similar reduction in properties. Chen et al. exposed two FRP systems (E-glass
/ vinylester and carbon / epoxy) to various salt solutions under cyclic exposure at
50
different temperatures and found reductions in tensile strength and interlaminar shear
stress66. The solution containing 2:20:2 of NaOH, KOH, and Ca(OH)2 showed the most
degradation of all the solutions although the epoxy-CFRP samples showed better
resistance to the environmental conditions. Micelli and Nanni examined FRP rods
consisting of carbon fibers and epoxy/vinylester matrices under cyclic environments
including alkaline solution, elevated temperatures, and UV irradiation67. Alkali aging
resulted in up to 40% loss in shear strength, but almost no loss after environmental
cycles of freeze-thaw, high relative humidity, high temperature, or UV radiation. The
samples lost minimal tensile strength in alkali aging and environmental cycles. The
authors recognized a major limitation of the work being the absence of stress during the
accelerated aging processes. Murthy et al. exposed vinyl ester and epoxy systems to
artificial seawater at room temperature for several weeks. The flexural, tensile, and
interlaminar shear strength all decreased with increased exposure with the epoxy
system exhibiting more degradation than the vinyl ester based composites68.
Some studies showed little to no change in properties after environmental
exposure. The epoxy CFRP composites of Lee and Peppas exhibited no change in Tg
with exposure to water at various temperatures69. At 80˚C the interfacial shear strength
of the DGEBA system was strongly reduced, while the TGDDM system was not
significantly degraded in any of the exposure systems. Ray found the effect of changing
temperature and humidity had little impact degrading the ILSS and shear strength of his
GFRP epoxy/polyester composites70. No chemical analysis was performed, so it is
difficult to assess if the samples were truly degraded at 50˚ and 60˚C.
51
Some studies showed that exposure to accelerated aging conditions had no
effect on longitudinal properties, but the transverse directions were significantly
degraded. Kumar et al. performed cyclic exposure of condensation and UV light on a
commercial CFRP, with continuous oriented fibers, known as IM7/997 for a period of
1,000 hours. They found no effect on the modulus or Poisson’s ratio, but a large
reduction in the transverse tensile strength71. No real changes were found in the
longitudinal properties, but the authors warned that over longer periods the accelerated
conditions would lead to so much matrix erosion that even the longitudinal properties
would be affected. Based on the principles of the rules of mixtures for composite
materials, the modulus of the composite will be higher than the modulus of the matrix in
the longitudinal direction, so no decrease in the transverse tensile strength or modulus
is expected. For composites tested in the longitudinal direction the total load sustained
by the composite, Fc, is equal to the loads carried by the matrix phase, Fm, and the fiber
phase Ff as shown below in equation 2-172.
Fc = Fm + Ff (2-1)
Hulat et al. also found no real changes in longitudinal properties of epoxy GFRP
and CFRPs exposed to wet/dry cycles and salt solutions73. Also, UV radiation and salt
solution produced no adverse effects on the ultimate failure stress while water and 60˚C
exposure produced some degradation of the composites. However, there was a
relatively large amount of error reported in this work, with a coefficient of variance above
10% for many samples. Boualem and Sereir performed a predictive study on the
mechanical degradation properties of a graphite epoxy under hygrothermal aging using
quadratic failure criterion in stress space74. They found that hygrothermal stresses
52
reach their maximum values at first times of moisture diffusion and longitudinal direction
properties are unaffected, while in the transverse direction the properties are
significantly reduced.
Change in Properties of FRPs with Concrete
Similar trends can be found in the literature regarding accelerated degradation of
epoxy FRPs bonded to concrete. Benzarti et al. examined CFRP and unidirectional
carbon fiber sheets with four different epoxies bonded to concrete under conditions of
40˚C and 95% RH, and found a decrease in pull off strength with exposure, seen in
Figure 2-1475. This decrease was not consistent with data from shear tests, which did
not show any change and was explained by the evolution of the interfacial load transfer
which counterbalanced the effect of joint weakening. The aged specimens showed
greater strain levels in the free edge region, and over time the load was progressively
redistributed over a larger length of the lap joint. However, the concrete substrates
underwent a surface treatment and were either sandblasted or diamond ground, which
could lead to a more complex interface. They also found a drop in the Tg for one type
of epoxy, which became more severe over time, while another epoxy system did not
exhibit any loss. Some samples of concrete also underwent carbonation treatment.
These samples showed higher initial strength and less degradation with exposure than
untreated samples.
53
Figure 2-14. Change in pull off strength of bonded interfaces of concrete composites after 628 days75
A different study by Mufti et al. examined GFRPs made of E-glass and
vinylesters used in repair conditions in Canada for 5 to 8 years They were exposed to
the scattered radiation from the bulk of powder samples, typically in a KBr matrix. The
limitation of this technique is that there is no linear relation between the band intensity
and concentration, so quantitative analysis is very complicated.
In this section of work, the ATR technique was used to quantitatively analyze the
bonding between the epoxy analogs and concrete. FTIR samples were analyzed using
a hemispherical ZnSe crystal with a multi angle attachment on a Magna-IR E.S.P.
System 760 Spectrometer with 128 sample and reference scans at 4cm-1 resolution
from 600 to 4000 cm-1. The spectra were ATR corrected using OMNIC 6.1 software.
Solid powder samples were placed in firm contact with the ZnSe crystal by placing the
72
powder on a metal plate which was then raised by turning a screw until the powder was
touching the crystal and further pressure could not be applied by hand. Liquid samples
were pipetted onto the crystal and no further pressure was required.
NMR Theory and Technique
Nuclear Magnetic Resonance (NMR) spectroscopy is a nondestructive technique
and was first successfully used on cementitious materials in the early 1980s 96. It is
based on analysis of the interaction between an oscillating radio frequency with a
collection of atomic nuclei in the presence of a strong magnetic field.
In NMR, experiments are not performed on the electrons of atoms, but on the
nuclei. Nuclei with an odd numbered mass, such as 1H and 13C, have a spin. The
number of orientations for the specific nucleus is determined from quantum mechanics
where a nucleus of spin l has 2l + 1 orientations. In the case of 1H and 13C, when an
external magnetic field is applied, the two energy levels split. The initial populations of
the energy levels are described by the Boltzman distribution, where the fractional
number of particles Ni/N, occupying a set of states i, possessing energy Ei is
(3-2)
KB is the Boltzman constant, T is temperature, gi is the number of levels having energy
Ei, and Z(T) is the partition function. The lower energy levels will contain slightly more
nuclei than the higher level as a result. The frequency of radiation required to excite
these nuclei into the higher level is determined by the difference in energy between the
energy levels. This precise resonant frequency is dependent on the magnetic field
experienced by the nucleus, and can be affected by electron shielding, which is
dependent on the chemical environment. Typically the proton reference frequency is
73
measured relative to the frequency of tetramethylsilane (TMS) for ease in comparing
data. The chemical shift is defined as nuclear shielding / applied magnetic field and is
expressed as δ = (ν-ν0)/ν0 where TMS is set to ν0. The location of the chemical shift
reveals fundamental information regarding the local structure of materials. The
numerical value of the chemical shift is so small that it is common to multiply the value
by 106 and then express its value in parts per million (ppm).
While NMR can yield useful data for liquid samples, it is more challenging to
perform on solids. A broadening of the resonances of NMR spectra for solid state
samples occurs because most atoms can only undergo restricted vibrations and
rotations at room temperature, each in a slightly different electronic environment, which
can make interpretation almost impossible. Magic Angle Spinning (MAS) was first used
successfully in 1958 by Professor Edward Andrew, which allowed him to obtain high
resolution spectra of solid state samples. In MAS, the sample is spun at a high
frequency (between 5 and 60 kHz for commercial probes) at the magic angle of 54.74˚
with respect to the direction of the magnetic field. Dipolar and quadrupolar interactions
along with chemical shift anisotropy can be averaged out using MAS to yield spectra
with much sharper signals97.
In one dimensional NMR, the signal is recorded as a function of one time
variable, and then Fourier transformed to produce a spectrum that is a function of one
frequency variable. In two dimensional NMR, the signal is recorded as a function of two
time variables, t1 and t2, and then Fourier transformed twice to give a spectrum that is a
function of two frequency variables.
74
For a 1D experiment, right after the pulse sequence, data is acquired. A 2D
experiment involves a few more steps. In the first part of this experiment, called the
preparation time, the sample is excited by 1 or more pulses. The group of pulses may
be purely radio frequency, or may include magnetic gradient pulses. When a pulse is
applied, the magnetic moment of the nuclei rotates away from alignment of the external
magnetic field, along the +z direction, down towards the x-y plane. This resulting
magnetization is allowed to evolve for the first time period, t1. Then another pulse or
series of pulses is applied, called the mixing time, in which magnetization is transferred
from the first nucleus to second one. Finally, the signal is recorded as a function of the
second time variable, t2.
1D NMR experiments were conducted at two locations: College de France in
Paris, France and Sandia National Labs in Albuquerque, New Mexico. The instrument
in Paris recorded 1H spectra using an Advance III Bruker spectrometer operating at at
ωL=700MHz . Magic angle spinning (MAS) was applied with a spin speed of 60 khz,
with a 5s repetition delay. 13C NMR experiments were performed with an Advance III
300 Bruker spectrometer operating at ωL=75.4 MHz. Proton to carbon cross-
polarization magic angle spinning (CP-MAS) sequence was applied with pulse lengths
of 5s, 1ms contact time and a recycle delay of 10 to 20s. For 29Si experiments
samples were packed into a 7mm rotor and relaxation delay of 60s was used.
The other instrument recorded 1H NMR spectra using an Advance III 600 Bruker
spectrometer operating at at ωL=600MHz (1H) using a 2.5 mm rotor. Magic angle
spinning (MAS) was applied with pulse lengths of 2.5s and a recycle delay of 5s with a
spin speed of 30 kHz. Spectral deconvolutions were performed using DMFIT software.
75
2D homonuclear 1H NMR experiments were conducted using the instrument in
Paris. Spin diffusion98 (2D NOESY) and double quantum99 (BABA or back to back)
experiments were performed to determine the specific interaction/proximities between
functional groups. The Nuclear Overhauser Effect (NOE) is a phenomena in which
transfer of nuclear spin polarization from one nuclear spin population to another occurs
through cross-polarization. NOESY experiments make use of NOE to establish
correlations of nuclei that are spatially close. Double quantum experiments make use of
strongly dipolar-coupled networks instead of fighting the dipolar interactions100.
Interpretation of data for both types of experiments is similar. For diffusion
experiments, both the x and y axis correspond to the chemical shift and the intensity of
the peaks are presented in a third dimension, such as contour lines or different colors.
In this plot, diagonal peaks have the same coordinate, while cross peaks have a
different value for each coordinate and are found on the off-diagonal. Diagonal peaks
correspond to the peaks in the 1D experiment, while cross-peaks indicate coupling
between pairs of nuclei. In the case of double-quantum experiments, the chemical shift
is doubled in the second dimension. Auto correlation appears at 2*i while correlations
between signals at 1 and 2 ppm respectively show a cross peak at 1+2.
Results and Discussion
FTIR
Figure 3-3 shows an FTIR-ATR spectrum of cured cement paste at an incident
angle of 42˚. This spectra has been run through the ATR correction algorithm to
compensate for variation in sampling depth. The bands at 874 and 1420 cm-1
corresponds to C-O from CaCO3, the peak at 960 cm-1 corresponds to SiO4 in calcium
76
silicate hydrate, the peak at 1654 cm-1corresponds to OH in water molecules, and the
broad peak from 3000 to 3700 cm-1 is the hydroxyl region. For the neat, cured cement
paste the hydroxyl band was deconvoluted into 2 peaks, one at 3642 cm-1
corresponding to Ca(OH)2 and one at 3410 cm-1 corresponding to calicum silicate
hydrate. These assignments are in good agreement with the literature101. A summary
of these characteristic IR absorption bands is shown in Table 3-1.
Figure 3-3. ATR IR spectrum of cured cement paste
Table 3-1. Assignment of observed peaks for cured cement paste101a, 102
Peak Position IR Assignment
(Wavenumber, cm-1)
874 Asymmetric stretching vibration of CO from CaCO3
960 SiO4 from CSH 1110 Stretching vibration of S-O in [SO4]
-2 1420 Asymmetric stretching vibration of CO from
CaCO3 1654 Bending mode of OH from H2O 3413 Symmetric and asymmetric stretching vibration of
OH from CSH 3643 OH in Ca(OH)2
77
ATR spectra of the small molecules at room temperature are shown in Figure 3-4
where GPE and EDA are liquids, and BPA is a solid powder. Both the BPA and EDA
show a broad, asymmetric band attributed to the vO-H of self hydrogen bonded hydroxyl
groups. The width of this band is related to the different lengths of formed hydrogen
bonds which adsorb at slightly different frequencies. For BPA, the peak of this band is
located at 3315 cm-1 and for EDA it is located at 3320 cm-1.
Figure 3-4. ATR spectra of the neat small molecule epoxy analogs and cement paste
Figure 3-5 shows the hydroxyl region of ATR spectra taken at 45˚ after applying
the small molecules to the cement paste particles. All the samples have been
corrected, using OMNIC software, for CO2 and H2O, and then ATR corrected to account
for the variation in penetration depth with wavelength and incident angle. While there is
much noise due to residual water vapor in the chamber, major shifts in the OH band
may still be observed. Cement paste before treatment had its broad band located at
3398 cm-1, and after treatment with GPE the position did not change. After treatment
with BPA and EDA a shift to lower wavenumbers for the broad peak took place. The
BPA sample shifted to 3321 cm-1 and the EDA sample shifted to 3359 cm-1. Most likely
78
this is simply spectra overlaying of the hydroxyl groups of the small molecules with the
OH region of the cement paste. IR work on BPA by other authors has demonstrated an
increase in the vO-H band after hydrogen bonding with another molecule103. These
results are counterintuitive, since the hypothesis envisioned the cement paste as being
able to hydrogen bond with the various small molecules containing hydroxyls.
Figure 3-5. ATR spectra of the hydroxyl region of cement samples after treatment; a) cement paste, b) cement paste + GPE, c) cement paste + BPA, d) cement paste + EDA
Additional loadings of BPA on the cement paste were performed to determine if a
gradual shift in the vO-H band could be observed. However, increasing the amount of
BPA did not yield any increase in the wavenumber of the overall peak shown in Figure
3-6. In addition, no overall change in the shape of the band was observed. Using the
DRIFT-IR technique also gave the same results.
79
Figure 3-6. ATR IR spectra of BPA treated samples. a) neat cement paste, b) cement paste + 30% BPA, c) cement paste + 20% BPA, d) cement paste + 10% BPA, and e) cement paste + 7% BPA
Since additional hydroxyl groups were contributed by the small molecules, simple
observation of the IR spectra does not yield enough information about the nature of the
interaction because of the overlapping bands. Peak subtraction was performed to
investigate if the data contained more information than initially assumed. This process
has been proven in other systems to show interactions with water and different states of
hydrogen bonding 55, 104. First, samples were ATR corrected using 1.5 as the index of
refraction of the sample and 2.4 for the ZnSe crystal. Next, the composite sample
spectrum had the small molecule contribution subtracted in OMNIC software with the
formula I=A-k*B where A is the composite sample, B is the neat small molecule, and k is
a constant. The constant was determined by normalizing to the VCH3 stretch located
from 2,975 to 2,965 cm-1. Unfortunately, peak subtraction yielded no new results, as
shown in Figure 3-7. The result of the peak subtraction were spectra similar to the neat
cement paste with no significant change in the location of the VO-H band.
80
Figure 3-7. Subtracted ATR spectra of BPA treated samples. a) neat cement paste, b) cement paste + 30% BPA, c) cement paste + 20% BPA, and d) cement paste + 10% BPA
NMR
Before probing epoxy-cement interactions using solid state NMR, epoxy-silica
nanoparticles and epoxy-laponite systems were investigated. These two systems were
examined because they have a more well defined structure than cement. Silica
nanoparticles (Aerosil 380) were 7nm in diameter. Laponite exists as platelets made up
of three sheets containing a middle sheet of magnesium ions in an octahederal
coordination with oxygen atoms and hydroxyl groups and two outer sheets composed of
tetrahedral silica sheets105. The platelets have an average diameter of 25 nm and a
thickness of 0.92 nm, with these finite dimensions being responsible for the occurrence
of silanol groups on the edges. During the manufacturing process, some magnesium
ions are substituted with lithium ions resulting in a negative charge, which is balanced
by interlayer sodium cations. This synthetic clay has a negative face charge and a rim
charge that may be negative or positive depending on the pH106. Laponite’s chemical
81
structure has been reported by the manufacturer as Na+0.7[Si8Mg5.5Li0.3]O20(OH)4]0.7-.
Compared to other clays, laponite has a relatively high edge to surface ratio of 0.07107.
Liquid NMR on the small molecules was performed to identify the resonances of
the functional groups before interaction with the two nanoparticle systems. For these
experiments the small molecules were dissolved in 13C enriched acetone. The same
procedure for the adsorption of the small molecules to the cement powder was followed
for the two types of composites with a 10mM/g concentration. Initial solid state 1H and
13C experiments indicated no apparent interactions between the silica nanoparticles and
small molecules, so the more complex laponite system was investigated more
thoroughly. Figure 3-8 shows the 13C NMR spectra of the EDA composites and Figure
3-12 shows the 13C NMR spectra of BPA and silica and laponite nanoparticles. In all
the 13C NMR spectra the resonance at 30 ppm is due to unevaporated acetone.
Figure 3-8. 13C NMR spectra of EDA composites
82
Solid state 1H NMR spectra of the pure laponite samples showed 2 resonances
at 0.5 and 4 ppm, assigned to silanol groups and interlayer water, respectively. Figure
3-9 shows the 1H spectra of laponite, liquid BPA, and laponite-BPA composite. For the
liquid BPA the resonance at 1.5 ppm (peak 1) was assigned to the methyl group, the 6.6
and 7 ppm signals (peak 3 and 4) to aromatic hydrogens, and the resonance at 5 ppm
to the hydroxyl groups. The solid BPA resonances were located in slightly different
chemical shift positions. Signals at 0.7ppm, from 6.6 to 7.1 ppm and at 8.5 ppm were
assigned to the methyl groups, the aromatic hydrogens and the hydroxyl groups
respectively. The small shoulder at 4.8 ppm may be due to non-hydrogen bonded
hydroxyl groups, as BPA has been shown to have, but has only been demonstrated
using FTIR108. While there may be some slight changes in the chemical shift peaks
between BPA and the laponite composite, no strong change in the hydroxyl group
chemical shift was observed.
Figure 3-9. 1H MAS NMR spectra of BPA – laponite composites
83
Although the EDA small molecule also has hydroxyl groups, the composite did
not exhibit a downfield shift in its 1H NMR spectra as seen in Figure 3-10. The GPE
composite did not show any significant changes in the 1H NMR spectra either, but that
was expected since the small molecule did not have any groups that could contribute to
hydrogen bonding with the cement. Figure 3-11 shows the 1H NMR spectra of the GPE
composites.
Figure 3-10. 1H NMR spectra of EDA – laponite composites
Figure 3-11. 1H NMR spectra of GPE – laponite composites
84
Since laponite has no carbon atoms in its chemical makeup, it gave no peaks in
13C NMR spectra, so interpretation was straightforward. Figure 3-12 shows the 13C
spectra of the various BPA composites. For identification, the various carbon peaks for
the solid BPA have been indicated on the spectra corresponding to the molecule.
Figure 3-12. 13C MAS NMR spectra of BPA composites
Wu et al investigated blends of phenolic resins and poly (hydroxyl ether) of
bisphenol A and found as the quantity of phenoxy increased, intermolecular hydrogen
bonds increased, as indicated by a downfield shift of the OH substituted carbon in the
phenoxy at 66 pm109. For the bisphenol A composites investigated in this work, the
85
carbon resonance that would correspond to a group that could hydrogen bond would be
peak 1 at 154 ppm, corresponding to the carbon of the phenol group. This downfield
shift was not observed for either the aerosol or laponite composites. In fact, no
significant changes in the spectra for any of the laponite-small molecule systems was
observed in 13C spectra.
Although concrete does not have as well defined a chemical structure as
laponite, it yielded more interesting NMR results. Previous work on cement has focused
mainly on calcium silicate hydrate, CSH, since it is the main hydration product of
cement and is the major phase responsible for the mechanical properties of concrete.
The CSH structure of hydrated cement is still not fully resolved because it is nearly an
amorphous material. However a large body of work has been performed on synthetic
CSH systems where the CaO to SiO2 ratio has been varied, usually between 0.7 and
2.0. These model systems closely resemble the minerals tobermorite and jennite. The
CSH structure is made up of distorted Ca-O sheets with silicate tetrahedral chains on
each side. These layers stack along the [001] direction and calcium and water
molecules are contained in the interlayer space. In jennite, half of the oxygens from the
Ca-O sheet are shared with OH- groups, where in tobermorite all of the oxygens are
shared with the silicate chains. Figure 3-13 shows an image depicting the structure of
jennite according to Churakov110.
86
Figure 3-13. The structure of jennite. Ca and Si sites are shown as polyhedra, interlayer Ca sites are shown as large gray spheres, and water molecules are represented by spheres with ellipsoids.110
The role of water in hydrated cement paste is very complex and controversial.
Besides water vapor held in the pores, it has been suggested that water can exist in
capillary water, adsorbed water, and interlayer water111. Capillary water is water
molecules held in voids larger than 5 nm, while adsorbed water is held by hydrogen
bonds and is physically bound. Chemically bound water is located in between the
calcium silicate lamellae and is directly incorporated into the structure of the cement
hydration products112. More specifically, work performed by Cong et al. on crystalline
calcium silicate hydrates confirmed the presence of hydrogen bonding groups Si-OH
and Ca-OH using 29Si and 17O MAS NMR113. A more recent study has demonstrated a
87
covalently bonded polymer-CSH meso-composite using alkyoxysilanes that interact with
the silicate chains19 as evidenced by a new T1 resonance in the 29Si spectra. This is an
important distinction, because previous theories suggested polymers became bound in
the interlayer space. To confirm the formation of covalent bonds between the polymer
and CSH, 29Si CP MAS NMR experiments were performed on composites prepared in
D2O. For the neat CSH sample, no resonances were able to be distinguished, while for
the composites, a resonance in the Q1 region was found, indicating polarization transfer
from protons to inorganic Q1 silicates. Since all of the protons are located in the
polymer, it was concluded that the polymer chains are spatially close to silicate
tetrahedral and that the silanes are incorporated into CSH silicate chains.
The current study examines the interaction of small molecules with hydrated
cement paste. As with the laponite studies, the neat cement paste gave no carbon
signals without direct excitation, so only 1H MAS solid state experiments were
performed. The 1H spectrum of hydrated cement paste gave 2 broad resonances
assigned to the hydroxyls of Ca(OH)2 at 1.2 ppm and the interlayer water of calcium
silicate hydrate at 5.4 ppm. These resonance assignments are in good agreement with
work by other authors114. Figure 3-14 shows the 1H MAS NMR spectra for the cement
paste and its various small molecule composites. No narrow signal from any of the
organic components is found, indicating the small molecules have been immobilized in
the inorganic matrix. Results by other authors on white cement and phenol suggests
that d5-phenol exists in Portland cement in two forms, unbound and bound to the
cement matrix115. The unbound environment is assumed to be liquid like and exist in
cement pore water in ionized form. The bound environment demonstrates reduced
88
motion of the organic inside the cement, and implies binding of the phenol through its
hydroxyl groups.
Figure 3-14. 1H Solid State MAS NMR spectra of cement paste composites
As with the FTIR data, no significant differences in the spectra, compared to the
neat molecules, could be observed. The only exception was the BPA treated sample
which shows a small shoulder from 8 to 10 ppm. For the sample treated with BPA the
methyl resonances were located at 2.4 ppm, the phenyl ring resonances were located at
89
7.1 ppm, and the hydroxyl resonances were located at 9.1 ppm. Although the hydroxyl
resonance is small, it is a downfield shift from the solid bisphenol A OH resonance at
8.7 ppm. To determine if this small shoulder was meaningful, further BPA loadings
were prepared. Figure 3-15 shows the 1H spectra of the BPA loadings from 7 to 30%.
Figure 3-15. 1H Solid State MAS NMR spectra of additional BPA loadings
90
For the 20% BPA loading, 2 new small peaks are found at 9.7 and 10.9 ppm.
The presence of 2 peaks is puzzling, however this strong downfield shift is typically
indicative of a strong hydrogen bond. Since the CSH gel may have both silanols and
interlayer water, this may provide two different chemical environments for the BPA
hydroxyls to interact with. At the 30% BPA loading there is the emergence of 2
additional small peaks at 14.8 and 17.7 ppm (not shown). These two peaks were also
found on a different instrument with the same BPA loading. However, these peaks may
be a result of contamination or impurities, as proton resonances this high are usually
only due to P-OH groups.
1H MAS NMR experiments were conducted at a different location on a different
instrument, on similar samples. The spectra of these BPA-cement paste composites is
shown in Figure 3-16. The 5% and 15% BPA loadings show a very small peak at 10.4
ppm. However, comparison to the solid BPA is difficult due to the lack of detection of
the hydroxyl resonance. This may be due to a slower spinning speed used in the
experiment (30kHz). In any case, the detection of the small peak suggests some kind
of interaction between the hydroxyls of the BPA exists. Unfortunately, further
experimentation with other loadings of BPA on the cement paste did not produce these
resonances above 10 ppm or new resonances that were visible at all.
91
Figure 3-16. 1H Solid State MAS NMR spectra of various BPA loadings on cement paste
2D NMR
Both spin diffusion experiments and double quantum experiments were
performed to further characterize the specific interactions taking place between the
small molecules and cement paste. For the spin diffusion experiments, typically a
mixing time of 40ms was used. Figures 3-17, 3-18, and 3-19 show the 2D spin diffusion
and double quantum results for GPE, EDA, and BPA cement composites respectively.
The loading of small molecules on the cement paste was 7% by weight.
92
Figure 3-17. 2D 1H NMR spin diffusion and double quantum results for cement + GPE
Figure 3-18. 2D 1H NMR spin diffusion and double quantum results for cement + EDA
Figure 3-19. 2D 1H NMR spin diffusion and double quantum results for cement + BPA
93
Figure 3-17 indicates the absence of interaction between specific GPE protons
and cement paste. Since off diagonal peaks indicate interactions between specific
groups and only diagonal peaks are present, we can assume that there are no
interactions between GPE hydrogen groups and the cement paste. The resonances for
the various groups have been approximated. The phenyl ring was assigned to the
signal 7 ppm, the ether linkage at 4 ppm, and the epoxide hydrogens at 2 ppm. The
diffusion experiment did not indicate any interaction between the organic and inorganic,
only the organic molecule groups in spatial proximity with itself. The double quantum
experiment gave an autocorrelation resonance around 1 ppm, indicating the cement
paste Ca(OH)2 group interacting with itself.
In Figure 3-18 the resonances for EDA at 1, 3 and 4 ppm were assigned to the
CH2, methyl and hydroxyl groups, respectively. The diffusion experiment did not
indicate any interaction between the organic and inorganic components, only the
organic molecule groups exhibits a spatial proximity with itself. As with the previous
double quantum experiment, the same intramolecular interaction was found.
In Figure 3-19 the BPA resonances at 1 and 7 ppm were assigned to methyl
groups and phenyl rings respectively. For both the diffusion and double quantum
experiment two sets of peaks were found, most likely corresponding to dipolar coupling
between the methyl group and phenyl ring. However, since the cement paste also has
a peak located around 1ppm due to Ca(OH)2 there may be a possibility of an organic-
inorganic interaction. Therefore, further experiments on different loadings of BPA were
performed.
94
Figure 3-20. 2D 1H NMR spin diffusion experiments for 20 and 30% BPA.
For the 2D spin diffusion experiments with 20 and 30% BPA, shown in Figure 3-
20, the same correlation between the 1 ppm and 7 ppm appeared, as evidenced in the
red circles within the larger blue region. However, for the Cement + 20% BPA, there is
an additional interaction at 10 ppm (seen as a blue dot in the top left corner, and as a
region of ellipsoidal shapes in the bottom right corner) with the broad peak from 6 to 8
ppm and 1 ppm. This may indicate the hydroxyl group interacting with the phenyl ring,
methyl group, or cement paste. While this interaction is not as strong as the BPA
methyl-phenyl ring interaction, this is to be expected due to the relatively weak strength
of hydrogen bonds. In addition, spin diffusion experiments only give spatial information,
and not necessarily a chemical interaction. Unfortunately, the resolution is not sufficient
to determine if the interactions are intramolecular or intermolecular.
29Si experiments were performed to see if any interactions between cement
silanols and bisphenol A took place. Ideally, HETCOR 1H -> 29Si experiments should
allow determination of the presence of possible cross-peaks between Si-OH signals and
1H resonances of BPA. Unfortunately, no 1H -> 29Si CP MAS spectra could be recorded
95
with a reasonable S/N ratio, probably due to an averaging of the 1H - 29Si dipolar
coupling induced by the mobility of the BPA molecules.
Figure 3-21 shows the cement paste before and after treatment. Original
Portland cement contains Q0 sites in the calcium silicate phase, that are unreacted
material without a network of Si-O-Si bonds in the silicates114a. Q1 sites are present in
the form of linked silicate tetrahedral endgroups and Q2 sites are present in the middle
of silicate chains116. The 29Si spectra of the cement paste contains the Q0 site located
at -72 ppm, the Q1 site at -80 ppm, and the Q2 site at -85 ppm. No significant change in
the chemical shift of these peaks was found after treatment with BPA. A slight increase
in the Q2/Q1 ratio from 0.4 to 0.8 was found, indicating a change in the degree in the
silicate polymerization. The broadness of the Q2 peak demonstrates the presence of a
variety of different silicate chain lengths, and the peak at -86.7 on the shoulder of the Q2
peak is attributed to the different local environment, such as bridging and paired
groups117. The small peaks between -100 and -110 for the cement + BPA curve are
most likely noise.
96
Figure 3-21. 29Si NMR spectra of cement paste before and after treatment with BPA.
Summary
Various FTIR techniques were used to investigate EDA, GPE, and BPA cement
composites. No change in the FTIR hydroxyl region from 3,000 to 3,600 cm-1 was
observed for any of the organic-inorganic composites. Peak subtraction and peak
deconvolution also showed that there is no hydrogen bonding interaction between
epoxy and cement. No strong interactions were found between small molecules and
laponite or silica nanoparticles with 13C and 1H NMR experiments. 1D and 2D 1H MAS
NMR experiments indicated an interaction for the BPA-cement paste composites.
Specifically, the shift of the OH group of the BPA to higher chemical shift values was
found in some experiments. The downfield chemical shift of these OH groups suggest
deshielding of the proton, which is typically an indication of hydrogen bonding. However,
since the amount of hydrogen bonding is susceptible to factors such as acidity,
concentration, and temperature it can be difficult to predict, so the nature of these
97
organic-inorganic interactions could not be determined. 29Si experiments on the BPA-
cement composites indicated a change in the degree of silicate polymerization, but did
not suggest direct evidence of a silanol-hydroxyl interaction. While these sets of
experiments do not show a compelling set of data demonstrating hydrogen bonding
between the organic-inorganic composite, it is possible that with a higher water to
cement ratio (w/c=0.4-0.5) and a different type of Portland cement (white cement) the
nature of the bonding may be described more fully.
98
CHAPTER 4 EPOXY DEGRADATION BY ENVIRONMENTAL EXPOSURE
Background
While use of FRPs for repair and strengthening of bridges and other
infrastructure is routinely performed, accurate prediction of the long term mechanical
properties of these materials in the field is quite difficult. While accelerated testing on
FRP materials typically involves elevated temperatures, exposure to aqueous solutions,
and increased stress levels, these methods typically do not take into account the
degradation mechanisms experienced by the materials. A number of investigations
have determined that environmental exposure of FRPs leads to a significant loss of
properties as discussed in Chapter 2. In all cases, a significant loss in bond strength
was observed, or the failure mode changed from cohesive in the concrete to adhesive
at the interface with exposure63. In some cases, a loss in properties is explained by
chain cleavage due to water hydrolyzing crosslinks51.
Aiello et al examined the mechanical properties of epoxy and concrete beams
after environmental exposure to air from 40-50˚C and water immersion at 23˚C 118.
They determined the mechanical properties of the epoxy were almost completely
recovered after the service conditions were returned to room temperature. They
concluded that the effect of an increase of temperature on bond strength is only due to
the viscoelastic properties of the adhesive, and the presence of water induces a
reduction in bond strength and a higher weakness at the interface.
Ellis et al discussed the importance of sample handling and preparation during
DSC to determine the Tg of epoxy under various conditions. From their data they
implied that the ice melting endotherms observed were due to the presence of free
99
water produced by the diluents diffusion out of the sample during thermal analysis.
This is in agreement with their previous research, which suggested that the free volume
approach can be used to explain the effect of water on Tg and that water acts as a
plasticizer in epoxy systems36.
Two different approaches have been used for explaining property loss by
plasticization in epoxy systems. The first is the disruption of interchain hydrogen bonds
by water molecules, which plasticizes the polymer38a, 119. Alternatively, under wet
conditions, water can reach the interfacial region and break the hydrogen bonds
between the epoxy and substrate since water is a strong hydrogen bonding agent. This
will result in displacing the epoxy from the substrate and create a weak water layer at
the interface3c. As discussed in Chapter 2, water molecules can also be found clustered
together into sub micro-scale cavities within the epoxy matrix120. In this study,
accelerated aging conditions are used to investigate a loss in properties and change in
degradation mechanism.
Experimental Procedure
Two different epoxy systems were investigated in this work. The model epoxy
system consisted of a diglycidyl ether of bisphenol A (DGEBA, EPON 826) and
poly(oxypropylene) diamine (POPDA, Jeffamine D-230) purchased from Momentive and
Huntsman, respectively. The other commercial system investigated (Sikadur 300) had
an unknown chemical composition, due to the proprietary nature of the chemicals. The
mass ratio of DGEBA to POPDA for the model epoxy system was 100 to 32.9, to reach
stoichiometric equivalence between functional groups, while the commercial system
components were mixed by weight based upon the manufacturers’ information. The two
liquid components were mixed vigorously for 5 minutes to ensure even mixing. The
100
mixed material was then degassed for 30 minutes under vacuum to remove air bubbles,
and transferred into dogbone molds made from Silastic T-2, a commercial PDMS mold
system, using a pipette. The dimensions of the dogbones are 2.5” long, 0.375” wide,
and 0.125” thick, corresponding to ASTM D638 Type V dogbones. After 1 week of
curing at room temperature, samples were demolded and placed in controlled water
baths with constant temperatures from 30-90˚C.
Samples immersed in water from 30-60˚C were kept at the UF Coastal
Engineering Labs, and samples from 70-90˚C were kept at the State Materials Office
Labs. Samples were also exposed to UV aging with and without water at 60˚C using a
Q-Sun Xenon Model XE-3 weatherometer maintaining 0.68 W/m2 and a relative
humidity of 45%. Every 2 weeks samples were removed from the environmental
chambers and tested for mechanical properties and weighed for water absorption.
Five dogbones per experimental condition were tested for mechanical properties
to get an accurate population size. Samples were tested in tension using an Instron
according to ASTM D3039 using a strain rate of 5 mm/min and a 1,000 lb load cell until
failure. All mechanical data was analyzed using IBM SPSS using an multivariate
analysis of variance (MANOVA) test. A general linear model was used, with repeated
measures, with a 95% confidence level. Within-subjects variables were temperature, or
UV exposure and the between-subjects factor was time; the covariate was the
unexposed set of epoxy samples.
In order to evaluate the mechanisms of accelerated degradation experienced by
the epoxy dogbones, Fourier transform infrared spectrometry was used (FTIR; Nicolet
Magna 760, Thermo Electron Corporation), in the diffuse reflectance infrared Fourier
101
transform (DRIFT) mode and ATR mode. The DRIFT and ATR spectra were recorded
over the range of 650-4000 cm-1 with a KBr beamsplitter and an MCTA detector using
64 scans at a resolution of 4 cm-1. For the DRIFT sample preparation, slices of the aged
epoxy were taken after mechanical testing then combined with KBr powder in a
proportion of 1:100. After the epoxy and KBr powder were milled for 30 seconds,
spectra were acquired. Sample preparation for ATR samples involved cutting a middle
section, close to the fracture surface of the sample, using a razor blade and clamping
the part of the sample that was directly exposed to the UV radiation to the ATR crystal.
The ATR spectra were taken using a hemispherical ZnSe crystal at an incident angle of
45˚.
Results and Discussion
Change in Mechanical Properties of the Model Epoxy System During Hygrothermal Exposure
Over the course of eight weeks of exposure to water the model epoxy system
exhibited a gradual color change from colorless to orange which can be seen in Figure
4-1. With increasing temperatures, this effect was more evident. This is most likely due
to oxidation of the ether and nitrogen groups59, 121. The samples exposed to UV
radiation also underwent a color change, which was accompanied by a loss in mass
and an increase in surface roughness. The tensile test results after 8 weeks are
summarized in Table 4-1 and the full list of data is shown in Appendix A along with
examples of load-displacement curves in Appendix B.
After 8 weeks of exposure, up to 33% of the modulus and 38% of the peak
tensile strength was lost. The strain at failure increased up to 5.1% from 3.5%. The
loss in physical properties for epoxy systems experiencing hygrothermal exposure has
102
been reported by other authors and is typically attributed to the formation of hydrogen
bonds between the epoxy hydroxyl groups and adsorbed water122.
Figure 4-1. Change in color of epoxy dogbones after exposure to water at various temperatures and UV radiation
Table 4-1. Summary of changes in properties for the model epoxy system after hygrothermal exposure
Exposure (˚C)
t (weeks) E (GPa) Es MPa) s (%) s
Control 8 2.45 0.08 74.5 4.8 3.5 0.4 0
30 8 2.13 0.16 64.1 2.1 4.6 0.8 1.14
40 8 1.93 0.07 65.5 4.8 4.7 0.7 1.34
50 8 1.91 0.15 67.6 6.2 5.1 0.9 1.35
60 8 1.77 0.14 56.5 6.2 4.7 0.4 0.82
70 8 1.65 0.07 49 3.5 4.5 0.7 4.36
80 8 1.67 0.19 49 3.5 4.3 0.2 7.47
90 8 1.62 0.17 46.2 4.1 4.2 0.5 6.22
Note : t = time; E = modulus; Es= standard deviation of E; = peak stress; s =
standard deviation of ; = strain at failure; s = standard deviation of A = % change in cross sectional area after exposure, but prior to mechanical testing.
103
It is possible to predict the mechanical properties of crosslinked polymer systems
by using rubber elasticity theory. A required assumption is that there is no volume
change on deformation and that affine deformation occurs123. The average length of a
chain in the strained state can be determined by
(4-1)
where represents the fractional change in dimension of each of the three directions.
For most polymers, is equal to approximately 1. The stress may be predicted by
the equation of state for rubber elasticity.
(4-2)
In this equation represents the concentration of active network chain segments, R is
the gas constant, and T is temperature. When a polymer becomes swollen this results
in a decrease in the network chain segment concentration, and therefore a decrease in
stress. A swollen polymer is also predicted to exhibit a decrease in modulus, due to a
decrease in crosslink density, ve.
(4-3)
The engineering stress and strain were determined from the measured load and
displacement, using the original cross sectional area of samples. In the elastic region,
the epoxy obeys Hooke’s law so the stress is proportional to the strain, with the Young’s
modulus being the constant of proportionality.
(4-4)
Once the polymer passes through the elastic region, plastic deformation occurs
and the polymer starts to yield. Beyond the yield point, necking begins and a decrease
104
in the cross sectional area occurs. Until the neck forms, the deformation is essentially
uniform throughout the sample, but after necking all further deformation takes place in
the neck. The neck becomes smaller and smaller, with local stress increasing, until the
sample fails. Figure 4-2 shows an example of a stress-strain graph for a control sample
and 70˚C sample after 8 weeks.
Figure 4-2. Stress-strain curve for control and 70˚C sample after 8 weeks
It is evident from the graph that the unexposed, control system has a greater
slope, corresponding to a higher modulus, than the exposed sample. In addition, there
is a higher peak stress, and a lower strain at failure. The control sample does not
undergo any plastic deformation and fails in a brittle manner, while the exposed sample
undergoes necking and much more elongation as a result of absorption of water in the
epoxy network.
105
Figure 4-3 shows the changes in the modulus for samples exposed to water at
temperatures from 30 to 90˚C over the period of 8 weeks; note that only one error bar
for a set of samples is present for ease of visibility. From the graph it seems that after 4
to 6 weeks, the value of the modulus remains constant. The increase in sample mass
confirmed saturation of the sample around 4 weeks and will be discussed later in the
chapter. While some additional decrease or increase may be found after the initial 4
weeks, these changes are not statistically significant. Results of the statistical analysis
are shown in Appendix E. As predicted by rubber elasticity theory, with higher exposure
temperatures, lower values for the modulus were found. Based off of rubber elasticity, a
10% increase in volume, due to swelling, and assuming a constant number of
crosslinks, the new density would be 1/(1.1 x area), or 90.9% of the original density so
the modulus would only drop about 9%. Thus, other factors besides swelling may have
impacted the modulus, such as plasticization and chain scission. However, since the
Tg of these systems was not measured, plasticization cannot be verified. Sample
immersion temperature’s effect on modulus was statistically significant, but the loss in
modulus over time was not. Samples exposed to 30˚C showed the least loss in
properties, while those at 90˚C showed the most loss in properties.
The same basic trend was found for peak stress, shown in Figure 4-4. The Tg of
this system is 45˚C after 1 week of cure in ambient conditions, as measured by DSC34.
Once again, after about 4 weeks the loss in properties seems constant, however, there
was no statistically significant difference in the stress values with any of the variables.
106
Figure 4-3. Change in modulus for the model epoxy system with hygrothermal exposure
Figure 4-4. Change in peak stress for the model epoxy system with hygrothermal exposure
107
Samples exposed to water demonstrated a greater strain at failure than the
control sample as shown in Figure 4-5. While the difference in strain as a function of
temperature was statistically significant, the change in strain over time was not. For all
the exposed samples the strain throughout the exposure time was higher than the
control group, as a result of chain swelling due to water absorption. The increase in the
cross sectional area was found to increase up to 7% at 8 weeks of exposure, which
indicates an interruption of inter chain hydrogen bonding rather than simply occupying
the free volume124.
Figure 4-5. Change in strain for the model epoxy system with hygrothermal exposure
Change in Mechanical Properties of the Model Epoxy System During UV and Water Exposure
UV exposure was conducted on the model epoxy system with and without the
presence of water at 60˚C. The change in the tensile modulus after exposure is shown
in Figure 4-6 and the control and water exposure at 60˚C are also provided for
108
comparison. While some loss in properties occurred, it seems the UV exposure was not
as detrimental to the modulus as water exposure alone. Initial degradation up to 2
weeks was not as severe with UV alone and suggests that at short time periods water’s
effect on the tensile modulus is more dominant than UV exposure. However, the only
statistically significant relationship was the change in modulus as a function of the time.
There was no statistically significant difference between the UV and UV with water
exposure conditions. A table of the details of the mechanical properties may be found
in Appendix C.
Figure 4-6. Change in modulus with UV and water exposure for the model epoxy system
The peak stress of samples exposed to UV exposure are shown in Figure 4-7.
Unfortunately, none of the variables showed a statistically significant difference.
109
Figure 4-7. Change in peak stress with UV and water exposure for the model epoxy system
Figure 4-8 shows the change in strain during UV exposure. Note error bars have
been omitted. Over time, the strain decreased with UV exposure. The combined
effects of UV degradation and absorption of water makes a clear explanation difficult.
Once again, none of the variables showed a statistically significant difference.
Figure 4-8. Change in strain with UV and water exposure for the model epoxy system
110
Change in Mechanical Properties of the Commercial Epoxy System
The commercial epoxy system (Sikadur 300) showed a similar trend as the
model epoxy system in regards to change in modulus and peak strength with exposure
to water at various temperatures. In addition, the same gradual color change from
colorless to orange was seen. The full list of data for the Sikadur 300 epoxy system is
shown in Appendix D. Figure 4-9 shows the change in modulus with water exposure for
the Skidaur 300 epoxy system.
Figure 4-9. Change in modulus for Sikadur 300 with hygrothermal exposure
As with the model epoxy system, the tensile modulus decreased with higher
temperatures; note error bars have been removed for ease in visibility. A lower
modulus was seen for samples exposed above 30˚C. The effect of temperature on the
modulus showed a statistically significant difference, while time did not.
111
Figure 4-10. Change in peak stress with hygrothermal exposure for Sikadur 300
The same pattern follows for the peak strength. With higher exposure
temperature, a lower peak strength was found. As with the modulus, the effect of
temperature on the peak stress showed a statistically significant difference, while time
did not.
Figure 4-11. Change in strain with hygrothermal exposure for Sikadur 300
112
Unlike the model epoxy system, there was no significant change in the strain to
failure with exposure. The chemical explanation for the lack of change in strain with
exposure is not known, due to the proprietary chemical nature of the epoxy systems.
There was no statistically significant difference for any of the variables for the change in
strain for the commercial system.
Diffusion of Water Into the Model Epoxy System
Water diffusion in epoxy resins has frequently been described by Fick’s second
law120. This mathematical expression is described in equation 4-5, where C represents
concentration of the diffusing substance as a function of time t and position x, and D is
the diffusion coefficient.
(4-5)
The total amount of substance diffusing into the epoxy resin, Mt, as a function of
time across the thickness, h, is given by the integral of the solution of equation 4-5.
This equation assumes the diffusion occurs only in one dimension. Mmax is the
maximum amount of the diffusing substance at infinitie time.
(4-6)
This curve can be divided into two parts, when Dt/h2 is greater than 0.05 and less than
0.05. If Dt/h2 > 0.05 equation 4-6 can be rewritten as
(4-7)
If Dt/h2 < 0.05 equation 4-6 can be rewritten as
(4-8)
113
Figure 4-12 shows the diffusion behavior of the model epoxy system at various
temperatures with exposure up to 8 weeks, where % weight gain is plotted against t1/2.
Water uptake in the epoxy appears to follow behavior predicted by Fick’s law where in
the initial stage the sorption curve is linear, and above the linear region the sorption
approaches saturation. The diffusion coefficient can be calculated from the slope of the
linear region of a plot of water uptake (Mt) vs. time (t1/2), shown in Figure 4-13.
Samples were typically saturated within 3 weeks. Water uptake was obtained from the
average weight gain of two samples during exposure, where M0i is the initial mass and
Mti is the mass of the sample at time i.
(4-9)
Figure 4-12. Absorption of water by model epoxy system at various temperatures up to 8 weeks exposure
114
Figure 4-13. Fitting of the linear region of the various samples
From these linear fits, the diffusion coefficients were calculated where m is the
slope of the fit. Msat corresponds to the point at which the epoxy samples were
saturated with water, or no significant change was shown in the weight gain.
(4-10)
The diffusion coefficients for the different water temperatures are summarized in
Table 4-2. Since the sample dimensions used in this study are not flat sheets, but
dogbone shaped with a more complex geometry, the calculated diffusion coefficients
are higher than the true diffusion coefficients It is important to note that this study only
investigates a short time period of 8 weeks, so it is assumed that primarily stage 1
diffusion occurs.
115
Table 4-2. Diffusion coefficients at different water temperatures for the model epoxy system
T (˚C) D (10-9 m2/s)
30 20.36
40 34.76
50 39.71
60 41.45
70 68.92
80 97.85
90 126.36
Assuming Fickian behavior of water diffusing into the epoxy, an Arrhenious
equation can be used to calculate the diffusion activation energy, Ea, where Do is a
pre-exponential factor, R is the gas constant, and T is absolute temperature.
(4-11)
Fitting ln D against 1,000/T gives a slope Ea/R, by which the activation energy
can be determined. This plot is shown in Figure 4-14. The calculated activation energy
for the model epoxy system was 27.29 ± 2.89kJ/mol. This activation energy is in
agreement to those calculated by other authors for similar epoxy systems, where Nunez
et al. calculated 26.01 kJ/mol for their DGEBA diaminecyclohexane system122c and
Barral et al. calculated 25.8 kJ/mol for their DGEBA bisaminomethylcyclohexane
system125.
116
Figure 4-14. Calculation of Ea/R for the model epoxy system
IR Characterization of Degradation
DRIFT and ATR IR experiments were performed on the model epoxy system to
determine the mechanism of property loss for the cured epoxy after various
environmental exposure conditions. Table 4-3 indicates IR assignment of the various
absorption peaks. These assignments are in good agreement with those found by other
authors63, 126.
Table 4-3. IR peak assignment of the absorption bands in the model epoxy system43, 127
Peak Position (Wavenumber, cm-1) IR Assignment
829 In plane deformation of phenyl-H
917 Epoxy bending
1,033 C-O-C stretching
1,097 O-C-C stretching
1249, 1182 C-C-O-C stretching
1297 Twisting mode of CH2 units
1456, 1362 C-H in plane deformation in
117
aliphatic units
1609-1582-1510 Aromatic ring stretching
1650 O-H bending vibration
2960-2930-2870 C-H and CH2 stretching
3050 Phenyl-H stretching
3300 N-H stretching
3440 Hydroxyl stretching
Figure 4-15. DRIFT IR spectra of the model epoxy system. a) unexposed epoxy sample after 8 weeks and b) exposed samples after 8 weeks.
Figure 4-15 shows the IR spectra of the samples exposed to water for 8 weeks
from 30 to 90˚C. While there is much overlap for the exposed samples, it appears that
there is an increase in the hydroxyl region from 3,100 to 3,700 cm-1 relative to the
aromatic ring stretch at 1510 cm-1, typically used as an internal standard. In addition
there is the appearance of the OH bending vibration of water at 1625 cm-1. To estimate
the amount of absorbed water for each exposure condition, the area under these peaks
was obtained and normalized to the area under the phenyl ring. While these normalized
Peak Position (Wavenumber, cm-1) IR Assignment
Table 4-3. Continued
118
values cannot be used to determine absolute concentrations, they can be used for
relative comparisons. This process has been demonstrated by other authors on epoxy
system32a, 34. These values are shown in Table 4-4. While the normalized areas
indicate that the epoxy network has adsorbed a large amount of water, unfortunately,
there is no trend as a function of exposure temperature.
Table 4-4. Area comparisons of water absorption peaks relative to the phenyl ring for exposure at various water temperatures
Temperature (˚C)
1510 cm-1 Area
3434 cm-1 Area
1625 cm-1 Area
H2O / Phenyl
OH / Phenyl
Total Water / Phenyl
control 1.994 28.146 4.794 2.404 14.115 16.519
30 0.809 29.728 3.795 4.689 36.728 41.416
40 0.509 25.674 3.347 6.583 50.489 57.072
50 0.575 21.261 2.997 5.209 36.956 42.165
60 0.721 45.929 5.364 7.440 63.702 71.141
70 0.388 24.437 2.882 7.432 63.013 70.445
80 0.535 23.899 3.042 5.690 44.695 50.384
90 0.496 28.722 3.560 7.174 57.884 65.057
The bending mode of water in epoxy occurs at a lower wavenumber than the
band of liquid water at 1,648 cm-1. Typically, the formation of hydrogen bonds affects
the vibrational spectra of the groups involved by decreasing the frequency of stretching
modes and increasing the frequency of bending modes126b. For water absorption in
epoxies, it has been proposed by other authors that since the wavenumber of the water
held in the epoxy resin is between the wavenumber of free water and liquid water, it is
hydrogen bonded to the epoxy, and this interaction is reversible40, 104. In the current
study, the presence of the absorption band at 1,625 cm-1 suggests that the water
absorbed by the epoxy has hydrogen bonded to the hydroxyl groups of the epoxy.
Using rubber elasticity theory, with swelling of the polymer network by hydrogen
119
bonding of water with the epoxy, a decrease in strength is predicted. While the epoxy
demonstrated swelling up to 7%, the loss in strength was much greater.
Figure 4-16. ATR IR spectra of samples after 8 weeks of exposure to a) UV and water
b) UV only and c) unexposed
Figure 4-16 shows the IR spectra of the samples exposed to UV and water for 8
weeks at 60˚C. Spectra have been corrected for residual CO2 and H2O in the chamber
using calibrated spectra in the OMNIC software package. In addition the spectra were
ATR and baseline corrected for ease of comparison. It seems that after UV exposure
there is an increase in OH groups around 3,300 cm-1 and C=O groups at 1,650 cm-1
and 1,725 cm-1. These changes have been reported by other authors as indicative of
the oxidation mechanism35, 63, 127b, 128. In addition, for the samples exposed to both UV
radiation and water immersion at 60C, a decrease in ether groups was found at 1,085
for the trans ether link and 1,232 cm-1 for the aromatic ether ink, and can be seen in
Figure 4-17. A comparison of the relative areas of the OH, CO, and C=O to the phenyl
group is shown in Table 4-5. The results of the table show a large increase in C=O
groups and a small decrease in C-O groups with exposure to UV only. With UV and
120
water exposure, there is a large increase in OH groups, and a large decrease in C-O
groups.
The formation of carbonyl groups may result from oxygen attack of ether groups
or methylene groups linking two phenyl groups in the DGEBA epoxy resin3b. Since the
sample exposed to UV only did not show a large increase in the OH area, it can be
assumed that solely oxidation took place. In the presence of both UV radiation and
water, it is generally believed that hydrolysis of the ester linkages occurs, with the
formation of a hydroxyl and carbonyl43. This process decreases the effective average
crosslink molecular weight, and absorbed moisture can attack the cross linked chains
and cause chain scission. As suggested by rubber elasticity theory, a decrease in the
average crosslink molecular weight will result in a proportional drop in modulus which is
larger than expected by swelling alone. From Table 4-5, only half the number of C-O
groups are detected for samples exposed to UV and water after 8 weeks, as compared
to the control, yet only a 15% reduction of modulus was found.
Figure 4-17. ATR IR spectra of samples after 8 weeks of exposure to a) UV only b) unexposed and c) UV and water
121
Table 4-5. Area comparisons of various absorption peaks relative to the phenyl ring for
exposure to UV radiation with and without water
Exposure
1510 cm-1 Area
3434 cm-1 Area
1085 cm-1
Area
1232 cm-1
Area
1725 cm-1
Area OH /
Phenyl C=O / Phenyl
Total C-O/Phenyl
control 1.948 9.426 2.914 4.585 0.048 4.839 0.000 3.850
Both the model epoxy system and commercial epoxy system exhibited a
decrease in mechanical properties with exposure to water at various temperatures. The
model epoxy system increased in strain to failure with exposure, while the commercial
epoxy system did not show much change in strain to failure with exposure. DRIFT IR
spectra of the model epoxy system after exposure to water indicated an increase in
hydroxyls and an increase in water at 3,400 cm-1 and 1625 cm-1 respectively. UV
samples exhibited a loss in properties, however, the data was not statistically
significant. The IR data indicated an increase in carbonyl groups, suggesting that with
UV exposure epoxy undergoes oxidation. The samples exposed to both UV radiation
and water showed a decrease in ether groups and an increase in hydroxyl groups,
providing evidence for hydrolysis. Although IR data suggested hydrolysis took place for
samples exposed to UV and water, the mechanical data did not show as large of a
reduction as reported by other authors71, and as implied by the theory of rubber
elasticity.
122
CHAPTER 5 MODIFICATION OF CEMENT PASTE SURFACES WITH SILANE COUPLING
AGENTS
Background
While repair and rehabilitation of civil infrastructure in the US is of great concern,
there is much evidence which shows that the current methods and practices are not as
resistant to environmental conditions as expected. This evidence is discussed in detail
in Chapter 2. The mechanism proposed by numerous authors suggests that when
epoxy is exposed to water, the water molecules replace epoxy-concrete hydrogen
bonds with water-epoxy hydrogen bonds4a, 38a. Previous work on this topic by Choi et
al. demonstrated that the application of an epoxy-functional silane coupling agent could
decrease water’s detrimental effect on the concrete-epoxy bond129. This was attributed
to the formation of covalent bonds, and a decrease in the diffusivity of water due to the
hydrophobic silane130. Slant shear measurements indicated that the application of the
epoxy functional silane coupling agent lead to significant improvement in the durability
of concrete cylinders exposed to water from 30 to 60˚C over a 12 week period. This
work further investigates the chemical modification of the cement surface at a chemical
level.
The reaction mechanism of a silane coupling agent with an inorganic material
has been studied in depth by many researchers131. Silicone is the center of the silane
molecule which contains an organic functional group (Y) and alkoxy functional groups
(OR). The alkoxy groups become hydroxyl groups (OH) with hydrolysis, and then form
an alcohol (R-OH). Over the course of the reaction, hydroxyl groups condense with
each other as a result of dehydration. The end product is a chemical bond between an
inorganic and organic material. This process is depicted in Figure 5-1. Since hydrolysis
123
and condensation are dependent on pH and catalysts, typically a weak acid such as
acetic acid is used in the procedure to ensure that the rate of hydrolysis is much greater
than the rate of condensation.
Figure 5-1. The reaction process of an alkoxy silane with a hydroxyl surface.132
The determination of the contact angle between a liquid and a solid is the most
commonly used technique to characterize the surface properties of a material. The
relation between the contact angle and free energy of a liquid and solid is explained with
Young’s equation shown in the following equation
0 = SG – SL – cos c (5-1)
where the solid–vapor interfacial energy is γSG, the solid–liquid interfacial energy is γSL
the liquid–vapor energy is γ, and θC is the equilibrium contact angle. As can be seen
from the above equation, wetting of a solid surface with a high surface energy, such as
a ceramic, can be achieved more readily than wetting a low energy solid surface, such
as a polymer. On a smooth-flat surface, contact angle measurements are easy to
perform. However, due to the nature of cementitious surfaces, surface roughness and
124
cavities and pores make these measurements difficult133. Wenzel introduced the
roughness ratio r to quantify this surface roughness effect in the Young and Dupre
equation under the form
cos (θA) = r cos (θ) (5-2)
where θA is the apparent contact angle and r is the ratio of the real rough surface area to
the ideal smooth surface. Note that r is greater than 1 for rough surfaces and equal to 1
for a perfectly smooth surface. Although Wenzel’s equation shows that there is a
difference between rough surfaces from smooth surfaces, it does not describe contact
angle hysteresis, or the difference between the advancing and receding contact angles.
In rough surfaces, a wetting liquid will not be completely absorbed by the surface
cavities, while a non wetting liquid may not penetrate into pores. This will result in the
formation of air pockets. Cassie and Baxter extended the Wenzel equation to
accommodate non-homogenous surfaces with cavities and pores
cos (θA) = rf f cosθ0 + f - 1 (5-3)
where rf is the roughness ratio of the wet surface and f is the fraction of solid surface
area wet by the liquid. While plenty of research has been dedicated to the impact of
surface roughness on concrete strength, fundamental issues regarding the interfacial
bond have been overlooked7a, 7c, 134. For the most part, past research only investigated
the micro-scale and assume mechanical interlock, while ignoring issues at the nano-
scale. Garbacz et al. directly examined mechanical interlock, however their treatments
to vary the roughness resulted in the smoothest, untreated samples having the highest
pull off strength7c. This was explained by the appearance of voids at the interface for
the rougher surfaces.
125
A different study on a variety of materials including ceramics, polymers, and
metals have found a direct correlation between surface roughness (from 0.2 to 8 m)
and contact angle135. Kubiak et al. combined Wenzel and Cassie-Baxter theories with
2D surface morphology analysis and found good agreement between their model and
experimentally determined contact angle.
(5-4)
where θ is the contact angle for the ideal surface, θA is the measured contact angle, RLo
is the length of the roughness profile expressed in % expansion from the smooth profile,
and Rmr is the relative material ratio of the roughness profile measured in the vertical
position. The most variation was found in the ceramic and copper alloy samples with
minimums in the contact angle vs log average roughness graphs between 0.3 and 0.9
m as shown in Figure 5-2.
Figure 5-2. Variation in contact angle as a result of surface roughness.135
126
Momber directly examined the contact angle of cement paste and concrete and
found a decrease in the contact angle with grit blasting and sawing. He acknowledged
the fact that if the water drop covered grooves it would be lower in angle and that more
investigations are necessary to determine a relationship between contact angle and the
location of measurement136. This study avoids these issues by polishing samples to a
uniform surface roughness and by avoiding measurements on areas with grooves or
areas with irregular surfaces. Besides physical property measurements, a specific
spectroscopic technique was used to determine chemical changes after silane
treatment.
X-Ray Photoelectron Spectroscopy (XPS) is a useful tool to examine the surface
region of nearly any solid material. In this technique low energy X-rays strike a sample,
and emitted photoelectrons are analyzed. The binding energy of each of the emitted
electrons can be determined by the following equation
Ebinding = Ephoton – (Ekinetic + ) (5-5)
where Ebinding is the binding energy of the electron, Ephoton is the energy of the x-ray
photons, Ekinetic is the kinetic energy of the electron as measured by the instrument, and
is the work function of the spectrometer. Each element produces a characteristic set
of peaks at a range of binding energy values and the number of detected electrons in
these peaks is directly related to the relative amounts of each element within the
irradiated area. Atomic percentage values are determined by dividing the signal
intensity by a sensitivity factor and normalizing over the elements detected.
The objectives of this chapter are to determine the contact angles of cement
paste with water to cement ratios of 0.4 and 0.5 before and after treatment with various
127
silane coupling agents. By using an automated polisher, a uniform surface roughness
will be achieved, so contact angle variations will be minimal. Chemical modification of
the cement pastes will be analyzed using XPS.
Experimental Procedure
Commercial Florida Portland Type I/II cement was used to prepare cement
pastes with water to cement ratios of 0.4 and 0.5 to evaluate the effect of different
chemical compositions on silane treatment. After vigorous hand mixing for 5 minutes,
the pastes were transferred to 4cm by 4cm teflon molds and were cured at room
temperature for 1 week. After 1 week, samples were demolded and transferred to a
lime water solution to cure for 3 weeks to complete the hydration process. Next, the
samples were polished by hand using increasing grits of sandpaper from 300 to 1200.
In order to further reduce surface roughness and improve uniformity, a 120 South Bay
Technology lapping and polishing machine was used with 300, followed by 800 grit
sandpaper until the surface developed a smooth, near mirror finish. In this work, the
description of a near mirror finish refers to a visual light reflection on the surface of the
cement paste. The near mirror finish on the cement paste sample is shown in Figure 5-
3. All samples were then cleaned with hexane in a sonicator for approximately five
minutes after polishing, then rinsed with deionized water. Miller et al. have
demonstrated the ability of automated polishing to attain a mirror finish on concrete
mortar137.
128
Figure 5-3. Near mirror finish of a cement paste sample after polishing. Photo courtesy of Andrew Stewart.
Polished cement pastes were prepared with three silane coupling agents with
specific functionalities. Aminopropyltriethoxy silane (APTES), 3-
glycidyloxypropyltrimethoxy silane (GPTMS), and methoxy terminated polydimethxyl
siloxane (PDMS) were chosen, for evaluating their compatibility with cement pastes.
APTES was supplied by Alfa aesar, GPTMS was supplied by Acros, and PDMS was
supplied by Gelest. All the silanes were used as received without further purification.
Silane coupling agents were applied to the surface using two different procedures.
Horizontal vapor deposition was performed at 90˚C for 1 hour to evaporate the silane
and condense the silane on the cement paste surface. This was performed by placing
2mL of the silane liquid in the bottom of rectangular glass holders with a hemisphere
removed. Glass slides held the cement paste above the liquid with the polished side
down. Two samples for each water to cement ratio and silane coupling agent
combination were prepared. The other procedure was performed using an aqueous
solution where 1wt% of the selected coupling agent was added to a 90:10 by weight
ethanol:deionized water mixture. After the pH was adjusted to approximately 5 by the
addition of a few drops of acetic acid, the solutions were stirred for 60 minutes to allow
129
complete hydrolysis of the coupling agent. The silane solution was then pipetted onto
the polished cement paste surface and was placed into an oven at 60˚C for 1 hour 20
minutes.
Tapping mode AFM measurements were performed to evaluate the surface
roughness of the cement pastes. Both topological and phase images were recorded
with a Dimension 3100 using Nanoscope V. The scan rate was 1Hz and scan size was
50m by 50m using a probe with a cantilever spring constant of 40N/m and a
resonance frequency around 270 kHz. The free amplitude A0 of the cantilever tip in air
was kept around 20nm and the setpoint Asp/A0 was automatically determined by the
instrument during engaging.
FTIR samples were analyzed in DRIFT mode using KBr powder on a Magna-IR
E.S.P. System 760 Spectrometer with 128 sample and reference scans at 4cm-1
resolution from 600 to 4000 cm-1.
Static contact angle measurements were obtained using a Ramé-Hart Inc. auto-
pipetting goniometer, with a Schott-Fostec Inc. lighting system. A 5 L droplet of
deionized water was deposited onto the substrate and allowed to stabilize for 1 to 3
seconds before capturing the image used to analyze the experimental contact angle.
Measurements were taken on 5 different locations for each sample.
Survey and multiplex XPS spectra were recorded with a Perkin Elmer 5100 XPS
system with an Al K x-ray source operating at 15kV and 300 mA. Prior to acquiring
XPS spectra, samples were dried in a vacuum oven for 1 day at 100oC to evaporate
residual vapors, so an ultra high vacuum could be maintained in the instrument. The
samples were mounted to the holder with double sided adhesive tape and placed in a
130
vacuum in the range of 10-8 to 10-7 torr. All samples were run in survey mode from 1200
to 0 eV with a pass energy of 89.45 eV and high resolution multiplexes were taken
using a pass energy of 35.75 eV and a step size of 0.05 eV. The take off angle was 45
degrees relative to the detector. Binding energy positions were calibrated against the
adventitious carbon C1s peak position located at 285 eV. Spectra were analyzed and
deconvoluted with AugerScan software.
Results and Discussion
AFM Measurements
Previous research on imaging and modulus measurements on cementitious
materials using AFM has indicated a variation in mechanical properties between
hydrated and unhydrated particles and highlighted the importance of polishing
techniques138. A specific polishing procedure was outlined by Miller et al. that takes into
consideration the multi-phase composite nature of cement paste137. Their technique
involves grinding with polishing pads, with the sample mounted on a disc with adhesive
with a constant weight on top. A slow lapping speed was used up to 8 hours to
minimize sample disturbance. Roughness measurements verified the effectiveness of
their procedure, showing a RMS roughness of less than 100 nm after 2 hours of
polishing that decreased to less than 30 nm after 4 hours.
Figure 5-4 shows the 2D and corresponding 3D height images of polished
cement paste. A 50 m by 50 m scan size was chosen so a relatively large area could
be analyzed. If a smaller area was used it would not be representative of a typical
sample, since most samples were approximately 3cm by 3cm. Based on a 50 m by 50
m scan size the RMS roughness was measured to be 84.6nm. The small bright yellow
131
spots in the 2D height image are most likely noise. Using a Detak II A profilometer to
measure a 5mm scan line gave an average roughness of less than 1m, as compared
to greater than 3 m for the unpolished cement. Since the two techniques measure
different length scales, this difference in roughness measurement was expected. Based
off the work of Momber et al., the RMS roughness data suggests that the roughness of
the cement paste lies in a range where small variations will not substantially modify
contact angle measurements. Therefore, it can be assumed that the roughness after
the silane treatment will have a negligible effect on the contact angle measurement.
Figure 5-4. 2D and 3D AFM height images of polished cement paste
Contact Angle Measurements
Initial measurements of the contact angle of unpolished cement pastes ranged
from 70 to over 100 degrees. This variation correlates well with the results from the
aforementioned study on various engineering surfaces by Kubiak et al135. In this case
the roughness of the unpolished surface was greater than 3 m. The cement pastes
polished by hand had a roughness less than 1m and showed a contact angle of
132
approximately 60˚. This value is similar to values found in the literature, shown in Table
5-1, however, the high standard deviation of the data made it necessary to use a more
controlled method, i.e. automated polishing. While this other research did examine the
surface energy of cementitious materials using a variety of methods, typical water to
cement ratios of 0.4 to 0.5 were not investigated.
Table 5-1. Measurement of contact angles using different techniques on various concrete sample types
Measurement Method W/C Ratio Sample Type Contact Angle
Wilhelmy plate and tensiometer133 N/A Solution 60˚ Captive drop technique136 0.60 Bulk 50-66˚ Washburn method139 0.32 Powder 74˚
Figure 5-5 shows the contact angle measurements before and after treatment of
the silane coupling agents. The initial contact angle is represented by the darker color
on the left and the final contact angle by the lighter color. For all the samples, the initial
contact angle was approximately 60˚. The average hysteresis was approximately 1.5
degrees for the neat cement paste and 3 degrees after silane treatment.
Overall, APTES decreased the contact angle, while PDMS increased the contact
angle. This change in contact angle was expected, since the amino terminated silane
could hydrogen bond to deionized water during contact angle experiments, while the
PDMS silanes would make the surface more hydrophobic. The epoxy terminated
silane, GPTMS, had a negligible effect on the contact angle. The lack of change in the
contact angle is most likely due to the epoxy group having neither a hydrophobic or
hydrophilic preference. Furthermore, the 0.5 water to cement ratio samples
demonstrated a greater change in contact angle. As the water to cement ratio
increases, the spacing between cement particles increases and is accompanied by a
greater degree of hydration17b, 140. Therefore, the 0.5 w/c ratio samples have a greater
133
number of hydroxyl groups or hydrated species as compared to 0.4 w/c ratio samples.
This was confirmed by DRIFT (Figure 5-6) and ATR (not shown) IR experiments.
Figure 5-5. Contact angle measurements of silane treated cement pastes. The initial contact angle is represented by the darker color on the left and the contact angle after silane treatment is indicated by the lighter color on the right.
Figure 5-6. DRIFT IR spectra of 0.4 and 0.5 w/c ratio cement pastes
134
IR data confirmed the difference in OH and H2O present in samples with different
water to cement ratios. Spectra were linearly baseline corrected then normalized to the
asymmetric stretching vibration of CO in CaCO3 centered at 1460 cm-1. Visually, it is
clear that there is a greater absorbance in OH groups from 3,000 to 3,600 cm-1 and H2O
at 1,650 cm-1 for the 0.5 w/c ratio sample. Taking the areas under the in OH and H2O
absorbance peak and dividing by the CO absorbance gave a semi-quantitative value to
the difference between the two types of cement pastes. Using this approach, the 0.5
w/c samples had 28% more hydroxyl groups than the 0.4 w/c samples. The higher
number of hydroxyl groups correlates well with the contact angle measurements which
indicated a greater change in contact angle with the greater water to cement ratio
samples.
While pull off bond strengths were not performed on the samples, research by
Mansur et al. on polymer modified cement mortar – glass tile composites indicated an
increase in bond strength with a variety of different silanes141. The suggested
mechanism is the formation of a hybrid interface based on hydrogen bonds, where
hydroxyl side groups can act as a chemical cross linker agent between surface silanols
and water found in the interlayer space of hydrated cement. In their system they used
cement mortar modified with poly(ethylene-co-vinyl acetate) with a water to cement ratio
of 0.6. The system used in this study uses no sand and a lower water to cement ratio,
however, their suggested interfacial bonding may be appropriate for comparison. The
two proposed mechanisms by Choi et al. suggest that GPTMS interacts with hydrogen
bonding species of concrete to form a covalent linkage after condensation takes place,
or the GPTMS directly interacts with the epoxy to prevent moisture uptake. Although
135
Mansur et al. used EVA to promote hydrogen bonding of surface silanols and water in
the interlayer space with the polymer, the idea that these two groups are available to
come into contact and interact with the silane coupling agent may be a key to the
description of the bonding.
XPS
To explore the surface chemistry of the silane – cement paste interaction, XPS
experiments were performed. The XPS survey spectra of the cement paste before and
after treatment with the silane coupling agents are shown below, in Figure 5-7. The
elemental compositions and binding energies are summarized in Table 5-2.
Figure 5-7. XPS survey of treated and untreated cement pastes
While Portland cement is made up other elements besides C, O, Si, and Ca,
these elements were chosen because they are the most dominant and easiest to
136
resolve in the XPS spectra. For the samples coated with the silane coupling agents, an
increase in the atomic concentration of carbon, along with a decrease in oxygen and
calcium was found. This trend has been found by other authors investigating cement
paste before and after coating9. In addition, this change in atomic concentration
indicates the silanes were successfully deposited on the cement paste surface using the
horizontal evaporation technique. The increase in the silicon composition is most likely
due to the balancing of the elements to 100%. The small (less than 1%) amount of
nitrogen found on the silane deposited samples, except APTES, is most likely due to
oven cross contamination.
137
Table 5-2. Apparent surface composition and binding energies of treated and untreated cement pastes
In order to examine specific interactions between the silane coupling agent and
cement paste, high resolution XPS data was taken at 0.05 eV intervals. A Shirley
background and 80:20 Gaussian/Lorentzian peak shape was assumed in all cases.
C1s peaks for the neat cement paste was fit to 2 peaks, adventitious carbon at 285 eV
and carbonates at 289.5 eV, as also reported by other authors9b. After silane
depositions the carbonate peak underwent significant attenuation, along with the
emergence of a new peak ranging from 285.9 to 286.7 eV, due to the aliphatic carbon
chain. No significant changes in the Ca2p3 or N1s binding energies was found. The
peak deconvolutions, shown as the dotted lines, for the various electron orbitals are
shown in Figures 5-8 to 5-11. Note that the data have not been corrected for charging
effects.
Figure 5-8. C1s electron orbital XPS spectra including curve fitting of untreated cement
paste
139
Figure 5-9. C1s electron orbital XPS spectra including curve fitting of ATEPS treated cement paste
Figure 5-10. Ca2p3 electron orbital XPS spectra including curve fitting of untreated cement paste
140
Figure 5-11. N1s electron orbital XPS spectra including curve fitting of ATEPS treated
cement paste
While other authors have shown a change in peak shape and position in XPS
spectra after a change in the chemical environment of a material142, the findings in the
current study are more subtle. In order to determine if the silane treatment was
successful, O1s and Si2p binding energies were fit with 2 peaks, shown in Table 5-3.
The greater binding energy corresponds to bridging atoms and the lesser binding
energy corresponds to non-bridging atoms. Bridging oxygen atoms are bonded to
silicon atoms, in Si tetrahedral chains, while non-bridging oxygen atoms are typically
bound to calcium atoms or hydroxides143.
Curve fitting of the O1s line was performed in a method similar to Black et al,
where an 80:20 Gaussian/Lorentzian peak shape was assumed and a 1.9eV FWHM
was used to fit the two types of oxygens. A typical O1s electron orbital using these
parameters, including curve fitting is shown in Figure 5-12. In this study the bridging
141
and non bridging oxygen contributions of the neat cement paste were determined by
fitting the non bridging oxygen at 531.5 eV and the bridging oxygen at 532.58 eV. This
technique was verified by another control sample with good accuracy. The silane
treated samples were also fit to these same values so comparisons could be made
between samples. However, for a few of the samples an accurate fit using these values
could not be made so the binding energy position was allowed to change up to 0.5 eV.
Overall, both types of treatments (evaporation and aqueous) showed an increase in the
number of bridging oxygens relative to non bridging oxygens. In the condensation step
of the silane coupling agent reaction Si-O bonds are formed between the silane and
substrate and silane and itself, as shown in Figure 5-1. If the silanes had not
undergone the condensation step, there would be an increase in non bridging oxygen
atoms. Therefore, the increase in bridging oxygen atoms suggests that the various
silanes successfully bonded to the cement paste surface.
The Si 2p line was deconvoluted in the same method as the O 1s line, but with a
1.8 eV FWHM. A typically Si 2p electron orbital, including fitting, is shown in Figure 5-
13. Larger FWHM values were tried but the fittings were of lower accuracy. As with the
O 1s fittings, the binding energy positions were kept consistent so contributions of
bridging and non bridging silicon atoms could be determined. While the bridging silicon
atoms increased with silane treatment, the increase was greater for silanes using the
evaporation technique with the exception of the APTES silane. It is highly probable that
the evaporation technique resulted in a monolayer of silane being deposited on the
surface, while the aqueous technique deposited a thicker layer.
142
Figure 5-12. O1s electron orbital XPS spectra including curve fitting of untreated
cement paste
Figure 5-13. Si2p electron orbital XPS spectra including curve fitting of untreated
cement paste
The motivation behind examining 2 types of silane deposition lies in a previous
work by Choi et al. that investigated the durability of epoxy-concrete samples with
143
exposure to water after aqueous GPTMS treatment. In Choi’s work the explained
mechanism for improved durability in their system was a change from hydrogen to
covalent bonding at the interface, which now seems unlikely due to the minimal change
in the bridging silane atoms using that technique. Nguyen et al. found that using
aminoethylaminopropypltrimethoxysilane (0.1 wt%) decreased epoxy and E-glass
moisture absorption and improved interlaminar shear strength144. Ji et al. found that
using GPTMS (5 wt%) as an additive to epoxy prevented moisture absorption145. This
may be the real reason why in Choi’s work, the addition of the silane helped improve the
strength of the composite system, rather than a change in bonding. In addition, the
relatively high (1 wt%) amount of silane seems likely to interact with the epoxy as much
as with the cement paste. Mansur et al also cited a hydrogen bonding mechanism to
explain his composite system, but since changes in the binding energies due to
hydrogen bonding are quite difficult to detect in XPS this mechanism cannot be verified.
Summary
In this study, the effect of various silane treatments on cement paste chemistry
was investigated. This investigation examined the hypothesis that silanols on cement
paste surface may interact with silane coupling agents to create a new functionalized
surface. From the AFM data, the care in surface preparation was essential for
interpretation of the contact angle changes. Surface roughness has a strong effect of
the surface energy in this system and due to the inherent irregular nature of cement, a
uniform surface is essential for acquiring quantitative results. The contact angle data
demonstrated successful treatment of the surface with the silane coupling agents.
APTES made the surface more hydrophillic, PDMS improved the hydrophobicity of the
surface, and GPTES had no significant change. In addition, higher water to cement
144
ratio samples demonstrated a higher impact on the change in contact angle.
Deconvolution of the O 1s and Si 2p electron orbitals were performed to determine
contributions from bridging and non bridging atoms. An increase in bridging silicon and
oxygen atoms indicated successful silane condensation and a covalent bond was
formed between the cement paste and silanes. Furthermore, in using this peak fitting
strategy, the aqueous silane deposition was shown to be less successful than the
evaporation technique.
145
CHAPTER 7 GENERAL CONCLUSIONS AND FUTURE WORK
The first part of this work investigated the nature of the epoxy-concrete bond.
The initial hypothesis was that hydrogen bonding takes places at the interface, so small
molecule analogs of the epoxy molecule were adsorbed onto cement paste particles to
create a more simple system to analyze. ATR-FTIR experiments on the surface of
these composites did not show any change in the hydroxyl area (3,000 cm-1 to 3,700
cm-1) or other significant changes giving evidence of a hydrogen bond. Solid state NMR
experiments showed a weak interaction between BPA and cement paste and small
change in the chemical shift of the OH group. A few select samples with 20 and 30%
BPA showed new peaks with chemical shift values above 10ppm, however these results
were not reproducible. 2D NMR experiments also suggested a small interaction, but the
functional groups undergoing the interaction could not be directly determined. Most
likely, for these small molecules and this specific type of Portland cement with a 0.38
water to cement ratio, strong hydrogen bonding does not exist.
One of the main limitations of the investigation of hydrogen bonding in this
research was only using a water to cement ratio of 0.38. Perhaps using at 0.4 or 0.5
water to cement ratio would increase the number of cement hydrates so there would be
a greater number of sites available for interaction on the cement paste surface. Also,
the cured cement particle was ground down to 38 m or less, so perhaps even smaller
particle sizes down to 1 m or less would give a stronger signal due to the larger
surface area. In addition, Type I/II Portland cement was used while other authors have
used white cement, due to the lower iron content which reduces the interference of
paramagnetic relaxation115. Another consideration for NMR experiments could be to
146
use D2O rather than H2O. Due to the smaller magnetic moment of deuterons, the
broadening of the spectra would be much less, so that much better resolution may be
acquired.
The second part of this work focused on accelerated aging of the two epoxy
systems, including a model DGEBA-POPDA system, and a commercial system.
Mechanical testing was performed along with IR spectroscopy and diffusion modeling to
determine the change in properties and mechanisms of degradation. A decrease in
tensile strength and modulus and an increase in strain to failure was found with higher
temperatures, which was consistent with statistical analysis. An increase in hydroxyl
and H2O regions in the IR spectra was found after 8 weeks exposure. With UV and UV
with water exposure, the modulus did not decrease as much as with water alone. The
strain after UV exposure decreased less than the control after 8 weeks, reducing the
ductility of the samples which is typical of UV degradation. However, the data from UV
degraded samples was not statistically significant. IR data provided evidence of the
oxidative degradation mechanism for samples exposed to UV radiation alone, while
evidence of hydrolysis was found for samples exposed to UV and water.
While the goal of this part of the study was to examine how the mechanical
properties changed with exposure to accelerated aging conditions, the epoxy loss in
properties did not change after 2 to 4 weeks. However, the lack of further change in
mechanical properties may be due to the relatively short testing duration (8 weeks).
Other authors have reported the mechanism of hydrolysis with water exposure for
epoxy in experiments up to 12 months52, and with temperatures of 80˚C with 80%
RH146, which this study did not find. In the event of hydrolysis, due to the breaking of
147
polymer chains, a greater loss in properties is expected than chain swelling by water
absorption. Therefore, more extensive testing periods covering up to 6 months are
essential, along with a greater variation in temperatures to more fully investigate the
change in properties and mechanisms of degradation. Also, varying the type of curing
agent may be interesting to examine other evidence for degradation mechanisms.
The final section of this work used silane coupling agents to modify cement
pastes. The contact angle was shown to increase for the PDMS based silane, decrease
for the amino based silane, and not change for the epoxy based silane. The 0.5 w/c
ratio samples demonstrated a greater change in contact angles, due to a greater
amount of silanols and OH groups, as compared to the 0.4 w/c ratio cement paste.
Fitting of the O1s and Si2p peaks, indicated an increase in bridging oxygen and silicon
atoms, giving evidence for covalent bonds being formed between the cement paste and
silane coupling agents. Aqueous silane treatments of the cement paste surfaces did not
indicate successful bond formations for the PDMS and GPTES silanes on the cement
paste surfaces. For use in field conditions on civil engineering sites, the aqueous
technique would be more appropriate, but large variations and no trends regarding the
contact angle limited the findings using that technique. Future work on a greater
variation of silane coupling agents and application techniques would supplement this
part of the work and be quite useful in field conditions.
148
APPENDIX A MECHANICAL PROPERTIES OF THE MODEL EPOXY SYSTEM DURING
HYGROTHERMAL EXPOSURE
Temp (˚C)
Exposure Time (weeks)
Peak Stress (MPa) Stdev
Modulus (GPa) Stdev Strain (%) Stdev
Control 0 64.12 12.41 2.34 0.26 3.48 1.10
2 71.71 8.96 2.47 0.23 3.38 0.30
4 66.18 8.27 2.45 0.08 3.43 1.00
6 68.26 9.65 2.48 0.20 2.95 0.60
8 74.46 4.83 2.45 0.08 3.50 0.40
30 2 67.57 10.34 2.24 0.30 3.90 0.36
4 66.88 4.14 2.19 0.10 3.75 0.40
6 66.19 4.14 2.10 0.16 4.40 0.60
8 64.12 2.07 2.13 0.16 4.56 0.76
40 2 64.81 6.21 2.12 0.26 4.47 0.80
4 63.43 4.14 2.02 0.19 4.03 0.40
6 64.81 2.07 2.04 0.12 4.20 0.40
8 65.50 4.83 1.94 0.07 4.70 0.70
50 2 65.50 4.83 2.07 0.10 4.80 0.40
4 67.57 4.83 2.17 0.17 4.50 0.40
6 59.29 8.96 1.97 0.13 3.97 0.90
8 67.57 6.21 1.91 0.15 5.10 0.90
60 2 57.23 5.52 2.01 0.08 6.05 3.80
4 54.47 5.52 1.81 0.20 5.23 1.80
6 55.16 0.69 1.81 0.19 4.49 0.45
8 56.54 6.21 1.78 0.14 4.73 0.37
70 2 59.98 4.83 1.94 0.21 4.95 0.90
4 54.47 4.83 1.92 0.20 4.70 1.30
6 49.64 3.45 1.80 0.09 3.95 0.34
8 48.95 3.45 1.65 0.07 4.52 0.73
80 2 47.57 2.76 1.77 0.15 4.30 0.70
4 48.26 5.52 1.70 0.14 4.10 0.25
6 51.02 4.83 1.74 0.14 4.20 0.32
8 48.95 3.45 1.67 0.19 4.30 0.20
90 2 53.78 0.69 1.95 0.15 3.90 0.30
4 46.19 2.76 1.72 0.15 3.70 0.50
6 46.19 6.21 1.82 0.17 3.40 0.80
8 46.19 4.14 1.62 0.17 4.20 0.50
149
APPENDIX B TYPICAL LOAD-DISPLACEMENT CURVES FOR HYGROTHERMALLY EXPOSED
SAMPLES AFTER 8 WEEKS
Unexposed
30˚C
150
40˚C
50˚C
151
60˚C
70˚C
152
80˚C
90˚C
153
APPENDIX C MECHANICAL PROPERTIES OF THE MODEL EPOXY SYSTEM DURING UV
EXPOSURE
Exposure Exposure Time (weeks)
Peak Stress (MPa) Stdev
Modulus (GPa) Stdev
Strain (%) Stdev
UV 1 73.77 0.69 2.22 0.09 5.22 0.53
2 75.15 3.45 2.28 0.18 4.96 0.45
4 65.50 13.10 1.97 0.11 4.61 1.47
6 59.29 17.24 1.93 0.19 4.10 1.64
8 42.75 11.72 2.27 0.21 2.02 0.49
UV + Water 1 66.19 4.14 2.20 0.09 4.77 0.30
2 64.12 1.38 2.07 0.11 4.26 0.08
4 61.36 6.21 2.04 0.28 4.29 1.09
6 68.26 3.45 2.01 0.18 4.77 0.20
8 50.33 9.65 2.03 0.04 2.82 0.93
154
APPENDIX D MECHANICAL PROPERTIES OF SIKADUR 300 DURING HYGROTHERMAL
EXPOSURE
Temperature (˚C)
Exposure Time (weeks)
Peak stress (MPa) Stdev
Modulus (GPa) Stdev Strain Stdev
control 0 62.05 6.21 2.09 0.16 3.663 0.50
2 63.43 11.03 2.12 0.18 4.106 0.41
4 68.26 2.07 2.35 0.13 4.629 1.34
6 65.50 4.14 2.29 0.20 3.611 0.17
8 68.26 3.45 2.29 0.08 4.267 0.81
30 2 62.05 3.45 1.97 0.18 4.187 0.26
4 56.54 4.14 2.02 0.07 5.616 0.38
6 51.71 2.07 2.04 0.14 3.297 0.36
8 56.54 2.76 2.00 0.22 4.153 0.82
40 2 56.54 6.89 1.90 0.13 4.240 0.48
4 50.33 6.21 1.82 0.17 4.429 0.79
6 48.26 4.83 1.80 0.22 3.688 0.62
8 50.33 3.45 1.79 0.08 3.785 0.21
50 2 51.02 7.58 1.76 0.18 3.893 0.20
4 44.13 3.45 1.63 0.16 3.885 0.49
6 44.82 4.83 1.81 0.12 3.717 0.61
8 46.88 2.76 1.74 0.11 3.874 0.24
60 2 46.19 4.14 1.71 0.08 3.923 0.38
4 44.13 3.45 1.53 0.15 4.294 0.72
6 42.75 4.14 1.70 0.13 6.924 4.41
8 45.51 2.07 1.67 0.17 3.995 0.67
70 2 48.95 4.14 1.78 0.11 4.415 1.00
4 44.13 2.07 1.61 0.08 4.128 0.31
6 39.30 2.07 1.68 0.04 9.836 11.72
8 42.06 2.76 1.61 0.11 3.642 0.27
80 2 44.82 2.76 1.61 0.15 3.785 0.25
4 41.37 2.76 1.54 0.08 4.246 0.98
6 39.99 3.45 1.68 0.09 5.212 3.85
8 44.82 3.45 1.58 0.24 3.955 0.49
155
APPENDIX E MANOVA RESULTS FOR MODULUS VALUES FOR THE MODEL EPOXY SYSTEM
WITH HYGROTHERMAL EXPOSURE
Multivariate Testsc
Effect Value F Hypothesis df Error df Sig.
temperature Pillai's Trace .653 4.084a 6.000 13.000 .016
Wilks' Lambda .347 4.084a 6.000 13.000 .016
Hotelling's Trace 1.885 4.084a 6.000 13.000 .016
Roy's Largest Root 1.885 4.084a 6.000 13.000 .016
temperature * Control Pillai's Trace .613 3.434a 6.000 13.000 .030
Wilks' Lambda .387 3.434a 6.000 13.000 .030
Hotelling's Trace 1.585 3.434a 6.000 13.000 .030
Roy's Largest Root 1.585 3.434a 6.000 13.000 .030
temperature * Week Pillai's Trace .834 .962 18.000 45.000 .516
Wilks' Lambda .367 .879 18.000 37.255 .604
Hotelling's Trace 1.224 .793 18.000 35.000 .694
Roy's Largest Root .665 1.662b 6.000 15.000 .198
a. Exact statistic
b. The statistic is an upper bound on F that yields a lower bound on the significance level.
Within Subjects Design: temperature
For this analysis a 95% confidence interval was used. If Sig. is 0.05 or less, then the difference between the means is statistically significant. Hypothesis df and Error df are the v1 and v2 values that are used to identify the tabled value in the f distribution
table where = 0.05. If the test statistic, F, is greater than that tabled value, then the null hypothesis (the means are equal), is rejected. This is to say that there is a statistically significant difference.
When there are more than two levels, there are multiple ways in which the data can be combined to separate the groups, so there are four test criteria to determine the statistical significance of MANOVA data. Wilk’s Lambda, Hotelling’s Trace, and Pillai’s Trace all pool the variance from the dimensions to create the test significance. Roy’s Largest Root only uses the variance from the dimension that separates the groups most.
In this specific example, a MANOVA was run to determine if changes in temperature had a significant effect on the modulus values of my samples. The values in the Sig column are less than 0.05 for temperature and temperature compared to the control, but not for temperature compared to the week. Therefore, the change in the modulus as a function of week was not statistically significant, but the change in the modulus as a function of temperature, and as compared to the control was statistically significant. All of the four criteria yielded the same result for all experiments.
156
LIST OF REFERENCES
1. Chen, J. S.; Ober, C. K.; Poliks, M. D.; Zhang, Y. M.; Wiesner, U.; Cohen, C., Controlled degradation of epoxy networks: analysis of crosslink density and glass transition temperature changes in thermally reworkable thermosets. Polymer 2004, 45 (6), 1939-1950.
2. Hu, Y. F.; Ellyin, F.; Xia, Z. H., An experimental investigation of normal and shear
stress interaction of an epoxy resin and model predictions. Polym. Eng. Sci. 2001, 41 (11), 2047-2060.
3. (a) Jones, R.; Chiu, W. K.; Hanna, S., Potential Faiure mechanisms of bonded
composite repairs for metal and concrete. Theoretical and Applied Fracture Mechanics 1994, 21 (2), 107-119; (b) Hong, S. G., The Thermal-Oxidative Degradation of an Epoxy Adhesive on Metal Substrates. XPS and RAIR Analyses. Polym. Degrad. Stabil. 1995, 48 (2), 211-218; (c) Schmidt, R.; Bell, J., Epoxy adhesion to metals. Epoxy Resins and Composites II. Dušek, K., Ed. Springer Berlin / Heidelberg: 1986; Vol. 75, pp 33-71.
4. (a) Lefebvre, D. R.; Elliker, P. R.; Takahashi, K. M.; Raju, V. R.; Kaplan, M. L.,
The critical humidity effect in the adhesion of epoxy to glass: role of hydrogen bonding. J. Adhes. Sci. Technol. 2000, 14 (7), 925-937; (b) Dewimille, B.; Bunsell, A. R., Accelerated aging of a glass fiber-reinforced epoxy-resin in water. Composites 1983, 14 (1), 35-40.
5. Adams, R. D.; Singh, M. M., The dynamic properties of fibre-reinforced polymers
exposed to hot, wet conditions. Compos. Sci. Technol. 1996, 56 (8), 977-997. 6. (a) Chu, W.; Wu, L. X.; Karbhari, V. M., Durability evaluation of moderate
temperature cured E-glass/vinylester systems. Compos. Struct. 2004, 66 (1-4), 367-376; (b) Karbhari, V. M., E-glass/vinylester composites in aqueous environments: Effects on short-beam shear strength. J. Compos. Constr. 2004, 8 (2), 148-156; (c) Chu, W.; Karbhari, V. M., Effect of water sorption on performance of pultruded E-glass/vinylester composites. J. Mater. Civ. Eng. 2005, 17 (1), 63-71; (d) Ramirez, F. A.; Carlsson, L. A.; Acha, B. A., Evaluation of water degradation of vinylester and epoxy matrix composites by single fiber and composite tests. J. Mater. Sci. 2008, 43 (15), 5230-5242.
7. (a) Czarneck, L., Adhesion - A challenge for concrete repair. In Concrete Repair,
Rehabilitation and Retrofitting II, Alexander, M. G., Ed. Taylor & Francis Group: London, 2008; pp 935-940; (b) Karbhari, V. M.; Engineer, M.; Eckel, D. A., On the durability of composite rehabilitation schemes for concrete: Use of a peel test. J. Mater. Sci. 1997, 32 (1), 147-156; (c) Garbacz, A.; Gorka, M.; Courard, L., Effect of concrete surface treatment on adhesion in repair systems. Mag. Concr. Res. 2005, 57 (1), 49-60; (d) Momayez, A.; Ehsani, M. R.; Ramezanianpour, A. A.; Rajaie, H., Comparison of methods for evaluating bond strength between
8. (a) deBruyne, N. A., The adhesive properties of epoxy resins. J. Appl. Chem.
1956, 6, 303-310; (b) Schmidt, R. G.; Bell, J. P., Epoxy adhesion to metals. Adv. Polym. Sci. 1986, 75, 33-71.
9. (a) Neves, M. I. B.; Oliva, V.; Mrabet, B.; Connan, C.; Chehimi, M. M.; Delamar,
M.; Hutton, S.; Roberts, A.; Benzarti, K., Surface chemistry of cement pastes: a study by x-ray photoelectron spectroscopy. Surface and Interface Analysis 2002, 33 (10-11), 834-841; (b) Djouani, F.; Connan, C.; Delamar, M.; Chehimi, M. M.; Benzarti, K., Cement paste-epoxy adhesive interactions. Constr. Build. Mater. 2011, 25 (2), 411-423.
10. MacLaren, D. C.; White, M. A., Cement: Its chemistry and properties. Journal of
Chemical Education 2003, 80 (6), 623-635. 11. Bye, G. C., Portland cement : composition, production and properties. Thomas
Telford: London, 1999. 12. Taylor, H. F., Cement Chemistry. 2 ed.; Thomas Telford Limited: Heron Quay,
London, 1997. 13. Grutzeck, M. W., A new model for the formation of calcium silicate hydrate (C-S-
H). Materials Research Innovations 1999, 3 (3), 160-170. 14. (a) H.J.H, B., The work of Powers and Brownyard revisited: Part 1. Cem. Concr.
Res. 2004, 34 (9), 1697-1716; (b) H.J.H, B., The work of Powers and Brownyard revisited: Part 2. Cem. Concr. Res. 2005, 35 (10), 1922-1936.
15. Brunauer, S.; Kantro, D. L.; Copeland, L. E., The Stoichiometry of the Hydration
of β-Dicalcium Silicate and Tricalcium Silicate at Room Temperature. Journal of the American Chemical Society 1958, 80 (4), 761-767.
16. Feldman, R.; Sereda, P., A model for hydrated Portland cement paste as
deduced from sorption-length change and mechanical properties. Materials and Structures 1968, 1 (6), 509-520.
17. (a) Hamlin M, J., A model for the microstructure of calcium silicate hydrate in
cement paste. Cem. Concr. Res. 2000, 30 (1), 101-116; (b) Tennis, P. D.; Jennings, H. M., A model for two types of calcium silicate hydrate in the microstructure of Portland cement pastes. Cem. Concr. Res. 2000, 30 (6), 855-863.
18. Jennings, H. M., A model for the microstructure of calcium silicate hydrate in
Lequeux, N., New covalent bonded polymer-calcium silicate hydrate composites. Journal of Materials Chemistry 2007, 17 (9), 913-922.
20. H.F.W, T., Nanostructure of CSH: Current status. Adv. Cem. Based Mater. 1993,
1 (1), 38-46. 21. Kondo, K. F. a. W., Estimation of Thermochemical Data for Calcium Silicate
Hydrate (C–S–H). J. Am. Ceram. Soc. 1983, 66 (12), 220-221. 22. Cong, X.; Kirkpatrick, R. J., 29Si MAS NMR study of the structure of calcium
silicate hydrate. Adv. Cem. Based Mater. 1996, 3 (3–4), 144-156. 23. Pellenq, R. J. M.; Kushima, A.; Shahsavari, R.; Van Vliet, K. J.; Buehler, M. J.;
Yip, S.; Ulm, F. J., A realistic molecular model of cement hydrates. Proc. Natl. Acad. Sci. U. S. A. 2009, 106 (38), 16102-16107.
24. Udoeyo, F. F.; Brooks, R.; Udo-Inyang, P.; Nsan, R. O., Early Prediction of
Laterized Concrete Strength by Accelerated Testing. IJRRAS 2010, 5 (1), 1-5. 25. Naik, T. R., Utilization of Accelerated Strength Testing Methods. Cem. Concr.
Res. 1979, 9 (1), 7-17. 26. Resheidat, M. R.; Ghanma, M. S., Accelerated strength and testing of concrete
using blended cement. Adv. Cem. Based Mater. 1997, 5 (2), 49-56. 27. Gharaibeh, H. M. T. a. E. S., Early Estimation of Hardened Concrete Strength.
Journal of Applied Sciences 2006, 6 (3), 543-547. 28. Meyer, D., A Statistical Comparison of Accelerated Concrete Testing Methods. In
Journal of Applied Mathematics and Decision Sciences, 1997; Vol. 1, pp 89-100. 29. Bicerano, J., Prediction of Polymer Properties. CRC Press: Midland, Michigan,
USA, 2002. 30. Mark, J. E., Physical Properties of Polymers. Cambridge University Press: 2004. 31. Ratna, D., Handbook of Thermoset Resins. Smithers Rapra Technology: 2009. 32. (a) Musto, P.; Mascia, L.; Ragosta, G.; Scarinzi, G.; Villano, P., The transport of
water in a tetrafunctional epoxy resin by near-infrared Fourier transform spectroscopy. Polymer 2000, 41 (2), 565-574; (b) Mijović, J.; Lin, K.-F., The effect of hygrothermal fatigue on physical/mechanical properties and morphology of neat epoxy resin and graphite/epoxy composite. J. Appl. Polym. Sci. 1985, 30 (6), 2527-2549.
159
33. Soles, C. L.; Yee, A. F., A discussion of the molecular mechanisms of moisture transport in epoxy resins. J. Polym. Sci. Pt. B-Polym. Phys. 2000, 38 (5), 792-802.
34. Choi, S.; Douglas, E. P., Complex Hygrothermal Effects on the Glass Transition
of an Epoxy-Amine Thermoset. ACS Appl. Mater. Interfaces 2010, 2 (3), 934-941.
35. Gu, X.; Stanley, D.; Byrd, W. E.; Dickens, B.; Vaca-Trigo, I.; Meeker, W. Q.;
Nguyen, T.; Chin, J. W.; Martin, J. W., Linking Accelerated Laboratory Test with Outdoor Performance Results for a Model Epoxy Coating System. In Service Life Prediction of Polymeric Materials, Martin, J. W.; Ryntz, R. A.; Chin, J.; Dickie, R. A., Eds. Springer US: 2009; pp 3-28.
36. Ellis, T. S.; Karasz, F. E., Intereaction of Epoxy-Resins with Water - The
Depression of Glass Transition Temperature. Polymer 1984, 25 (5), 664-669. 37. Jelinski, L. W.; Dumais, J. J.; Cholli, A. L.; Ellis, T. S.; Karasz, F. E., Nature of the
Water Epoxy Interaction. Macromolecules 1985, 18 (6), 1091-1095. 38. (a) Zhou, J. M.; Lucas, J. P., Hygrothermal effects of epoxy resin. Part I: The
nature of water in epoxy. Polymer 1999, 40 (20), 5505-5512; (b) Zhou, J. M.; Lucas, J. P., Hygrothermal effects of epoxy resin. Part II: variations of glass transition temperature. Polymer 1999, 40 (20), 5513-5522.
39. Bockenheimer, C.; Fata, D.; Possart, W., New aspects of aging in epoxy
networks. I. Thermal aging. J. Appl. Polym. Sci. 2004, 91 (1), 361-368. 40. Bockenheimer, C.; Fata, D.; Possart, W., New aspects of aging in epoxy
networks. II. Hydrothermal aging. J. Appl. Polym. Sci. 2004, 91 (1), 369-377. 41. Fredj, N.; Cohendoz, S.; Feaugas, X.; Touzain, S., Some consequences of saline
solution immersion on mechanical behavior of two marine epoxy-based coatings. Prog. Org. Coat. 2010, 69 (1), 82-91.
42. Papanicolaou, G. C.; Kosmidou, T. V.; Vatalis, A. S.; Delides, C. G., Water
absorption mechanism and some anomalous effects on the mechanical and viscoelastic behavior of an epoxy system. J. Appl. Polym. Sci. 2006, 99 (4), 1328-1339.
43. Lin, Y. C.; Chen, X.; Wang, Z. P., Effects of hygrothermal aging on anisotropic
conductive adhesive joints: experiments and theoretical analysis. J. Adhes. Sci. Technol. 2006, 20 (12), 1383-1399.
160
44. Yang, Q. A.; Xian, G. J.; Karbhari, V. M., Hygrothermal ageing of an epoxy adhesive used in FRP strengthening of concrete. J. Appl. Polym. Sci. 2008, 107 (4), 2607-2617.
45. Doyle, G.; Pethrick, R. A., Environmental effects on the ageing of epoxy adhesive
joints. Int. J. Adhes. Adhes. 2009, 29 (1), 77-90. 46. Singh, R. P.; Khait, M.; Zunjarrao, S. C.; Korach, C. S.; Pandey, G.,
Environmental Degradation and Durability of Epoxy-Clay Nanocomposites. Journal of Nanomaterials 2010, 2010.
47. Shi, X. D.; Hinderliter, B. R.; Croll, S. G., Environmental and time dependence of
moisture transportation in an epoxy coating and its significance for accelerated weathering. J. Coat. Technol. Res. 2010, 7 (4), 419-430.
48. Rezig, A.; Nguyen, T.; Martin, D.; Sung, L.; Gu, X.; Jasmin, J.; Martin, J. W.,
Relationship between chemical degradation and thickness loss of an amine-cured epoxy coating exposed to different UV environments. JCT Res. 2006, 3 (3), 173-184.
49. Hu, J. W.; Li, X. G.; Gao, J.; Zhao, Q. L., UV aging characterization of epoxy
varnish coated steel upon exposure to artificial weathering environment. Mater. Des. 2009, 30 (5), 1542-1547.
50. Lim, K. B.; Lee, D. C., Study of the surface degradation mechanism of an epoxy
insulator exposed to water. J. Korean Phys. Soc. 2000, 37 (1), 49-54. 51. Fata, D.; Possart, W., Aging behavior of a hot-cured epoxy system. J. Appl.
Polym. Sci. 2006, 99 (5), 2726-2736. 52. Xian, G. J.; Karbhari, V. M., DMTA based investigation of hygrothermal ageing of
an epoxy system used in rehabilitation. J. Appl. Polym. Sci. 2007, 104 (2), 1084-1094.
53. Frigione, M.; Aiello, M. A.; Naddeo, C., Water effects on the bond strength of
concrete/concrete adhesive joints. Constr. Build. Mater. 2006, 20 (10), 957-970. 54. Antoon, M. K.; Koenig, J. L., Irreversible Effects of Moisture on the Epoxy Matrix
in Glass-Reinforced Composites J. Polym. Sci. Pt. B-Polym. Phys. 1981, 19 (2), 197-212.
55. Li, L.; Yu, Y. F.; Su, H. H.; Zhan, G. Z.; Li, S. J.; Wu, P. Y., The Diffusion
Mechanism of Water Transport in Amine-Cured Epoxy Networks. Appl. Spectrosc. 2010, 64 (4), 458-465.
161
56. Wu, P.; Siesler, H. W., Water diffusion into epoxy resin: a 2D correlation ATR-FTIR investigation. Chemical Physics Letters 2003, 374 (1-2), 74-78.
57. Noda, I., Two-dimensional infrared spectroscopy. Journal of the American
Chemical Society 1989, 111 (21), 8116-8118. 58. Musto, P., Two-Dimensional FTIR Spectroscopy Studies on the Thermal-
Oxidative Degradation of Epoxy and Epoxy−Bis(maleimide) Networks. Macromolecules 2003, 36 (9), 3210-3221.
62. Xiao, G. Z.; Delamar, M.; Shanahan, M. E. R., Irreversible interactions between
water and DGEBA/DDA epoxy resin during hydrothermal aging. J. Appl. Polym. Sci. 1997, 65 (3), 449-458.
63. Jana, S.; Zhong, W. H., FTIR study of ageing epoxy resin reinforced by reactive
graphitic nanofibers. J. Appl. Polym. Sci. 2007, 106 (5), 3555-3563. 64. Miyano, Y.; Nakada, M.; Sekine, N., Accelerated testing for long-term durability of
FRP laminates for marine use. J. Compos Mater. 2005, 39 (1), 5-20. 65. Yanzhong Zhang, Z. L. a. P. L., Study on the Behavior of Accelerated Ageing
Fabric-Reinforced Epoxy Composites. 29th International SAMPE Technical Conference 1997, 197-206.
66. Chen, Y.; Davalos, J. F.; Ray, I.; Kim, H. Y., Accelerated aging tests for
evaluations of durability performance of FRP reinforcing bars for concrete structures. Compos. Struct. 2007, 78 (1), 101-111.
67. Micelli, F.; Nanni, A., Durability of FRP rods for concrete structures. Constr.
Build. Mater. 2004, 18 (7), 491-503. 68. Murthy, H. N.; Sreejith, M.; Krishna, M.; Sharma, S. C.; Sheshadri, T. S.,
Seawater Durability of Epoxy / Vinyl Ester Reinforced With Glass / Carbon Composites. J. Reinf. Plast. Compos. 2010, 29 (10), 1491-1499.
162
69. Lee, M. C.; Peppas, N. A., Water Transport in Graphite Epoxy Composites. J. Appl. Polym. Sci. 1993, 47 (8), 1349-1359.
70. Ray, B. C., Effects of changing environment and loading speed on mechanical
behavior of FRP composites. J. Reinf. Plast. Compos. 2006, 25 (12), 1227-1240. 71. Kumar, H. G.; Singh, R. P.; Nakamura, T., Degradation of carbon fiber-reinforced
epoxy composites by ultraviolet radiation and condensation. J. Compos Mater. 2002, 36 (24), 2713-2733.
72. Callister, W. D.; Rethwisch, D. G., Fundamentals of Materials Science and
Engineering: An Integrated Approach. John Wiley & Sons: 2011. 73. Hulatt, J.; Hollaway, L.; Thorne, A., Preliminary investigations on the
environmental effects on new heavyweight fabrics for use in civil engineering. Composites Part B: Engineering 2002, 33 (6), 407-414.
ageing behaviour of the adhesive bond between concrete specimens and CFRP overlays. Constr. Build. Mater. 2011, 25 (2), 523-538.
76. Mufti, A. A.; Onofrei, M.; Benmokrane, B.; Banthia, N.; Boulfiza, M.; Newhook, J.
P.; Bakht, B.; Tadros, G. S.; Brett, P., Field study of glass-fibre-reinforced polymer durability in concrete. Can. J. Civ. Eng. 2007, 34 (3), 355-366.
77. Lyons, J.; Laub, D.; Giurgiutiu, V.; Petrou, M.; Salem, H., Effect of hygrothermal
aging on the fracture of composite overlays on concrete. J. Reinf. Plast. Compos. 2002, 21 (4), 293-309.
78. Leveque, D.; Schieffer, A.; Mavel, A.; Maire, J. F., Analysis of how thermal aging
affects the long-term mechanical behavior and strength of polymer-matrix composites. Compos. Sci. Technol. 2005, 65 (3-4), 395-401.
79. Toutanji, H. A.; Gomez, W., Durability characteristics of concrete beams
80. (a) Au, C.; Buyukozturk, O., Peel and shear fracture characterization of
debonding in FRP plated concrete affected by moisture. J. Compos. Constr. 2006, 10 (1), 35-47; (b) Tuakta, C.; Büyüköztürk, O., Deterioration of FRP/concrete bond system under variable moisture conditions quantified by fracture mechanics. Composites Part B: Engineering 2011, 42 (2), 145-154.
163
81. (a) El-Hawary, M.; Al-Khaiat, H.; Fereig, S., Performance of epoxy-repaired concrete in a marine environment. Cem. Concr. Res. 2000, 30 (2), 259-266; (b) El-Hawary, M.; Al-Khaiat, H.; Fereig, S., Effect of sea water on epoxy-repaired concrete. Cem. Concr. Compos. 1998, 20 (1), 41-52.
82. Mourad, A.-H.; Abdel-Magid, B.; El-Maaddawy, T.; Grami, M., Effect of Seawater
and Warm Environment on Glass/Epoxy and Glass/Polyurethane Composites. Applied Composite Materials 2010, 17 (5), 557-573.
83. Silva, M. A. G., Aging of GFRP laminates and confinement of concrete columns.
Compos. Struct. 2007, 79 (1), 97-106. 84. (a) Silva, M.; Biscaia, H., Degredation of Bond between FRP and RC Beams.
Compos. Struct. 2008, 85, 164-174; (b) Silva, M. A. G.; Biscaia, H. C., Effects of exposure to saline humidity on bond between GFRP and concrete. Compos. Struct. 2010, 93 (1), 216-224.
85. Nakamura, T.; Singh, R. P.; Vaddadi, P., Effects of environmental degradation on
86. Khan, L. A.; Nesbitt, A.; Day, R. J., Hygrothermal degradation of 977-2A
carbon/epoxy composite laminates cured in autoclave and Quickstep. Compos. Pt. A-Appl. Sci. Manuf. 2010, 41 (8), 942-953.
87. Park, C. G.; Jang, C. I.; Lee, S. W.; Won, J. P., Microstructural investigation of
long-term degradation mechanisms in GFRP dowel bars for jointed concrete pavement. J. Appl. Polym. Sci. 2008, 108 (5), 3128-3137.
88. Lee, B. S.; Lee, D. C., Surface degradation properties of ultraviolet treated
epoxy/glass fiber. IEEE Trns. Dielectr. Electr. Insul. 1999, 6 (6), 907-912. 89. Kinloch, A. J., The science of adhesion. J. Mater. Sci. 1980, 15 (9), 2141-2166. 90. Kim, W.-S.; Yun, I.-H.; Lee, J.-J.; Jung, H.-T., Evaluation of mechanical interlock
effect on adhesion strength of polymer–metal interfaces using micro-patterned surface topography. Int. J. Adhes. Adhes. 2010, 30 (6), 408-417.
91. (a) Beushausen, H., The influence of concrete substrate preparation on overlay
bond strength. Mag. Concr. Res. 2010, 62 (11), 845-852; (b) Ghafari, E.; Naderi, M., Effect of Different Curing Regime and Cementitious Materials on the Bond Strength of Self Compacting Mortars. Australian Journal of Basic and Applied Sciences 2011, 5 (12), 421-428.
164
92. Ye, L.; Friedrich, K.; Weimer, C.; Mai, Y. W., Surface treatments and adhesion bonding between concrete and a CFRP composite. Adv. Compos. Mater. 1998, 7 (1), 47-61.
93. Kinloch, A. J., Adhesion and Adhesives Science and Technology. Chapman and
Hall: New York, 1987. 94. Wake, W. C., Adhesion and the Formulation of Adhesives. Applied Science
Publishers: London, 1982. 95. Steiner, T., The hydrogen bond in the solid state. Angewandte Chemie
(International ed. in English) 2002, 41 (1), 49-76. 96. (a) Lippmaa, E.; Magi, M.; Tarmak, M.; Wieker, W.; Grimmer, A. R., A high-
resolution Si-29 NMR study of the hydration of a tricalcium-silicate. Cem. Concr. Res. 1982, 12 (5), 597-602; (b) Wieker, W.; Grimmer, A. R.; Winkler, A.; Mägi, M.; Tarmak, M.; Lippmaa, E., Solid-state high-resolution 29Si NMR spectroscopy of synthetic 14 Å, 11 Å and 9 Å tobermorites. Cem. Concr. Res. 1982, 12 (3), 333-339.
97. Hennel, J.; Klinowski, J., Magic-Angle Spinning: a Historical Perspective. New
Techniques in Solid-State NMR. Klinowski, J., Ed. Springer Berlin / Heidelberg: 2005; Vol. 246, pp 1-14.
98. Massiot, D.; Fayon, F.; Capron, M.; King, I.; Le Calve, S.; Alonso, B.; Durand, J.
99. Feike, M.; Demco, D. E.; Graf, R.; Gottwald, J.; Hafner, S.; Spiess, H. W.,
Broadband multiple-quantum NMR spectroscopy. Journal of Magnetic Resonance Series A 1996, 122 (2), 214-221.
100. Schnell, I.; Spiess, H. W., High-Resolution 1H NMR Spectroscopy in the Solid
State: Very Fast Sample Rotation and Multiple-Quantum Coherences. Journal of Magnetic Resonance 2001, 151 (2), 153-227.
101. (a) Ghosh, S. N.; Handoo, S. K., Infrared and Raman spectral studies in cement
and concrete (review). Cem. Concr. Res. 1980, 10 (6), 771-782; (b) Chollet, M.; Horgnies, M., Analyses of the surfaces of concrete by Raman and FT-IR spectroscopies: comparative study of hardened samples after demoulding and after organic post-treatment. Surface and Interface Analysis 2011, 43 (3), 714-725; (c) Delgado, A. H.; Paroli, R. M.; Beaudoin, J. J., Comparison of IR techniques for the characterization of construction cement minerals and hydrated products. Appl. Spectrosc. 1996, 50 (8), 970-976.
165
102. (a) Mojumdar, S. C.; Raki, L. In Characterization and properties of calcium silicate hydrate polymer nanocomposites, Baltimore, Maryland, 2005-04-10; Baltimore, Maryland, pp 1-10; (b) Gao, X. F.; Lo, Y.; Tam, C. M.; Chung, C. Y., Analysis of the infrared spectrum and microstructure of hardened cement paste. Cem. Concr. Res. 1999, 29 (6), 805-812.
103. Slootmaekers, B.; Desseyn, H. O., Characterization of intermolecular hydrogen-
bonding in the solid-state using variable-temperature IR spectroscopy. Appl. Spectrosc. 1991, 45 (1), 118-120.
infrared spectrometry. I: Hydration process and interaction configurations of embedded H2O molecules. Journal of Physical Chemistry B 1999, 103 (24), 4979-4985.
105. Cummins, H. Z., Liquid, glass, gel: The phases of colloidal Laponite. Journal of
Non-Crystalline Solids 2007, 353 (41-43), 3891-3905. 106. Tawari, S. L.; Koch, D. L.; Cohen, C., Electrical Double-Layer Effects on the
Brownian Diffusivity and Aggregation Rate of Laponite Clay Particles. J. Colloid Interface Sci. 2001, 240 (1), 54-66.
107. Jaber, M.; Lambert, J. F., A New Nanocomposite: L-DOPA/Laponite. J. Phys.
Chem. Lett. 2010, 1 (1), 85-88. 108. Fei, B.; Chen, C.; Peng, S. W.; Zhao, X. J.; Wang, X. H.; Dong, L. S., FTIR study
of poly(propylene carbonate)/bisphenol A blends. Polymer International 2004, 53 (12), 2092-2098.
109. Wu, H. D.; Ma, C. C. M.; Chang, F. C., The solid state C-13 NMR studies of
intermolecular hydrogen bonding formation in a blend of phenolic resin and poly(hydroxyl ether) of bisphenol A. Macromolecular Chemistry and Physics 2000, 201 (11), 1121-1127.
110. Churakov, S. V., Hydrogen bond connectivity in jennite from ab initio simulations.
Cem. Concr. Res. 2008, 38 (12), 1359-1364. 111. Pellenq, R. J. M.; Lequeux, N.; van Damme, H., Engineering the bonding scheme
in C–S–H: The iono-covalent framework. Cem. Concr. Res. 2008, 38 (2), 159-174.
112. Wang, P. S.; Ferguson, M. M.; Eng, G.; Bentz, D. P.; Ferraris, C. F.; Clifton, J.
R., H-1 nuclear magnetic resonance characterization of Portland cement: molecular diffusion of water studied by spin relaxation and relaxation time-weighted imaging. J. Mater. Sci. 1998, 33 (12), 3065-3071.
166
113. Cong, X.; Kirkpatrick, R. J., 29Si and 17O NMR investigation of the structure of some crystalline calcium silicate hydrates. Adv. Cem. Based Mater. 1996, 3 (3–4), 133-143.
114. (a) Rottstegge, J.; Wilhelm, M.; Spiess, H. W., Solid state NMR investigations on
the role of organic admixtures on the hydration of cement pastes. Cem. Concr. Compos. 2006, 28 (5), 417-426; (b) Korb, J. P., NMR and nuclear spin relaxation of cement and concrete materials. Current Opinion in Colloid & Interface Science 2009, 14 (3), 192-202.
115. Janusa, M. A.; Wu, X.; Cartledge, F. K.; Butler, L. G., Solid-state deuterium
NMR-spectroscopy of D5-phenol in white Portland-cement – A new method for assessing solidification stabilization. Environmental Science & Technology 1993, 27 (7), 1426-1433.
116. Hanna, R. A.; Barrie, P. J.; Cheeseman, C. R.; Hills, C. D.; Buchler, P. M.; Perry,
R., Solid-state Si-29 and Al-27 NMR and FTIR study of cement pastes containing industrial-wastes and organics. Cem. Concr. Res. 1995, 25 (7), 1435-1444.
117. Beaudoin, J. J.; Raki, L.; Alizadeh, R., A 29Si MAS NMR study of modified C–S–
H nanostructures. Cement and Concrete Composites 2009, 31 (8), 585-590. 118. Aiello, M. A.; Frigione, M.; Acierno, D., Effects of environmental conditions on
performance of polymeric adhesives for restoration of concrete structures. J. Mater. Civ. Eng. 2002, 14 (2), 185-189.
119. Adamson, M. J., Thermal expansion and swelling of cured epoxy resin used in
graphite-epoxy composite materials. J. Mater. Sci. 1980, 15 (7), 1736-1745. 120. Pethrick, R. A.; Hollins, E. A.; McEwan, L.; Pollock, A.; Hayward, D.; Johncock,
P., Effect of cure temperature on the structure and water absorption of epoxy/amine thermosets. Polymer International 1996, 39 (4), 275-288.
121. Noskov, A. M., Photochemistry of epoxy films. Journal of Applied Spectroscopy
1975, 23 (6), 1638-1642. 122. (a) Apicella, A.; Tessieri, R.; Decataldis, C., Sorption modes of water in glassy
epoxies. J. Membr. Sci. 1984, 18 (MAR), 211-225; (b) Lu, M. G.; Shim, M. J.; Kim, S. W., Effects of moisture on properties of epoxy molding compounds. J. Appl. Polym. Sci. 2001, 81 (9), 2253-2259; (c) Nunez, L.; Villanueva, M.; Fraga, F.; Nunez, M. R., Influence of water absorption on the mechanical properties of a DGEBA (n=0)/1, 2 DCH epoxy system. J. Appl. Polym. Sci. 1999, 74 (2), 353-358.
123. Sperling, L. H., Introduction to physical polymer science. Wiley-Interscience:
2006.
167
124. Adamson, M. J., Thermal-expansion and swelling of cured epoxy-resin used in
cure kinetics of a diglycidyl ether of bisphenol A/1,3-bisaminomethylcyclohexane (DGEBA/1,3-BAC) epoxy resin system. J. Appl. Polym. Sci. 1995, 56 (9), 1029-1037.
126. (a) Nikolic, G.; Zlatkovic, S.; Cakic, M.; Cakic, S.; Lacnjevac, C.; Rajic, Z., Fast
Fourier Transform IR Characterization of Epoxy GY Systems Crosslinked with Aliphatic and Cycloaliphatic EH Polyamine Adducts. Sensors 2010, 10 (1), 684-696; (b) Mertzel, E.; Koenig, J. L., Application of FT-IR and NMR to epoxy-resins. Adv. Polym. Sci. 1986, 75, 73-112.
127. (a) Mertzel, E.; Koenig, J., Application of FT-IR and NMR to epoxy resins. Epoxy
Resins and Composites II. Dušek, K., Ed. Springer Berlin / Heidelberg: 1986; Vol. 75, pp 73-112; (b) Musto, P.; Ragosta, G.; Russo, P.; Mascia, L., Thermal-Oxidative Degradation of Epoxy and Epoxy-Bismaleimide Networks: Kinetics and Mechanism. Macromolecular Chemistry and Physics 2001, 202 (18), 3445-3458.
128. Delor-Jestin, F.; Drouin, D.; Cheval, P. Y.; Lacoste, J., Thermal and
photochemical ageing of epoxy resin - Influence of curing agents. Polym. Degrad. Stabil. 2006, 91 (6), 1247-1255.
129. Choi, S. M., S; Stewart, A; Hamilton, HR; Douglas, E. , The Role of Chemical
Bonding on the Durability of Epoxy Adhesion for Structural Strengthening Application. Polym. Eng. Sci., submitted.
130. Ramrus, D. A.; Berg, J. C., Using heterogeneous silane patterns to maintain
adhesion and decrease water penetration into epoxy/aluminum interfaces. J. Adhes. Sci. Technol. 2006, 20 (14), 1615-1623.
131. (a) Matinlinna, J. P.; Lassila, L. V. J.; Vallittu, P. K., The effect of five silane
coupling agents on the bond strength of a luting cement to a silica-coated titanium. Dental Materials 2007, 23 (9), 1173-1180; (b) Meng, X.; Yoshida, K.; Taira, Y.; Kamada, K.; Luo, X., Effect of Siloxane Quantity and pH of Silane Coupling Agents and Contact Angle of Resin Bonding Agent on Bond Durability of Resin Cements to Machinable Ceramic. Journal of Adhesive Dentistry 2011, 13 (1), 71-78; (c) Kent, M. S.; Smith, G. S.; Baker, S. M.; Nyitray, A.; Browning, J.; Moore, G.; Hua, D. W., The effect of a silane coupling agent on water adsorption at a metal/polymer interface studied by neutron reflectivity and angle-resolved X-ray photoelectron spectroscopy. J. Mater. Sci. 1996, 31 (4), 927-937.
132. Witucki, G. L., A silane primer – chemistry and applications of alkoxy silanes.
Journal of Coatings Technology 1993, 65 (822), 57-60.
168
133. Courard, L.; Michel, F.; Martin, M., The evaluation of the surface free energy of
liquids and solids in concrete technology. Constr. Build. Mater. 2011, 25 (1), 260-266.
134. Júlio, E. N. B. S.; Branco, F. A. B.; Silva, V. t. D., Concrete-to-concrete bond
strength. Influence of the roughness of the substrate surface. Constr. Build. Mater. 2004, 18 (9), 675-681.
135. Kubiak, K. J.; Wilson, M. C. T.; Mathia, T. G.; Carval, P., Wettability versus
roughness of engineering surfaces. Wear s2011, 271 (3-4), 523-528. 136. Momber, A. W., Surface issues of profiled cementitious composites. J. Adhes.
2002, 78 (3), 203-221. 137. Miller, M.; Bobko, C.; Vandamme, M.; Ulm, F.-J., Surface roughness criteria for
cement paste nanoindentation. Cem. Concr. Res. 2008, 38 (4), 467-476. 138. Mondal, P.; Shah, S. R.; Marks, L. D., Nanoscale characterization of
cementitious materials. ACI Mater. J. 2008, 105 (2), 174-179. 139. Momber, A. W., The wettability of some concrete powders. Part. Sci. Technol.
2002, 20 (3), 243-246. 140. Bentz, D. P.; Aitcin, P.-C., The Hidden Meaning of Water-Cement Ratio.
Concrete International 2008, 30 (5), 51-54. 141. Piscitelli Mansur, A. A.; Do Nascimento, O. L.; Mansur, H. S., Enhancing
polymer-modified mortar adhesion to ceramic tile surface by chemical functionalization with organosilanes. Surf. Rev. Lett. 2009, 16 (1), 127-139.
142. (a) Yousuf, M.; Mollah, A.; Hess, T. R.; Tsai, Y.-N.; Cocke, D. L., An FTIR and
XPS investigations of the effects of carbonation on the solidification/stabilization of cement based systems-Portland type V with zinc. Cem. Concr. Res. 1993, 23 (4), 773-784; (b) Cocke, D. L.; Mollah, M. Y. A.; Parga, J. R.; Hess, T. R.; Ortego, J. D., An XPS and SEM/EDS characterization of leaching effects on lead- and zinc-doped portland cement. Journal of Hazardous Materials 1992, 30 (1), 83-95; (c) Kallury, K. M. R.; Brennan, J. D.; Krull, U. J., Depth profiling of functionalized silane films on quartz and silicon substrates and of urease immobilized on such films by angle-resolved X-ray photoelectron spectroscopy. Anal. Chem. 1995, 67 (15).
143. (a) Black, L.; Garbev, K.; Stemmermann, P.; Hallam, K. R.; Allen, G. C.,
Characterisation of crystalline C-S-H phases by X-ray photoelectron spectroscopy. Cem. Concr. Res. 2003, 33 (6), 899-911; (b) Black, L.; Garbev, K.; Beuchle, G.; Stemmermann, P.; Schild, D., X-ray photoelectron spectroscopic
169
investigation of nanocrystalline calcium silicate hydrates synthesised by reactive milling. Cem. Concr. Res. 2006, 36 (6), 1023-1031.
144. Nguyen, T. B., W. E.; Alsheh, D.; Aouadi, K.; and Chin, J. W. In Water at the
Polymer/Substrate Interface and Its Role in the Durability of Polymer/Glass Fiber Composites, Durability of Fibre Reinforced Polymer (FRP) Composites for Construction (CDCC' 98), Canada, Benmokrane, B. R., H., Ed. Canada, 1998; pp 451-462.
145. Ji, W.-G.; Hu, J.-M.; Zhang, J.-Q.; Cao, C.-N., Reducing the water absorption in