School of Sustainable Development of Society and Technology Olukoye, Babatunde Olusegun MASTER’S THESIS FOR 15 HP Study of District Heating Supply Temperature with Electricity Production in CHP Plant “A Case Study of Enkoping Energy (ENAE)” Master’s Thesis in Energy Engineering School of Sustainable Development of Society and Technology Malardalen University, Vasteras, Sweden In Collaboration with Enkoping Energy (ENAE) Olukoye, Babatunde Olusegun (Student / Researcher) Fredrik Starfelt (Supervisor) Camilla Ahlund (ENAE Supervisor) Eva Thorin (Examiner) Vasteras, April, 2008.
Transcript
School of Sustainable Development of Society and Technology
Olukoye, Babatunde Olusegun
MASTER’S THESIS FOR 15 HP
Study of District Heating Supply
Temperature with Electricity Production
in CHP Plant
“A Case Study of Enkoping Energy (ENAE)”
Master’s Thesis in Energy Engineering School of Sustainable Development of Society and Technology Malardalen University, Vasteras, Sweden In Collaboration with Enkoping Energy (ENAE) Olukoye, Babatunde Olusegun (Student / Researcher) Fredrik Starfelt (Supervisor) Camilla Ahlund (ENAE Supervisor) Eva Thorin (Examiner) Vasteras, April, 2008.
School of Sustainable Development of Society and Technology
Olukoye, Babatunde Olusegun
Abstract
Existence of integrated approach in supplying a local community with its energy requirements
from renewable energy or high-efficient co-generation energy sources has come to stay in
Sweden. However, in response to the goal of maximizing profit on heat and electricity
production with such approach, it then becomes important for combined heat and power (CHP)
plants operators to fine-tune their production to adequately fulfil this goal. ENA Energi AB
initiated this study on district heating (DH) system as a step in achieving this huge aim.
This master’s thesis focussed basically on relationship and variations of the district heating
supply temperature with other variables that affects electricity and heat production in the plant;
validation attempt was also carried out on the plant’s model based on some data simulation on
the model.
In view of these, minimizing the district heating supply temperature with increasing heat flow
was observed as a vital step towards maximizing heat and electricity production for this plant in
order to meet the customer’s demand. More so, the plant model was confirmed valid for a certain
temperature limit, therefore, based on the findings, the relationship and the model could be used
in decision making for the daily operations for the plant.
Keywords: District heating, Electricity, Supply and Return temperature, Heat load and
Accumulator
School of Sustainable Development of Society and Technology
Olukoye, Babatunde Olusegun
Preface
As a summary to my Master’s study on energy engineering, this thesis was carried out at the
School of Sustainable Development of Society and Technology at Malardalen University,
Vasteras in collaboration with Enkoping Energi AB (ENAE) Sweden from late November 2007
to April 2008.
My appreciation goes to Eddie Johansson for his support and provision of this wonderful
opportunity to conduct this research at ENA Energi AB. Special thanks also goes to Urban
Eklund and Erik Holmen for sharing their wealth of experience with me on district heating
systems for this study. My sincere appreciation also goes to my supervisors; Fredrik Starfelt
(MDH) and Camilla Ahlund for their immense support and contributions towards the completion
and success of this work. I would ever live to remember the hospitality treatment given to me by
the entire staff and personnel of ENAE both the office and the control area, especially the “fika”
sessions.
I am also grateful to my examiner (Eva Thorin), for her support on this study. I would also
mention Prof. Erik Dahlquist as one of my advisers on this study. I equally appreciate the
support from my friends and the entire staff of School of Sustainable Development of Society
and Technology, Malardalen University.
Finally, I would like to thank almighty God for giving me the grace and inspiration to complete
this study despite all odds. I would also like to thank my family, especially my mother, sisters
and relatives for their moral and financial support for my education in Sweden. I dedicate this
work to my daughter (Julia Louise Olukoye-Bergstrom); I pray God keeps you for me as I would
always live to love you.
Olukoye, Babatunde Olusegun
School of Sustainable Development of Society and Technology
Olukoye, Babatunde Olusegun
Table of Content
1 Introduction 1
1.1 Background 1
2 Case Study 2
2.1 Enkoping Energy (ENAE) and Its District Heating System 2
2.2 How It Works 3
3 Methodology 5
3.1 Statement of Problem 5
3.2 Objective of Study 6
3.3 Method of Tackle 6
4 Data Collection and Simulation Process 6
4.1 Power Generation Information Manager (PGIM) 6
4.1.1 PGIM System Structure 7
4.1.2 PGIM Server 7
4.1.3 Signal Explorer 8
4.1.4 Microsoft Office Integration 8
4.2 IPSEpro Process Simulators 8
4.3 PSE (Process Simulation Environment) 9
4.4 District Heating and Electricity Effects in a CHP Plant 9
4.4.1 District Heating System 9
4.4.2 District Heating Network 10
4.4.3 Temperatures in the District Heating Network 10
4.4.4 Advantages and Disadvantages of District Heating 11
4.4.5 Electricity Production and Alpha Value 11
4.4.5 Accumulator 12
5 Results and Validation of Model 13
5.1 DH Supply Temperature effects on Electricity Production, Power-to-Heat Ratio and Heat Storage Accumulator 13
5.2 Model Validation 19
6 Conclusions / Discussions 21
7 References 22
APPENDIX 24
Appendix A: ENAE Plant Model 24
Appendix B: Data Signals from ENAE Database 25
LIST OF FIGURES 26
LIST OF TABLES 27
School of Sustainable Development of Society and Technology
1
1 Introduction
1.1 Background
In the energy industry today, the demand for environmentally sound energy production
technologies is becoming more famous. Combined heat and power (CHP) happens to be a
leading technology responding to this market and environmental demands (Rong Y. and
Lahdelma R., 2007). CHP production means the simultaneous production of useful heat and
electric power. In electricity production, heat can be produced as a by-product for an industrial
plant or a residential area. This combined method of production is also known as cogeneration,
which is highly recognised by the EU, which consequently led to the issuance of a directive to
promote high efficiency cogeneration of heat and electricity.
Recently, the European Commission also set a goal of doubling the share of electricity produced
with cogeneration of heat and power by the year 2010. More importantly, biomass based
cogeneration has been seen as a good option for the future by the EU, and the use of biomass as
an energy source in general is encouraged (Keppo I.and Savola T., 2007).
The sole purpose of a district heating system is to supply adequate heat to its customers.
Consumer uses the heat supplied to maintain indoor temperature at a reasonably constant level
and counter for building heat loss to the surroundings (Yildirim et al, 2006). Basically, district-
heating supply is based on the possibility of obtaining higher efficiency, and consequently
lowering the heating and electricity cost, when producing the heat in a CHP plant (Benonysson
et al, 1995).
According to Eriksson et al 2007, district heating is available in approximately 200 larger and
300 smaller built-up areas in Sweden. About 75% of all Swedish blocks of flats and
approximately 140,000 detached houses are currently heated by district heating (DH), hence,
concluding that approximately 50% of all Swedish space heating is supplied by DH. Since heat
and electricity demand has huge relationship with the outdoor climatic condition, it is hence
important for CHP plants to find optimum operating values for the heat and electricity
production for cost and other benefits.
School of Sustainable Development of Society and Technology
2
Consequently, this study is focussed on researching the effects of supply temperatures and
electricity production in CHP plants, and also validating a model that may not only be useful in
daily operations of the plant but also in further study on improvements and optimization
purposes.
2 Case Study
2.1 Enkoping Energy (ENAE) and Its District
Heating System
Enkoping is located in central Sweden, around 70 km from the state capital (Stockholm) with a
population of about 20,000. The municipal authority of Enkoping owns this local utility (ENA
Energi AB) that is responsible for its electricity and district heating system. 1994 was the start
date in which ENAE commenced the CHP plant operation with biofuel. So far, the company
have supplied the whole city of Enkoping with almost 100% renewable heat and also produced
50% of the electricity demand, even though a small proportion of oil is usually used as a backup.
The CHP plant depends on fuel mix from forest industry waste materials and short rotation crops
called Salix. The fuel consists mainly of tops and branches from trees, saw dust and bark from
wood processing industry. All the biofuel passes through an 8,000m3
fuel storage, where various
deliveries are mixed to yield a homogeneous fuel. Variations in the moisture content are small in
the mix of fuels with an average moisture content of about 45%.
2005 report from the company shows that about 137.1 MW effective heat power is supplied by
the district heating system to Enkoping city, which has a total length of about 84 km. The area
covered is shown with the red colour in figure 1 below. Heat and electricity production in a
normal year approximately amounts to 250 GWh and 100 GWh respectively with an
approximate use of 400 GWh bio fuel. This company with collaboration with Fredrik Starfelt
(Starfelt F. 2006) developed a simulator-based model for the plant as an attempt to investigate
how the boiler at ENA Energy would react to changes in the plant.
School of Sustainable Development of Society and Technology
3
Figure 1 District Heating Network of Enkoping City (www.enae.se) and permission from ENAE
2.2 How It Works
The farthest houses on the district-heating network are of high importance in obtaining the
pressure level difference between the outgoing temperature flow and the return. On this network
or system, a valve and pump are connected to the condenser, which in turn has a connection with
the low-pressure turbine. From the condenser, a valve regulating the outgoing flow is connected
to the accumulator (Energy Storage medium), and the other piping systems for loading and
unloading of high energy water in and out of the accumulator. Also, fuel supply unit to the boiler
is connected with valves to the turbine. See figure 2 and 3 for clarity.
The pressure level on the pressure gauge is sensitive to the consumer’s demand of heat from the
district heating; this in turn have effects on the pump that is connected to the condenser. If the
demand for heat from the consumers is low, the pressure difference is high; the pump senses this,
and thus reducing the pumping effect of the pump connected to the condenser. Simultaneously,
the valves regulating the steam flow to the low-pressure turbine closes, hence, reducing the fuel
input to the boiler. This results into reduction effects on electricity production. On the other
School of Sustainable Development of Society and Technology
4
hand, if the demand is high, the pressure difference is low and more fuel is supplied to the boiler,
resulting in more electricity production.
Figure 2 Picture of How It Works at ENAE (www.enae.se), permission from ENAE
School of Sustainable Development of Society and Technology
5
Figure 3 District Heating with an Accumulator
3 Methodology
3.1 Statement of Problem
Maximizing profit is the drive for CHP plants operators. Since the cost of electricity on the stock
market is considerably increasing, this is a wake up signals for all CHP plant operators to
maximize their profit on electricity. However, CHP plants is also responsible for heat production
that is used in DH, it is therefore a challenge to keep the two products in balance.
When it comes to the daily operation of a DH system, the structure of the problem is somewhat
different. In this case, the task is to find optimum supply or outgoing temperatures of the DH
system that would produce maximum electricity, bearing in mind instability of the heat demands
by the consumers which is based on the outdoor weather conditions, and also the storage nature
of the heat storage vessel (accumulator).
School of Sustainable Development of Society and Technology
6
3.2 Objective of Study
The purpose of this study is to investigate the daily possibilities of achieving maximum
electricity production from a CHP plant with various supply or outgoing temperatures of a DH
system, and its implications on the heat accumulator vessel.
For clarity and simplicity, this study shall be structured on some basic research questions which
would be helpful to fulfill the objective of this study. The questions are as follows;
• How does the supply temperature on the DH system affect the electricity production,
power-to heat ratio and heat storage in the accumulator tank?
• Is the developed simulation model accurate in the simulation of different supply
temperatures?
• How could operation optimization be developed from this information and implemented
in the daily operation of the plant?
3.3 Method of Tackle
This work shall be partly structured on few literature studies on some concepts of electricity and
heat production with reference to district heating systems in a CHP plants using ENAE as a case
study. Information/data shall be retrieved from the web manager (PGIM) for ENAE’s operation
data. These data shall be analysed and validated with a developed simulation model based on
IPSEpro provided by MDH, and then followed with discussions.
4 Data Collection and Simulation Process
4.1 Power Generation Information Manager
(PGIM)
Access to real-time information is a good step to achieving great optimization improvement in
production processes. PGIM used at ENAE is a package supplied from ABB; it operates on
distributed open client/server architecture. The various elements of the system can run on
Microsoft windows operating system.
School of Sustainable Development of Society and Technology
7
4.1.1 PGIM System Structure
PGIM scanners collect process data from lower level control systems, PLC’s, or other recording
systems. The PGIM server accepts the data, and then stores;
• Signal descriptions
• Current (Real-time data) and historical values (Long-term storage)
• Messages with detailed status information.
This data is stored for periods up to several years in the process database.
PGIM installed at ENAE offers a wide range system architecture that performs the following
functions;
• Collecting, archiving and consolidating data from production facilities, control systems
and commercial systems
• Conducting remote diagnostics on numerous plants components
• Visualizing and analyzing process parameters with a convenient user interface
• Making data available to other evaluating applications (e.g. for performance calculations,
operation schedule optimization, EXCEL reporting)
• Delivering process parameters, status variables and counter readings to maintenance and
financial systems
• Archiving data over long periods of time
4.1.2 PGIM Server
The core of PGIM is the server. All relevant data is stored here;
• Signal descriptions
• Current process data (Real-time data)
• Historical process data (Long-term storage)
School of Sustainable Development of Society and Technology
8
• Messages (Events)
The PGIM server can sometimes be configured as a redundant database. All process data is
stored with the acquisition time (millisecond resolution), the physical value and detailed status
information. The PGIM database also allows future values that are suitable for forecasting.
4.1.3 Signal Explorer
The signal Explorer is a centralized utility for fast and efficient configuration. A clear user
interface enables the configuration of trends, graphic displays, logs and calculations. It also
presents all configured process data from all reachable servers and scanners. Signals can be
filtered and sorted according to codes.
4.1.4 Microsoft Office Integration
Microsoft office integration feature of PGIM makes it possible to generate ad hoc, hourly, daily,
monthly, and yearly reports production of balances and maintenance logs.
4.2 IPSEpro Process Simulators
IPSEpro can be described as a highly flexible and comprehensive environment for modelling and
analyzing processes in energy engineering, chemical engineering and other numerous related
areas. This package is designed to solve problems that are represented by a network of discrete
components and their connections. IPSEpro allows users to create models of arbitrary process
schemes using components from a standard library, or using component models that were
created by the user already (IPSEpro, 2003).
IPSEpro offers unlimited flexibility in defining the characteristics of the component models that
are used for modelling process. This gives the users opportunity to build component model
libraries that exactly match their application requirements. The package also allows total
freedom in arranging the available components in order to represent a process scheme. In setting-
up a process model with IPSEpro’s process simulation environment (PSE), the user chooses
component icons from a library menu, place them in the project window and connect them
appropriately. Numerical data and results of process calculations are entered and displayed
School of Sustainable Development of Society and Technology
9
directly in the project window.
IPSEpro’s structure is good in simulating the behaviour of single elements of processes, of parts
of a process and of models of complete plants. It also provides efficient data management and
users robust algorithms that extremely short calculation time.
4.3 PSE (Process Simulation Environment)
PSE is IPSEpro’s process simulation environment. PSE allows users to create a process model
based on components from a library. It also provides user-friendly flow sheet editor, where it is
possible to build process models by selecting the components from a menu. The component is
placed in the project window by users specifying the data interactively, and then connecting the
components according to their requirements.
The provision of a strong mathematical method by PSE guarantees fast and accurate
calculations. PSE is structured in a manner that all data related to the process model is entered
directly in the flow sheet. There is possibility of results being displayed in the flow sheet or in
separate data tables which can be individually configured.
4.4 District Heating and Electricity
Effects in a CHP Plant
4.4.1 District Heating System
District heating systems basically consist of three (3) parts; production plant, network or
distribution pipes and the connected buildings as shown in figure 4. In this case, the production
plant is a combined heat and power plant and it is also connected to a heat accumulator as
storage for excess produced heat and additional heat production medium.
School of Sustainable Development of Society and Technology
10
Figure 4 District Heating System
4.4.2 District Heating Network
This is the main link between the production unit and the consumers. This network is made of
steel pipe materials that are laid in pairs and also insulated for low temperature losses. A pipe is
used for supplying the buildings with hot water and the other for returning the cooled water to
the production units. The length and volume of the pipes in a network are usually very large.
The medium for heat distribution at ENA Energy is water, but steam can be used also. The
advantage of steam is that its addition to heating purposes it can be used in industrial processes
due to its higher temperature. The disadvantage of steam is a higher loss due to the high
temperature. More so, the thermal efficiency of CHP plant is significantly lower if the cooling
medium is higher temperature steam, resulting into lower electric power generation.
4.4.3 Temperatures in the District Heating Network
Maintaining low temperatures in the pipes is important since the heat loss increases with the
temperature in the pipes. However, lower temperatures means higher flow rates for a given heat
demand. The return temperature is always subject to the plant; consequently, this should be
designed to give lowest possible return temperature. The effect of this is that lower return
temperature decreases the heat loss in the return pipes but also decreases the necessary flow rate
School of Sustainable Development of Society and Technology
11
for a given power and supply temperature. Furthermore, a lower return temperature thus gives
the opportunity of lowering the supply temperature.
Supply temperature is also an important parameter always considered in controlling the network.
The supply temperature is increased to such an extent that the flow rate, necessary for the
consumers, can be handled by the pumps. However, flow rate is a parameter not controlled by
the district heating company, but keeping of an appropriate pressure in the pipes so as to enable
all connected customers obtaining their energy demand is achieved by varying the flow rates.
Obviously, the flow rate is higher in the winter period with high demand and low during the
summer.
4.4.4 Advantages and Disadvantages of District
Heating
District heating has various advantages over individual heating systems; usually DH is more
energy efficient due to simultaneous production of heat and electricity in CHP plants. The larger
combustors have a more advanced flue gas cleaning than single boiler system. In the case of
surplus heat from industries, DH systems do not use additional fuel because they use heat (Heat
recovery) which would be disbursed to the environment.
DH is a long-term commitment that fits poorly with a focus on short-term returns on investment.
Benefits of the community include avoided cost of energy, through the use of surplus and wasted
heat energy, and reduction in individual household or building heating equipment. District
heating network, heat –only boiler stations and co-generation plants requires high initial capital
expenditure and financing. If considered as a long-term investment, it may results into profitable
operations for the owner of district heating systems; or combined heat and power plant operators.
DH is less attractive for areas with low population densities, as the investment per household is
considerably higher.
4.4.5 Electricity Production and Alpha Value
Electricity can be produced with a steam circuit including one or several boilers, turbines and
condensers. In the case of ENA Energy CHP plant, the boiler generates steam under high
pressure to drive the turbines (540 C @ 100 Bars). After the turbines comes the steam with low
School of Sustainable Development of Society and Technology
12
pressure and temperature, however no condensing is allowed in the turbine, since any water
droplets would damage the turbine. The turbines are connected to a generator with a condenser.
Since electricity production is largely dependent on the magnitude of the pressure in the
condenser, which is a function of the return temperature from the district heating, hence low
return temperature gives low pressure in the condenser and thus yields higher electricity
production in the plant. Lower return temperatures also decreases heat loss in the pipes and also
flow rates for a given power and supply temperature. Also, an increase in demand of energy is
met with an increased supply temperature by the network operators. However, the supply
temperature can be increased to such an extent that the flow rate necessary for the consumers can
be handled by the pumps. Alpha (power-to-heat ratio) value is an important parameter in the
process of heat and electricity production process. A typical alpha value is 0.3 for a back-
pressure unit where the heat is utilized in a district heating network. Alpha value for ENA Energi
is observed to be between 0.07- 0.49, which is a reflection of the plant’s operations for year
2007. The alpha value can be controlled to some extent; this is because of its dependence on the
condensing temperature.
4.4.6 Accumulator
Since electricity must be generated whenever the consumer wants it- electrical energy cannot be
stored. So the CHP plant produces hot water even when it is not required, this however
necessitate the need of a heat water storage medium called “Accumulator”. The accumulator
tank at ENA energy is about 7000 m3 capacity. It is usually loaded with hot water with an
approximate temperature of about 75- 100 degree in respect to the heat demand that is dependent
of the outdoor temperature.
School of Sustainable Development of Society and Technology
13
Figure 5 Accumulator Storage Tank
This medium is useful when electricity production is needed during the peak hours at a high
market electricity prices. Excess heat from this production is stored in this medium and it can of
course discharge during hours when the price is low, see figure 5 above. It can also be used to
avoid starting a more expensive plant during peak hours of heat demands.
5 Results and Validation of Model
5.1 DH Supply Temperature effects on Electricity
Production, Power-to-Heat Ratio and Heat
Storage Accumulator
In an attempt to answer the afore mentioned research questions, operation values were taken
from ENA Energy data base from January 1st 2007 to December 31
st 2007 on hourly bases. The
plant components are the boiler, turbines, generator, condenser with the district heating system
and the feed water tank. The data signals values used for the analysis were obtained from steam
School of Sustainable Development of Society and Technology
14
flow to the turbines, electric power generated, condenser pressures, district heating supply and
return temperatures, heat demand, energy storage in the accumulator, cooler, outdoor
temperatures and calculated power-to-heat ratio as shown in appendix B at the end of this report.
Supply temperatures ranging from 89-98 degree(c) and its corresponding variable values were
made choice of focus for this study because it tends to give a clearer picture and idea of the
happenings around these operating conditions. These values at constant flow at each particular
operating temperature were plotted on graphs and subsequently discussed.
Figure 6 Electric Power Production as a function of the supply temperature from ENA Energy
database
The figure 6 above clearly shows and confirms a linear relationship at a constant flow between
the DH Supply temperature and the electrical power output based on the data from ENA Energy.
This also confirms that at higher supply temperatures more power is generated in the plant based
on constant flow at each temperature range. However, the figure above did not follow a smooth
curve pattern due to the fact that many operation temperatures were plotted against their
corresponding power output. It also follows that between 90 to 91 and 96 to 97 degree supply
temperatures; an approximate corresponding 1MW power was noticed.
• This may be explained by a substantial increase in the flow at this particular supply
temperature which could yield an increase in the electrical output based on the gathered
data.
• This may also happen due to sensitivity of the PGIM recording system.
• And may also be due to some irregularities in the regulation systems in the valves.
School of Sustainable Development of Society and Technology
15
• About 3 to 4 hours delays in consumers respond could be a reason for this as well.
This means that the return temperature changes after 3-4 hours after the supply temperature has
been changed and thus affects the increase in electricity production.
It is also observed that at 97 degree the curve tends to behave in a constant manner for the
electrical power production, this seems to be the maximum temperature set when operating at the
maximum heat flow.
Fig 7 Electrical Power production as a function of the DH supply and return temperatures from
the ENA Energy databases
For the range of data plotted in figure 7 above, the range of temperature difference between the
supply temperatures and the return temperature appears to be parallel for the corresponding
electrical power generated which is basically dependant on the heat flow. It shows that the return
temperatures for the plant operation for 2007 never gone beyond 60 degree. It can also be
observed from the same figure above that, electrical power generated between 20.5 and 22 MW
has some inconsistencies in the flow at supply temperature range of 85 to 97 degree. One of the
reasons for these inconsistencies may be due to instability in the choice of heat flow condition.
Though, (Bennonysson A., 1991) confirms the relationships between DH supply and return
temperatures with heat loadings as primary. However, the result also confirms the variations
between DH supply and return temperatures with respect to electrical power output.
Based on this, it would be a good idea for the DH plant operators to know the variations between
School of Sustainable Development of Society and Technology
16
the return temperature and a “set” supply temperature when estimating desired electrical output
in a CHP plant, bearing in mind the need to keep the return temperature as low as possible.
Figure 8 Alpha Value as a function of the Supply temperature from ENA Energy database.
Figure 9 Alpha Value as a function of the Return temperature from ENA Energy database.
Since alpha value can to some extent be controlled based on its dependents on the condensing
temperature, therefore, the existence of a condenser in a CHP plant makes the alpha value
dependent of both the district heating (DH) network supply temperature and return temperature.
This can be explained by the relationship between alpha values and the DH Supply and return
temperature of ENA Energy 2007 operation data.
School of Sustainable Development of Society and Technology
17
Though, alpha values increases indirectly with DH supply temperature but directly with heat
load. But figure 8 above shows how the DH supply temperature increases with alpha value and
figure 9 with alpha value increases with lower return temperatures, this could be based on the
fact that the heat loads at the various temperatures were varied.
Figure 10 Outdoor temperatures as a function of the DH Supply temperature from ENA Energy
database
Figure 11 Heat Load as a function of the Outdoor temperature from ENA Energy database
School of Sustainable Development of Society and Technology
18
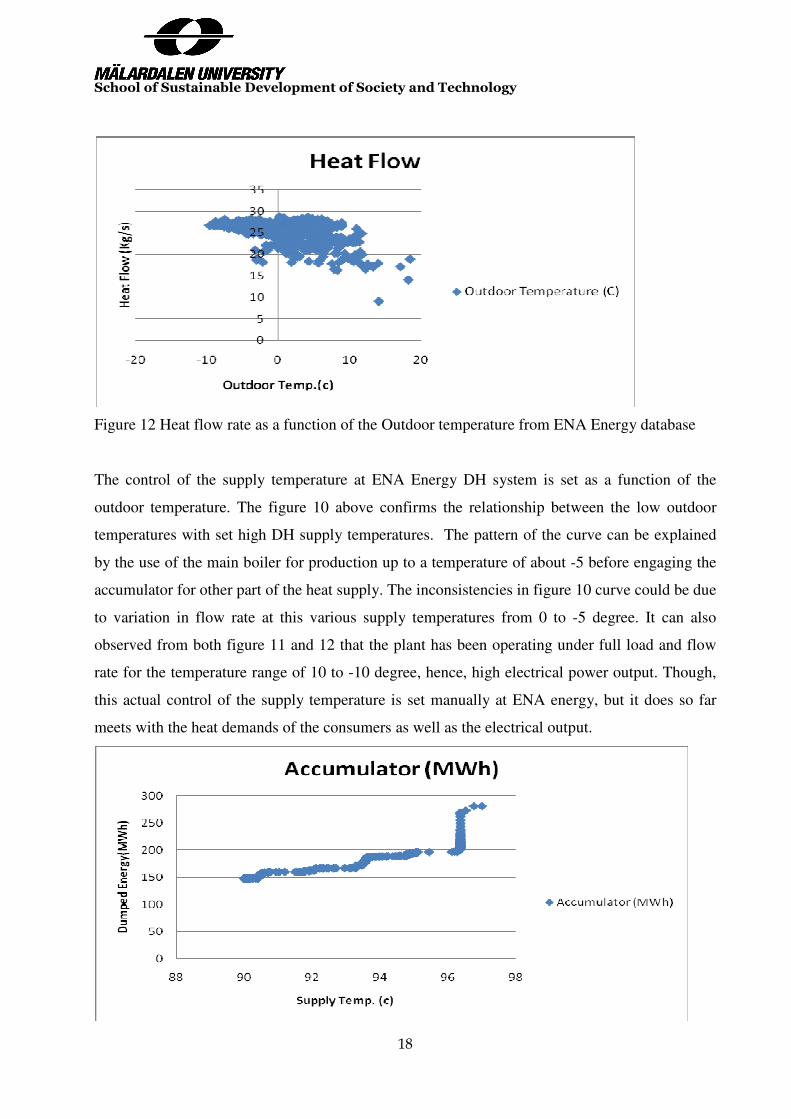
Figure 12 Heat flow rate as a function of the Outdoor temperature from ENA Energy database
The control of the supply temperature at ENA Energy DH system is set as a function of the
outdoor temperature. The figure 10 above confirms the relationship between the low outdoor
temperatures with set high DH supply temperatures. The pattern of the curve can be explained
by the use of the main boiler for production up to a temperature of about -5 before engaging the
accumulator for other part of the heat supply. The inconsistencies in figure 10 curve could be due
to variation in flow rate at this various supply temperatures from 0 to -5 degree. It can also
observed from both figure 11 and 12 that the plant has been operating under full load and flow
rate for the temperature range of 10 to -10 degree, hence, high electrical power output. Though,
this actual control of the supply temperature is set manually at ENA energy, but it does so far
meets with the heat demands of the consumers as well as the electrical output.
School of Sustainable Development of Society and Technology
19
Figure 13 Energy in the Accumulator with corresponding DH Supply temperature from ENAE
database
ENA Energy’s accumulator is confirmed not to be a pressurized storage one. This however limits
the maximum storage temperature to be somewhat below 100 o
C. So far in 2007, maximum
storage of about 2900MWh was achieved at temperatures not exceeding 100 o
C. Even though,
the sensitivity between the DH supply and return temperature plays a vital role in controlling the
heat storage system, however it can also be inferred that the outdoor temperature is also a vital
parameter to consider.
5.2 Model Validation
In energy engineering, models could be developed for optimization, improvement and other
reasons. ENA Energy plant boiler, turbine, flue gas condenser and the district heating system
were modelled using IPSEpro (Starfelt F. 2006). In reference to Appendix 1, the plant’s model
consists of the boiler, turbines, generator and the condenser with district heating system
connection. The steam data is set to 540 (c), with input data on the district heating return
temperature being estimated while the supply temperature is set before running the simulation
exercise. The output electricity generation value is then recorded. The purpose of the plant model
is to be used for off-design calculations and optimization purposes. This model may also be used
as a tool to predict the accuracy of the heat loadings and electrical output for the plant, when
minimizing the supply temperatures against the electrical power output in the district heating
system, hence the need to validate the model.
Mean values of the DH Supply temperatures for ENA Energy operations data were collected and
estimated at the range of 77-97 (c), with their corresponding values for the DH Return
temperatures, Heat flow and the Electricity power production. Input data for simulation are
shown in Table 1.
School of Sustainable Development of Society and Technology
20
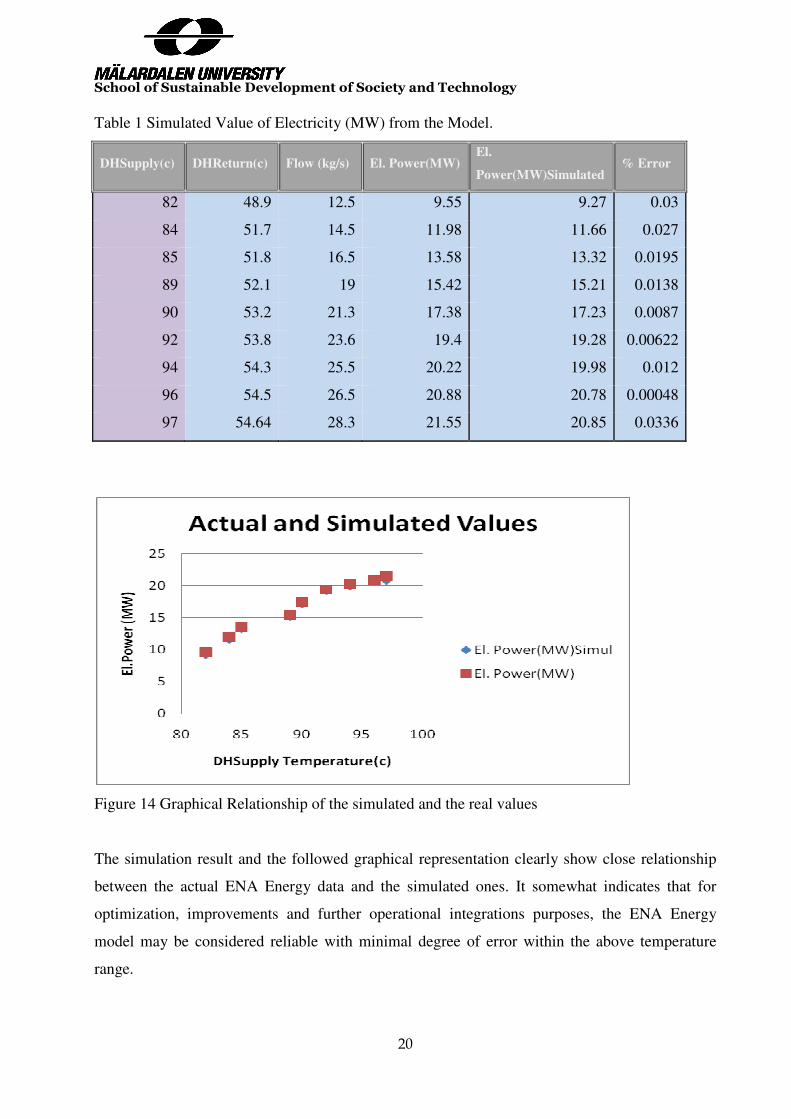
Table 1 Simulated Value of Electricity (MW) from the Model.
DHSupply(c) DHReturn(c) Flow (kg/s) El. Power(MW) El.
Power(MW)Simulated % Error
82 48.9 12.5 9.55 9.27 0.03
84 51.7 14.5 11.98 11.66 0.027
85 51.8 16.5 13.58 13.32 0.0195
89 52.1 19 15.42 15.21 0.0138
90 53.2 21.3 17.38 17.23 0.0087
92 53.8 23.6 19.4 19.28 0.00622
94 54.3 25.5 20.22 19.98 0.012
96 54.5 26.5 20.88 20.78 0.00048
97 54.64 28.3 21.55 20.85 0.0336
Figure 14 Graphical Relationship of the simulated and the real values
The simulation result and the followed graphical representation clearly show close relationship
between the actual ENA Energy data and the simulated ones. It somewhat indicates that for
optimization, improvements and further operational integrations purposes, the ENA Energy
model may be considered reliable with minimal degree of error within the above temperature
range.
School of Sustainable Development of Society and Technology
21
6 Conclusions / Discussions
How does the supply temperature on the DH system affect the electricity production, power-to
heat ratio and heat storage in the accumulator tank?
Following the discussion of the result above, this study has been able to present an established
relationship between the district heating (DH) supply temperature and other vital variables
needed to be considered for optimum electricity production in a CHP plant, using values from
ENA Energy database. Since lower temperatures means higher flow rates for a given power
output, therefore, increasing the flow rate means higher pressure in the pipes, but this pressure
should be within a limit that can be handled by the pumps. Consequently, it can be inferred from
the result above that lower supply temperature could leads to lower return temperature therefore,
this linear relationship (fig. 14) may be useful in the control section of a CHP plant when
choosing supply temperature for heat and electrical power production and their corresponding
effects on other variables in a DH system. Though, this study confirms the importance and the
usefulness of the accumulator used at ENA Energy, however, the unpressurized nature of the
accumulator tank in plant, has placed a restriction on the highest value of the supply temperature
that could be set for the DH system. However, in order to minimize the DH supply temperature
and to maximize the use of the unpressurized accumulator, this study suggests that higher flow
rates pumps should be used such that the flow rate increases instead of the supply temperature.
Is the developed simulation model accurate in the simulation of different supply temperatures
and how could operation optimization be developed from this information and implemented in
the daily operation of the plant?
With regards to the validation attempt made by this study on ENA Energy plant model, it can be
considerably said that the simulated values were in great agreement with the values taken from
ENA Energy database for 2007 operation; hence making this model valid. This model would be
of use for optimization of the plant by maximizing electrical output, efficiency or overall cost.
Quick simulation of data with the model for decisions in the daily production is another
possibility for this plant. Conclusively, the result of this study has shown the possibilities of
achieving maximum electrical output at various DH supply temperatures while maximum the use
of the heat accumulator in a CHP plant like ENAE.
School of Sustainable Development of Society and Technology
22
7 References
Arvastson Lars, 2001. “Stochastic Modelling and Operational Optimization in District Heating
Systems”: Doctoral Thesis in Mathematical Sciences, Centre for Mathematical Sciences,
Mathematical Statistics, Lund University.
Benonysson Atli, Bohm Benny and Ravn F. Hans, 1995. “Operational Optimization in a District
Heating System”: Energy Conversion and Management, Vol. 36, Elsevier.
Benonysson Atli, 1991. “Dynamic Modelling and Operational Optimization of District Heating
Systems”. Laboratory of Heating and Air-Conditioning, Technical University of Denmark, DK
2800 Lyngby.
Eriksson Ola, Finnveden Goran, Ekvall Tomas and Bjorklund Anna, 2007. “Life-cycle
Assessment of Fuels for District Heating: A Comparism of Waste Incineration, Biomass and
Natural Gas Combustion”. Energy Policy, Vol. 35, Elservier.
Keppo Ilkka and Tuula Savola, 2007. “Economic Appraisal of Small Biofuel Fired CHP Plants”.
Energy Conversion and Management, Vol. 48, Elservier.
Rong Aiying and Lahdelma Risto, 2007. “Efficient Algorithms for CHP Production Planning
Under the Deregulated Electricity Market”. European Journal of Operational Research, Vol.
176, Elservier.
Simtech Simulation Technology, IPSEpro User Library, 2003.
Starfelt Fredrik, 2006. “ Biobranslleeldat Kombikraftverk Inforande av Trapulvereldad
Gasturbine I Varmeverket Enkopings Befintliga Kraftvarmeverk” Master Thesis in Energy
Engineering, Department of Public Technology, Malardalen University, Vasateras, Sweden.
Usman Musibau, 2007. “Simulation Model of Flue Gas Condensation Unit and Complete
Process Plant Simulation; Case Study of ENA Energi”. Master Thesis in Energy Engineering,
Department of Public Technology, Malardalen University, Vasateras, Sweden.
School of Sustainable Development of Society and Technology
23
Yildirim Nurdan, Toksoy Macit and Gokcen Gulden, 2006. “District Heating System Design for
A University Campus”. Energy and Buildings, Elservier.
www.enae.se (Accessed last 2008-04-04)
School of Sustainable Development of Society and Technology
24
APPENDIX
Appendix A: Showing ENAE Plant Model
developed from IPSEpro
School of Sustainable Development of Society and Technology
25
Appendix B: Data Signals for the variables used
for the analysis from ENAE Database
Data Signal Description Unit
Electrical Power Net
1BAT10CE201-XK01 MW
DH Supply Temperature
1NDA1OCT203 C
Accumulator Energy
QI847-XU01 MWh
Heat Demand
1NDY10CU201-XP01 MW
DH Return Temperature
TI702-XJ01 C
DH Power
1DY00CU201-XK01 MW
Steam Flow
1LBA10CF201-XU01 Kg/s
Cooler
1NDA22CT201 C
School of Sustainable Development of Society and Technology
26
LIST OF FIGURES
Figure 1 District Heating Network of Enkoping City
Figure 2 Picture of How It Works at ENAE
Figure 3 District Heating With an Accumulator
Figure 4 District Heating System
Figure 5 Accumulator Storage Tank
Figure 6 Electric Power production as a Function of the Supply temperature from ENAE
database
Figure 7 Electric Power production as a Function of the DH Supply and Return temperatures
from ENAE database
Figure 8 Alpha Value as a function of the Supply temperature from ENAE database
Figure 9 Alpha Value as a function of the Return temperature from ENAE database
Figure 10 Outdoor Temperatures as a Function of the DH Supply temperatures from ENAE
Database
Figure 11 Heat Load as a function of the Outdoor temperature from ENAE database
Figure 12 Heat flow rate as a function of the Outdoor temperature from ENAE database
Figure 13 Energy in the Accumulator with Corresponding DH Supply temperature
Figure 14 Graphical Relationship of the Simulated and real Values
School of Sustainable Development of Society and Technology
27
LIST OF TABLES
Table 1 Simulated Values of Electrical Power (MW) From ENAE Model


![BESA HIU Test Report · Temperature – primary side return connection [°C] t 21 Temperature – space heating system return connection [°C] t 22 Temperature – space heating system](https://static.documents.pub/doc/80x56/60c69fb731de4143375603f2/besa-hiu-test-report-temperature-a-primary-side-return-connection-c-t-21-temperature.jpg)


