HAL Id: tel-00619609 https://tel.archives-ouvertes.fr/tel-00619609 Submitted on 6 Sep 2011 HAL is a multi-disciplinary open access archive for the deposit and dissemination of sci- entific research documents, whether they are pub- lished or not. The documents may come from teaching and research institutions in France or abroad, or from public or private research centers. L’archive ouverte pluridisciplinaire HAL, est destinée au dépôt et à la diffusion de documents scientifiques de niveau recherche, publiés ou non, émanant des établissements d’enseignement et de recherche français ou étrangers, des laboratoires publics ou privés. Study of GdBaCo2-xMxO5+δ (M=Ni, Fe; x = 0, 0.1, 0.2,…) as new cathode materials for IT-SOFC application Yang Hu To cite this version: Yang Hu. Study of GdBaCo2-xMxO5+δ (M=Ni, Fe; x = 0, 0.1, 0.2,…) as new cathode materials for IT-SOFC application. Other. Ecole Centrale Paris, 2011. English. NNT : 2011ECAP0017. tel-00619609
Transcript
HAL Id: tel-00619609https://tel.archives-ouvertes.fr/tel-00619609
Submitted on 6 Sep 2011
HAL is a multi-disciplinary open accessarchive for the deposit and dissemination of sci-entific research documents, whether they are pub-lished or not. The documents may come fromteaching and research institutions in France orabroad, or from public or private research centers.
L’archive ouverte pluridisciplinaire HAL, estdestinée au dépôt et à la diffusion de documentsscientifiques de niveau recherche, publiés ou non,émanant des établissements d’enseignement et derecherche français ou étrangers, des laboratoirespublics ou privés.
Study of GdBaCo2-xMxO5+δ (M=Ni, Fe; x = 0, 0.1,0.2,…) as new cathode materials for IT-SOFC application
Yang Hu
To cite this version:Yang Hu. Study of GdBaCo2-xMxO5+δ (M=Ni, Fe; x = 0, 0.1, 0.2,…) as new cathode materialsfor IT-SOFC application. Other. Ecole Centrale Paris, 2011. English. NNT : 2011ECAP0017.tel-00619609
Table 1.3 Average linear thermal expansion coefficient of currently used solid oxide electrolytes in air
Electrodes
Electrodes are critical issues in SOFCs since they provide the interfaces between the chemical
energy associated with fuel oxidation and electrical power. For both anode and cathode, high
electrocatalytic activity and electronic conductivity are required to diminish the effective resistance,
especially for cathode which is responsible for the major contribution to the cell voltage losses.
Besides, the electrodes must be mechanically and chemically stable. The thermal expansion of
electrodes should match that of electrolyte and current collector in order to obtain stable interfaces and
avoid the thermal and fatigue stress which could effectively influence the fuel cell performance [30,31].
Chapter 1 Introduction
10
Moreover, the chemical compatibility of electrode materials with respect to the electrolyte and current
collector as well as the stability of microstructure to maintain high specific surface areas and porosity
under operating conditions, are also relevant issues. Various types of materials for SOFC electrode
application have been summarized in detail in some reviews [10,32-37].
Interconnectors
It is evident that the potential commercialization of SOFCs is highly limited by the expensive
costs of interconnector materials employed at high temperature. The interconnectors form the
connection between the anode of one cell and the cathode of the next in a stack arrangement [4]. It must
have a good electronic conductivity and negligible ionic conductivity and meanwhile seal the gas
chambers for the feed of fuel and oxidant gases at electrodes. The interconnector must have a thermal
expansion coefficient (TEC) close to those of the other cell components to minimize thermal stresses,
and include adequate mechanical strength, low permeability to oxygen and hydrogen, as well as
reasonable thermal conductivity. In addition, cost-effective manufacture of fuels cells requires that the
interconnect materials be easy to fabricate. The choice of interconnector materials is dependent on the
stack design and majorly on the operating temperature. Ceramic interconnect materials which are
oxides such as LaCrO3-δ system [38,39], and are thus stable in oxidizing atmospheres, but typically have
lower electrical conductivities as compared to metals. Lowering the operating temperature allows a
switch from ceramic to metallic interconnects by effectively diminishing the oxidation rates for metals
at the cathode side, showing remarkable advantages such as higher electrical and conductivity,
negligible ohmic loss, low cost and easy manufacture [13,38,40,41].
Generally speaking, the combined area-specific resistivity of the cell components (electrolyte,
anode and cathode) should be below 0.5 Ω cm2 (and ideally approach 0.1 Ω cm2) to ensure high power
density aiming to the value of 1 kWdm-3 and 1 kW kg-1 as widely mentioned for transport application [42].
1.2.2 Advantages and challenges
Among those different types of fuel cells, the solid oxide fuel cells have recently drawn
worldwide interests in building a decentralized, hydrogen based energy economy as a potential source
of efficient, environmentally friendly, fuel versatile electric power [35]. The high operating temperature
(600-1000 °C) enables the solid oxide fuel cells to provide several potentials and advantages over
other fuel cells, such as high electric-conversion efficiency, cogeneration-combined heat and power
application, reversible electrode reaction, high tolerance to typical catalyst poisons, high quality of
Chapter 1 Introduction
11
waste heat to recover, as well as the wide fuel flexibility offering the prospect for direct utilization of
natural gas and biogas and other renewable fuels [8,10,35,36].
However, such elevated operation temperature imposes severe constraints on materials
compatibility and stability resulting in utilization of expensive materials and short fuel cell life. Thus,
recently, great research interests have been focused on lowering the operating temperature of SOFCs
from traditional high temperature (800-1000 °C) to the intermediate-temperature (IT) range (500-
800°C) while still maintaining the high power density and efficiency. This development of IT-SOFCs
makes it possible to use less expensive construction materials in interconnects and heat exchanges, and
also enhances the durability of SOFC systems by suppressing problems associated with thermal
cycling and performance degradation arsing from interdiffusion or reaction of the individual
component driven by the high temperature. On the other hand, the decrease in operating temperature
diminishes the conductivity of electrolytes and increases the overpotentials at electrodes, which results
in a reduction of fuel cell voltage and output power. Thus, the great challenge of IT-SOFCs
development attributes to find appropriate electrolytes and electrodes providing both rapid ion
transport across electrolyte and electrode-electrolyte interfaces and efficient electrocatalysis of oxygen
reduction and fuel oxidation reactions in order to reduce the power losses in the commercially relevant
temperature range. Diverse schools of thoughts contribute to the potentials solution, e.g. the use of thin
electrolyte films which could allow to lower the operating temperature couple with modification of
cell configuration with respect to mechanic strength [15,43-47], the utilization of composite electrodes [48]such as the typical LSM-YSZ [48-51], and the exploration of new electrode materials especially the
cathode materials.
With lowering the temperature to the IT temperature range, the electrodes cover a higher
percentage of the voltage loss due to higher activation energy with respect to the progress in
manufacturing thinner and less resistive electrolytes [35]. Moreover, as mentioned above, the
overpotential at cathode is much larger than that of anode since the oxygen reduction is generally
thought to be a more difficult reaction to activate on SOFC operation from IT to low temperature. This
makes the cathode become the major source of cell voltage losses for the whole system [52,53].
Consequently, the development of new cathode materials with mixed ionic-electronic conductivity
shows a great potential for IT-SOFCs application and draws wide research interests.
1.3 Cathode materials for IT-SOFCs
Chapter 1 Introduction
12
Conventional cathode materials are only electronic conductors such as La1-xSrxMnO3-δ (LSM)
possessing high electronic conductivity, good stability under oxidizing atmospheres, and moderate
thermal expansion coefficients (TEC) compatible to commonly used solid electrolyte such as YSZ [38,54-59], which make LSM still considered as the state-of-the-art cathode materials for SOFCs
operating at high temperature 800-1000 °C. However, for this kind of traditional porous electronic
conducting cathodes, reduction of oxygen at cathode is generally thought to be limited to a narrow
region near electrode/electrolyte interface, where the gas species has simultaneous access to both
electronically conductive electrolyte and electronically conductive cathode phases. This limited and
nearly one-dimensional region is called tree-phase boundary (TPB) where air, electrode and
electrolyte are in intimate contact, as shown in Figure 1.5(a). Thus, fuel cell performance using this
kind of cathode materials is highly dependent on the electrode morphology and is very sensitive to
formation of interfacial secondary phase. Consequently, with respect to extend the active region for
oxygen reduction, the improvement of performance devotes to either control the complex electrode
morphologies by suitable cathode processing, or to increase the contact area between ionically and
electronically conductive phases by combining the cathode materials with an ionic conducting oxides
forming a porous composite microstructure as mentioned above, seen in Figure 1.5(b).
Figure 1.5 Function of cathodes in solide oxide fuel cells with: (a) porous single-phase conventional electronically conductive materials; (b) porous two-phase composite;
(c) porous single phase mixed conductive materials [35]
Single phase electronic conductor
Electrode
Electrolyte
( ) ( ) ( )221 2 2 -/ O gas e cathode O electrolyte−+
Electronic phase Ionic phase Single phase mixed conductor
(a) (b) (c)
Chapter 1 Introduction
13
Another strategy to extend the electrochemically active region from the limited TPB at to the
entire electrode/gas interfaces of cathode grains is the use of Mixed Ionic-Electronic Conductors
(MIECs) as cathode materials. As depected in Figure 1.5(C), with application of MIEC cathode,
oxygen molecules diffuse into the porous structure and form oxygen ions by the reduction reaction at
the surface of the mixed conducting cathode and also TPB. The successive oxygen ions can diffuse
either trough the cathode bulk or along the surface to the electrolyte. Even no universal agreement is
achieved for the actual complex oxygen reduction mechanism at cathodes for MIECs due to several
debatable or ambiguous issues, e.g. existence of oxygen intermediates, action region and rate-
determing steps [60], the MIECs would be still highly expected to lower the resistance at IT temperature
with respect to the larger active region available for reaction and ion transfer across the interface. To
select new MIEC compounds for SOFC cathode candidate, the oxygen surface exchange and solid
state diffusion should be taken into account in addition to electronic conductivity as the intrinsic
properties of cathode materials. For example, the ALS model [61,62] was built to model the oxygen
reduction for a porous MIEC cathode in terms of the oxygen ion diffusion coefficient D, surface
exchange rate k, and electrode microstructure factors (surface area, tortuosity and porosity). As shown
in Figure 1.6, with given structure factors, the experimental diffusion coefficient D and surface
exchange coefficient k for La0.8Sr0.2CoO3-δ indicated by the arrow are corresponding to an area specific
resistance of ~ 0.4 Ω cm2, which could be lowered to 0.13 Ω cm2 equal to the value for LSCO on CGO.
Figure 1.6 Variation of the area specific resistance with D and k of La0.8Sr0.2CoO3-δ calculated at 700 °C: surface area = 10000 cm-1, particle size = 3 μm, porosity = 30%,
tortuosity = 1.16 [33]
Perovskite-type mixed ionic-electronic conducting oxides have been intensively studied as
potential cathode materials for IT-SOFCs application, including simple perovskites, Ruddlesden-
Chapter 1 Introduction
14
Popper phases, and double ordered perovskites. These materials are briefly summarized below with
the emphasis on the double ordered perovskites which concerns the subject of this thesis.
1.3.1 ABO3 perovskite oxides
Materials such as doped LaCoO3, BaCoO3 or LaFeO3 have attracted extensive attention due to the
possible use as ceramic membranes for the separation of oxygen and cathode materials for IT SOFC
application. Their original structure can be represented by the general formula ABO3 where A is rare
earth or earth alkaline cation, B is a transition metal. One remarkable property of this kind of materials
is that their defect structure, oxygen stoichiometry and charge transfer could be significantly altered by
A-site acceptor substitution and both acceptor and donor B-site substitution, thereby giving rise to the
possibility to alter oxygen vacancy concentration and oxygen diffusivity. The overall formula for
substituted oxygen deficient perovskites could be modified to A1-xA’xB1-yB’yO3-δ. Large scale of
studies have been done to investigate the influence of substitution (either A-site or B-site or both),
defect structure and oxygen transport, as well as to analyze and model the relationship between the
peculiarities of defect structure and transport properties with different dopant natures [63-65]. By
modifying the type and proportion of A or B or both A and B sites substitution element, various
systems have been developed, with extensive explorations focusing on the mixed conductivity, oxygen
nonstoichiometry, oxygen surface exchange and solid state diffusion, and thermal expansion
coefficient, e.g. SrCo1-xFexO3-δ [66,67], Sr1-xCexFe1-yCoyO3-δ [68], Ba0.5Sr0.5(Co,Mn)0.8Fe0.2O3-δ [69,70],
Among these materials, one attractive example refers to the well investigated La1-xSrxFe1-yCoyO3-δ
(LSCF) system for which moderate dopant additions provide a significant enhancement in the total
conductivity and electrochemical activity. The additions of the acceptor-type cations enhance the
concentrations of mobile oxygen vacancies and p-type electronic charge carriers, in addition, the
oxygen diffusivity is influenced by the content of lower-valence cations, thus the deficient structures
caused by introduction and modification of A and B site substitution are expected to make this system
suitable to cathode application. Nevertheless, increasing Sr2+ content above 50% and decreasing
average cation radius in the Ln3+ sites promote vacancy-ordering and hole localization processes with
a negative influence on the transport properties [37]. Stevenson et al. [84] studied the La1-xMxCo1-yFeyO3-δ
(M = Sr, Ba, Ca) system by comparing there ionic and electronic conductivity, showing that at a
constant temperature, the ionic and electronic conductivities as well as the diffusion coefficients are
strongly dependent on both A and B sites substitution, which could differ by orders of magnitudes.
This determines whether this material is suitable for IT-SOFCs application or not, e.g. LSCF-2882
Chapter 1 Introduction
15
(La0.2Sr0.8Co0.8Fe0.2O3-δ) showed the highest ionic conductivity of 0.87 S cm-1 and electronic
conductivity of 310 S cm-1 at 900 °C while LBCF-2828 exhibited the lowest electronic conductivity of
19 S cm-1. Lankhorst et al [85] studied the La06Sr0.4Co1-yFeyO3-δ (y = 0-0.6) and found that the increase
of iron content gives rise to a lower level of oxygen nonstoichiometry due to the fact that strontium
doping is charge-compensated more readily by hole formation on iron than cobalt. Tai et al.
investigated the LSCF system with low Sr content La0.8Sr0.2Co1-yFeyO3-δ [86] and low Co content La1-
xSrxCo0.2Fe0.8O3-δ [87], respectively, indicating that the Sr content was compensated both electronically
by valence change of B-site ions and ionically by formation of oxygen vacancies with the relative
proportion being temperature dependent. They obtained a maximum electrical conductivity of 200-330
S cm-1 when x = 0.2-0.4 ranging from 600-800 °C in air, and also found that Co substitution increased
the p-type electrical conductivity and thermal expansion coefficient. In addition, with respect to the
application of porous MIEC cathode, oxygen transport properties such surface exchange, chemical
diffusion, self-diffusion and oxygen permeation were extensively investigated. For example, the
electrical conductivity relaxation measurement has been widely applied to investigate the chemical
diffusion coefficient and surface exchange rate in LSCF, and by combing the isotope exchange or
oxygen nonstocihiometry data further transport parameters such as tracer diffusion and oxygen
vacancy diffusion could be obtained [80,88-92]. An optimum combination of transport, electrochemical
properties, and thermomechanical properties in LSFC attributes to the compositions with x = 0.2-0.5
and y = 0.2, exhibiting promising potential for IT-SOFC cathode materials with ceria-base electrolyte.
Moreover, with optimization of microstructure or adoption of cell designs, the cell performance might
be improved significantly and thus match the IT-SOFCs requirements. For example, Bae et al. [93]
obtained the low polarisation resistance of 0.5 Ω cm2 at 520 °C for La0.6Sr0.4Co0.2Fe0.8O3-δ double layer
cathode comprising one thick porous layer and a thin dense film in conjunction with CGO electrolyte.
Hsu et al. [94] has studied the NiO-Sm0.2Ce0.8O1.9(SDC)/SDC/ La0.6Sr0.4Co0.2Fe0.8O3-δ cell with either
single layer or double layer cathode and obtained improved cell performance with introduction of a
thin, porous intermediate cathode layer showing ASR of 0.05 Ω cm2 at 600 °C and maximum power
density of 0.91 W cm-2 at 600 °C and 1.18 W cm-2 at 700 °C. Similar high performance has been
achieved by adding an interlayer in anode-supported Ni-YSZ/YSZ/SDC/La0.6Sr0.4Co0.2Fe0.8O3-δ [47] cell,
exhibiting an extraordinary high power density of 2.6 Wcm-2 at 0.7 V in flowing oxygen at 750 °C, as
well as reduced ohmic resistance of 0.06 Ωcm2 and polarization resistance of 0.03 Ωcm2.
In comparison with the manganite or ferrite-based materials, perovskite-type cobalts show better
mixed conductivity and exceptional electrochemical activity, but also higher thermal expansion
coefficient (> 20×10-6 K-1) which limits the compatibility with currently used solid oxide electrolyte.
Thus their application as cathodes requires an intermediate barrier layer, the modification of the
composition or formation of composite electrodes. In addition, some B-site substitutions for Co or Fe
were found to be able to reduce the thermal expansion coefficient: e.g. increase of Fe substitution
Chapter 1 Introduction
16
could effectively decrease the thermal expansion coefficient in LSCF [86] and SmxSr1-xCo1-yFeyO3
system [95], Ni substitution for Co was also found to decrease the TEC in the LSCFN and LSCN
systems [96-98]. Moreover, La1-xSrxFe1-yTiyO3-δ system has been investigated with respect to the lowering
of TEC by Ti substitution for Fe, showing that the ionic and p-type electronic conductivities were both
found to reduced with A-site deficiency and to increase with Fe content, and the average thermal
expansion coefficients in air at 100-850 °C are in the range (10.6-21.5)×10−6 K−1 [81-83]. Recently,
exceptionally remarkable performance was reported for Ba0.5Sr0.5Co0.8Fe0.2O3-δ (BSCF) by Shao et al. [70] to give very low ASR values of 0.055-0.071 at 600 °C and 0.51-0.6 at 500 °C with BSCF/SDC
symmetric cell configuration, and fuel cell test based on Ni+SDC/SDC/BSCF cell using humidified
hydrogen as fuel and air as oxidant exhibited extremely high power density of 1010 mW cm-2 and 402
mW cm-2 at 600 °C and 500 °C, respectively. These values are considered as the best performance at
such reduced temperature range and enable possible practical implementation of IT-SOFCs.
Nevertheless, the excellent cathode performances are somehow thought to be related to the addition of
silver in this system used as the current collectors [33].
1.3.2 Ruddlesden-Popper structure
The so called Ruddlesden-Popper (RP) perovskite oxides with the general formula An+1BnO3n+1
consist of nABO3 perovskite layers sandwiched between two AO rock-salt layers, comprising A-site
rare of alkaline earth and B-site transition metals. Of particular interest for SOFC cathode application,
the Ln2NiO4+δ (Ln = La, Pr, Nd) based compounds, referring to n = 1 RP structure, haven been
proposed, which exhibit suitable electronic conductivity and a relatively high ionic conductivity due to
high oxygen overstoichiometry, TECs compatible with commonly used electrolytes and chemical
compatibility with other SOFC components. Take the most studied La2NiO4+δ based compounds for
instance; the structure of pure La2NiO4+δ can be described as succession of LaNiO3 perovskite layers
alternating (or sandwiched between) with LaO rock-salt layers, as depicted in Figure 1.7. The
oxygen excess in these materials results from the incorporation of interstitial oxygen anions into the
rock-salt LaO layers, as well the bulk ionic transport occurs via diffusion of interstitial ions in the
rock-salt layers, which possess fast diffusivity, and vacancies in the perovskite layers [99-101]. At
ambient, maximum oxygen excess can be achieved in case of La2NiO4.18 and Pr2NiO4.22. The thermal
expansion coefficients observed for Ln2NiO4+δ based compounds, ~11-14×10-6 K-1 [102-104], match well
with the values of the electrolytes YSZ, CGO and LGSM. Moreover, similarly to the ABO3 structure
perovskites, the transport properties can be adjusted in a wide range by A-site and/or B site
substitution.
Chapter 1 Introduction
17
Figure 1.7 Polyhedral view of Ruddlesden-Popper structure La2NiO4
Skinner and Kilner [105] have investigated the surface exchange and self-diffusion coefficient by
IEDP/SIMS experiment for La2-xSrxNiO4+δ (x = 0, 0.1) and found that A-site substitution by Sr
lowered the tracer diffusion coefficient indicating a decrease of number of oxygen interstitials
associated with a reduction in oxygen excess which was confirmed by TGA. Nevertheless, oxygen
transport properties of La2NiO4+δ were found to be almost as good as current MIEC materials such as
LSCF and LSC showing good thermomechanical stability at elevated temperature. This is in good
agreement with recent study of La2-xSrxNiO4+δ (x = 0.1, 0.2) by Li et al [106], in which both experiments
and defect calculation implied that Sr substitution led to higher jumping energy barrier for oxide ions
to migrate which could thereby decrease the bulk diffusion, as well as to higher surface exchange rate
with lower activation energy. Moreover, the incorporation of ionized atomic oxygen into surface
vacancies was suggested to be the rate determining steps. EIS measurement of long-term stability of
La2NiO4+δ with YSZ and CGO and reactivity tests showed an increase of ASR as a function of time
indicating some chemical reactivity among cell components and formation of secondary phases [107].
B-site substitution for Ni with other transition metals has been widely studied. For example, oxygen
transport properties have been extensively investigated in the Cu-substituted La2Ni1-xCuxO4+δ systems [103,108-110], and the diffusion coefficient slightly lowered with increasing Cu content but no meaningful
affect was obtained. Li et al. [111] studied the cathode performance of La2-xSrxNiO4+δ (x = 0.1, 0.3, 05)
with CGO electrolyte and best performance was obtained in La1.7Sr0.3NiO4+δ with the ASR of 0.16 Ω
cm-2 at 700 °C and 1.2 Ω cm-2 at 500 °C in air. Aguadero et al. [112] investigated the La2Ni1-xCuxO4+δ (0
≤ x ≤ 1) by AC impedance with YSZ and CGO electrolytes in symmetric cell configuration, with
LaNiO
Chapter 1 Introduction
18
satisfactory total conductivity and thermal compatibility, but very high ASR values e.g. the best ASR
is ~1 Ω cm-2 at 850 °C. By comparing the electrode properties of Ln2NiO4+δ based compounds with A-
site La, Pr and Nd [113] in terms of impedance measurement with symmetric cell on YSZ electrolyte,
Pr2NiO4+δ appeared to have the lowest ASR value but was chemically reactive with YSZ, and
Nd2NiO4+δ exhibited promising electrode properties due to its high chemical stability and low
polarization resistance compared to classical LSM, which is in consistency with good electrocatalytic
properties and transport properties in these oxides [114]. Recently Ding et al. [115] has obtained attractive
cathode performance for Nd1.7Sr0.3CuO4+δ on SDC electrolyte, with polarisation resistances of 0.07 Ω
cm-2 at 800 °C and 0.24 Ω cm-2 at 700 °C in air, which were consistent with high exchange current
density of 390.7 mA/cm2 and 76.1 mA/cm2 at 800 and 700 °C, respectively, making this compound a
promising cathode materials for the IT-SOFCs based on doped ceria electrolyte.
For the RP structure Ln2NiO4+δ materials, high ionic conductivities are expected due to their fast
diffusion of oxygen interstitials. However, it should be noticed that the value of electrical
conductivities in these materials is comparatively low with respect to other systems, which is usually
less than or close to the standard value of 100 S cm-1 [103,108,116]. Their low thermal expansion
coefficients compatible with currently used electrolytes are considered as one major advantage for
potential application of cathode materials in IT-SOFCs, which is whilst limited by the low chemical
stability and chemical reactivity with electrolytes observed for some compounds.
1.3.3 Ordered double layer perovskites
Recently, another type of mixed conducting perovskite oxides represented by the general formula
LnBaCo2O5+δ (Ln = Pr, Nd, Sm, Eu, Gd, Tb, Dy, and Ho) has drawn tremendous attention as potential
cathodes for IT-SOFCs due to the promising MIEC properties. These compounds are related to the
“112” type structure and for a certain range of oxygen stoichiometry consist of double-pyramidal
cobalt layers containing the Ba cations interleaved with Ln layers, as well as exhibit high electronic
conductivity above the metal-insulator transition temperature and wide variation in oxygen
nonstoichiometry [117]. Furthermore, Taskin et al. investigated the single crystal GdBaCo2O5+δ [118] on
its structural, transport, magnetic, thermoelectric properties over a wide range of oxygen content, 0≤ δ
≤ 0.77. As depicted in Figure 1.8, a simple cubic perovskite having the chemical formula
Gd0.5Ba0.5CoO3 with randomly occupied A sites Gd (a) can transform into a double layered crystal
GdBaCo2O6 or a oxygen deficient double layered GdBaCo2O5+δ with a variability of oxygen content, 0
≤ δ ≤ 1 (b)−(d). This transformation is driven by alternating lanthanide and alkali-earth planes, which
reduces the oxygen bonding strength and provides disorder-free channels for ion motion, pointing to
an efficient way to design new ionic conductors.
Chapter 1 Introduction
19
Figure 1.8 Ordering of lanthanide Gd3+ and alkali-earth Ba2+ ions in the A-site sublattice of half-doped perovskites [118,119]: (a) simple cubic perovskite Gd0.5Ba0.5CoO3
with random occupation of A-sites is transformed into (b) a layered crystal GdBaCo2O6 by doubling the unit cell, (c) Oxygen atoms can be partially or completely removed from
lanthanide planes in GdBaCo2O5+δ, providing a variability of the oxygen content, such as (d) GdBaCo2O5.5 when δ = 0.5
It has also been proved that oxygen diffusivity could be enhanced by orders of magnitude by
inducing crystallographic ordering among lanthanide and alkali-earth ions in the A-site sublattice by
Taskin et al. [119]. Rather fast oxygen diffusion, exceeding 10-5 cm2 s-1 at 600 °C, and high surface
exchange rates have been derived with quite low activation energy, moreover, as well, the ionic
conductivity of ~ 0.01 S cm-1 could be achieved at nearly 500 °C, exhibiting promising potential for
IT-SOFCs as MIEC cathode materials and having attracted extensive attention for this materials.
Tarancón et al. [120] studied the stability of GdBaCo2O5+δ in CO2 containing atmosphere (< 500 ppm to
100 % CO2) showing excellent stability in air over the IT temperature range (500-700 °C), as well as
good chemical stability with the state-of-the-art electrolytes for SOFCs, LSGM and CGO, except YSZ.
Moreover, their electrochemical characterization using symmetric cells were carried out with both
LSGM and CGO electrolytes and obtained ASR = 0.25 Ω cm-2 at ~650 °C. Fuel cells test carried out
with the configuration GBCO/LSGM/CGO/Ni-CGO using Air and H2 as oxidant and fuel respectively
showed a maximum power density of 180 mW cm-2 at 800 °C, close to that using BSCF as cathode
under the same condition, which was 240 mW cm-2 [121]. In addition, Tarancón et al. investigated the
intrinsic oxygen transport and exchange of ceramic GdBaCo2O5+δ [122] using IEDP/SIMS method, and
achieved suitable tracer diffusion coefficient and surface exchange coefficient with low activation
energies compared to other cobaltites with mixed conducting such as LSC and LSCF. As discussed
above and results from other works [46,123,124], excellent performance has been observed involving
oxygen transport coefficients, polarisation resistance and electronic conductivity for GdBaCo2O5+δ in
the temperature range of interest, indicating that this material is a good cathode candidate for
intermediate even low temperature SOFC application.
(a) (b)
(c) (d)
Chapter 1 Introduction
20
Apart from GdBaCo2O5+δ, analogues materials in LnBaCo2O5+δ family have also been
investigated and evaluated for IT-SOFC application. Similar structural change and phase transition
were observed in PrBaCo2O5.48, NdBaCo2O5+δ, TbBaCo2O5+δ and SmBaCo2O5+δ [125-132]. Zhang et al. [133] found that the size of A site Ln3+ cation in LnBaCo2O5+δ is directly related to the stability of
layered structure under reduction condition which could be kept for the composition with Ln = Pr, Nd,
Sm and Gd but not for Ln = La or Y, and highest oxygen flux through was obtained across a
membrane composed of PrBaCo2O5+δ, and these compounds showed attractive electrode performances
with SDC electrolyte, especially PrBaCo2O5+δ which possessed an ASR of ~0.213 Ω cm-2 at 600 °C.
Moreover, excellent performance for a fuel cell for PrBaCo2O5+δ with SDC electrolyte have been
reported [134,135], showing considerable maximum power density ~600 mW cm-2 at 600 °C. Zhou et al.
reported very low ASR of SmBaCo2O5+δ on SDC and LSGM electrolyte of 0.098 and 0.054Ω cm-2 at
750 °C respectively.
Nevertheless, as usually observed in cobaltite compound, LnBaCo2O5+δ shows large thermal
expansion coefficient, e.g. 16.0~20.0×10⁻⁶ K-1 [124,136,137] for the case GdBaCo2O5+δ, considerably
higher than those of typical electrolytes such as YSZ, CGO and LSGM, giving rise to mismatch during
fabrication of cells and thermal cycling of operation process. One effective strategy is the use of
composite electrodes with incorporation of electrolyte materials to cathode, which could reduce the
thermal mismatch and also extend the TPB into electrode in addition to the electrode/electrolyte
interface thereby enhancing the electrode performances. For example, Kim et al. [138] obtained a small
ASR value of 0.05Ω cm-2 at 700 °C for a composite electrode SBCO:50 (50 wt% SmBaCo2O5+δ and
50 wt% Ce0.9Gd0.1O2-δ) on CGO91 electrolyte, as well as reduced the TEC from about 20 20.0×10⁻⁶ K-1
down to ~12.5×10⁻⁶ K-1 in the temperature range from 500 to 700 °C. Lee et al. investigated
GdBaCo2O5+δ – Ce0.9Gd0.1O1.95 (CGO) composited cathodes, and best performance was found with 30
wt% CGO-70wt % GBCO (GBCO:30) cathode, for which TEC was reduced to 14.7 ×10⁻⁶ K-1 and
maximum powder density of GBCO:30/CGO/Ni-CGO cell was 340 and 525 mW cm-2 at 650 and 700
°C, respectively, showing a high performance for promising IT-SOFC cathode candidate. Moreover,
another school of thought is the B-site substitution for Co by other transition metals such as Ni, Fe or
Cu [139-141], with the aim to lower TEC and optimize the electrochemical performance.
Intrinsic properties of several MIEC electrode materials discussed above are summarised in Table
1.4. It can be noticed that in general the RP type layered perovskites show higher oxygen diffusivity
than simple perovskite materials but also comparatively low overall electrical conductivity. The
double layered PrBaCo2O5+δ shows highest transport properties at even lower temperature. However,
these kinetics parameters, especially the surface exchange coefficient, are very sensitive to the sample
quality and surface conditions, which may possibly give rise to a wide degree of variability and
discrepant results for the same components obtained by different methods or authors.
Chapter 1 Introduction
21
Oxygen transport kinetics Total conductivity Composition
T (°C) D* (cm2 s-1) k* (cm s-1) T (°C) σ (S cm-1) Ref.
Table 1.4 Oxygen self-diffusion and surface exchange coefficients and total conductivities for different SOFC cathode materials
1.4 Scope of the thesis
GdBaCo2O5+δ, has shown attractive performance for IT-SOFC cathode application. Generally,
cobaltites possess the best electrical conductivity and usually good ionic conductivity, but their
potential for electrode materials is still limited by their large thermal expansion coefficients and
chemical activity with YSZ. Substitution for Co by other transition metal such as Fe, Ni or Cu has
been widely adopted to improve the material properties of cobaltite perovskites, and successively
obtained great improvements such as lower thermal expansion, better chemical stability or enchanced
electrode performance [86,88,95,97,148,149]. However, most of these works are focused on the LSC type
perovskite materials, not much attention is paid on this kind of substitution in double layer perovskites
materials, e.g. GdBaCo2O5+δ.
The objective of present thesis is to explore new cathode materials based on the GdBaCo2O5+δ by
Ni and Fe substitution aiming to altering the material properties and obtain better electrode
performance.
Chapter 1 Introduction
22
GdBaCo2-xMxO5+δ (M=Ni or Fe, x = 0.1, 0.2 …) are synthesized by wet chemical method,
seeking for solid solubility of Ni and Fe with moderate processing, these works are
integrated in Chapter 2.
Chapter 2 is also focused on the chemical-physical characterizations for the as-synthesized
materials: Structural evolution with substitution, oxygen nonstoichiometry, temperature
dependent phase transition and thermal expansion coefficient are investigated.
Chapter 3 deals with the electrochemical performance of several selected composition
serving as porous electrodes on different kinds of electrolyte, as well as intends to
understand the oxygen reduction mechanism and look for the rate determining factor.
Chapter 4 is devoted to the electrical and oxygen transport properties coupled with oxygen
nonstoichiometries in the investigated temperature range and atmospheres, more concerning
the intrinsic properties of materials.
Chapter 1 Introduction
23
REFERENCES
[1] Carrette, L.; Friedrich, K. A.; Stimming, U. ChemPhysChem 2000, 1, 162-193.
[2] Winter, M.; Brodd, R. Chemical reviews 2004, 104, 4245.
[3] McCusker, L. B.; Von Dreele, R. B.; Cox, D. E.; Louer, D.; Scardi, P. Journal of Applied Crystallography 1999, 32, 36-50.
[4] Carrette, L.; Friedrich, K. A.; Stimming, U. Fuel Cells 2001, 1, 5-39.
[5] Williams, M. C.; Strakey, J. P.; Singhal, S. C. Journal of Power Sources 2004, 131, 79-85.
[6] Chalk, S. G.; Miller, J. F.; Wagner, F. W. Journal of Power Sources 2000, 86, 40-51.
[7] Dufour, A. U. Journal of Power Sources 1998, 71, 19-25.
[8] Minh, N. Q. Solid State Ion. 2004, 174, 271-277.
[9] Hart, D. Journal of Power Sources 2000, 86, 23-27.
[10] Haile, S. M. Acta Materialia 2003, 51, 5981-6000.
[11] LALANNE, C. Thèse, L'UNIVERSITE BORDEAUX 1, 24 Oct 2005.
[12] Manning, P. S.; Sirman, J. D.; DeSouza, R. A.; Kilner, J. A. Solid State Ion. 1997, 100, 1-10.
[13] Sahibzada, M.; Steele, B. C. H.; Barth, D.; Rudkin, R. A.; Metcalfe, I. S. Fuel 1999, 78, 639-643.
[14] Sahibzada, M.; Steele, B. C. H.; Hellgardt, K.; Barth, D.; Effendi, A.; Mantzavinos, D.; Metcalfe, I. S. Chemical Engineering Science 2000, 55, 3077-3083.
[15] Sahibzada, M.; Steele, B. C. H.; Zheng, K.; Rudkin, R. A.; Metcalfe, I. S. Catalysis Today 1997, 38, 459-466.
[16] Fergus, J. W. Journal of Power Sources 2006, 162, 30-40.
[18] Steele, B. C. H. Solid State Ion. 2000, 129, 95-110.
[19] Xia, C.; Chen, F.; Liu, M. Electrochem. Solid State Lett. 2001, 4, A52-A54.
[20] Tietz, F. Ionics 1999, 5, 129-139.
[21] Mori, M.; Abe, T.; Itoh, H.; Yamamoto, O.; Takeda, Y.; Kawahara, T. Solid State Ion. 1994, 74, 157-164.
[22] Kharton, V. V.; Figueiredo, F. M.; Navarro, L.; Naumovich, E. N.; Kovalevsky, A. V.; Yaremchenko, A. A.; Viskup, A. P.; Carneiro, A.; Marques, F. M. B.; Frade, J. R. Journal of Materials Science 2001, 36, 1105-1117.
[23] Zajac, W.; Swierczek, K.; Molenda, J. Journal of Power Sources 2007, 173, 675-680.
[24] Kharton, V. V.; Kovalevsky, A. V.; Viskup, A. P.; Shaula, A. L.; Figueiredo, F. M.; Naumovich, E. N.; Marques, F. M. B. Solid State Ion. 2003, 160, 247-258.
[25] Ullmann, H.; Trofimenko, N.; Tietz, F.; Stöver, D.; Ahmad-Khanlou, A. Solid State Ion. 2000, 138, 79-90.
[26] Stevenson, J. W.; Hasinska, K.; Canfield, N. L.; Armstrong, T. R. J. Electrochem. Soc. 2000, 147, 3213-3218.
[27] Huang, W.; Shuk, P.; Greenblatt, M. Solid State Ion. 1998, 113-115, 305-310.
[28] Sameshima, S.; Ichikawa, T.; Kawaminami, M.; Hirata, Y. Materials Chemistry and Physics 1999, 61, 31-35.
Chapter 1 Introduction
24
[29] Zheng, Y.; Gu, H.; Chen, H.; Gao, L.; Zhu, X.; Guo, L. Materials Research Bulletin 2009, 44, 775-779.
[30] Majumdar, S.; Claar, T.; Flandermeyer, B. J. Am. Ceram. Soc. 1986, 69, 628-633.
[31] Hsiao, Y. C.; Selman, J. R. Solid State Ion. 1997, 98, 33-38.
[32] Steele, B. C. H. Solid State Ion. 1996, 86-88, 1223-1234.
[33] Jacobson, A. J. Chem. Mat. 2009, 22, 660-674.
[34] Haile, S. M. Materials Today 2003, 6, 24-29.
[35] Adler, S. B. ChemInform 2004, 35.
[36] Tsipis, E. V.; Kharton, V. V. J. Solid State Electrochem. 2008, 12, 1039-1060.
[37] Tsipis, E. V.; Kharton, V. V. J. Solid State Electrochem. 2008, 12, 1367-1391.
[38] Steele, B. C. H. Journal of Materials Science 2001, 36, 1053-1068.
[39] Fergus, J. W. Solid State Ion. 2004, 171, 1-15.
[40] Yang, Z.; Weil, K. S.; Paxton, D. M.; Stevenson, J. W. J. Electrochem. Soc. 2003, 150, A1188-A1201.
[41] Kurokawa, H.; Kawamura, K.; Maruyama, T. Solid State Ion. 2004, 168, 13-21.
[42] Steele, B. C. H.; Heinzel, A. Nature 2001, 414, 345-352.
[43] Tarancon, A.; Dezanneau, G.; Arbiol, J.; Peiro, F.; Morante, J. R. In Conference on Scientific Advances in Fuel Cell Systems Amsterdam, Netherlands, 2002, p 256-264.
[44] Tsuchiya, M.; Bojarczuk, N. A.; Guha, S.; Ramanathan, S. The Journal of Chemical Physics 2009, 130, 174711.
[45] Zhao, F.; Virkar, A. V. Journal of Power Sources 2005, 141, 79-95.
[46] Lee, Y.; Kim, D. Y.; Choi, G. M. Solid State Ion., In Press, Corrected Proof.
[47] Lu, Z.; Hardy, J.; Templeton, J.; Stevenson, J. Journal of Power Sources 2011, 196, 39-45.
[48] Mogensen, M.; Primdahl, S.; JØrgensen, M. J.; Bagger, C. J. Electroceram. 2000, 5, 141-152.
[49] McIntosh, S.; Adler, S. B.; Vohs, J. M.; Gorte, R. J. Electrochem. Solid State Lett. 2004, 7, A111-A114.
[50] Jorgensen, M. J.; Mogensen, M. J. Electrochem. Soc. 2001, 148, A433-A442.
[51] Choi, M. B.; Jeon, S. Y.; Hwang, H. J.; Park, J. Y.; Song, S. J. Solid State Ion. 2010, 181, 1680-1684.
[52] Brandon, N. P.; Skinner, S.; Steele, B. C. H. Annual Review of Materials Research 2003, 33, 183-213.
[53] Fleig, J. Annual Review of Materials Research 2003, 33, 361-382.
[54] Kharton, V. V.; Naumovich, E. N.; Vecher, A. A. J. Solid State Electrochem. 1999, 3, 61-81.
[55] Huijsmans, J. P. P. Current Opinion in Solid State and Materials Science 2001, 5, 317-323.
[56] Yasuda, I.; Hishinuma, M. Journal of Solid State Chemistry 1995, 115, 152-157.
[57] Yasuda, I.; Hishinuma, M. Solid State Ion. 1995, 80, 141-150.
[58] Yasuda, I.; Hishinuma, M. Journal of Solid State Chemistry 1996, 123, 382-390.
[59] Yasuda, I.; Hikita, T. J. Electrochem. Soc. 1994, 141, 1268-1273.
[60] Li, Y.; Gemmen, R.; Liu, X. Journal of Power Sources 2010, 195, 3345-3358.
[61] Adler, S. B.; Lane, J. A.; Steele, B. C. H. J. Electrochem. Soc. 1996, 143, 3554-3564.
[62] Adler, S. B.; Lane, J. A.; Steele, B. C. H. J. Electrochem. Soc. 1997, 144, 1884-1890.
[63] Zuev, A.; Petrov, A.; Vylkov, A.; Tsvetkov, D. Journal of Materials Science 2007, 42, 1901-1908.
[64] Petrov, A.; Cherepanov, V.; Zuev, A. J. Solid State Electrochem. 2006, 10, 517-537.
Chapter 1 Introduction
25
[65] Dalslet, B. T.; Søgaard, M.; Bouwmeester, H. J. M.; Hendriksen, P. V. Solid State Ion. 2009, 180, 1173-1182.
[96] Huang, K.; Lee, H. Y.; Goodenough, J. B. J. Electrochem. Soc. 1998, 145, 3220-3227.
[97] Nagamoto, H.; Mochida, I.; Kagotani, K.; Inoue, H.; Negishi, A. Journal of Materials Research 1993, 8, 3158-3162.
[98] Hjalmarsson, P.; Søgaard, M.; Hagen, A.; Mogensen, M. Solid State Ion. 2008, 179, 636-646.
[99] V. Kharton, V.; P. Viskup, A.; N. Naumovich, E.; M. B. Marques, F. Journal of Materials Chemistry 1999, 9, 2623-2629.
[100] Vashook, V. V.; Yushkevich, I. I.; Kokhanovsky, L. V.; Makhnach, L. V.; Tolochko, S. P.; Kononyuk, I. F.; Ullmann, H.; Altenburg, H. Solid State Ion. 1999, 119, 23-30.
[101] Kharton, V. V.; Viskup, A. P.; Kovalevsky, A. V.; Naumovich, E. N.; Marques, F. M. B. Solid State Ion. 2001, 143, 337-353.
[102] Boehm, E.; Bassat, J. M.; Dordor, P.; Mauvy, F.; Grenier, J. C.; Stevens, P. Solid State Ion. 2005, 176, 2717-2725.
[103] Kharton, V. V.; Tsipis, E. V.; Yaremchenko, A. A.; Frade, J. R. Solid State Ion. 2004, 166, 327-337.
[104] Al Daroukh, M.; Vashook, V. V.; Ullmann, H.; Tietz, F.; Arual Raj, I. Solid State Ion. 2003, 158, 141-150.
[105] Skinner, S. J.; Kilner, J. A. Solid State Ion. 2000, 135, 709-712.
[106] Li, Z.; Haugsrud, R.; Norby, T. Solid State Ion., In Press, Corrected Proof.
[107] Hernández, A. M.; Mogni, L.; Caneiro, A. International Journal of Hydrogen Energy 2010, 35, 6031-6036.
[108] Mauvy, F.; Bassat, J. M.; Boehm, E.; Dordor, P.; Grenier, J. C.; Loup, J. P. In 8th International Conference on Electronic Ceramics and Their Applications (ELECTROCERAMICS VIII); Elsevier Sci Ltd: Rome, ITALY, 2002, p 1265-1269.
[109] Mauvy, F.; Bassat, J. M.; Boehma, E.; Dordor, P.; Loup, J. P. Solid State Ion. 2003, 158, 395-407.
[110] Mauvy, F.; Boehm, E.; Bassat, J. M.; Grenier, J. C.; Fouletier, J. Solid State Ion. 2007, 178, 1200-1204.
[114] Mauvy, F.; Bassat, J. M.; Boehm, E.; Manaud, J. P.; Dordor, P.; Grenier, J. C. Solid State Ion. 2003, 158, 17-28.
[115] Ding, X.; Kong, X.; Jiang, J.; Cui, C. International Journal of Hydrogen Energy 2009, 34, 6869-6875.
[116] Tang, J. P.; Dass, R. I.; Manthiram, A. Materials Research Bulletin 2000, 35, 411-424.
[117] Maignan, A.; Martin, C.; Pelloquin, D.; Nguyen, N.; Raveau, B. Journal of Solid State Chemistry 1999, 142, 247-260.
[118] Taskin, A. A.; Lavrov, A. N.; Ando, Y. Phys. Rev. B 2005, 71, 28.
[119] Taskin, A. A.; Lavrov, A. N.; Ando, Y. Appl. Phys. Lett. 2005, 86, 3.
[120] Tarancon, A.; Pena-Martinez, J.; Marrero-Lopez, D.; Morata, A.; Ruiz-Morales, J. C.; Nunez, P. Solid State Ion. 2008, 179, 2372-2378.
[121] Pena-Martinez, J.; Tarancon, A.; Marrero-Lopez, D.; Ruiz-Morales, J. C.; Nunez, P. Fuel Cells 2008, 8,
Chapter 1 Introduction
27
351-359.
[122] Tarancon, A.; Skinner, S. J.; Chater, R. J.; Hernandez-Ramirez, F.; Kilner, J. A. Journal of Materials Chemistry 2007, 17, 3175-3181.
[123] Choi, M. B.; Jeon, S. Y.; Lee, J. S.; Hwang, H. J.; Song, S. J. Journal of Power Sources 2010, 195, 1059-1064.
[124] Li, N.; Lu, Z.; Wei, B. O.; Huang, X. Q.; Chen, K. F.; Zhang, Y. Z.; Su, W. H. Journal of Alloys and Compounds 2008, 454, 274-279.
[125] Streule, S.; Podlesnyak, A.; Sheptyakov, D.; Pomjakushina, E.; Stingaciu, M.; Conder, K.; Medarde, M.; Patrakeev, M. V.; Leonidov, I. A.; Kozhevnikov, V. L.; Mesot, J. Phys. Rev. B 2006, 73, 5.
[126] Streule, S.; Podlesnyak, A.; Pomjakushina, E.; Conder, K.; Sheptyakov, D.; Medarde, M.; Mesot, J. In International Conference on Strongly Correlated Electron Systems (SECES 05); Elsevier Science Bv: Vienna, AUSTRIA, 2005, p 539-540.
[127] Lobanovskii, L. S.; Troyanchuk, I. O. Jetp Lett. 2005, 82, 719-722.
[128] Burley, J. C.; Mitchell, J. F.; Short, S.; Miller, D.; Tang, Y. Journal of Solid State Chemistry 2003, 170, 339-350.
[129] Taskin, A. A.; Lavrov, A. N.; Ando, Y. Phys. Rev. B 2006, 73, 121101.
[130] Kopcewicz, M.; Khalyavin, D.; Troyanchuk, I.; Szymczak, H.; Szymczak, R.; Logvinovich, D.; Naumovich, E. J. Appl. Phys. 2003, 93, 479-486.
[131] Moritomo, Y.; Akimoto, T.; Takeo, M.; Machida, A.; Nishibori, E.; Takata, M.; Sakata, M.; Ohoyama, K.; Nakamura, A. Phys. Rev. B 2000, 61, R13325.
[132] Conder, K.; Podlesnyak, A.; Pomjakushina, E.; Pomjakushin, V.; Stingaciu, M.; Karkin, A. E. In 17th International Conference on Magnetism (ICM 2006); Elsevier Science Bv: Kyoto, JAPAN, 2006, p 907-909.
[134] Zhu, C.; Liu, X.; Yi, C.; Yan, D.; Su, W. Journal of Power Sources 2008, 185, 193-196.
[135] Chen, D.; Ran, R.; Zhang, K.; Wang, J.; Shao, Z. Journal of Power Sources 2009, 188, 96-105.
[136] Tang, Y. K.; Almasan, C. C. Phys. Rev. B 2008, 77, 5.
[137] Tarancon, A.; Marrero-Lopez, D.; Pena-Martinez, J.; Ruiz-Morales, J. C.; Nunez, P. Solid State Ion. 2008, 179, 611-618.
[138] Kim, J. H.; Kim, Y.; Connor, P. A.; Irvine, J. T. S.; Bae, J.; Zhou, W. Journal of Power Sources 2009, 194, 704-711.
[139] Ding, H.; Xue, X. International Journal of Hydrogen Energy 2010, In Press, Corrected Proof.
[140] Kim, Y. N.; Kim, J. H.; Manthiram, A. Journal of Power Sources 2010, 195, 6411-6419.
[141] Wei, B.; Lü, Z.; Jia, D.; Huang, X.; Zhang, Y.; Su, W. International Journal of Hydrogen Energy 2010, In Press, Corrected Proof.
[142] Petric, A.; Huang, P.; Tietz, F. Solid State Ion. 2000, 135, 719-725.
[143] Bouwmeester, H. J. M.; Burggraaf, A. J. In Membrane Science and Technology; Burggraaf, A. J., Cot, L., Eds.; Elsevier: 1996; Vol. Volume 4, p 435-528.
[144] Atkinson, A.; Chater, R. J.; Rudkin, R. Solid State Ion. 2001, 139, 233-240.
[145] Mauvy, F.; Lalanne, C.; Bassat, J. M.; Grenier, J. C.; Zhao, H.; Dordor, P.; Stevens, P. J. Eur. Ceram. Soc. 2005, 25, 2669-2672.
[146] Bassat, J. M.; Petitjean, M.; Fouletier, J.; Lalanne, C.; Caboche, G.; Mauvy, F.; Grenier, J. C. Applied Catalysis A: General 2005, 289, 84-89.
[147] Kim, G.; Wang, S.; Jacobson, A. J.; Reimus, L.; Brodersen, P.; Mims, C. A. Journal of Materials
Chapter 1 Introduction
28
Chemistry 2007, 17, 2500-2505.
[148] Ortiz-Vitoriano, N.; de Larramendi, I. R.; de Larramendi, J. I. R.; Arriortua, M. I.; Rojo, T. Journal of Power Sources 2009, 192, 63-69.
[149] Chiba, R.; Yoshimura, F.; Sakurai, Y. Solid State Ion. 1999, 124, 281-288.
Chapter 2 Synthesis, Processing and Physical-Chemical Characterisation
29
Chapter 2 Synthesis, Processing and Physical-Chemical
Characterisation
2.1 Introduction
In this chapter, methods for powder fabrication and investigation are introduced in details, as well
as the characterisation of physical and chemical properties of Ni and Fe doped GdBaCo2O5+δ cathode
materials.
2.2 Synthesis of Ceramic Materials
Diverse fabrication methods for pure GBCO as well as doped GBCO have been applied in
previous works, such as the floating zone method for GBCO single crystal [1,2], solid state reaction [3,4]
and wet chemical routes [5-9] for ceramic polycrystalline powders. In this work, both solid state
reaction and wet chemical routes have been attempted to obtain pure complex GBCO and Ni or Fe
doped compounds.
2.2.1 Solid state reaction (SSR)
Traditional solid state reaction SSR is the most commonly used method for multi-component
powder synthesis, which involves intimate mechanical mixing of precursors (oxides, carbonate or
nitrates), repeated grinding and heating cycles, with the advantage of its simplicity and facility of large
production. Previous works have proved SSR to be an effective route for pure GdBaCo2O5+δ powders
synthesis [10-12], as shown in Table 2.1. In these works, starting materials, Gd2O3, BaCO3 and Co3O4,
were weighted in stoichiometric proportion and well mixed, followed by diverse high temperature
thermal treatment processes, coupled with intermediate regrinding or repeated thermal cycles.
The nominal formation reaction of this solid state reaction can be written as follows:
2 3 3 3 4 2 5 21/ 2 2 / 3Gd O BaCO Co O GdBaCo O COσ++ + → + ↑ (2.1)
However, this classical method is unable to provide submicron powder with a controlled morphology,
which is important for electrode materials. The multiple repetitions of grinding and prolonged thermal
treatment cycles can easily induce uncontrolled crystalline growth, composition inhomogeneities and
grain size non-uniformity, as well as apparently small solubility limits of doping elements.
Chapter 2 Synthesis, Processing and Physical-Chemical Characterisation
30
Ref. Process
A. Maignan [13] Decarbonation at 1000ºC, pressed into bar then heated at 1100 ºC for 24h in air
Tarancón [6] Calcination at 900 ºC and 1000 ºC for 20h
C. Frontera [3] Firstly sintered as pellet at 1125 ºC for 24h, followed by repeated regrinding–compression–annealing–regrinding cycles
M.B Choi [14] Precursors ball milled and calcined at 1000 ºC for 24h in air
D.S. Tsvetkov [15] Step calcination from 800ºC to 1100ºC, 10h for every 100ºC step with mixture regrinding
Table 2.1 Diverse SSR thermal treatments for pure GdBaCo2O5+δ
Both Ni and Fe substituted GdBaCo2O5+δ polycrystalline samples have been synthesized by solid
state reaction method recently, reaching the solubility limit for Ni substitution at x = 0.4 i.e.
GdBaCo1.6Ni0.4O5+δ [8] and for Fe substitution at x = 0.2 i.e. GdBaCo1.8Fe0.2O5-δ [7].
2.2.2 Gel Combustion Process
Apart from classical SSR route, wet chemistry routes proved to be an interesting alternative due
to the possibility to mix the reagent species at the atomic scale in solution, and due to the high specific
surface area and high reactivity of resulting oxide powders. Co-precipitation, spray-drying, freeze-
drying, sol-gel and Pechini are the state-of-the-art methods in chemical ways for polycrystalline
ceramic powders synthesis.
The traditional sol-gel method of synthesis starts from molecular precursors (generally alkoxides
and/or organometallic compounds) and allows forming a solid network by hydrolysis-condensation
reactions, with the disadvantages of difficulty in controlling the experimental process, as well as high
cost of precursors. In 1967, Pechini [16] developed an alternative sol-gel approach, which mainly
employs the inorganic salts as precursors, citric acid as chelating ligand and polyethylene glycol (PEG)
as cross-linking agent. Tarancón et al. developed an improved polyacrylamide-gel combustion process
and also another polymethacrylamide-gel combustion process to synthesize ultrafine and highly
homogeneous powders for diverse electrolytes and cathodes as SOFC materials [17]. Such method was
improved by introducing low cost and less toxic agents [18,19], such as acrylic acid instead of
acrylamide. In this work, an acrylic acid polymerization method was used to fabricate original
GdBaCo2O5+δ, and Ni, Fe substituted GdBaCo2-xMxO5+δ (M = Ni or Fe, x = 0.1, 0.2 …).
Chapter 2 Synthesis, Processing and Physical-Chemical Characterisation
31
Figure 2.1 Synthesis process of the methylenebisacrylamide-gel combustion route
STREM), Ni(NO3)2·6H2O (99.9%-Ni, STREM) or Fe(NO3)3·9H2O (99%, STREM) were added in
stoichiometric ratio. An aqueous transparent solution was obtained by continuous stirring and heating,
and then moved into a domestic microwave oven, heated by the microwave irradiation with 600 W
during 20-30 minutes. The residual product was heated at 500 ºC for 1.5 h, followed by grinding and
finally thermal treated at 1050 ºC for 5 h in air. The experimental process is presented in Figure 2.2.
Compared to the gel combustion method, the productivity has been effectively improved trough
this citric acid combustion route. Due to a unique complexing agent and the rapid heating rate in
microwave, the dehydration of solution, swelling and combustion of viscous gel could be
accomplished in a short reaction time, without ignition or visible flame. The volume of residual
precursors of citric acid combustion after microwave step is much smaller than that of gel combustion
method, which significantly facilitates the following calcination steps by obtaining much larger
amount of synthesized powders, in spite of limitation on the size of available crucibles.
Chapter 2 Synthesis, Processing and Physical-Chemical Characterisation
33
Figure 2.2 Synthesis process of a microwave-assisted citric acid combustion method
2.3 Structural and Microstructural properties
2.3.1 XRD characterization of synthesized compositions
The as-synthesized powders were characterized by X-ray powder diffraction (XRD, Rigaku
D/max-2550/pc, Cu Kα radiation, λKα1 = 1.5405 Å). The data were collected over the angular range
from 20º to 60º with a step of 0.02º. Figure 2.3 shows the result of Ni and Fe doped GdBaCo2-
xMxO5+δ synthesized by the gel route, calcinated at 1050 ºC for 5h at ambient. Higher substitution
ratios of both Ni and Fe were achieved by this route, compared to the results of previous published
work [7,8,21], respectively.
De-ionized water
Metallic Nitrates
C6H8O7·H2O
Metal-citrate solution
Mixing, stirring, heating
Microwave irridiation
Residue of combustion
Persursors
Powders
Low temperature
Calcination Grinding
1050°C/5h
Chapter 2 Synthesis, Processing and Physical-Chemical Characterisation
34
Figure 2.3 XRD pattern of (a) GdBaCo2-xNixO5+δ, x = 0~0.8 indexed to orthorhombic structure with Pmmm symmetry and (b) GdBaCo2-xFexO5+δ, x = 0~1, showing a phase transition from orthorhombic Pmmm symmetry to tetragonal P4/mmm symmetry with
increasing Fe content
For the Ni substituted compounds, pure phase could be guaranteed up to the doping proportion x
= 0.8. As x ≤ 0.8, the compounds seem to maintain a structure similar to that of the GBCO
(a)
(b)
Chapter 2 Synthesis, Processing and Physical-Chemical Characterisation
35
composition. For higher x values, extra phases have been observed (some several binary and ternary
oxides).
With the increase of Ni substitution ratios, shifts of peak position and peak splittings appear on
the XRD pattern. For instance, for the three peaks which represent the reflections of (040) (200) (004),
respectively, shown in Figure2.4 (a). The (040) peak shifts to lower angular position while the (020)
peak does in the opposite; meanwhile, other single peaks such as (122) and (004) show a tendency
towards lower angular position. This phenomenon shows that the Ni substitution for Co could enhance
the orthorhombic distortion in consistency with the systematic increase in “orthorhombicity” with Ni
substitution in GBCO observed by Bharathi et al. [7,8].
For the Fe substitution compounds, pure phase could be obtained until the Fe fraction x = 1, by
the same chemical route. XRD patterns (Figure2.4 (b)) exhibit the approaching and even
convergence of peaks as a consequence of the increase of Fe substitution ratio. From x > 0.4,
GdBaCo2-xFexO5+δ shows a phase transition from the original orthorhombic structure to a tetragonal
structure indexed in the P4/mmm space group. Apparently, Fe substitutions oppositely diminish the
orthorhombic distortion and further give rise to the phase transition. This could be considered as
consequence of oxygen content decrease due to Fe doping, as discussed in Chapter 2.4.
Figure 2.4 Peak splitting in GdBaCo2-xNixO5+δ and convergence of peaks in GdBaCo2-
xFexO5+δ with increase of Ni and Fe substitution, respectively
GdBaCo2-xNixO5+δ GdBaCo2-xFexO5+δ
Chapter 2 Synthesis, Processing and Physical-Chemical Characterisation
36
2.3.2 Powder morphology
Figure 2.5 SEM images of GBCO as-synthesized powders by gel combustion route calcinated at 800°C (a)(b), 1050°C(c)(d) by citric acid combustion route calcianted at
1050°C(e)(f), respectively
Scanning electron microscopy (SEM) was used to investigate the morphology of as-synthesized
powders. Figure2.5 shows the images of GdBaCo2O5+δ powders obtained by gel combustion route
calcinated at 800°C for 4h, with general grain size in the nano scale (a) and tendency of aggregation of
single particles (b). the increase of grain size, especially the agglomeration has been observed for the
same compound with successive thermal treatment at 1050°C for 5h (c)(d), by which pure phase could
be guaranteed. At this stage, native particles agglomerate and form big grains of micron size. On the
200 nm 1 μm
200 nm
1 μm
(a)
(c) (d)
(e) (f)
1 μm
(b)
1 μm
Chapter 2 Synthesis, Processing and Physical-Chemical Characterisation
37
Figure 2.6 Room-temperature parameters of the GdBaCo2O5+δ unit cell as a
function of the oxygen content x (x = δ) [1].
other hand, GdBaCo2O5+δ powders obtained by citric acid combustion route at 1050°C exhibit
significant agglomerate particles composed by grains on micron scale (e)(f).
2.4 Oxygen nonstoichiometry
XRD investigation has already revealed the different influences of Ni and Fe substitution on the
GdBaCo2-xMxO5+δ (M = Ni, or Fe) structures at room temperature. Besides of Ni, the structural
transition with the increase of Fe substitution was considered to be related to the oxygen content
change caused by the replacement of Co by Fe. Thus, oxygen nonstoichiometry becomes essential for
a better understanding of the Ni and Fe substituted GdBaCo2-xMxO5+δ (M = Ni, or Fe), with respect to
the following analysis of crystal structural and high temperature transport properties.
2.4.1 Introduction
For transition metal oxides that are increasingly applied as functional materials, their desired
properties (e.g. electric and ionic conductivity, superconductivity, electrical and magnetic properties,
magnetoresistivity, and thermoelectricity) are highly dependent on the oxygen stoichiometry [20]. Great
attention has been drawn on the precise determination of oxygen content its consequent variation of
physical properties [22-25].
In two mostly studied classes of complex cobalt oxides (Ln, B)CoO3−δ and LnBCo2O5+δ (Ln-rare
earth, B-alkali earth elements) cobalt cations can adopt 2+, 3+ or 4+ oxidation state and therefore
different δ are observed. Generally, the oxygen content in cobaltites depends both on the chemical
Chapter 2 Synthesis, Processing and Physical-Chemical Characterisation
38
composition and on the synthesis procedure [24-32]. A previous work on LnBaCo2O5+δ synthesized in air
gives δ ≈ 0.7 for Ln = Pr and Nd, but lower δ-values for other lanthanide cations with smaller Ln3+
size (δ ≈ 0.4 for Sm, Eu, Gd, Tb and δ ≈ 0.3 for Dy and Ho) [13].
The oxygen content can be tuned by annealing in controlled atmosphere (inert gas/oxygen or pure
oxygen at high pressure) followed by quenching, or by gettering (with, e.g. metallic Zr, Y and Cu) in
sealed ampoules. As revealed by Taskin et al. [1], the structural properties of GdBaCo2O5+δ at room
termperature shows strong dependency on the oxygen nonstoichiometry (Figure 2.6).
i 0 ≤ δ < 0.45, the system keeps a macroscopically tetragonal structure P4/mmm, where the unit
cell smoothly expands in the c direction and shrinks in the in-plane directions with
increasing x.
ii 0.45 ≤ δ < 0.60, the oxygen ions order into alternating filled and empty chains running along
with the a axis, which results in the orthorhombic structure Pmmm and in the doubling of the
unit cell along the b axis.
iii δ > 0.60, the system evolves towards a tetragonal symmetry.
A similar case has been found by Kopecewicz et al. [33] for the Fe substituted TbBaCo2O5+δ,
which is highly analogous to GdBaCo2O5+δ in the structural properties [34]; by means of MössBauer
spectroscopy and TGA, they developed a modified chemical formula TbBa(Co2-xFex)O5.5-x/2,
describing that the increasing content leads to the reduction of Co3+ to Co2+ and to the decrease of
oxygen content. Oxygen content changes in Ni and Fe substituted GdBaCo2-xMxO5+δ (M = Ni, Fe) with
smaller substitution ratio were also studied [7,8], and these results will be compared with those obtained
from this work.
2.4.2 Experimental
The most accurate methods for establishing the precise oxygen content of transition metal oxides
are all based on redox reaction. In these methods, the high-valent cations of the studied sample are
reduced by a suitable reductant, e.g. I¯ , Fe2+, Cu+ or H2, followed by the determination of the exact
amount of reductant left over or the oxidized form of the reductant formed, or even the weight change
related to the reduction reaction, using appropriate analysis technique [22]. Iodometric titration and
thermogravimetric hydrogen reduction analysis etc. were applied in this recent works as oxygen
content determination methods. Nevertheless, the iodometry method is valid only for certain transition
metals, e.g. it is not applicable to Fe oxides. Thus, iodometric titration method was only applied for Ni
substituted compounds, and the thermogravimetric hydrogen reduction (TG/H2 reduction) method was
carried out on both Ni and Fe substituted compositions.
Chapter 2 Synthesis, Processing and Physical-Chemical Characterisation
39
All the GdBaCo2-xMxO5+δ (M = Ni, Fe) powder samples were obtained through those methods
mentioned previously in 2.2, and their phase purities have been checked by X-ray diffraction. An air-
annealing process was followed in order to eliminate possible nonuniformity of oxygen content during
the thermal treatment: All the powders were grinded in an agate mortar, and then a three-hour
isothermal heating period was applied at 900 ºC after which the samples were slowly cooled down to
room temperature at the rate of 100 ºC/h in air.
Iodometry
The well grinded powder samples (c.a. 50 mg) of GdBaCo2-xNixO5+δ was dissolved in 1 M HCl
solution (100 ml) containing potassium iodide, in an Erlenmeyer flask isolated from air by using a
nitrogen flow. Then the reduction of tri- and tetra-valent cobalt and nickel species of the sample takes
place, forming a stoichiometric amount of iodine in the solution:
23+ - + -32Co + 3I 2Co + I→ (2.2)
4 2+ - + -3Co + 3I Co + I→ (2.3)
3 22 + - + -3Ni + 3I 2Ni + I→ (2.4)
4 2+ - + -3Ni + 3I Ni + I→ (2.5)
The amount of the liberated iodine is determined by titration with 0.01 mol/L Na2S2O3 solution:
2 23 2 3 4 62 3I S O I S O− − − −+ → + (2.6)
The end point of the titration was detected by using starch as indicator, visually as the blue colour of
the starch complex disappeared and the solution turned to light pink due the formation of Co2+ which
was predominant compared to Ni2+. The whole process was accomplished in the Erlenmeyer flask
under protection of inert atmosphere by the N2 flow.
Thermogravimetric reduction (TG/H2 reduction)
In the TG/H2 reduction method, the sample was heated in a reduction atmosphere (usually H2),
and from the weight loss (products of the reduction were supposed to be known) in situ at the
temperature corresponding to the complete reduction, the oxygen content in the original sample could
be calculated. K. Conder et al. provided the following equation cobaltites, as the cobalt is reduced to
the metallic state [23].
2 5.5 2 2 3 2(2.5 ) 0.5 2 (2.5 )LnBaCo O H Ln O BaO Co H Oδ δ δ+ + + → + + + + (2.7)
Chapter 2 Synthesis, Processing and Physical-Chemical Characterisation
40
In this work, TG/H2 reduction of five chosen compounds are majorly studied: GdBaCo2O5+δ,
GdBaCo1.7Ni0.3O5+δ, GdBaCo1.4Ni0.6O5+δ, GdBaCo1.7Fe0.3O5+δ and GdBaCo1.4Fe0.6O5+δ, abbreviated to
GBCO, GBN03, GBCN06, GBCF03 and GBCF06, respectively. The measurements have been
performed by G. Boemare using a SETARAM 92-1750 device with a thermobalance of high
sensitivity. The powder samples (c.a. 100 mg) were heated up to 950 ºC at a rate of 2 ºC/min in a
mixed 5% H2 – 95% Ar gas flow (5 L/h), followed by an isothermal period of 5h. All the
measurements have been carried out with correction of blank experiments, by performing with empty
crucibles at the same condition, in order to eliminate the interference of Archimedes force for
calculation. The overall reaction equations deduced from Eq. 2.7 are listed below:
2 5.5 2 2 3 2(2.5 ) 0.5 2 (2.5 )GdBaCo O H Gd O BaO Co H Oδ δ δ+ + + → + + + + (2.8)
( )2 5.5 2 2 3 2(2.5 ) 0.5 2 (2.5 )x xGdBaCo Ni O H Gd O BaO x Co xNi H Oδ δ δ− + + + → + + − + + + (2.9)
( )2 5.5 2 2 3 2(2.5 ) 0.5 2 (2.5 )x xGdBaCo Fe O H Gd O BaO x Co xFe H Oδ δ δ− + + + → + + − + + + (2.10)
2.4.3 Results and discussion
The oxygen content determined by iodometric titration method in this work is listed in Table 2.2.
Total oxygen content
GdBaCo2-xNixO5+δ GdBaCo2O5+δ
Ni content x This work A. Bharathi et al. [8] K. Conder et al. [23]
0 5.51(4) 5.54 ± 0.01
0.1 5.53(2) 5.53 ± 0.01 Iodometry 5.438 ± 0.002
0.2 5.55(2) 5.54 ± 0.01 Gas volumetry 5.505 ± 0.005
0.3 5.50(2) 5.50 ± 0.01 TG/H 5.42 ± 0.02
0.4 5.53(3) 5.54 ± 0.03
0.5 5.50(2)
0.6 5.50(1)
0.7 5.48(2)
0.8 5.34(2)
Table 2.2 Oxygen contents of GdBaCo2-xNixO5+δ obtained by iodometric titration in this work and from literature [8], as well as results of GdBaCo2O5+δ obtained with different
methods [23]
Chapter 2 Synthesis, Processing and Physical-Chemical Characterisation
41
The δ value of each composition was obtained from the average of several parallel experiments.
It is evident that the total oxygen content remains roughly constant with the increase of Ni substitution
and the value is very close to 5.5 when x ≤ 0.6, suggesting that average valence of both Co and Ni in
those compositions is close to 3+, which is in good agreement with the result of Bharathi et al. [8] in
GdBaCo2-xNixO5+δ as well as the oxygen content of GdBaCo2O5+δ obtained from Conder et al. [23] who
have compared the different methods for oxygen content determination and the corresponding
discrepancy is also shown in Table 2.2. On the other hand, for x = 0.7 and x = 0.8, the decrease of
oxygen content was more important. XRD analysis has shown that both of these two compositions still
maintain the orthorhombic symmetry with Pmmm space group. Moreover, for the particular case of x
= 0.8, the situation is different from that of GdBaCo2O5+δ, for which the orthorhombic structure
corresponds to a strict oxygen content range 0.45 ≤ δ < 0.60.
Figure 2.7 TG curve of H2 reduction for GBCO, GBCN03, GBCN06, GBCF03, and GBCF06. Black line and red line represent the mass loss in percentage and temperature,
respectively.
Chapter 2 Synthesis, Processing and Physical-Chemical Characterisation
42
The reduction process by a reducing gas proceeds stepwise reactions [25], including desorption of
surface water, decomposition of complex oxides and progressive reduction to metals, represented as
weight losses at different reduction stages in the TG curve. In this work, the oxygen content analysis
based on the overall weight loss is related to a “final plateau” of the TG weight loss (in percentage)
curve, which was considered as the accomplishment of reduction process, referring to a residual pure
oxide mixture and metallic cobalt and Ni or Fe. As shown in Figure 2.7, the approximate starting
temperature of the plateau is different for each composition. The weight plateau can be obtained at
nearly 800 ºC for GBCO, which is in good agreement with the previous work of Conder et a.l [23], and
at about 700 ºC for Ni substituted GBCN03 and GBCN06. On the other hand, for the Fe substituted
GBCF03 and GBCF06, the weight “plateau” could only be obtained at 950 ºC, which is the highest in
this work, after a period of isothermal process. This could probably be due to the difficulty of
reduction of Fe oxides to metallic Fe.
Comparison of oxygen content determined by Iodometry method and TG/H2 method in this work,
as well as the results from other work, is shown in Table 2.3. Oxygen content values determined by
TG/H2 are slightly higher than those obtained by Iodometry for pure GBCO and Ni substituted
GBCN03, GBCN06. Generally speaking, these two methods seem in good accordance with each other.
Remarkable decrease of oxygen content values with increase of Fe substitution is shown by TG/H2.
Considering the results of X-ray diffraction characterization for powder samples, the oxygen
nonstoichiometry due to Fe substitution could be a major cause for the phase transition from
orthorhombic to tetragonal with increase of Fe substitution in air-synthesized compounds.
Total oxygen content Compounds
TG / H2 Iodometry A. Bharathi et al [8] by Iodometry
GBCO 5.520 5.514 5.54 ± 0.01
GBCN03 5.512 5.502 5.50 ± 0.01
GBCN06 5.522 5.500
GBCF03 5.356
GBCF06 5.063
Table 2.3 Oxygen content in GdBaCo2-xMxO5+δ (M=Ni, Fe).obtained by different analytical methods used in this work
Chapter 2 Synthesis, Processing and Physical-Chemical Characterisation
43
An oxygen content range 0.45 ≤ δ < 0.6 referred to orthorhombic structure indexed in Pmmm
symmetry was mentioned for single crystal GdBaCo2O5+δ sample by Taskin et al.[1]. In this work,
nevertheless, both GdBaCo1.2Ni0.8O5.338 and GdBaCo1.7Fe0.3O5.356 with oxygen content δ < 0.45,
determined by Iodometry and TG/H2, respectively, still sustain the orthorhombic Pmmm structure, as
shown by X-ray diffraction.
2.5 Structural analysis
2.5.1 GdBaCo2O5+δ
More recently, Maignan et al. [13] have studied the layered cobaltites LnBaCo2O5+δ (0≤δ<1, Ln =
Pr, Nd, Sm, Eu, Gd, Tb, Dy, and Ho), with various oxygen stoichiometries. According to this study,
the oxygen-deficient perovskites LnBaCo2O5+δ system showed a variation of oxygen content and of
structure with the size of the lanthanide, which suggested a possible ordering between oxygen and
vacancy in the lanthanide layer. Moreover, different superstructures depending on the sintering
atmosphere were reported. Figure 2.8 depicts the double layered oxygen-deficient structure of
GdBaCo2O5+δ with orthorhombic Pmmm symmetry. In this structure, the Ba cations do not form a
random distribution in the A perovskite sites but order in alternating (0 0 1) layers, following a
stacking sequence along c-axis: – [BaO] – [CoO2] – [GdOδ] – [CoO2] – [BaO] –, characteristic of the
112 structure. Co ions are coordinated in square-pyramids (CoO5) and octahedral (CoO6), referred to
intermediate spin state (IS) and low spin state (LS), respectively, with oxygen vacancies along (1 0 0)
in the Gd plane.
Figure 2.8 Polyhedral view of the orthorhombic perovskite structure of GdBaCo2O5+δ indexed to Pmmm symmetry [35]
[BaO]
[BaO]
[CoO2]
[CoO2]
[GdOδ] x y
z
Chapter 2 Synthesis, Processing and Physical-Chemical Characterisation
44
Taskin et al. [1] concluded that, for the case of GdBaCo2O5+δ, the presence of a particular
distribution of oxygen vacancies located mainly in the rare earth plane [GdOδ], observed for a certain
range of oxygen stoichiometry, could improves the oxygen transport properties compared to non-
ordered perovskites. And the following investigation [35] showed that this layered structure formed by
cation ordering exhibited a remarkable enhancement of the oxygen diffusivity as well as a possibility
to develop a class of materials suitable for applications requiring fast oxygen transport in the
intermediate temperature range. For the crystal structural of GdBaCo2O5+δ at ambient, strong
dependence on the oxygen stoichiometry has been proved as mentioned precisely in Chapter 2.4.
2.5.2 Structural analysis by Rietveld refinement
Apart from the original GdBaCo2O5+δ, X-ray powder diffraction of GdBaCo2-xMxO5+δ (M = Ni or
Fe, x = 0.1, 0.2 …) has revealed the influence of Ni and Fe substitution for Co on the structural level,
such as the enhancement of orthorhombic distortion with Ni and phase transition with Fe substitution.
In this work, in order to obtain more detailed structural information, Rietveld refinement has been
applied to analyze the XRD data.
Original structural information given by Frontera et al. [3] was used as starting model for the
refinement of orthorhombic structure in case of all Ni substitutions and low Fe substitutions. As shown
in Figure 2.9, the schematic crystal structure of GdBaCo2O5+δ, in which oxygen atoms are omitted
and are only connected by lines. In the Pmmm orthorhombic structure, two cobalt sites and six oxygen
sites are independent. The Co1 (0, 1/2, z) and Co2 (0, 0, z) sites correspond the octahedral and
pyramidal sites, respectively. Among the six oxygen sites, three [O1 (0, 0, 0), O2 (0, 1/2, 0) and O3 (0,
1/2, 1/2)] sites are fixed in the Pmmm symmetry. On the other hand, the O4 (1/2, 0, z) and O5 (1/2,
1/2, z) site connect the neighboring pyramids and octahedral, respectively, along the a-direction,
whilst the O6 site does the neighboring pyramid and octahedron along the b-direction. O3’ site
corresponds to where the oxygen vacancies are located at (0, 0, 1/2) along the Gd plane. For the highly
Fe substituted GdBaCo2-xFexO5+δ (x > 0.4) with tetragonal structure, starting information was referred
to the high temperature structure of PrBaCo2O5+δ given by Streule et al. [36] in P4/mmm space group,
according to which, the oxygen vacancies locate at the O2 (0, 0, 1/2) site being proved by refinement
of data from neutron diffraction. Detailed information of this model including atomic positions and
Wyckoff coefficients are listed in Table 2.4, based on which the refinement are carried out.
Chapter 2 Synthesis, Processing and Physical-Chemical Characterisation
45
Figure 2.9 Schematic model for crystal structure of orthorhombic GdBaCo2-xMxO5+δ (M = Ni or Fe) [34]
Orthorhombic (Pmmm) Tetragonal (P4/mmm)
atom Wyckoff X Y Z atom Wyckoff X Y Z
Ba 2o 0.5 y z Ba 1c 0.5 0.5 0
Gd 2p 0.5 y 0.5 Gd 1d 0.5 0.5 0.5
Co(Ni or Fe)1 2r 0 0.5 z Co(Ni or Fe) 2g 0 0 z
Co(Ni or Fe)2 2a 0 0 z O1 1a 0 0 0
O1 1a 0 0 0 O2 1b 0 0 0.5
O2 1e 0 0.5 0 O3 4i 0 0.5 z
O3 1g 0 0.5 0.5
O3’ 1c 0 0 0.5
O4 2s 0.5 0 z
O5 2t 0 0 z
O6 4u 0 y z
Table 2.4 Crystal structure models [36] for Rietveld refinement in this work
Chapter 2 Synthesis, Processing and Physical-Chemical Characterisation
Table 2.6 Structural parameters and reliability factors for the Rietveld refinement of GdBaCo2-xFexO5+δ
Kopcewicz et al. [33] have investigated the analogous TbBaCo2-xFexO5.5-δ using Mössbauer
spectroscopy, and found that the Fe3+ ions preferentially adopt a HS state at the pyramidal sites. In
addition, the radius of 0.645 Å for the HS state Fe3+ ions is larger than the radius of 0.56 Å for the IS
state Co3+ ions at the pyramidal sites [33], which are the ones replaced by the Fe3+ ions in the doping
process. This could explain the increase in the unit cell volume of GdBaCo2−xFexO5.5−δ with increasing
Fe substitution for Co. In addition, their study conclude that Fe ions adopt 3+ charge states in a wide
concentration range 0 < x < 1, which gives rise to the presence of Co2+, in contrast to the case of Ni
Chapter 2 Synthesis, Processing and Physical-Chemical Characterisation
52
substitution presenting Co4+ preferentially introduced by Ni2+; moreover, the Fe substitution leads to
the decrease of oxygen content, in agreement with what is observed in this work.
(a) Evolution of cell parameters and cubic cell volume with Fe substitution; by Rietveld
refinement in this work
(b) Dependence of the structural parameters on the Fe concentration
x in GdBaCo2−xFexO5.5−δ by Tang et al. [7]
Figure 2.14 Evolution of cell parameters with Fe substitution
Chapter 2 Synthesis, Processing and Physical-Chemical Characterisation
53
Figure 2.15 shows the polyhedral view of the GdBaCo1.4Fe0.6O5+δ with tetragonal structure
(P4/mmm) based on the information obtained from rietveld refinement, as can be seen in Table 2.6.
With the phase transition from orthorhombic to tetragonal, the ordered perovskite goes trough a
random two-dimensional distribution of oxygen vacancies in the Gd (100) layers. As the oxygen
vacancies increase, using the oxygen content x = 0.063 determined by TG/H2 method, the occupancy
of O2 (0, 0, 1/2) site get close to 0. It could be assumed that a redistribution of oxygen ions takes place
with Fe substitution: the oxygen O3’ occupancy increases at the expense of the O3 one (O3’ and O3 in
orthorhombic phase), until the two sites display equivalent occupancies, transforming to O2 site (in
tetragonal phase). This redistribution of oxygen leads to a disordered state in view of oxygen
vacancies, since the planes of CoO5 pyramids and CoO6 octahedra no longer alternate along the b
direction.
2.6 High temperature phase transition
Due to the importance of oxygen transport properties for electrode applications, it is essential to
investigate the effects of the high temperature phase transition (orthorhombic Pmmm to tetragonal
P4/mmm), which involves a rearrangement of oxygen vacancies going from low temperature one-
dimensional distribution to high temperature two-dimensional distribution, on the electrical and
electrochemical performance. Effect of phase transition on high-temperature electrical properties of
GdBaCo2O5+δ has been studied by Tarancón et al [38].
Figure 2.15 Polyhedral view of GdBaCo1.4Fe0.6O5+δ based on refinement result
Chapter 2 Synthesis, Processing and Physical-Chemical Characterisation
54
Considering the structural evolution, oxygen stoichiometry variation in as-synthesized GdBaCo2-
xMxO5+δ (M = Ni or Fe, x = 0.1, 0.2 …) compounds, it is of interest to explore the existence of the high
temperature phase transition and the possible influence by Fe and Ni substitution associated to this
particular feature.
2.6.1 Differential Scanning Calorimetry (DSC)
Differential Scanning Calorimetry (DSC) is a thermoanalytical technique in which the difference
of heat required to increase the temperature of a sample and a reference is measured as a function of
temperature. When the sample undergoes a physical transformation such as phase transitions, more (or
less) heat, depending on weather the process is exothermic or endothermic, will need to flow to it than
to the reference to maintain both at the same temperature.
In this work, DSC has been applied to determine the existence of high temperature phase
transition and the precise transition temperature (in case it exists). These measurements were carried
out using a SETARAM TG/DSC, Model 92-1750 instrument, in static air condition, as well as Ar
or O2 atmosphere in certain cases, following a heating/cooling rate of 10 ºC/min till 700 ºC.
Figure 2.16 Example of DSC curves for GdBaCo2O5+δ: Arrows indicate the heating and cooling cycles, right pattern is enlarged zone covering the phase transition
A typical DSC curve is shown in Figure 2.16, obtained for GBCO sample. The small peaks on
the DSC curve represent the appearance of phase transitions, corresponding to the structural change
from orthorhombic Pmmm space group to tetragonal P4/mmm space group at high temperature, taking
place at different temperatures in heating and cooling runs with a discrepancy of about 10 °C.
Chapter 2 Synthesis, Processing and Physical-Chemical Characterisation
55
The results of high temperature phase transition in GdBaCo2-xMxO5+δ (M=Ni or Fe, x = 0.1,
0.2 …) determined by DSC on the heating run in this work are shown in Figure 2.17. Both Ni and Fe
substitution induce a decrease of the HT phase transition. With Fe content x > 0.4, no phase transition
was observed on the DSC curve, which is in agreement with the fact that those compounds process a
tetragonal structure with P4/mmm symmetry at room temperature.
Figure 2.17 DSC results of GdBaCo2-xMxO5+δ (M=Ni or Fe, x = 0.1, 0.2 …), transition temperature determined from the T onset on the heating process
2.6.2 High-temperature X-ray diffraction
In this work, 5 major compounds were studied by High-temperature XRD: GdBaCo2O5+δ,
GdBaCo1.7Ni0.3O5+δ, GdBaCo1.4Ni0.6O5+δ, GdBaCo1.7Fe0.3O5+δ and GdBaCo1.4Fe0.6O5+δ, abbreviated as
ºC) were carried out in air condition, on a laboratory diffractometer using Cu Kα1 radiation. Profile
matching of the XRD pattern was preformed using Fullprof suite program using LeBail fitting. Atomic
parameters were not refined. In accordance with previous works of Tarancón et al. [38] and Streule et al. [37], similar high temperature phase transition phenomenon was observed For GBCO in this work, as
shown in Figure 2.18.
Chapter 2 Synthesis, Processing and Physical-Chemical Characterisation
56
Figure 2.18 Thermal evolution of GBCO by high temperature XRD: a) Low temperature transition; b) high temperature transition with space group change from
Pmmm to P4/mmm
(b)
(a)
Chapter 2 Synthesis, Processing and Physical-Chemical Characterisation
57
Figure 2.19 Temperature dependent structural evolution of GBCO extracted from XRD: (a) evolution of cell parameters (dashed lines indicate the low- and high –
temperature transition);(b) temperature dependence of unit cell volume and TEC from partially linear fitting of the volume curve
Low temperature XRD patterns (T < 490 °C) were indexed using the orthorhombic Pmmm space
group (unit cell ap×2ap×2ap, with ap as the lattice parameter of the cubic unit cell). While high
temperature phase is tetragonal with space group P4/mmm (unit cell ap×ap×ap). Figure 2.19 shows
the thermal evolution of the lattice parameters. This representation makes evident the presence of two
different structural transitions for GdBaCo2O5+δ. The low temperature (LT) structural transformation
takes place at ca. 80 °C and corresponds to a sudden shrink of a lattice parameter, while lengthening
of b and c. Figure 2.18 (a) clearly shows this anisotropic evolution with temperature of the unit
lattice parameters by following the peaks indexed (0 4 0), (2 0 0) and (0 0 4) marked by the gray
dashed rectangular frame .On the other hand, the high-temperature (HT) structural change takes place
at ca. 490 °C and corresponds to a proper phase transition from the orthorhombic Pmmm space group
(ap×2ap×2ap) to the tetragonal space group P4/mmm (ap×ap×ap). The vanish of peaks indexed (0 4 0)
and (2 0 0) in Pmmm symmetry and successive generation of a new peak indexed (0 0 4) in P4/mmm
symmetry at this transition temperature, which is in agreement with DSC result ca. 475 °C, is shown in
Figure 2.18 (b) suggesting the lower symmetry of the high-temperature phase. Figure 2.19 (a)
depicts the unit cell volume increases nearly linearly with the temperature although a phase transition
occurs. Therefore, the linear thermal expansion coefficient (αL) can be calculated (as derived from the
volumetric thermal expansion coefficient, i.e. αV ≡ 3αL. The obtained value of linear thermal expansion
coefficient (TEC) for GdBaCo2O5+δ at high temperature range is 20.6×10⁻⁶ K-1 in the range of
(a) (b)
Chapter 2 Synthesis, Processing and Physical-Chemical Characterisation
58
temperatures from 175 to 700 °C, in accordance with the TECs for cobaltites and published TEC for
GBCO [38-40]. Moreover, GBCN03, GBCN06 and GBCF03 compounds show a similar phase transition
from low temperature orthorhombic Pmmm structure to high temperature tetragonal P4/mmm
structure, with an evolution of transition temperature in accordance with results determined by DSC.
Thermal evolution of the cell parameters and unit cell volume obtained by LeBail refinement of high
temperature XRD data are shown in Figure 2.20.
In general, for Ni substituted GdBaCo2-xNixO5+δ (x = 0.1~0.8) and low-proportional Fe
substituted GdBaCo2-xFexO5+δ (x = 0.1 ~ 0.4) both possessing orthorhombic structure indexed to
Pmmm space group at ambient, two different transitions are expected over the investigated
temperature range. One is the metal-insulator (MI) transition at low temperature, as the sudden shrink
of lattice parameters mentioned above. This behavior has been reported previously by Frontera et al. [3]
in GBCO, as well as similar MI transition observed in other analogous materials such as TbBaCo2O5+δ [41,42], HoBaCo2O5+δ [43,44] and PrBaCo2O5+δ [37,45]. In these oxides, Co can have multiple spin states in a
given oxidation state Co3+: low spin state (LS, 6 02g gt e ), intermediate spin state (IS, 5 1
2g gt e ) and high spin
state (HS, 4 22g gt e ), as well the small energy difference between the different spin states enables spin
state transition [3]. In these investigated samples, it has been proposed that the Co3+ occupies the IS in
the pyramidal environment and the LS in the octahedral environment at low temperature, whilst at
high temperature the Co3+ in octahedral attains the IS state. The observed MI transition is devoted to a
first-order spin-state transition, from LS to HS of the Co3+ ions located at the octahedral site, and the
concomitant lattice distortion due to the larger ionic radius of the high-spin state cobalt ions, as the
observed shrink of lattice parameters. However, in the present work, this phenomenon was only
evident for pure GBCO according to the structural evolution extracted from the temperature dependent
XRD results, and almost invisible in Ni and Fe substituted compounds. Recent studies in Ni and Fe
substituted LnBaCo2O5+δ in s [7,8,33,46] revealed that Ni substitution could decrease the MI temperature
as a consequence of the local structure distortions introduced by Ni2+, while Fe substitution leads to
the opposite due to the reducing of LS Co3+ ions located at octahedral site resulting from the oxygen
vacancies introduced by Fe, as well as the larger thermal energy need to excite the Co3+ ions from LS
to HS state with Fe substitution [33].
Chapter 2 Synthesis, Processing and Physical-Chemical Characterisation
59
Figure 2.20 Thermal evolution of lattice parameters and unit cell volume (on the right for each) of GBCN03, GBCN06 and GBCF03 Dashed lines mark the position of the low
and high temperature structure transition.
Chapter 2 Synthesis, Processing and Physical-Chemical Characterisation
60
On the other hand, both Ni and Fe substitution seem to facilitate the occurrence of high-
temperature phase transition from orthorhombic Pmmm structure to tetragonal P4/mmm structure by
reducing the transition temperature, as certificated by both DSC and high-temperature XRD. The same
phase transition could also take place with variation of oxygen stoichiometry, according to the work of
Maignan et al. [13] and Taskin et al.[1]. Therefore, this phase transition can be achieved by either
controlling the temperature or the oxygen stoichiometry. The highly Fe substitued GdBaCo2-xFexO5+δ
(x > 0.4) with tetragonal P4/mmm structure was supposed to avoid this orthorhombic-to-tetragonal
phase transition at high temperature. Nevertheless, an intermediate temperature phase transition was
accidentally observed in GBCF06 compound by the high-temperature XRD.
Figure 2.21 High-temperature XRD pattern of GdBaCo1.4Fe0.6O5+δ with a tetragonal-orthorhombic-tetragonal phase transition; orthorhombic phase exists in the temperature
range 140~280 ºC
Chapter 2 Synthesis, Processing and Physical-Chemical Characterisation
61
Figure 2.21 shows the high-temperature XRD patterns obtained in air condition from ambient
temperature to 700 ºC. Former structural analysis has proved the tetragonal structure with P4/mmm
space group of air-synthesized GdBaCo1.4Fe0.6O5+δ. However, it is evident that with the increase of
temperature, the GdBaCo1.4Fe0.6O5+δ compound undergoes a two step phase transition: tetragonal
(P4/mmm, ap×ap×2ap)-orthorhombic (Pmmm, ap×2ap×2ap)-tetragonal (P4/mmm, ap×ap×2ap). The
diagram in Figure 2.21 (bottom) revealed the temperature range of existence of orthorhombic phase.
First phase transition from tetragonal to orthorhombic is shown at ca. 140 ºC, whilst the second one
from orthorhombic to tetragonal takes place at ca. 280 ºC. The presence of orthorhombic structure is
limited in an intermediate temperature range between 100 ºC and 300 ºC.
Thermal evolution of the lattice parameters for GdBaCo1.4Fe0.6O5+δ obtained by LeBail
refinement is shown in Figure 2.22. Uneventful increase of c lattice parameter is observed as a
function of temperature, as well as a (= b) lattice parameter in tetragonal structure at low and high
temperature. From ca. 140 ºC, after the orthorhombic to tetragonal phase transition, the difference
between the values of a and b lattice parameters starts to increase. This could possibly indicate the
oxygen rearrangement enhancing the orthorhombic distortion. After ca. 200 ºC, the b parameter starts
to decrease as well the increase of a parameter, which exhibits the trend of phase transition towards
the tetragonal P4/mmm structure involving a two-dimensional redistribution of oxygen vacancies in (0
0 1) layer, until the accomplishment of orthorhombic to tetragonal phase transition above 300 ºC.
Figure 2.22 Thermal evolution of lattice parameters for GdBaCo1.4Fe0.6O5+δ, dashed line mark the position of phase transition. Linear TEC coefficient is obtained by linear
fitting of unit cell volume curve
Chapter 2 Synthesis, Processing and Physical-Chemical Characterisation
62
Some nonlinear dilatations of unit cell volume in the v-T line present in the orthorhombic
temperature range. Considering the low oxygen stoichiometry of GdBaCo1.4Fe0.6O5+δ determined by
TG/H2 in this work, which gives rise to the tetragonal P4/mmm structure at ambient, an assumption of
oxygen uptake process upon heating could be supposed, even this is contradictory to the common
sense that the oxygen deficient perovskites release oxygen on heating process and the oxygen loss is
recovered when cooling in air condition. To certify the possibility of oxygen uptake with heating
process for GdBaCo1.4Fe0.6O5+δ, thermogravimetric measurement was carried out under air as a
function of temperature for air-annealed sample, as well as other two compounds GBCO and GBCF03
for comparison. In this condition, mass variation as a function of temperature is devoted to the
incorporation or desorption of oxygen into/from the materials, as shown in Figure 2.22.
Figure 2.23 Thermogravimetric patterns of GBCO, GBCF03 and GBCF06 measured in air condition, arrows indicate the phase transition
Compared to the GBCO and GBCF03 which show almost constant weight below ca. 250 °C,
GBCF06 exhibits an increase of mass until ca. 300 °C, which corresponds to the temperature of
orthorhombic-tetragonal transition observed in XRD, in consistency with the assumption of oxygen
uptake on heating process. The reproducibility of mass change on heating and cooling with small
difference of inflection temperature is in accordance with the high-temperature TG data of
GdBaCo2O5+δ given by Tarancón exhibiting an approximately pure mass loss during the heating
process. It could be concluded that the oxygen nonstoichiometry induced by high level of Fe
substitution is the major cause of this tetragonal-orthorhombic-tetragonal phase transition which can
not exist in case of GBCO, GBCN and low Fe substituted GBCF.
A similar case in TbBaCo2-xFexO5+δ (0 < x < 1) system with a coexistence of orthorhombic and
tetragonal phases in the concentration range (0.1 < x < 0.12) has been investigated by Kopcewicz et al.
Chapter 2 Synthesis, Processing and Physical-Chemical Characterisation
63
[33] using the Mössbauer spectroscopy. The Mössbauer data indicate three different positions of Fe ions
in TbBaCo2-xFexO5+δ: one high symmetry position corresponds to the octahedral position (I); one low-
symmetry position corresponds to square pyramidal position (II) in the ideal 122-type crystal structure.
The second low-symmetry pyramidal position appears at octahedral position in this type of crystal
structure by removing one oxygen atom from the [TbO0.5] layer. At high temperature when the
diffusion processes of oxygen occur actively, the oxygen content in the sample is approximately 5 (δ ≈
0 ) and all B-site cations with statistical distribution of the Fe and Co ions are placed within square
pyramids with fivefold coordination. When the temperature decreases and absorption of the oxygen
occurs, those lattice positions within the [TbO0.5] layer that normally possess one oxygen at the vertex
of octahedral coordination of CoO6 in the ideal ordered 122-type crystal structure, will remain vacant
on condition that their corresponding coordinating Co are located in the neighborhood of Fe ions.
Consequently, at the statistical distribution of the Fe ions at positions I and II, approximately half of
these ions drive out oxygen atoms from the [TbO0.5] layer in octahedral position. In this case the
chemical formula of the Fe-substituted compounds may be approximately expressed as 3+ 3+ 2+2-2x x x 5.5-x/2TbBaCo Fe Co O . Assuming the same mechanism is suitable to GdBaCo2-xFexO5+δ, thus
influence of the Fe substitution on the high temperature phase transition could also be considered as
the consequence of extra oxygen vacancies introduced by Fe ions at the low symmetry octahedral
positions which give rise to the oxygen vacant to the neighbouring site in [GdOδ] player. However, the
proposed new formula of Fe substituted 3+ 3+ 2+2-2x x x 5.5-x/2TbBaCo Fe Co O does not correspond perfectly to
the GdBaCo2-xFexO5+δ investigated in this work. For example, in the case x = 0.6, the chemical
formula is GdBaCo1.4Fe0.6O5.063 with oxygen content determined by TG/H2, much lower than that
should be obtained based on the proposed formula by replacing Tb with Gd: GdBaCo1.4Fe0.6O5.2. Thus,
the reliability of this formula or its suitability to analogous compounds with different A site cations
except Tb is still doubtful and needs to be further discussed.
The linear thermal expansion coefficient (TEC) obtained from the XRD refinement data are listed
below in Table 2.7. The Ni substitution gives rise to a slightly decrease of αL , this trend is in
agreement with the results from Bo Wei et al. [21] determined by dilatometry, whereas much larger
decrease are shown in their work. Take the composition with the Ni substitution x = 0.3 for instance,
they obtained the TEC = 15.5×10⁻⁶ K-1 compared to that of 19.8×10⁻⁶ K-1 in this work. On the contrary,
Fe substitution shows an opposite influence leading to an increase of TEC.
Table 2.7 Linear TEC obtained from high-temperature XRD
Chapter 2 Synthesis, Processing and Physical-Chemical Characterisation
64
2.7 Conclusion
This chapter mainly concerns the fabrication and physical-chemical characterization of GdBaCo2-
xMxO5+δ (M = Ni or Fe, x = 0.1, 0.2 …).
Comparing various synthesis method, highly substituted compounds with solubility until x = 0.8
for both Ni and Fe substitution are obtained by gel combustion process and microwave-assisted
combustion route. Finally, five composition were selected for further investigation with x = 0, 0.3, 0.6,
as GBCO, GBCN03, GBCN06, GBCF03 and GBCF06 for short.
Detailed crystal structural information was obtained by Rietveld refinement on the X-ray powder
diffraction data. For the air-synthesized materials at ambient, increasing Fe substitution leads to an
orthorhombic (Pmmm, ap×2ap×2ap) to tetragonal (P4/mmm, ap×ap×2ap) phase transition when x >0.4,
whilst Ni substitution seemed to sustain the orthorhombic structure and enhance the orthorhombic
distortion. Oxygen contents were determined by iodometry and thermogravimetric for air-annealed
samples, showing Fe substitution decreased the oxygen content and this is supposed to be responsible
for the observed phase transition. As well, their structures at elevated temperatures corresponding to
the SOFC operating condition were investigated. DSC results showed that both Ni and Fe substitution
could reduce the temperature of the high temperature phase transition, except those GBCF compounds
exhibiting already tetragonal phase at room temperature. This indicates that oxygen random
distribution could be introduced at lower temperature by substitution of both Ni and Fe, which
suggests a larger amount of oxygen vacancy at high temperature, especially for high Fe substitution,
and the desired oxygen transport properties related to oxygen vacancy level could possibly be
achieved at lower temperature.
A particular case was found in GBCF06, for which no phase transition was observed through
DSC, but temperature dependent XRD showed a tetragonal-orthorhombic-tetragonal in the
temperature range 100-300 °C.
In addition, the thermal expansion coefficients were calculated based on the evolution of
structural parameters as a function of temperature extracted from refinement of XRD data. Ni
substitution was shown to slightly decrease the TEC, while the Fe substitution showed the reverse.
However, the obtained TECs are still too large compared to those of currently used electrolytes such
as CGO which will be used in this work.
Chapter 2 Synthesis, Processing and Physical-Chemical Characterisation
65
REFERENCES
[1] Taskin, A. A.; Lavrov, A. N.; Ando, Y. Phys. Rev. B 2005, 71, 28.
[2] Taskin, A. A.; Lavrov, A. N.; Ando, Y. Physical Review Letters 2003, 90, 227201.
[3] Frontera, C.; García-Muñoz, J. L.; Llobet, A.; Aranda, M. A. G. Phys. Rev. B 2002, 65, 180405.
[4] Taskin, A. A.; Ando, Y. Journal of Magnetism and Magnetic Materials 2007, 310, 969-971.
[5] Tarancon, A.; Pena-Martinez, J.; Marrero-Lopez, D.; Morata, A.; Ruiz-Morales, J. C.; Nunez, P. Solid State Ion. 2008, 179, 2372-2378.
[6] Tarancon, A.; Skinner, S. J.; Chater, R. J.; Hernandez-Ramirez, F.; Kilner, J. A. Journal of Materials Chemistry 2007, 17, 3175-3181.
[7] Tang, Y. K.; Almasan, C. C. Phys. Rev. B 2008, 77, 5.
[8] Bharathi, A.; Yasodha, P.; Gayathri, N.; Satya, A. T.; Nagendran, R.; Thirumurugan, N.; Sundar, C. S.; Hariharan, Y. Phys. Rev. B 2008, 77, 8.
[9] Tarancon, A.; Morata, A.; Dezanneau, G.; Skinner, S. J.; Kilner, J. A.; Estrade, S.; Hernandez-Ramirez, F.; Peiro, F.; Morante, J. R. Journal of Power Sources 2007, 174, 255-263.
[10] Pena-Martinez, J.; Tarancon, A.; Marrero-Lopez, D.; Ruiz-Morales, J. C.; Nunez, P. Fuel Cells 2008, 8, 351-359.
[11] Ding, H.; Xue, X. International Journal of Hydrogen Energy 2010, In Press, Corrected Proof.
[13] Maignan, A.; Martin, C.; Pelloquin, D.; Nguyen, N.; Raveau, B. Journal of Solid State Chemistry 1999, 142, 247-260.
[14] Choi, M. B.; Jeon, S. Y.; Lee, J. S.; Hwang, H. J.; Song, S. J. Journal of Power Sources 2010, 195, 1059-1064.
[15] Tsvetkov, D. S.; Sereda, V. V.; Zuev, A. Y. Solid State Ion. 2010, 180, 1620-1625.
[16] Pechini, M.; Adams, N. US patatent 1967, NO. 3330697.
[17] Tarancon, A.; Dezanneau, G.; Arbiol, J.; Peiro, F.; Morante, J. R. In Conference on Scientific Advances in Fuel Cell Systems Amsterdam, Netherlands, 2002, p 256-264.
[18] Tarancón, A., University of Barcelona, 2007.
[19] Tarancón, A.; Dezanneau, G.; Arbiol, J.; Peiró, F.; Morante, J. R. Journal of Power Sources 2003, 118, 256-264.
[20] Gu, L.; Meng, G. Materials Research Bulletin 2007, 42, 1323-1331.
[21] Wei, B.; Lü, Z.; Jia, D.; Huang, X.; Zhang, Y.; Su, W. International Journal of Hydrogen Energy 2010, 35, 3775-3782.
[22] Karppinen, M.; Matvejeff, M.; Salomäki, K.; Yamauchi, H. Journal of Materials Chemistry 2002, 12, 1761-1764.
[23] Conder, K.; Pomjakushina, E.; Soldatov, A.; Mitberg, E. Materials Research Bulletin 2005, 40, 257-263.
[24] Chen, W. M.; Hong, W.; Geng, J. F.; Wu, X. S.; Ji, W.; Li, L. Y.; Qui, L.; Jin, X. Physica C: Superconductivity 1996, 270, 349-353.
[25] Liu, J.; Shen, J.; Gao, X.; Lin, L. Journal of Thermal Analysis and Calorimetry 1993, 40, 1245-1252.
[26] Boehm, E.; Bassat, J. M.; Dordor, P.; Mauvy, F.; Grenier, J. C.; Stevens, P. Solid State Ion. 2005, 176, 2717-2725.
[27] Burley, J. C.; Mitchell, J. F.; Short, S.; Miller, D.; Tang, Y. Journal of Solid State Chemistry 2003, 170, 339-350.
[28] Macklen, E. D. J. Appl. Phys. 1965, 36, 1022-1024.
Chapter 2 Synthesis, Processing and Physical-Chemical Characterisation
66
[29] Rautama, E.-L.; Karppinen, M. Journal of Solid State Chemistry 2010, 183, 1102-1107.
[30] Tarascon, J. M.; Barboux, P.; Miceli, P. F.; Greene, L. H.; Hull, G. W.; Eibschutz, M.; Sunshine, S. A. Phys. Rev. B 1988, 37, 7458.
[31] Tarascon, J. M.; McKinnon, W. R.; Greene, L. H.; Hull, G. W.; Vogel; E, M. Phys. Rev. B 1987, 36, 226.
[32] Tikhonovich, V. N.; Zharkovskaya, O. M.; Naumovich, E. N.; Bashmakov, I. A.; Kharton, V. V.; Vecher, A. A. Solid State Ion. 2003, 160, 259-270.
[33] Kopcewicz, M.; Khalyavin, D.; Troyanchuk, I.; Szymczak, H.; Szymczak, R.; Logvinovich, D.; Naumovich, E. J. Appl. Phys. 2003, 93, 479-486.
[34] Kusuya, H.; Machida, A.; Moritomo, Y.; Kato, K.; Nishibori, E.; Takata, M.; Sakata, M.; Nakamura, A. JOURNAL-PHYSICAL SOCIETY OF JAPAN 2001, 70, 3577-3580.
[35] Taskin, A. A.; Lavrov, A. N.; Ando, Y. Appl. Phys. Lett. 2005, 86, 3.
[36] Streule, S.; Podlesnyak, A.; Sheptyakov, D.; Pomjakushina, E.; Stingaciu, M.; Conder, K.; Medarde, M.; Patrakeev, M. V.; Leonidov, I. A.; Kozhevnikov, V. L.; Mesot, J. Phys. Rev. B 2006, 73, 5.
[37] Streule, S.; Podlesnyak, A.; Pomjakushina, E.; Conder, K.; Sheptyakov, D.; Medarde, M.; Mesot, J. In International Conference on Strongly Correlated Electron Systems (SECES 05); Elsevier Science Bv: Vienna, AUSTRIA, 2005, p 539-540.
[38] Tarancon, A.; Marrero-Lopez, D.; Pena-Martinez, J.; Ruiz-Morales, J. C.; Nunez, P. Solid State Ion. 2008, 179, 611-618.
[39] Tsipis, E. V.; Kharton, V. V. J. Solid State Electrochem. 2008, 12, 1039-1060.
[40] Li, N.; Lu, Z.; Wei, B. O.; Huang, X. Q.; Chen, K. F.; Zhang, Y. Z.; Su, W. H. Journal of Alloys and Compounds 2008, 454, 274-279.
[41] Moritomo, Y.; Akimoto, T.; Takeo, M.; Machida, A.; Nishibori, E.; Takata, M.; Sakata, M.; Ohoyama, K.; Nakamura, A. Phys. Rev. B 2000, 61, R13325.
[42] Troyanchuk, I.; Chobot, A.; Khalyavin, D.; Szymczak, R.; Szymczak, H. Journal of Experimental and Theoretical Physics 2002, 95, 748-752.
[43] Fauth, F.; Suard, E.; Caignaert, V.; Domengès, B.; Mirebeau, I.; Keller, L. Eur. Phys. J. B 2001, 21, 163-174.
[44] Malavasi, L.; Brunelli, M.; Diaz-Fernandez, Y.; Pahari, B.; Mustarelli, P. Phys. Rev. B 2009, 80, 153102.
[45] Frontera, C.; García-Muñoz, J. L.; Carrillo, A. E.; Ritter, C.; Martín y Marero, D.; Caneiro, A. Phys. Rev. B 2004, 70, 184428.
[46] Raveau, B.; Simon, C.; Caignaert, V.; Pralong, V.; Lefevre, F. Journal of Physics: Condensed Matter 2006, 18, 10237.
Chapter 3 Electrochemical characterization
67
Chapter 3 Electrochemical Characterization
In SOFCs, the electrode provides the interface between chemical and electric energy and
catalyzes the chemical reactions. Typically, an electrode is a complex structure that consists of a three-
phase percolating composite of a metal or mixed conducting oxide, and oxide electrolyte and the pore
space [1]. The transport and reactions in such porous structure are also complex. Thus the
understanding of how the individual components determine the relative rate, the contributions from the
various processes and thereby the overall electrode performance has been widely studied in order to
guide the evaluation and optimization of the electrode properties. Moreover, it has been well accepted
that in intermediate temperature SOFCs, oxygen reduction at the cathode is the main rate limiting
factor to the performance of the whole system since the oxygen reduction is generally thought to be
the more difficult reaction to activate on SOFCs operating in the intermediate to low temperature
range [2-4]. Modeling and simulation techniques have been used to improve the understanding of the
reaction mechanisms and kinetics of electrode processes in SOFCs. Electrochemical impedance
spectroscopy (EIS), also known as AC impedance spectroscopy, is used for this purpose, as it seems to
be an efficient experimental technique for fuel cell diagnosis and performance evaluation.
Electrochemical Impedance Spectroscopy (EIS) is a powerful diagnostic tool to characterize
limitations and to improve the performance of fuel cells [5]. There are three fundamental sources of
voltage loss in fuel cells: charge transfer activation or “kinetic” losses, ion and electron transport
or “ohmic” losses, and concentration or “mass transfer” losses. Among other factors, EIS is an
experimental technique that can be used to separate and quantify these individual losses [6].
Figure 3.1 depicts an example of AC impedance spectroscopy applied on a single cell. The
impedance spectrum is taken by imposing a small amplitude AC voltage signal U(ω) on the tested cell
under zero DC current conditions, which probes the linear responses of the sample and thereby
resulting in a corresponding AC current response I(ω) with the same frequency f . The ratio between
these two is the impedance Z(ω).
Chapter 3 Electrochemical characterization
68
Figure 3.1 Principle of impedance spectroscopy
The quantity used for expressing models of impedance is the complex number, defined as:
( ) ( ) ( )Re ImZ Z j Z Z jZω ′ ′′= + = + (4.1)
where the real part of the impedance ReZ (Z′) comprises the resistive component (R), the imaginary
part ImZ (Z″), includes capacitive and inductive components.
In impedance spectroscopy, complex impedance is measured over a range of frequencies. This
enables to assign a number of discrete circuit elements to physical processes by using a certain model
of their electrical response. The representation of imaginary impedance (Z″) versus the real part (Z′) in
a complex plane is called Nyquist plot, and normally it consists of more or less overlapping arcs each
of which reflecting a physical or chemical process.
Figure 3.2 Idealized Nyquist impedance plot with contributions of I) grain bulk, II) grain boundary, and III) electrode and its equivalent circuit. R-resistance, τ–apex
frequency, C-capacitance
A typical Nyquist impedance plot and its corresponding equivalent circuit are shown in Figure
3.2. In an electrically inhomogeneous ceramic sample including different components (bulk, grain
boundary, electrode etc.), different semicircles correspond to the contribution of grain, grain boundary
and electrode, respectively. Each contribution could be represented by a single parallel RC circuit, for
U(ω) – imposed sinusoidal voltage
ω = 2πf – angular frequency (f: frequency)
t – time,
Ф – phase shift
Z(ω) – Impedance
R bulk
C bulk
R gb
C gb
R elec
C elec
Chapter 3 Electrochemical characterization
69
which R is the resistance and C is the capacitance. An equivalent circuit consisted of a series of such
individual RC sub-circuits represents the various processes in an ideal ceramic cell. The magnitude of
R will give the resistance of the specific process, and the magnitude of C will serve to identify the
process. The relaxation time for each process could be calculated from Eq. (4-2) using the apex
frequency.
( ) 110 02RC fτ ω π −−= = =
(4-2)
where ω is the angular frequency and f0 is the relaxation frequency (Hz) which corresponds to the top
of the semicircle.
However, instead of Nyquist plot comprising perfect semicircles, the experimental impedance
data for many systems give rise to circular arcs with their center lying below the axis (depressing of
semicircle into an arc). This is the so-called dispersing phenomenon. In this case, the double-layer
capacitance and pseudo-capacitance involved in electrochemical reactions can not be simulated as
pure capacitors, but as constant phase elements (CPE or Q). Admittance of impedance of CPE are
defined as:
( )0n
CPEY Y jω= (4-3)
( )0
1CPE nZ
Y jω= (4-4)
where Y0 is the admittance magnitude and n is the exponential term, if n = 1 the expression is the same
as for an ideal capacitor; if n = 0 it represents a pure resistor with Y0 being the conductance.
In practice, an electrode in SOFC is a contact between two different phases (typically, one is a
metal interconnector and the other an ionic conductor). Firstly, the interface comprises an interfacial
layer of a particular kind (whatever properties), which is called the double-layer, and such a layer may
comprise adsorbed species resulting in the double-layer capacitance. Next, the electrode or contact has
a charge transfer conductance/resistance which represents the path electrons or ions use to jump the
barrier, or, for electrode-electrolyte interfaces, the combined electrochemical process where both
chemical species and electrons are involved. The charge transfer resistance is in parallel with the
double-layer capacitance. Together they may thus form another semicircle in an impedance diagram,
typically at much lower frequencies than the grain boundary and bulk semicircles characteristic to
electrode performances. Several transport processes may take place in series with a charge transfer at
an electrode. This includes adsorption – desorption, diffusion in condensed phases and gases or on
materials surfaces, and reactions. This gives rise to a wealth of behaviors and corresponding electrical
“equivalents” in EIS application for electrode SOFC estimation [7].
Chapter 3 Electrochemical characterization
70
3.1.2 Oxygen reduction mechanisms and kinetics: Theoretical
To date, however, understanding of the mechanisms and kinetics of oxygen reduction under fuel
cell operating conditions remains incomplete because of the geometrical complexity of the
electrochemically active interfaces, and of the complex phenomena of adsorption and conversion of
molecular O2 into electrochemically active intermediate species. In addition to oxygen ad-atoms and
O2- anions, numerous forms of intermediates are often assumed to exist at electrode surface [8], as
shown in Figure 3.3 for mixed conducting electrode.
Figure 3.3 Examples of the cathode reaction pathway for a porous mixed conducting electrode with surface diffusion of oxygen ad-atoms (left) and O- sub-ions (right) [8]
The overall reaction for a p-type, oxygen-conducting SOFC cathode can be described as:
21 22 O OO V O h•• × •+ → + (4-5)
where, in the Kröger-Vink notation, OV •• denotes an oxygen vacancy in the solid state (either in the
electrolyte or in the MIEC) with two effective positive charges (with respect to the perfect crystal),
OO× denotes a neutral oxygen ion in a solid state oxygen site, and h• denotes a positively charged
electron hole.
However, the electrochemical reduction of oxygen is composed of various elementary steps
associated to different transport species and paths, including [9,10]:
adsorption of gaseous molecular oxygen reduction and dissociation of the adsorbed molecule in (probably) multiple steps
diffusion of adsorbates to various incorporation sites on the MIEC surface and at the TPB
transport of vacancies to the incorporation sites and transport of electron holes away from the reduction sites
the incorporation reaction (combination of adsorbed atomic oxygen and oxygen vacancies)
the diffusion of vacancies from the electrolyte into the MIEC
Chapter 3 Electrochemical characterization
71
Figure 3.4 [2] some mechanisms thought to govern oxygen reduction in SOFC MIEC cathodes. Phases α, β and γ refer to the electrode, gas, and electronic phase, respectively:
(a) Incorporation of oxygen into the electrode phase (if mixed conducting); (b) adsorption and/or partial reduction of oxygen on the electrode surface ; (c) bulk or (d) surface transport of O2-
or On-, respectively, to the α/β interface, (e) Electrochemical charge transfer of O2- or (f) combinations of On- and e-, respectively, across the α/γ interface, and (g) generation and transport
of electroactive oxygen species in electrolyte
Adler [2] also outlines some of the mechanisms either known or theorized in the literature to be
important in determining the rate of oxygen reduction in SOFC cathodes, these individual processes
are schematically demonstrated as shown in Figure 3.4. In order to understand and describe the
complex oxygen reduction process, for further improvement of cathode properties, an enormous
amount of works has been focused on how to develop a proper model to simulate the physical,
chemical and electrochemical processes in the reaction system, based on experimental data or
theoretical simulation, which have been summarized in some recent reviews [2,6,8,9,11,12].
Figure 3.5 Schematic of the ALS model for a porous mixed-conducting oxide electrode: cell geometry (left) Impedances of charge-transfer processes added in series.
Impedance due to non-charge-transfer processes is convoluted (right) [13]
For example, one attractive model for oxygen reduction with MIEC cathode with p-type
electronic transport was considered by Adler et al. [14], as shown in Figure 3.5. This so called Adler-
Lane-Steel (ALS) model allows to analyze the reaction mechanism in combination with the AC
Chapter 3 Electrochemical characterization
72
impedance for mixed-conducting electrodes [15]. In the ALS model, SOFCs cathode reaction was
firstly treated as pure chemical process occurring via three separated interfacial reactions: (1) charge-
transfer of oxygen ions/vacancies across the cathode/electrolyte interface; (2) charge-transfer of
electrons across the current-connector/cathode interface; (3) chemical exchange of oxygen at the
gas/cathode interface. Later, Adler explained the limits of this model for non-charge transfer reaction
and provided a framework for defining “charge-transfer” and “non-charge-transfer” processes [13]:
Charge-transfer represents any step that involves charged species and driven directly by gradients in
electrical state, which always occurs at a rate proportional to the current; non-charge-transfer is any
step that involves neutral species or neutral combinations of species and driven by gradients in
chemical potential and occurs at a rate independent of current. This model can only be valid for the
mixed conductors with high rates of oxygen surface exchange, e.g. La1-xSrxCoO3-δ. For example, in the
case of porous La0.6Sr0.4Fe0.8Co0.2O3-δ electrodes on CGO electrolyte [13,16], ALS model agrees
reasonably well with impedance data under conditions of high vacancy concentration.
The zero-bias impedance of a symmetrical cell (electrode/electrolyte/electrode) can be expressed
as a sum of charge transfer resistances and impedances, plus a chemical impedance associated with
non-charge-transfer process:
electrolyte interfaces chem= + +Z Z Z Z (4.6)
where Zelectrolyte is the electrolyte resistance, Zinterface is the impedance of the electron-transfer and ion-
transfer processes occurring at the current collector and electrolyte interfaces, respectively, and Zchem is
the convoluted contribution of non-charge-transfer processes including oxygen surface exchange, solid
–state diffusion, and gas-phase diffusion inside and outside the electrode. In the limit of a semi-infinite
(thick) electrode with no gas-phase diffusion limitations, the non-charge-transfer term reduces to:
chem chemchem
1Z = R1+ j tω
(4.7)
Where Rchem and tchem are a characteristic resistance and time constant, respectively, related to the
thermodynamic, surface kinetic, and transport properties of the mixed conductor:
kinetic parameters of the surface chemical exchange reaction [14]. This model also takes the distance
from the electrode/electrolyte interface into account, bringing out a concept of characteristic length, δ,
to describe the size of the active region, given by:
( )( )
V V
0 f b
1c Dar
εδ
α α τ−
=+
(4.11)
It has been concluded that in case of a porous mixed conducting peovskite electrode, the
characteristic active utilization region for oxygen reduction is limited by oxygen exchange and
diffusion, and may occur up to 20 μm from the electrochemical (charge-transfer) interface. Therefore,
as discussed above, in addition to high electronic conductivity, the cathode performance strongly
depend on the oxygen diffusion coefficient and surface exchange rate under different conditions. This
ALS model has been proved as an effective method in explaining several important features of
impedance data and electrode performance.
However, a number of papers expressed conflicting (or dissenting) views for the role of the bulk
and interface in governing the mechanism and the extent of the utilization region, due to the neglecting
of a parallel surface transport/reaction path, limitation of characteristic length being required to be
much greater than the size of individual morphological feature, etc [2,16-18].
Figure 3.6 Sketch of Svensson’s macrohomogeneous model for the i-V characteristics of a porous mixed-conducting electrode, assuming both surface and bulk
diffusion are active and that direct exchange of oxygen vacancies between the mixed conductor and the electrolyte may occur [19].
Svensson et al. [19,20] developed a physical model to show the possible oxygen transport pathways
on SOFC cathodes by modeling the current–overpotential (I–η) characteristics of porous mixed-
conducting electrodes, shown in Figure 3.6, where two step reactions for oxygen reduction are
expressed as:
Chapter 3 Electrochemical characterization
74
( ) adsk2 adskdes
O g +2ads 2O (4.12)
2r
O
kads O Ok
O V ads h O•• ×′+ + + (4.13)
This model takes a similar mechanistic approach as the ALS model, but additional physics has been
considered. The gas/electrode interfacial reaction was also considered chemical in nature since no
interfacial charge-transfer was involved, whilst the reaction at electrolyte interface was considered as
an electrochemical process due to the possible existence of chargeable intermediate oxygen species,
giving rise to the introduction of overpotential into their simulation expressing the departure of the
surface exchange reaction occurring at electrolyte surface from equilibrium. In addition, other models
including electrochemical process have been proposed including assumption of oxygen intermediates
and corresponding sub-reactions, based on theoretical simulation or experimental data [21-25].
Nevertheless, based on the present investigations, there is still no effective technique to determine
which intermediates actually exist in the reaction.
Besides, even these models have been built by studying a large number of materials and cases
over a long period of time, significant uncertainties still remain due to the extreme sensitivity of the
limiting factors to the exact structure, processing history, operating conditions and operation history
of the electrode [2].
3.1.3 Concerning for characterization by EIS: practical
Investigation of electrode performance, including the understanding and modelling of oxygen
reduction mechanism, is of great importance for optimizing the cathode performance and improving
the fuel cell efficiency, according to which sub-reactions can be extracted to describe the overall
reaction and to determine the rate-determining step under various conditions. The physicochemical
processes within a SOFC can be classified as either internal factors e.g. material, composition,
microstructures and component sizes, or external factors e.g. temperature, pressure, and fuel/air flows
and concentration [2]. Thus, to diagnose the mechanism of a particular electrode under a specific set of
conditions or to determine factors governing the rate of the various physical processes as well as their
relevant importance in the mechanism, both the internal and external factors should be taken into
account.
Concerning the EIS technique, the measured impedance Z(jω) is the average result of overlapped
responses from all microscopic processes. By combining the EIS with specific models and the
operating conditions, information describing the electrode properties such as reaction kinetics, reaction
activation, electrolyte conductivity and mass transfer can be extracted. One useful strategy is to model
Chapter 3 Electrochemical characterization
75
the individual processes in terms of equivalent circuit elements, in most cases as a sum of the
electrolyte impedance, interfacial impedance, and non-charge transfer impedance at high, medium, and
low frequency range, respectively, such as the ALS model. Moreover, this description is often
extended by introduction of additional empirically or theoretically derived circuit element according to
the corresponding assumption of oxygen reduction mechanism as discussed in 1.2.
In this work, the investigated GdBaCo2-xMxO5+δ (M = Ni or Fe) materials refer to the porous
mixed conducting cathodes, which is a complex case. Symmetric electrode configuration is applied in
order to help isolate the electrode contribution to the polarization losses from those of electrolyte from
the overlap or dispersion of impedance date. Another key factor is the determination of the rate-
determining step (RDS) among these electrode reaction processes, since the overall reaction could be
divided into several sub-reactions according to the reaction mechanism, e.g. Jørgensen and Mogensen [26] claimed that at least five processes affected electrochemical phenomena and impedance plot.
However, same as the diversity of oxygen reduction mechanism models proposed, there is no
universe agreement on RDS identification for all cathodes. Besides, quite different spectra could be
obtained for nominally identical electrodes under different condition. Thus experimental results should
be discussed in combination with the relative assumption of oxygen reduction mechanism in the RDS
interpretation, even with the ambiguity and uncertainty remaining. Moreover, different mechanistic
models for a given reaction often predict very similar impedance response after the governing equation
have been linearized [27]. For example, in some case of EIS application, an obtained impedance result
could be well fitted by different equivalent circuits, which will be discussed below in this chapter.
3.2 Experimental
3.2.1 GBCM electrodes based on ceria electrolyte
3.2.1.1 Symmetric cells
Sample preparation
In this work, five compositions were chosen as electrodes for the impedance measurements,
GdBaCo2O5+δ, GdBaCo1.7Ni0.3O5+δ, GdBaCo1.4Ni0.6O5+δ, GdBaCo1.7Fe0.3O5+δ and GdBaCo1.4Fe0.6O5+δ,
which are abbreviated as GBCO, GBCN03, GBCN06, GBCF03 and GBCF06, respectively. As seen in
the morphology characterization in Chapter 2, important agglomeration has been observed in the
powders synthesized in this work, especially for those fabricated through the citric acid combustion
Chapter 3 Electrochemical characterization
76
route. Thus, the as-synthesized powders were firstly ball milled with Zirconia balls in a laboratory
benchtop planetary ball mill (Retsch PM 100) at a rate of 250 rpm for 4h. Ball milling allowed
breaking the agglomerated big grains and obtaining good homogeneity in powder. Figure 3.7
compares the SEM patterns of GBCF06 powders fabricated through citric acid combustion route
before and after balling, showing smaller grain size and better homogeneity.
Figure 3.7 SEM of GBCF06 powders: as synthesized powders (left), ball milled powders with the rate of 250 rpm for 4h (middle and right)
Gadolinium-doped ceria, Ce0.9Gd0.1O1.95 (CGO), was used as electrolytes for the electrochemical
impedance measurement. A Commercial CGO nano-scale powder was firstly uniaxially pressed into
pellets of diameter of 13mm, followed by high pressure cold isostatic pressing at 750 MPa. The pellets
were then sintered at 1450 °C for 12 h, with a slow rate of 100 °C/h during the heating and cooling
cycles. After polishing the obtained CGO pellets were of ~10 mm diameter and of ~1mm thickness,
and high density (95-97% of theoretical density) were achieved (Figure 3.8 (a)). Electrodes were
deposited on CGO electrolytes by the Screen-printing in a collaborative laboratory (Institut des
Matériaux Jean Rouxel IMN), seeing Figure3.8 (b). It was expected to achieve identical electrode
structure and comparability in electrochemical properties compared to hand painting. In order to
obtain good contact, a viscous gold paste (METALORM, GOLD PASTE M-0034) was coated on
cathode surfaces serving as current collector, then heated at 800 °C for 1h at a slow heating and
cooling rate of 100 °C/h to obtain good adhesion between the gold layer and electrode, as shown in
Figure 3.8 (c).
The morphology and microstructure of some samples were observed in cross section by using
scanning electron microscopy (Hitachi S-4700 scanning electron microscope), in conjunction with
EDS utilized with a link system digital spectrometer PFT (Princeton Gamma Tech, PRISM) to verify
the absence of minor secondary phases.
1μm 1μm 5μm
Chapter 3 Electrochemical characterization
77
Figure 3.8 Scanning images of (a) CGO pellet, (b)symmetrical cells with screen-printing deposited electrodes; (c) symmetric cell with gold layer
Measurements
Fabricated symmetrical cells were mounted with two-electrode configuration on a commercial
sample-holder (Systems- Ionics). Electrochemical impedance measurements were performed at open
circuit voltage (OCV) using a Solartron 1260 frequency response analyzer, with applied amplitude of
50 mV and the frequency range from 0.01 Hz to 10 MHz. The temperature dependence measurements
were conducted in the temperature range of 300-750 °C in a 5L/h air flow. The oxygen partial pressure
(pO2) dependent measurements were obtained at 700 °C from 1 ppm (10-6 atm) to air (0.206 atm) with
a constant flow rate of 5L/h. The oxygen partial pressure was controlled by mass flow controllers
mixing O2 and Ar in proportion and by an electrochemical pump (Zirox electrolysis cell) at low pO2.
A stabilization period of more than 40 min was carried out before each acquisition. Zview 2
electrochemical impedance software (Scribner Associates Inc.) was used for data analysis.
3.2.1.2 Fuel cell tests
Single cell tests were performed with the collaboration of A. Kulka and Prof. J. Molenda (AGH
University of Science and Technology, Krakow, Poland) using the electrode powders fabricated in this
work.
Sample Preparation
Ce0.8Gd0.2O2 electrolyte powders were prepared by a coprecipitation method, then pressed into
pellets and sintered at 1500°C. The average thickness of the sintered electrolytes was close to 700 µm.
The cathode consists of two layers, a transient layer with a mixture of GBCO, GBCF03 and GBCF06
with Ce0.8Gd0.2O2 in 1:1 volume ration was deposited between the electrolyte and a pure GBCO,
GBCF03 and GBCF06 cathode layer. Ni-YSZ was used as anodes. The cells were sintered with
separate firings of the anode (at 1400 °C) and the cathode (at 1100 °C).
5mm 5mm
(a) (b) (c)
5mm
Chapter 3 Electrochemical characterization
78
Measurements
Button-type cell performance was studied using home-made SOFC testing unit equipped with
Solartron SI 1287 electrochemical interface and Solartron 1252A frequency response analyzer. The
anode was fuelled with humidified hydrogen (2.5 % H2O) at different flow rates of 10, 20 and 40
cm3/min, respectively, controlled by mass-flow controller. Air was provided at the cathode side with a
flow rate around 500 cm3/min. The impedance spectra and the current-voltage characteristics of the
Ni-YSZ/ Ce0.8Gd0.2O2/GBCM cells were measured in the range of 600~800 °C, with frequency range
of 0.1~300 kHz under 25 mV amplitude.
3.2.2 Electrodes in proton conducting fuel cells
These five materials, GBCO, GBCN03, GBCN06, GBCF03 and GBCF06, are also tested to
attempt their possibility for utilization in proton conducting fuel cells.
Sample preparation
Another series of high-temperature protonic–ionic conducting electrolyte pellets,
La0.995Ca0.005NbO4 (LaNbO4), were provided by the collaborative laboratory (Institut des Materiaux
Jean Rouxel, IMN), where the symmetrical cells GBCM/LNO/GBCM were prepared by screen-
printing, then sintered at 950 °C for 2h. The morphology and microstructure of samples after EIS tests
were also checked by SEM.
Measurements
The measurements of symmetrical cells based on the LaNbO4 electrolytes were carried out in dry
and wet atmosphere. In the first case, an air flow of 5L/h was flowed through a column of P2O5
desiccant, and humidification was obtained by bubbling gas through water and water partial pressure
was controlled by gas humidifier (OMISP280C- A, OMICRON Technologies). The impedance spectra
were obtained in the frequency range of 0.1 Hz to 10 MHz, where the AC potential amplitude was 50
mV. ZView2 electrochemical impedance software of Scribner Associates Inc. was used for data
analysis.
3.3 Results and Discussion
3.3.1 Symmetric cell
3.3.1.1 Morphology and Microstructure Characterization
Chapter 3 Electrochemical characterization
79
Figure 3.9 show the SEM images of the cross-section of symmetric cell with GBCO electrode
after the electrochemical measurement; focusing on the region in which the gold layer deposited on
the electrode was still attached after the breaking up of cells. Here, Au paste was used as current
collector in order to improve the measurement in addition to the utilization of Pt mesh, and it should
introduce not influence on the cathode performance since it is more neutral compared to Pt or Ag paste
used in other works [17,18,28]. Through the SEM images, clear morphological distinctions were observed
for the interfaces between Au/electrode/electrolyte layers. EDS-SEM analysis confirmed that there
was no insertion of Au paste into the electrodes or secondary phases at the electrode/electrolyte
interfaces.
Figure 3.9 SEM images of GBCO cathodes on CGO electrolyte with Au deposited using the gold paste: (a) peeled off (b) attached
Figure 3.10 shows the cross-sectional SEM images of the symmetrical cells with CGO
electrolytes with different electrodes deposited by screen-printing, with the sintering temperature of
950 °C for 2h. The quality and homogeneity of the CGO electrolytes are visible, whereas interfaces
between the electrolytes and electrodes are clearly seen. No obvious reaction between the electrolyte
and the electrode materials is observed in accordance with the investigation of chemical compatibility
between GBCO and CGO indicating no significant reactions below 1000 °C [29]. Approximately
identical microstructures could be seen whatever the composition. Nevertheless, the thickness of
electrode layers measured by SEM analysis is of only 10 μm, which seems insufficient and might limit
the cathode performance. Moreover, poor adhesion of electrode on the electrolyte surfaces is observed,
a few gaps due to partial delamination of the cathode layer have been observed for these cells. This
delamination is probably due to either the low roughness of the electrolyte layer, which would make
cathode attachment difficult, or the different thermal expansion coefficients between CGO (TEC~10×
10-6 K-1) and cobaltites (e.g., TEC~22×10-6
K-1 for LaCoO3-δ). This poor connectivity between
electrode and electrolyte phases could significantly influence the charge-transfer processes at the
electrode/electrolyte interface, which possibly gives rise to a high frequency arc in impedance spectra
50 μm CGO
GBCO
(a)
Au
10 μm
Au
GBCO
CGO
(b)
Chapter 3 Electrochemical characterization
80
indicating the onset of interfacial electrochemical kinetic resistance. This could also reduce the
apparent electrode-electrolyte contact surface. Besides, after the ball milling being applied to break the
agglomeration in as-synthesized powders, similar inhomogeneity and poor porosity of electrode are
observed in all cases with big size grains (>1 um ) compared to other works [28-30]. Thus, in spite of
good connectivity of grains in the electrode layer, the electrode performance could be strongly limited
due to the insufficiency of electrode/gas interfaces on electrode grain surface which is considered as
an importance electrochemical active zone for the oxygen surface exchange.
Figure 3.10 SEM images of the cross section of GBCM/CGO/CGO symmetrical cells by screen-printing after the impedance spectroscopy measurements: (a) GBCO electrode microstructure, (b) GBCO, (c) GBCN03, (d) GBCN06 (e), GBCF03 and (f)
GBCF06
1 μm
10 μm 10 μm
10 μm
10 μm
10 μm
(a)
(c) (d)
(b)
(f)(e)
(b)
5 μm
Chapter 3 Electrochemical characterization
81
3.3.1.2 Electrochemical performance with CGO electrolytes
The impedance spectra under OCV of the symmetrical cells with CGO electrolytes may exhibit
various contributions, due to the complexity of oxygen reduction mechanism as discussed above in
this chapter. These spectra were analysed by the software Zview using equivalent circuits to separate
the reaction processes, by which the cathode polarisation resistances (Rp) could be extracted. The term
ASR was used to describe all resistance terms associated with the electrodes or electrodes/electrolyte
interfaces, which is nominalised by the electrode surface area and corrected by a factor of 2 since as
symmetric configuration was employed.
2pR S
ASR×
= (4.14)
Figure 3.11 Impedance spectra of GBCO/CGO/GBCO symmetrical cell at different temperatures under air and OCV condition; modified corresponding equivalent circuits
depending on temperatures are applied to obtain cathode polarization resistance.
Figure 3.11 shows the Impedance spectra of a GBCO/CGO/GBCO symmetrical cell measured
at different temperatures under air and OCV condition, as well as the equivalent circuits applied and
modified according to the temperature range. In the equivalent circuit, L is an inductance caused by
the cable, the first resistance RS corresponds to the ohmic series resistance; R1 and R2, each of which is
(b)
(c)
fS
(a)
Chapter 3 Electrochemical characterization
82
in parallel with a constant phase element (CPE1 and CPE2) and represent the comparatively high
(actually in middle frequency range) and low frequency arc, respectively, are attributed to the
electrode contribution, as shown in Figure 3.11(a). At lower temperature, additional high frequency
arcs appear with decrease of temperature referring to the resistance associated to the CGO electrolyte,
Rb for the bulk and Rgb for the grain boundary Figure 3.11(b) and (c), in accordance with other
works [29]. This temperature dependence makes evident that the two depressed arc at the IT-
temperature range (500~750 °C) correspond to the electrode contribution and also confirm the validity
of the analysis with equivalent circuits to characterize the electrode performance of GBCO based
cathodes [28-34]. Compared to the impedance spectra obtained in this work at higher temperature range
(e.g >800 °C) which involves one major depressed arc in the impedance spectra, the two arcs are
distinguishable, which indicates that there are two or two kinds of oxygen reduction processes, e.g.
chemical, electrochemical or transport processes, involved in this intermediate temperature range. The
overall polarisation resistance is the sum of R1 and R2, as Rc = R1 + R2. This model is applied for the
analysis of the other cells with GBCN and GBCF electrodes, expect for the GBCN03 the low
frequency (R2CPE2) element is replaced by a short Warburg (Ws) in parallel with a constant phase
element to better fit the data, as shown in Figure 3.12.
Figure 3.12 Impedance spectra of symmetric cells with (a) GBCN03, (b) GBCN06, (c) GBCF03, and (d) GBCF06 electrodes, and their corresponding equivalent circuit.
(d) GBCF06 (d) GBCF03
(a) GBCN03: (b) GBCN06
Chapter 3 Electrochemical characterization
83
Figure 3.13 Conductivity of CGO electrolyte with different electrode materials measured by symmetric cells in air
The conductivity of CGO electrolytes shows good agreement whatever the electrodes used, as
shown in Figure3.13, as well as the calculated activation energy ca. 0.54~0.66 eV. The overall
polarisation resistances for these five electrodes at 700 °C are listed in Table 4.2. These values are
much higher than those published, with the characteristic value of 0.25 Ω cm2 at 650 °C for GBCO
cathode performance [30,31]. Taking into account the previous SEM results and the comparatively large
HFC arc in impedance spectra associated with the charge transfer processes, this augmentation of ASR
could be assumed mainly due to the poor connectivity between the electrode and electrolyte phases
which enhances the electrochemical interfacial kinetic resistance and diminishes the electrode-
electrolyte contact surface. In this case, the impedance is not only dominated by chemical dissociation
and transport steps but also the exchange of oxygen ions across the of GBCM/CGO interface thereby
increasing the ohmic resistance over the investigated temperature range, even if someone states that
the electrochemical incorporation at the interface is usually considered largely equilibrated at least
above 650 °C [2]. Besides, the microstructure defects of deposited electrodes by screen printing in this
work might also contribute to the large ASR values. Thus, the electrode performance might be
improved by ameliorating the preparation techniques: for example, polishing more roughly the CGO
surface, increasing the ball milling time to obtain smaller grain size, or multiplying the deposits by
screen printing to increase the electrode thickness. Another alternative strategy is the composite
electrode, which has been proved as a promising option to improve the GBCO cathode performance [35-38]. By comparing the polarisation resistance of different compositions in this work at the same
temperature, both Ni and Fe substitution are found to decrease the electrochemical performance,
which is in agreement with the result from Wei et al. [28] in Ni-doped GBCO, with the polarization
resistances of 0.40 Ωcm2, 0.43 Ωcm2, 0.48 Ωcm2 and 0.54 Ωcm2 at 600 °C for x = 0, x = 0.1, and x =
0.3, respectively.
Chapter 3 Electrochemical characterization
84
Composition GBCO GBCN03 GBCN06 GBCF03 GBCF06
ASR 650 °C (Ω cm2) 0.55 0.91 1.6 0.50 0.78
ASR 700 °C (Ω cm2) 0.3 0.47 0.79 0.38 0.4
Table 3.2 ASR for GBCO, GBCN and GBCF, at 650 °C and 700 °C
Figure 3.14 Temperature dependence (Arrhenius plots) of the three polarization resistances R1, R2 and RC (in term of ASR) and corresponding activation energies
obtained by fitting these plots in certain temperature range.
(a)
(b)
(e)
(c)
(d)
Chapter 3 Electrochemical characterization
85
A common agreement assign to the high frequency arc (high frequency contribution to electrode
performance HFC) which is attributed to the electronic and ionic charge-transfer processes occurring
across the current collector/electrode interface, bulk of mixed conductors, and electrode/electrolyte
interfaces [13]. In contrast, the low frequency contribution range (LFC) corresponds to the complex non-
charge-transfer processes in oxygen reduction mechanism, such as oxygen surface exchange, solid-
state diffusion and gas-phase diffusion in low oxygen partial pressure, which still remain debatable.
Temperature dependent Arrhenius plots of polarisation resistances R1 and R2, associated with the HFC
and LFC range respectively, as well as the overall polarisation resistances RC which is the sum of R1
and R2 (all are in term of ASR), are shown in Figure3.14. Phenomenologically, these polarisation
resistances exhibit the Arrhenius-like behaviour in the temperature range 500~750 °C, especially RC
and the R2 (LFC) resistances. Exceptional behaviours of HFC resistances are found in GBCF03 and
GBCF06, seeing in Figure 3.14 (d) and (e), in which the HFC resistance shows much slower
increasing rate at lower temperature. Activation energies calculated for the HFC, LFC and overall
resistance, respectively, as a function of reciprocal temperature (1000/T K-1) are listed in table 3.3.
Activation energy (eV) Electrode composition
Temperature range
(°C) R1 HF R2 LF Rc
GBCO 500-750 1.18 0.7 0.98
GBCN03 500-750 0.99 1.2 1.01
GBCN06 500-750 0.88 1.49 1.23
<550 0.94 1.24 0.99 GBCF03
>600 0.76 1.0 1.02
<550 0.99 GBCF06
>650 0.81 1.21 1.14
Table 3.3 Activation energies obtained from impedance measurement for HF, LF processes and overall reaction on five compositions.
At high temperature (>750 °C) the polarisation resistance of HFc arc is smaller than that of LFC
arc, which is inverse at lower temperature (< 700 °C), as the cross of R1 and R2 curves observed for all
compositions, suggesting that at high temperature the charger transfer processes dominate the
electrode performance since the oxygen reduction is assumed to be easily activated. With decreasing
temperature, the non charge transfer processes become the limiting factor. In addition to the increased
overall polarisation resistance, both Ni and Fe substitution are observed to increase the Ea contributing
Chapter 3 Electrochemical characterization
86
to overall polarisation resistance. This is in consistency with the study of Ni substituted GBCN by Wei
et al [28], showing the same influence of Ni substitution on electrode performance with similar
activation energy (95.1 kJ mol-1 = 0.99eV) for GBCN03.
In case of Ni substitution for Co, the doping of nickel with a lower activity may account for the
increased ASR values since the cobaltite are preferred for oxygen reduction reaction. Both Ni and Fe
substitution are found to increase the activation energy Ea for R2 greatly and meanwhile slightly
decrease the Ea for R1, compared to pure GBCO. If the R1 and R2 are attributed to specific
electrochemical kinetic or processes according to their frequency dependence, Ni and Fe substitutions
for Co in the studied materials are assumed to facilitate the charge-transfer processes and limit the
chemical processes which possibly includes oxygen adsorption, solid-state diffusion, surface-path
diffusion or gas phase diffusion et al., as discussed above. This is more obvious for the Fe substituted
electrodes with predominant LFC contribution to polarisation resistance as mentioned above.
Nevertheless, a “break” and “slow down” of temperature dependent R1 curve for GBCF03 and
GBCF06 were observed. In order to better understand the oxygen reduction processes in GBCO,
GBCN and GBCF, especially to identify the rate-limiting steps among possible sub-reactions steps,
oxygen partial pressure (2OP ) dependent impedance measurements were applied at a constant
temperature 700 °C. Figure 3.15 shows Nyquist-like impedance spectra of 2OP dependent
measurement under OCV for the symmetric GBCN03/CGO/GBCN03 cell as an example. Typically, at
high oxygen partial pressure range (>0.01 atm), the impedance spectrum of GBCN03 is characterized
by two individual arcs corresponding to equivalent circuits used in air condition. When the 2OP
decreases to ~10-3 atm, gas-phase effect appears as a separate arc at very low frequency, which is
usually < 1Hz. Modified equivalent circuits according to variation of impedance spectra were used to
analyze the polarization resistance, with high frequency (RHFCEP1) and medium frequency (RMFCPE2)
elements being attributed to the interfacial charge-transfer processes and oxygen exchange and
diffusion processes, respectively, as well as a short Warburg element added for describing the gas-
phase diffusion at the very low frequency.
In the HF range, the amplitude of the arc decreases with the increase of temperature and totally
disappears above 800 °C in this work as discussed above. This arc shows almost no change with
the oxygen partial pressure. According to the system and model used in this work, this arc
would be attributed to the oxygen ions transferring through the electrolyte/ electrode interface.
In the MF range, it seems that only one arc exists when the measurements are performed in air.
However, under lower oxygen partial pressure, with careful examination, in some case such as
the GBCN03 and GBCN06, one single (RMFCPE) element is not sufficient to fit well the
measured impedance spectra, which usually show a straight slope of 45° phase angle after the
Chapter 3 Electrochemical characterization
87
HF arc indicating infinite diffusion phenomena. Thus the contribution of MF arcs is assumed to
be the overlapping of several individual contributions characteristic of sub-reactions processes,
e.g. oxygen exchange on electrode surface, oxygen diffusion in the solid state etc. Moreover, the
amplitude of MF arcs increases with decreasing oxygen partial pressure which corresponds to
the lack of oxidant, showing evident 2OP dependency.
In the LF range (< 1 Hz), a new arc or a straight line with a 45 ° angle appears at low oxygen
partial pressure, normally below 0.01 atm. This contribution is commonly attributed to the gas
phase diffusion that occurs on the electrode surface or in the pores of electrode structure. For
this temperature 700 °C, under air condition or high oxygen partial pressure, this contribution to
resistance becomes very small and comparatively neglectable, thus the corresponding
impedance arc is highly overlapped and hard to distinguish or to separate.
Figure3.15 Impedance spectra of GBCN03 on CGO electrolyte at 700 °C under high (a) and low (b) oxygen partial pressure. (c)The appearance of a very low frequency arc
(slope) characteristic of gas phase diffusion (d) Corresponding equivalent circuits.
(a)
(d)
L1 Rs R HF
CPE1
R MF
CPE2
L1 Rs R HF
CPE1
R MF
CPE2
Ws LF
(b)
(c)
Chapter 3 Electrochemical characterization
88
The oxygen dependence of polarisation resistance could be described by the law: 2
mOR Pη−∝ ,
where the exponential factor m is well known to give information about the species involved in the
electrode reactions [39-41] and can be used to find the main rate-determining steps (RDS) of electrode
reaction in the MIECs, as shown in Table 4.4.
Reaction order m Reaction steps [8,13,40,42-46]
1 Oxygen molecular absorption on the electrode surface or gas phase diffusion in the electrode microstructure
1/2 Oxygen dissociation (adsorption/desorption) and reduction, or oxygen surface diffusion with atomic oxygen involved in RDSs
1/3 Oxygen surface exchange
1/4 Charge-transfer reaction on the electrode (or O2 incorporation into the bulk of mixed conductor)
Table 3.4 Elementary reaction steps and the value of reaction order (m) related to cathode reaction
Evolution of electrode resistance as a function of 2OP at 700 °C is shown in Figure 3.16. The
values of reaction order (m) related to different frequency ranges are listed below in Table 4.5, which
vary according to the 2OP range.
Chapter 3 Electrochemical characterization
89
Figure 3.16 Evolution of HF, MF and LF contributions to the electrode resistance as a function of oxygen partial pressure for the GBCO, GBCF03 and GBCF06 at 700 °C
Table 4.5 2OP dependence of polarization resistance of MF and LF arcs obtained
from AC impedance measurement
HF
The weak 2OP -dependence of the HF arc suggests that neither atomic oxygen nor molecular
oxygen is involved in this step. Therefor, the HF arc is associated with charger transfer processes such
as oxygen ion transfer at the electrode/electrolyte interface as well as the reaction at TPB, as expressed
by.
( )2ad O OO V CGO O− •• ×+ → (4-16)
This is understandable that the oxygen vacancies created on the electrode surface due to change
of oxygen partial pressure do not affect oxygen ion transfer, especially GBCO are considered as good
ionic conductors. However, poor connectivity or even separation of the electrode-electrolyte could
give rise to insufficient ion path way and thereby limit this processes.
MF
The variation of 2OP dependence in a wide range shows that more than one individual process
may contribute to the MF arc, which may lead to serious contradictions in RDS identification [8,26]. The
value of m is also used to indicate the rate-determining process of the oxygen reaction. For example,
when m = 0.25, the 2
1 4/OP dependence could be considered as charge transfer reaction or O–/Oad surface
diffusion along the electrode surface [44,47], and in case of m = 0.5, the 2
1 2/OP dependence may indicate
that the dissociation of oxygen molecular is the dominant process. In this work, the m factors in MF
range varies in the range ca. 0.25 ~ ca. 0.5, showing complex co-limitations. Nevertheless, at high
Chapter 3 Electrochemical characterization
91
temperature range (> 10 -3 atm), m is close to 1/3 which suggests surface exchange as rate-determining
step.
LF
The LF arc (< 1Hz) appearing only at low oxygen partial pressure (< 10-3 atm) exhibit strong
oxygen dependence with reaction order close to 1. This process could be interpreted as the associative
adsorption of O2 molecular or the gas phase diffusion within the electrode pore system driven by the
gradient in the chemical potential of gas, shown as.
( ) ( ) ( )2 2 21 2O gas O GBCM pore O GBCM pore→ − → − (4-17)
( )2 2 ,adO gas O→ (4-18)
2 2,ad adO O→ (4-19)
Through 2OP dependent EIS, it is found that the Ni and Fe substituted GBCN and GBCF show
the same general oxygen reduction behaviour as GBCO, especially in for the high frequency and low
frequency range. The interfacial ion transfer and gas phase diffusion of all compositions indicated by
reaction factor are in good agreement. The IF non-charge process could be considered mainly limited
by the surface exchange, whilst the diffusion also contributes.
3.3.2 Fuel cell tests with Ni-YSZ/Ce0.8Gd0.2O2/GBCM configuration
Single cell tests are measured at different temperatures with different flow rate of humidified H2
as fuel. Figure 3.17 shows an example of the cell voltage and the corresponding powder density of
electrolyte-supported single cell configuration of Ni-YSZ/Ce0.8Gd0.2O2/GBCF06 in the temperature
range of 600-800 °C. With the highest H2 flow rate of 40 ml/min, the maximum power density
obtained at 700 °C was 79 mW cm-2, 78 mW cm-2, and 72 mW cm-2 for GBCO, GBCF03 and
GBCF06, respectively, which are lower than the results found in literature [31,36,38].
Chapter 3 Electrochemical characterization
92
Figure 3.17 Cell voltages (line) and power densities (arc) of Ni-YSZ/ Ce0.8Gd0.2O2/GBCF06 single cell under humidified H2 fuel and air oxidant at different
temperatures and different H2 flow rates
Chapter 3 Electrochemical characterization
93
Figure 3.18 Variation of Maximum power densities obtained from Ni-YSZ/Ce0.8Gd0.2O2/GBCM single cell tests under humidified H2 fuel with different flow rate
and different temperatures
Figure 3.18 shows the maximum power densities varying with temperatures and flow rates of
humidified H2 fuel. It is observed that the performance of cell with GBCO cathode shows a weak flow
rate dependency and highest power densities compared to those obtained from GBCF03 and GBCF06
under identical condition. For the GBCF03 and GBCF06 cathodes, the power densities are more
sensitive to the flow rate of humidified H2. Thus the cell performance could be assumed to improve at
higher temperature and under higher H2 flow rate. Moreover, lower cell performance was obtained
with Fe substitution, according well with the results from symmetric cell tests in this work, and this is
in good agreement with the consensus that cathode performance is the limiting factor for IT-SOFCs
performance.
Chapter 3 Electrochemical characterization
94
3.3.3 Electrochemical performance in proton conducting fuel cell
3.3.3.1 Morphology and Microstructure Characterization
The symmetrical cells with La0.995Ca0.005NbO4 electrolytes exhibit very weak attachment of
electrode on the electrolyte, e.g. Figure 3.19 shows the SEM images of cross-sectional view of
GBCF03/La0.995Ca0.005NbO4/GBCF03 symmetrical cell. The electrode layer could be easily peeled off
during the process of sample preparation for SEM, and the electrode shows better attachment to the
Au layer than to the electrolyte. Nevertheless, the thickness of electrode layer could still be estimated
close to 10 μm.
Figure 3.19 SEM images of the cross section of GBCF03/La0.995Ca0.005NbO4/GBCF03 symmetrical cells by screen-printing after the
impedance spectroscopy measurements: (a) (b) and (c) represent different regions from the same cell.
10 μm 20 μm
20 μm
(a) (b)
(c)
Au
GBCF03
La0.995Ca0.005NbO4
Au GBCF03
La0.995Ca0.005NbO4
Au
GBCF03
GBCF03
La0.995Ca0.005NbO4
Chapter 3 Electrochemical characterization
95
This extremely poor adhesion of electrode to electrolyte might come from the large mismatch of
thermal expansion coefficient (TEC) between the GBCF/GBCN and La0.995Ca0.005NbO4 electrolyte. As
discussed in Chapter 2, the TEC values of electrodes studied in this work locate in the range of
19.8~21.1×10⁻⁶ K-1, as well as 11.8~14.2 ×10⁻⁶ K-1 for Ce(Gd)O2-δ [48]. In case of LaNbO4, the most
obvious challenge is the remarkable change in TEC above and below the monoclinic–tetragonal phase
transition, with anisotropic expansion characteristics, particularly for the low temperature phase [49-52],
as shown in Table 4.1. In addition, the very small thickness of La0.995Ca0.005NbO4 electrolytes which
are less than 0.2 mm seems to be responsible for the weak mechanic strength of the symmetrical cells
on La0.995Ca0.005NbO4 electrolyte which were thereby usually broken up in the sample holder after the
electrochemical impedance measurement.
Materials Temperature range Linear TEC (αL) (10-6 K-1)
LaNbO4 [49,52] 473–773 K 14
800–973 K 8.4
Ce0.9Gd0.1O2-δ [48] 13.4 ± 0.1
Ce0.8 Gd0.2O2-δ [48] 11.8 ± 0.1
GBCN06 (this work) 373–973 K 18.4
GBCF06 (this work) 373–973 K 21.1
Table 3.6 Linear thermal expansion coefficients for the compositions used in this study
3.3.3.2 Electrochemical performance with La0.995Ca0.005NbO4 electrolytes
Figure 3.20 shows the impedance spectra of GBCO/La0.995Ca0.005NbO4/GBCO symmetric cell
measured under OCV with 2.5%H2O in air as an example as well as the corresponding equivalent
circuits used. At high temperature, two contributions distinguished by frequency range are observed,
which are assumed to be contribution attributed to the electrolyte grain boundary and electrode
resistance, respectively [49,53,54]. With the decrease of temperature, the appearance of a high frequency
arc represents the contribution of electrolyte bulk. Here the electrode contribution plays an important
role in the overall resistance. The polarisation resistance (ASR) of electrode under dry air of
humidified air (2.5%H2O) calculated by equivalent fitting follows an Arrhenius-like behaviour, as
shown in Figure3.20.
Chapter 3 Electrochemical characterization
96
Figure 3.20 Impedance spectra of GBCO/ La0.995Ca0.005NbO4/GBCO cell under wet air with 2.5% H2O content at different temperature range and corresponding equivalent
circuit used
A dramatically large resistance of electrodes is obtained with this La0.995Ca0.005NbO4 electrolyte.
This is probably due to the great interfacial resistance related to the poor adhesion of electrode
deposited by screen printing as observed by SEM, as well as the comparatively large thickness of the
La0.995Ca0.005NbO4 electrolyte, from 140 μm to 200 μm. The discrepancy in ASR measured under dry
air and humidified air with 2.5% H2O become more evident at lower temperature, and increases with
the decrease of temperature, showing the water vapour contained in air effectively diminishes the
electrode resistance. Unlike the impedance spectra with CGO electrolyte, electrode reaction steps are
all overlapped to form a single arc in the low frequency range, whose summit frequency decrease with
temperature and the electrodes resistance shows large contribution to the overall resistance in the
whole temperature range measured.
R b
CPE b
R1
CPE1
R2
CPE2
(b)
(c)
R b
CPE b
R1
CPE1
R2
CPE2
(b) Rs R1
CPE1
R2
CPE2
Rs Rb
CPE b
R1
CPE1
R2
CPE2
(a)
Chapter 3 Electrochemical characterization
97
Figure 3.21 ASR of electrode in GBCM/ La0.995Ca0.005NbO4/GBCM symmetric cells as a function of temperature under humidified air and dry air, respectively
Figure 3.22 shows the conductivity of electrolyte obtained by the impedance spectroscopy in
this work. Compared to the maximum in protonic conductivity of acceptor-doped LaNbO4 i.e. 1×10⁻³
S/cm at 950 °C in atmospheres containing ca 2% H2O [49,50], the values obtained in this work are
between one and two orders of magnitude lower, probably due to the poor electrode/electrolyte
connectivity. In all cases, the conductivity is higher in wet air than that in dry air and the effect is
stronger at lower temperature, showing the same trend with electrode performance. With respect to the
study of this kind of electrolytes [49,50], at higher temperature, the proton concentration decreases, and
above 1100 °C both oxygen ion conductivity and electronic conductivity surpass the protonic one,
whilst below this temperature, positively charge native point defects, most probably oxygen vacancies
take over. The conductivity is predominately ionic below 800 °C in air. At lower temperature, the
protons are the major ionic charge carriers in the present of water vapour, and this explains the
difference between the conductivity under dry air and wet air with water vapour.
Chapter 3 Electrochemical characterization
98
Figure 3.22 Electrolyte conductivity obtained by impedance spectra of GBCO, GBCF03 and GBCN03, under dry air (open symbol) and wet air with 2.5% H2O (solid
symbols)
Thus, due to the poor oxygen ionic conductivity in the intermediate temperature range, the
electrode performance could possibly be limited by the charge-transfer process at the
electrode/electrolyte interface. Moreover, compared to the small electrode resistance and electrolyte
conductivity obtained for BaZr0.1Ce0.7Y0.2O3-δ with GBCO as cathode [54], the performance of
GBCM/La0.995Ca0.005NbO4/GBCO system is not satisfactory, probably attributing to the comparatively
big electrolyte thickness or the poor electrode/electrolyte interfacial connectivity, and the relatively
poor intrinsic conductivity of acceptor-doped LaNbO4.
3.4 Conclusion
Electrochemical characterization have been carried out to investigate the electrode performance
in GBCO and Ni, Fe-substituted GBCM (M=Ni, Fe) and the oxygen reduction reaction taking place on
these materials. The temperature and oxygen partial pressure dependence of impedance spectra on
GBCM/CGO/GBCM symmetric cells have been studied at OCV. Comparatively higher ASR values
are obtained rather than the characteristic 0.25 Ω cm2 obtained at 650 °C. Besides, it seems that both
Ni and Fe substitutions increase the electrode resistance. The electrode polarization resistances were
considered as a sum of two contributions distinguished by frequency and variation of impedance
spectra with temperature. With the decrease of temperature, transfer process at the
Chapter 3 Electrochemical characterization
99
electrode/electrolyte interface which is usually represented as impedance spectra arcs at high
frequency, become predominant, especially in Fe-substituted GBCF.
In all cases, the whole oxygen reduction reaction is co-limited by the interfacial charge transfer
process with very weak 2OP dependence, and the oxygen surface exchange on the electrode or solid
state diffusion associated with variation of reaction order m. With respect to the possible species
involved and high ionic conduction in this series of materials, oxygen surface absorption/desorption
involving atomic oxygen) and bulk diffusion are supposed to dominate rather than surface diffusion
along the electrode to electrode/electrolyte interface or the gas phase diffusion. However, uncertainty
still remains in the existence of oxygen intermediates and the influence of large electrode grain size.
Both Ni and Fe doping has increased the electrode polarisation resistance compared with the pristine
GBCO, which is in agreement with the single cell tests of GBCO and GBCF by A. Kulka with
utilization of same electrode materials fabricated in this work. With proton conducting electrolyte
La0.995Ca0.005NbO4, the electrode performance is limited by the ionic charge transfer process especially
at low temperature range, due to fact that the protons dominate the ionic conducting as major charge
carrier at low temperature, which could be enhanced by the presence of water vapour. Comparatively
large polarisation resistance values and low electrolyte conductivity are obtained due to the poor
interfacial connectivity observed by SEM.
Several strategies could be expected to improve the cathode performance. For example, break the
as-synthesized powders in order to obtain much smaller grain size, as well as increased electrode layer
thickness, which could enlarge the effective active area for the oxygen reduction on electrode. The
improvement of adhesion of electrode on electrolyte could also enhance the interfacial charge transfer
process. Moreover, utilization of composite electrodes is another promising strategy as having been
proved to be efficient to adapt the TEC mismatch between electrolytes and electrodes and to decrease
the electrode polarization resistance in order to obtain appreciable cathode performance.
Chapter 3 Electrochemical characterization
100
REFERENCES
[1] Jacobson, A. J. Chem. Mat. 2009, 22, 660-674.
[2] Adler, S. B. ChemInform 2004, 35.
[3] Princivalle, A.; Djurado, E. Solid State Ion. 2008, 179, 1921-1928.
[4] Zhao, H.; Mauvy, F.; Lalanne, C.; Bassat, J. M.; Fourcade, S.; Grenier, J. C. Solid State Ion. 2008, 179, 2000-2005.
[5] Barsoukov, E.; Macdonald, J. Impedance spectroscopy: theory, experiment, and applications; John Wiley and Sons, 2005.
[7] Norby, T.; Departement of Chemistry, U. o. O., Ed. Oslo.
[8] Tsipis, E. V.; Kharton, V. V. J. Solid State Electrochem. 2008, 12, 1039-1060.
[9] Choi, Y.; Mebane, D.; Wang, J.-H.; Liu, M. Topics in Catalysis 2007, 46, 386-401.
[10] LALANNe, C. Thèse, L'UNIVERSITE BORDEAUX 1, 24 Oct 2005.
[11] Lai, W.; Haile, S. J. Am. Ceram. Soc. 2005, 88, 2979-2997.
[12] Tsipis, E. V.; Kharton, V. V. J. Solid State Electrochem. 2008, 12, 1367-1391.
[13] Adler, S. B. Solid State Ion. 2000, 135, 603-612.
[14] Adler, S. B.; Lane, J. A.; Steele, B. C. H. J. Electrochem. Soc. 1996, 143, 3554-3564.
[15] Adler, S. B.; Lane, J. A.; Steele, B. C. H. J. Electrochem. Soc. 1997, 144, 1884-1890.
[16] Adler, S. B. Solid State Ion. 1998, 111, 125-134.
[17] Lu, Y. X.; Kreller, C.; Adler, S. B. J. Electrochem. Soc. 2009, 156, B513-B525.
[18] Wilson, J. R.; Schwartz, D. T.; Adler, S. B. In 6th International Symposium on Electrochemical Impedance Spectroscopy; Pergamon-Elsevier Science Ltd: Cocoa Beach, FL, 2004, p 1389-1402.
[19] Svensson, A. M.; Sunde, S.; Nisancioglu, K. J. Electrochem. Soc. 1997, 144, 2719-2732.
[20] Svensson, A. M.; Sunde, S.; Nisancioglu, K. Solid State Ion. 1996, 86-88, 1211-1216.
[21] Mebane, D. S.; Liu, Y.; Liu, M. J. Electrochem. Soc. 2007, 154, A421-A426.
[22] Janardhanan, V. M.; Heuveline, V.; Deutschmann, O. Journal of Power Sources 2008, 178, 368-372.
[23] Baumann, F. S.; Maier, J.; Fleig, J. Solid State Ion. 2008, 179, 1198-1204.
[24] Baumann, F. S.; Fleig, J.; Habermeier, H.-U.; Maier, J. Solid State Ion. 2006, 177, 1071-1081.
[25] Fleig, J. Physical Chemistry Chemical Physics 2005, 7, 2027-2037.
[26] Jorgensen, M. J.; Mogensen, M. J. Electrochem. Soc. 2001, 148, A433-A442.
[27] Li, Y.; Gemmen, R.; Liu, X. Journal of Power Sources 2010, 195, 3345-3358.
[28] Wei, B.; Lü, Z.; Jia, D.; Huang, X.; Zhang, Y.; Su, W. International Journal of Hydrogen Energy 2010, In Press, Corrected Proof.
[29] Tarancon, A.; Pena-Martinez, J.; Marrero-Lopez, D.; Morata, A.; Ruiz-Morales, J. C.; Nunez, P. Solid State Ion. 2008, 179, 2372-2378.
[30] Pena-Martinez, J.; Tarancon, A.; Marrero-Lopez, D.; Ruiz-Morales, J. C.; Nunez, P. Fuel Cells 2008, 8, 351-359.
Chapter 3 Electrochemical characterization
101
[31] Tarancon, A.; Morata, A.; Dezanneau, G.; Skinner, S. J.; Kilner, J. A.; Estrade, S.; Hernandez-Ramirez, F.; Peiro, F.; Morante, J. R. Journal of Power Sources 2007, 174, 255-263.
[32] Tarancon, A.; Skinner, S. J.; Chater, R. J.; Hernandez-Ramirez, F.; Kilner, J. A. Journal of Materials Chemistry 2007, 17, 3175-3181.
[33] Li, N.; Lu, Z.; Wei, B. O.; Huang, X. Q.; Chen, K. F.; Zhang, Y. Z.; Su, W. H. Journal of Alloys and Compounds 2008, 454, 274-279.
[34] Ding, H.; Xue, X. International Journal of Hydrogen Energy 2010, In Press, Corrected Proof.
[35] Wei, B.; Lü, Z.; Jia, D.; Wei, T.
[36] Jo, S. H.; Muralidharan, P.; Kim, D. K. Electrochemistry Communications 2009, 11, 2085-2088.
[37] Lee, Y.; Kim, D. Y.; Choi, G. M. Solid State Ion., In Press, Corrected Proof.
[38] Lee, S. J.; Kim, D. S.; Kim, D. K. Current Applied Physics, In Press, Corrected Proof.
[44] Matsuzaki, Y.; Yasuda, I. Solid State Ion. 1999, 126, 307-313.
[45] Jiang, S. P. Solid State Ion. 2002, 146, 1-22.
[46] Kharton, V. V.; Tsipis, E. V.; Yaremchenko, A. A.; Frade, J. R. Solid State Ion. 2004, 166, 327-337.
[47] Kim, J.-D.; Kim, G.-D.; Moon, J.-W.; Park, Y.-i.; Lee, W.-H.; Kobayashi, K.; Nagai, M.; Kim, C.-E. Solid State Ion. 2001, 143, 379-389.
[48] Kharton, V. V.; Figueiredo, F. M.; Navarro, L.; Naumovich, E. N.; Kovalevsky, A. V.; Yaremchenko, A. A.; Viskup, A. P.; Carneiro, A.; Marques, F. M. B.; Frade, J. R. Journal of Materials Science 2001, 36, 1105-1117.
[49] Haugsrud, R.; Norby, T. Solid State Ion. 2006, 177, 1129-1135.
[50] Haugsrud, R.; Norby, T. Nature Materials 2006, 5, 193-196.
[51] Mokkelbost, T.; Lein, H. L.; Vullum, P. E.; Holmestad, R.; Grande, T.; Einarsrud, M.-A. Ceramics International 2009, 35, 2877-2883.
[52] Tolchard, J. R.; Lein, H. L.; Grande, T. J. Eur. Ceram. Soc. 2009, 29, 2823-2830.
[53] Fjeld, H.; Kepaptsoglou, D. M.; Haugsrud, R.; Norby, T. Solid State Ion. 2010, 181, 104-109.
[54] Lin, B.; Zhang, S.; Zhang, L.; Bi, L.; Ding, H.; Liu, X.; Gao, J.; Meng, G. Journal of Power Sources 2008, 177, 330-333.
Chapter 4 Oxygen nonstoichiometry and transport properties
102
Chapter 4 Oxygen nonstoichiometry and the transport
properties
Oxygen transport properties, including oxygen nonstocihiometry, oxygen ion permeability and
diffusion, and oxygen surface exchange [1], is of great importance in materials for SOFCs application.
Thus to design materials demonstrating high oxygen conductivity at low temperature is also a
scientific challenge in the IT-SOFC development. To be a good oxygen-ion conductor, two
fundamental requirements must be met: large amount of oxygen vacancies in the oxygen sublattice
and low energy barrier for oxygen migration from one site to another [2]. Most of the oxygen reduction
mechanisms proposed, such as the ALS model [3], highlight that in porous mixed ionic-electronic
conducting (MIEC) electrodes, the oxygen reduction reaction is complex and consists of chemical and
electrochemical processes co-limited by the oxygen surface exchange and solid state diffusion.
Furthermore, the oxygen non-stoichiometry, which reflects the concentration of oxygen vacancies, is a
fundamental factor relating many important properties such as oxygen transport behaviour, electronic
conductivity and catalytic activity [4]. Especially in deficient perovskite structures the bulk diffusion
takes place by hopping of oxygen vacancies [5]. Therefore, these values are essential to assess the
validity of those theoretical models or for predicting the performance of new materials [6].
In this work, the determination of the absolute values of oxygen stoichiometry δ in GdBaCo2-
xMxO5+δ (M=Ni or Fe, x =0, 0.3, 06) has been performed by thermogravimetric analysis versus
temperature and oxygen partial pressure. Electrical conductivity relaxation (ECR) has been carried out
in the temperature range of 600 to 800 °C and in the oxygen partial pressure range of 10-5 to 0.206 atm
in order to investigate the oxygen surface exchange and chemical diffusion. The limitations of sample
density, apparatus and especially the flush time are discussed.
4.1 Electrical conductivity relaxation (ECR)
High ionic conductivity in MIECs at elevated temperatures results from large oxygen vacancy
concentration in conjunction with a high vacancy diffusivity [7]. For many mixed-conducting materials
that are predominantly electronic conductor, a change in the oxygen partial pressure will result in a
corresponding change in the electrical conductivity of the material due to, primarily, a change in the
concentration of charge carriers [8]. If the ionic conductivity in a material is significantly less than the
electronic conductivity, the time for this change to propagate throughout the material is considered
almost exclusively controlled by the movement of ionic species. This time variation or “relaxation” of
Chapter 4 Oxygen nonstoichiometry and transport properties
103
the electrical conductivity of a sample after a stepwise change in the ambient oxygen partial pressure
can be measured, giving rise to the electrical conductivity relaxation (ECR) technique. The relaxation
data are fitted to theoretical equations from which the chemical diffusion coefficients and surface
exchange coefficients can be extracted, based on the solutions proposed in literature [7,9-15].
4.1.1 General equation and solutions
To analyse the diffusion by relaxation technique, a flat thin sheet is considered with thickness 2b.
At t < 0, the sample is assumed to be in thermodynamic equilibrium with the surrounding atmosphere.
At t= 0, the corresponding 2OP is changed stepwisely to a new value, associated with a new
equilibrium in oxygen concentration c∞. Driven by the gradient of oxygen concentration between c0,
the oxygen concentration at t < 0, and c∞, the oxygen starts to diffuse into or out of the sample.
Starting point in the derivation is Fick’s second law
2
2
c cDt x∂ ∂
=∂ ∂
(4.1)
where D is the chemical diffusion coefficient. The surface reaction is assumed to proceed at a rate
proportional to the difference between the actual concentration at the surface, c(± b), and c∞. The
boundary conditions at both surfaces z = b and z = -b are given by [5,16]:
( ) ( )trz b
cJ b D K c b cz ∞
=
∂= − = −⎡ ⎤⎣ ⎦∂
(4.2)
( ) ( )trz b
cJ b D K c b cz ∞
=−
∂− = − = − − −⎡ ⎤⎣ ⎦∂
(4.3)
where J denotes the flux density and Ktr is the surface transfer coefficient controlling the rate of
surface reactions. Thus, the solution for the concentration profile as a function of time, c(z, t), is
defined through an eigenfunction expansion of the initial oxygen concentration c0 [17]
:
( ) ( )( ) ( )
02 2
10
2 cos1
cosn
n nn n
L z / bc z,t c texpc c L L
β
β β
βτβ β
∞
=∞
− ⎛ ⎞= − −⎜ ⎟− + + ⎝ ⎠
∑ (4.4)
where the time constants τn are given by
2
n 2n
b=D
τβ⋅
(4.5)
Chapter 4 Oxygen nonstoichiometry and transport properties
104
and the parameters 2nβ are obtained from
tan trn n
bK= LD ββ β = (4.6)
Since the total electrical conductivity of a mixed conductor is predominantly determined by the
electronic conduction, in case of an oxide with p-type conduction i.e. decreasing with decreasing
oxygen partial pressure, the change in electrical conductivity following step change in 2OP results
from the oxygen incorporation or generation of oxygen vacancies from the reaction with gas phase,
thereby either forming two electrons or annihilating two electron holes, given by [18],
21 22 OV O O h×+ +ii i (4.7)
The apparent conductivity change is related to oxygen ion conductivity which is the same as vacancy
conductivity [18]. Equating the change in the oxygen nonstoichiometry to changes in electrical
conductivity it is possible to express the conductivity transient as [13,16,19].
( ) ( ) ( )( )
02 2 2
10
2 cos1 n
n nn n
L z / bt tt expL L
β
β β
βσ σσ
σ σ τβ β
∞
=∞
− ⎛ ⎞= = − −⎜ ⎟− + + ⎝ ⎠
∑ (4.8)
thus the parameters D and Ktr can be obtained from fitting the data of electrical relaxation
experiments with this equation.
To evaluate the eigenvalues and validity of coefficients calculated, a characteristic length is given
ctr
DL =K
(4.9)
within which diffusion limitation occurs if cb L and surface limitation if cb L . By assuming a
proportional relation between the electronic conductivity and the oxygen concentration, the
dimensionless transient conductivity can be derived by integration of the concentration over the
sample volume
( ) ( ) 0
10
1 nn n
t tt Aσ σ
σσ σ τ
∞
=∞
− ⎛ ⎞= = − −⎜ ⎟− ⎝ ⎠
∑ (4.11)
( )2
2 2 2
2n
n n
LA
L Lβ
β ββ β=
+ + (4.12)
Chapter 4 Oxygen nonstoichiometry and transport properties
105
Limiting Lβ between 0.03 and 30 in the procedure is considered the effective regime to evaluate both
D and Ktr simultaneously. If the value of Lβ from fitting is below 0.03, the chemical diffusion
coefficient is to be ignored and vice versa.
4.1.2 Flush-time correction
The evaluation of chemical diffusion and surface exchange by the use of ECR technique requires
an instantaneous change in surrounding atmosphere to match the derivation of the theoretical
equations, and the accurate data of the conductivity transient should be measured at short times, i.e.
immediately after the change in the surrounding oxygen partial pressure. Thus, the flushing behaviour
of the reactor volume may significantly influence the early stage of the relaxation process and result in
large errors in the transport parameters obtained.
Den Otter et al [16] provided a flush-time correction for the non-ideal step response, with a gradual
equilibration of the oxygen partial pressure surrounding the sample, instead of ideal “instantaneous”
change, due to the finite flush time of the reactor. An important time constant τf is taken into account,
which is referred to the characteristic time needed to flush the reactor volume, by assuming
continuously ideally stirred tank reactor (SISTR) behaviour in the actual reactor volume.
( ) ( )CISTRCRSTR
0 f
p t p tp t expp p τ
∞
∞
− ⎛ ⎞= = −⎜ ⎟− ⎝ ⎠
(4.12)
where the ( )CISTRp t denotes the oxygen partial pressure as a function of time, ( )CISTRp t is the
dimensionless oxygen partial pressure. This equation indicates that after a period of 4×τf has elapsed,
only 1.83% of the original gas volume has not been replaced yet [16].
The final conductivity transient equation taking in account the flushtime is written as:
(GBCF03) and GdBaCo1.4Fe0.6O5+δ (GBCF06), as well as the oxygen nonstoichiometry as a function
of oxygen partial pressure 2OP for pure GdBaCo2O5+δ at different temperatures, are shown in the
Figure 4.2. As can be seen, the oxygen nonstoichiometry depends on the composition, temperature
and oxygen partial pressure, in agreement with previous works on GBCO [21-23] and many other
perovskites including B-site Co, Ni or Fe [4,19,24-28].
Figure 4.2 The oxygen content δ:
(Left) as a function of temperature in air condition, measured by TGA
(Right) as a function of oxygen partial pressure for GdBaCo2O5+δ at different temperatures
In the air condition, oxygen content decreases with the increase of temperature, representing
release of oxygen from the crystal structure and formation of oxygen vacancies. Similar to the results
of oxygen nonstoichiometry at ambient, at the investigated temperatures (> phase transition
temperatures for all compositions) Fe substituted GBCF03 and GBCF06 show lower oxygen content δ
with increasing Fe substitution for Co. Moreover, strong 2OP dependency of the equilibrium oxygen
content of GBCO shows good agreement with previous works [22,29], which could be directly related to
the conductivity enhancement with increasing oxygen partial pressure [21]. Whilst, slightly higher
oxygen content δ with Ni substitution are observed, however, the δ values in GBCN03 and GBCN06
are comparatively adjacent to those of GBCO, compared to Fe substitution.
Chapter 4 Oxygen nonstoichiometry and transport properties
111
Figure 4.3 Oxygen content δ as a function of oxygen partial pressure at different temperatures in GBCN03, GBCN06, GBCF03 and GBCF06
Apart from the pristine GBCO, the oxygen nonsotichiometry δ, measured by TGA as a function
of oxygen partial pressure in the range from air to 10-5 atm at 700, 750 and 800 °C, in other
compositions is given in Figure 4.3. As can be seen, for all compositions, the oxygen content at those
elevated temperatures decrease almost linearly with decreasing log pO2 until they approach a similar
value, which is represented as a plateau or a trend of reaching a plateau (GBCO), at very low oxygen
partial pressure < 10-5 atm.
The values of δ for GBCO (Figure 4.2 right) show an asymptotic trend from 10-4 atm, thus it can
be assumed that if lower 2OP (<10-4 atm) could be applied, the approximation to δ = 0 would be
expected. This is in good agreement with previous work of Tsvetkov et al. [22] for pure GBCO, in
which the measured 2OP dependence of oxygen nonstoichiomery δ’ in term of GdBaCo2O6-δ’ at
temperatures from 900 to 1050 °C exhibited inflection when δ’ reached the value of 1, at the 2OP close
Chapter 4 Oxygen nonstoichiometry and transport properties
112
to 10-4 atm. This approximation of oxygen nonstoichiometry δ indicating the weakening of
temperature dependence is more evident in GBCN03, GBCN06, GBCF03 and GBCF06 for which δ
has been obtained at lower 2OP close to 10-5 atm, as shown in Figure 4.3. The total changes in δ are
less than 0.35, and the δ value of plateau differs according to the composition: GBCN03 and GBCN06
reach the δ value close to 0.17 and 0.15, respectively, which are higher than δ ≈ 0 for GBCO, and
much lower δ values, ~0.26 for GBCF03 and ~0.437 for GBCF06, are obtained. Therefore, it can be
concluded that the Fe substitution decreases the oxygen content at both low and high temperature with
increasing Fe content, whilst the Ni seems to reduce the decrease in δ.
4.3.1.2 B site substitution on oxygen nonstoichiometry for other perovskites
The observed trends of influence of Fe substitution decreasing the oxygen content in this work
are inverse to those previous works on La1-xSrxCo1-yFeyO3-δ [4,19,27], in which the δ decreases with
increasing Fe content at a given oxygen pressure and temperature, and this was attributed to an
increasing binding energy of oxygen O2- in the lattice and a large tendency of Fe to form holes rather
than oxygen vacancies. Park et al. [25] studied the variation of oxygen nonstoichiometry for
La0.2Sr0.8Fe0.55Ti0.45O3-δ at different temperatures in a very wide 2OP range (10-18 ≤
2OP ≤ 0.3 atm), in
their study the plateau of δ vs 2OP curve observed between 10-12 and 10-7 atm was attribute to the
“ideal” stoichiometric composition. On the contrary, Kopcewicez et al. [30] has used the Mössbauer
spectroscopy and TGA to reveal that the increase of Fe content leads to the decrease of oxygen content
and suppose a change of the type of oxygen vacancy ordering according to the formula TbBa(Co2-
xFex)O5.5-x/2, leading to a phase transition from orthorhombic to tetragonal for annealed samples at
room temperature. They stated the existence of there different positions of Fe ions in the lattice, in the
contrast to the two positions of Co ions, CoO5-square pyramidal coordinations and CoO6-octahedral
coordinations, with oxygen vacancies ordering in the [LnO0.5] layer in the ideal 112-type crystal
structure for LnBaCo2O5+δ pervoskites [29,31,32]: one with higher symmetry with smaller quadrupole
splitting corresponding to the Fe ions in octahedrons and two different low symmetries with large
quadrupole splitting, one of which corresponds to the square pyramidal position while the other
appears at octahedral position by removing on oxygen atom from the [TbO0.5] layer in this type of
crystal structure. Applying this model on Fe substituted GBCF in this work, with the consideration of
very similar structure between TbBaCo2O5.5 and GdBaCo2O5.5, Fe seems to prevent the formation of
CoO6 octahedral in the neighbourhood during the phase transition from high to ambient temperature,
as discussed in Chapter 2. Thus the average valence state of Co ions should be considered as less than
3+ indicating partially reduction of Co3+ to Co2+. However, by comparing the oxygen
nonstoichiometry of GBCF measured in this work and that derivate from the formula 3+ 3+ 2+2-x x x 5.5-x/2GdBaCo Fe Co O according to the proposed formula 3+ 3+ 2+
2-x x x 5.5-x/2TbBaCo Fe Co O , shown
Chapter 4 Oxygen nonstoichiometry and transport properties
113
in Table 4.1, large discrepancy is observed in case of GBCF06, which give rise to the suspicion of
reduction of Fe3+ to Fe2+ in addition to the Co ions.
Composition X 0 0.3 0.6
Oxygen content in 3+ 3+ 2+2-x x x 5.5-x/2GdBaCo Fe Co O derivated from [30] 5.5 5.35 5.2
Oxygen content in GdBaCo2-xFexO5+δ measured in this work 5.514 5.356 5.063
Table 4.2 Oxygen content at room temperature in GdBaCo2-xFexO5+δ
4.3.2 Electrical conductivity
High electrical conductivity is one fundamental factor for MIEC materials used as electrodes for
SOFC application. For this kind of oxides, there are two primary conduction mechanisms, electronic
and ionic conduction, due to the simultaneous presence of both electronic holes and oxygen vacancies
within these materials. Since the ionic conductivity is much lower than electronic conductivity, the
values obtained herein are assumed to be electronically predominant.
4.3.2.1 Total conductivity as a function of temperature
GBCO
Total electrical conductivity σ of GBCO measured in the range RT-800 °C is shown in Figure
4.4 (a). The conductivity increases with increasing temperature below about 100 °C, exhibiting a
typical semiconductor-type behaviour, which corresponds to Metal-insulator (MI) transition consistent
with the low-temperature phase transition observed by XRD in Chapter 2 of this work and other
previous works [23,31,33], due to the sudden spin state switch in the Co3+ ions located at the cathedra
from LS ( 6 02g gt e ) to HS ( 4 2
2g gt e ) states at this temperature (TMI). Thereafter, the conductivity of GBCO
gradually increases with the increasing temperature showing same semiconductor-type behaviour
although with very weak temperature dependence, passing through a maximum value in σ in the
temperature range 300-400 °C, where the materials starts to loose oxygen according to the TG results,.
At higher temperature, especially after the orthorhombic-tetragonal phase transition which
corresponds to a small abrupt change of conductivity on the δ curve (seeing the vertical bars), the total
conductivity decreases with increasing temperature indicating a metallic-like behaviour, in accordance
with references [21,23,34-36]. This is possibly due to the fact that the phase transition breaks down the
alternation of CoO5 pyramidal and CoO6 octahedral planes along the b direction and therefore hampers
the hole creation thus reduces the charge carrier (hole) concentration p; moreover, with the increase of
Chapter 4 Oxygen nonstoichiometry and transport properties
114
temperature, the thermally introduced loss of lattice oxygen and formation of oxygen vacancies
accounts for the loss of charge carrier introduced by oxygen exchange with atmosphere.
Figure 4.4 Total electrical conductivity as a function of temperature measured by four-probe method under air with rectangular sample of (a) GBCO (b) GBCN03 and
GBCN06 and (c) GBCF03 and GBCF06
The small difference in conductivity values and the hysteresis of transition temperature between
the heating and cooling process may be related to the kinetics of oxygen uptake/release process and
valence variation of Co during heating and cooling and their first-order character of phase transition [23,36], respectively. Moreover, the electrical conductivities for GBCO reported in the references
(a)
(b)
(c)
Chapter 4 Oxygen nonstoichiometry and transport properties
115
mentioned above are quite different. Nevertheless, in this work, in the temperature range 300-800°C
the total electrical conductivity of GBCO is higher than 200 S cm-1, which is adequate for application
as a cathode in IT-SOFCs requiring typically a conductivity of 100 S cm-1 at the operating temperature.
GBCN
As can be seen from Figure (b), the total electrical conductivity of Ni substituted GBCN03 and
GBCN06 shows similar semiconductor-type behaviour below ~50 °C, a temperature which is lower
than that of GBCO. This is in consistency with previous work of Bharathi et al. [37] showing that the Ni
substitution for Co in GdBaCo2-xNixO5+δ led to a decrease of metal-insulator transition temperature
(TMIT), they have stated that the structure change with Ni substitution could result in the modification
of the crystal field energies and consequently decrease the energy required for the spin stat transition
driving the MI transition. The inflection in conductivity curves corresponding to high temperature
phase transition, marked by the vertical bars, shifts to lower temperature with Ni substation, in
consistency with the DSC and XRD results. Besides, seeing the high temperature metallic-like
behaviour in conductivity, GBCN shows the strongest temperature dependence.
GBCF
The total conductivity of Fe substituted GBCF03 and GBCF06 exhibits a remarkable
enhancement of semiconductor-type behaviour which can be observed above 200 °C for GBCF and
300 °C for GBCF06, respectively, as shown in Figure 4.4 (c). Similar phenomena were observed for
GdBaCo2O5+δ in a wide range of oxygen content by Taskin et al. [38,39], indicating the MI transition
seems to be smeared for δ away from 0.5. Indeed, they have observed the temperature-independent MI
transition for 0.45 ≤ δ ≤ 0.55 at TMI ≈ 360 K, and no MI transition was observed for δ = 0.165 and δ =
0.7, which corresponds well the case of GBCF in this study. In addition, Tang et al. has investigated
the Fe doped GdBaCo2-xFexO5.5-δ with low substitution ratio 0 ≤ x ≤ 0.2 [40], and found that the spin-
state transition slightly shifts to higher temperature with increasing Fe doping, from 365 to 372 K, due
to the decrease of the oxygen amount in Fe-rich region and alsothe number of Co ions in octahedral
positions which could undergo a spin state transition. More consistent result was reported in TbBaCo2-
xFexO5+δ [30], in which the Mössbaurer spectroscopy has been applied to prove that the Fe substitution
slightly increased the TMIT; and Fe doping also tended to increase the resistivity, which is in good
agreement with our study, e.g. GBCF06 shows the lowest total electrical conductivity among all
compositions. Similar decrease in electrical conductivity with higher Fe substitution was observed in
LSCF and LCCF [19,41]. The hysteresis in conductivity of GBCF06 between cooling and heating at
~300 °C is related to the orthorhombic-tetragonal phase transition observed by XRD as discussed in
Chapter 2. From this temperature, the conductivity starts to exhibit metallic-like behaviour as same as
GBCO and GBCN.
Chapter 4 Oxygen nonstoichiometry and transport properties
116
Although the Fe substitution is shown to decrease the electrical conductivity, in the temperature
range of 300-800 °C, the lowest σ value of GBCF06 is still larger than 100 S cm-1, which guarantees
the suitability for cathode application in IT-SOFCs.
4.3.2.2 Conductivity under decreasing 2OP
Figure 4.5 Equilibrated total electrical conductivity as a function of oxygen partial pressure obtained from the electrical conductivity relaxation processes with AC four-probe setup at different temperatures ( t = 600, 650, 700, 750 and 800 °C) for GBCO,
GBCN03, GBCN06, GBCF03 and GBCF06
Chapter 4 Oxygen nonstoichiometry and transport properties
117
Figure 4.5 shows the evolution of total electrical conductivity as a function of oxygen partial
pressure at different temperatures. The values of δ were obtained conductivity relaxation processes at
equilibrium state.
Generally, at a constant 2OP , increasing temperature results in a decrease in the electrical
conductivity, probably attributed a lowering of holes concentration. The total conductivities for all
compositions decrease with decreasing oxygen partial pressure (2OP ) at a constant temperature,
exhibiting a typical p-type conductivity, due to the reaction forming of oxygen vacancies and
consuming the charge carriers (electron holes), in consistency with the 2OP and temperature
dependency of oxygen nonstoichiometry in this work and previous works on GBCO [21,23].
For example, in case of GBCO, the charge disproportion and the process of oxygen release from
the cobaltite lattice under reducing condition (lower oxygen partial pressure or increased temperature)
which decrease the concentration of charge carriers could be described as [21,41,42]:
×Co Co Co2Co Co +Co′ i (4.20)
×O Co 2 O Co
1O +2Co O +V +2Co2
×i ii (4.21)
×O Co 2 O Co
1O +2Co O +V +2Co2
× ′ii (4.22)
Nevertheless, the defect model at high temperature is still not clear for these materials, as well as the
competition between concentration and mobility of these charge carriers.
4.3.3 Electrical conductivity relaxation (ECR)
4.3.3.1 Flush time
As discussed above, ideally, the oxygen partial pressure in relaxation experiments should be
changed by switching between two gas flows with different oxygen partial pressures simultaneously.
However, this assumption is hard to achieve with respect to actual experimental conditions in most
cases. For the conductivity relaxation experiments, small reactor volumes and hence comparatively
short flush times are needed, otherwise, if the relaxation time approaches the flush time of the reactor
volume, the flush time correction is necessary. Otherwise the chemical diffusion coefficient and
surface exchange coefficient cannot be accurately determined since the obtained relaxation could also
be governed by gas flushing.
Chapter 4 Oxygen nonstoichiometry and transport properties
118
Since the quartz glass tube applied as rector in this work has a comparative large empty internal
volume, ca. 420 cm3 without sample holder, some alumina bars were added in order to diminish the
time to flush the reactor volume. The flush time τf was obtained by fitting the simultaneous change of
oxygen partial pressure in the reactor during the flushing of the reactor volume after the abrupt switch
of gas stream followed in, according to Eq. 11.The the flow rate for all cases is controlled to be
constant at 10 L/h. An example of step changes in 2OP at 700 °C is shown in Figure 4.6, the black
squares are the measured oxygen partial pressure by Zirox as an oxygen sensor, for small pressure
switch (a) 100-300 ppm, intermediate pressure switch (b) 0.01-0.03 atm and large pressure switch (c)
0.05-0.206 atm (air), and the red curve indicates the fitting for flush time τf according to Eq. 4.12.
Figure 4.6 Measurement of flush time following the re-equilibration of oxygen partial pressure in the reactor at different 700 °C, for different step changes: (a) 0.05-0.206(air)
atm, (b) 0.01-0.03 atm, (c) 100-300 ppm
The fitted flush times in all selective temperatures and 2OP steps, which follow an oxidation
direction, are listed in Table 4.2. As can been seen, at a constant flow rate, the reactor flushing
behaviour is slightly thermally activated, with smaller τf at higher temperature for the same step
change of 2OP as well as the contribution of the values in Δ
2OP . Nevertheless, the values of τf
(a) (b)
(c)
Chapter 4 Oxygen nonstoichiometry and transport properties
119
measured in this work are significantly large, which is assumed to be due to the large reactor volume
compared to other studies [6,16,20,43-46].
Flushtime τf (s)
10(50)-100
100-300
300-500
500-700
700-1000
0.005-0.01
0.01-0.03
0.03-0.05
0.05-0.206
2OP
T (°C)
ppm ppm ppm ppm ppm atm atm atm atm
600 65 65.5 74 86.5 78 74 64.63 65 57.8
650 67 67.6 76 86 79.8 72 60.3 60 54.6
700 67.56 66.5 76 75.8 80 67.3 65.3 59 53.7
750 61.1 63.1 66.2 72.3 77.6 66 58 57.4 52.54
800 54 54 65.4 66 74 67.3 52.4 54.3 50
Table 4.3 Various oxygen partial pressure switches applied in this work for conductivity relaxation measurement and the corresponding flush times τf (s)
The conductivity relaxation plots of GBCF03 at different temperatures with oxygen partial
pressure switches corresponding to those of Figure 4.6, are shown in Figure 4.7. The time
dependent conductivities are normalized in term of ( ) ( ) [ ]0 0t t /σ σ σ σ σ∞= − −⎡ ⎤⎣ ⎦ in order to
compare the relaxation processes at different temperatures.
As can been seen, the time to reach a new equilibrium in electrical conductivity after the change
of surrounding atmosphere shows a temperature dependency and significant 2OP dependency. For all
oxygen partial pressure switches, at higher temperature, the conductivity re-equilibrium processes take
place faster, showing higher oxygen transport kinetics associated with the oxygen surface exchange
and bulk diffusion of oxide ions. For a constant temperature, the time of relaxation processes varies in
a large range according to different 2OP switches, even by orders of magnitude. Let’s consider the
GBCF03 sample for instance, seeing Figure 4.7: (a) the re-equilibrium processes following the 2OP
change from 0.05 atm to air accomplish within 1000 s whatever the temperature; (b) for the 2OP
switch from 0.01 to 0.03 atm, the re-equilibrium in electrical conductivity accomplish within 2000-
5000s, from 800 °C to 600 °C, exhibiting stronger temperature dependency than in the high 2OP
conditions; (c) at low oxygen partial pressure range, e.g. from 100 to 300 ppm, much longer time (>
Chapter 4 Oxygen nonstoichiometry and transport properties
120
2×10⁴ s) is needed and it increases significantly with decreasing temperature. Moreover, in accordance
with the small 2OP dependency of σ at low
2OP , as shown in Figure 4.5, the changes in conductivity
values at the initial and re-equilibrium 2OP are small and thereby lead to low signal to noise ratio.
Figure 4.7 Relaxation plots of GBCF03 at different temperatures for the indicated pressure switches: (a) 0.05atm-air (b) 0.01-0.03 atm, measured (points) and smoothed
(solid lines) data, (c) 100-300 ppm
Comparing the measured flush times τf with the conductivity relaxation processes, only at low
2OP (≤ 1000 ppm) the flush time could be considered as “much smaller” than the duration of
relaxation process, ca. by 3 orders of magnitude, which is supposed to allow accurate determination
(a)
(b)
(c)
Chapter 4 Oxygen nonstoichiometry and transport properties
121
for both surface exchange and chemical diffusion coefficients. In contrast, at higher 2OP , the times of
relaxation processes approach those for flushing the reactor volume with increasing oxygen partial
pressure, from 2 orders to 1 order of magnitude higher than τf , exhibiting “non-ideal step process” and
giving rise to the strong necessity for flush time correction.
4.3.3.2 Determination and evaluation of oxygen transport properties
As discussed in section 4.1, when the cross-section of the rectangular sample is 2a×2b (a>b), the
parameter trL b K / Dβ == i is applied as an indicator for the evaluation of coefficients obtained by
fitting the experimental relaxation data.
If Lβ < 0.03, the relaxation kinetics is entirely governed by the rate of surface reaction thus only
Ktr could be obtained.
If Lβ > 30, the re-equilibrium in conductivity is not affected by the surface reaction only D can be
obtained by the fitting.
In the intermediate region 0.03 < Lβ < 30, mixed controls coexist, and both D and Ktr can be
derived from fitting the experimental relaxation data.
Figure 4.8 Typical AC conductivity relaxation profiles for GBCN06 at 800 °C (open circle) and fitted curved using corresponding measured flush times (red line) as well as
assumed flush times (blue and green dash lines)
Chapter 4 Oxygen nonstoichiometry and transport properties
122
2OP 10-100 ppm 0.01-0.03 atm 0.05-0.206 atm (air)
τf (s) 54 × 52.4 × 50 ×
D (cm2 s-1) 3.53E-6 3.92E-6 3.22E-5 9.06E-4 6.77E-1 8.93E-1
Table 4.4 Chemical diffusion and surface exchange coefficients obtained by fitting the relaxation data of GBCN06 at 800 °C with comparison of oxygen partial pressure,
with (τf) and without (×) flush time correction
Figure 4.8 shows the typical AC conductivity relaxation profiles for GBCF03 with fitted curves.
In order to interpret the importance of flush time correction, each profile is fitted with equation using
actually measured flush time (τf) and the equation without flush time correction. The fitting results are
listed in Table 4.4, showing clear evidence that both the two coefficients are sensitive to the flush time
value. At low 2OP , this influence of flush time is comparatively small, due to the long duration of
conductivity re-equilibration process. In contrast, at high 2OP where the re-equilibration usually takes
place fast, especially with 2OP switch towards air, the flush time is tremendously large compare to the
requirement for mixed diffusion and surface control: between 500 and 5000 times smaller than time
of relaxation process. Thereby, the fitting results are highly dependent on the τf values. For example,
with the change of oxygen partial pressure from 0.05 atm to air at 800 °C for GBCN06, it took only
300 s to reach an new equilibrium in conductivity, with the flush time of 50 s, exhibiting very fast
kinetics, and comparatively high D and Ktr values were obtained; the correspond Lβ was less than
0.03 indicating a surface limitation. As a consequence, only the surface exchange coefficient Ktr was
taken as results. In most cases of this work, Lβ locates in the intermediate range which allows the
determination of D and Ktr simultaneously. Nevertheless, at high oxygen partial pressure involving
the conductivity re-equilibration in air condition, hardly both D and Ktr could be obtained.
4.3.3.3 Oxygen transport kinetics
The chemical diffusion coefficient D and surface exchange coefficient Ktr, obtained from the
data fitting have been plotted in Figure 4.9 and Figure 4.10 as a function of the final 2OP in each
2OP step switch, respectively. For GBCN06, the chemical diffusion coefficient D from 0.05 atm to
air is not plotted since they could not be extracted from the fitting procedure.
Chapter 4 Oxygen nonstoichiometry and transport properties
123
Figure 4.9 Chemical diffusion coefficients as a function of final oxygen partial pressure from oxidation runs
Generally, both the chemical diffusion coefficients and the surface exchange coefficients increase
with increasing 2OP , showing the same trend of
2OP dependency, except the GBCO at high oxygen
partial pressure. The surface exchange kinetics is of 2-3 orders of magnitude faster than bulk diffusion.
It can be noticed that that the higher the oxygen partial pressure is, the weaker temperature
dependency of D is shown. Among these five compositions, GBCO has the highest D values, even
their reliability is doubtable which will be discussed in next section, and whilst lower values are
obtained in Fe substituted GBCF03 and GBCF06 samples.
Chapter 4 Oxygen nonstoichiometry and transport properties
124
Figure 4.10 Surface exchange coefficients as a function of final oxygen partial
pressure from oxidation runs
Nevertheless, both the chemical diffusion coefficients and surface exchange coefficients obtained
in this work are much higher compared to previous work on GBCO [21]. Take the D and Ktr values at
700 °C for the step-wise switch from 0.05-0.206 atm for instance, as shown in Table 4.5, the D and
Ktr values obtained in this work are 1-2 orders of magnitude higher, especially the surface exchange
coefficients. In addition to the difference in ECR setups, this is also assumed to concern the lower
density of measured samples, due to the inhomogeneity from the shaping and distortion of bar-shaped
samples during the sintering procedure, which could definitely favour the bulk diffusion of oxygen.
Chapter 4 Oxygen nonstoichiometry and transport properties
125
700 °C 0.05atm-air GBCO [21] GBCO GBCN03 GBCN06 GBCF03 GBCF06
D (cm2 s-1) 1.93×10⁻⁶ 6.02×10⁻⁴ 3.86×10-5 × 1.99×10-5 1.30×10⁻⁵
[36] Li, N.; Lu, Z.; Wei, B. O.; Huang, X. Q.; Chen, K. F.; Zhang, Y. Z.; Su, W. H. Journal of Alloys and Compounds 2008, 454, 274-279.
[37] Bharathi, A.; Yasodha, P.; Gayathri, N.; Satya, A. T.; Nagendran, R.; Thirumurugan, N.; Sundar, C. S.; Hariharan, Y. Phys. Rev. B 2008, 77, 8.
[38] Taskin, A. A.; Lavrov, A. N.; Ando, Y. Phys. Rev. B 2006, 73, 121101.
[39] Taskin, A. A.; Ando, Y. Physical Review Letters 2005, 95, 176603.
[40] Tang, Y. K.; Almasan, C. C. Phys. Rev. B 2008, 77, 5.
[41] Stevenson, J. W.; Armstrong, T. R.; Carneim, R. D.; Pederson, L. R.; Weber, W. J. J. Electrochem. Soc. 1996, 143, 2722-2729.
[42] Zuev, A.; Petrov, A.; Vylkov, A.; Tsvetkov, D. Journal of Materials Science 2007, 42, 1901-1908.
[43] Mauvy, F.; Bassat, J. M.; Boehm, E.; Dordor, P.; Grenier, J. C.; Loup, J. P. In 8th International Conference on Electronic Ceramics and Their Applications (ELECTROCERAMICS VIII); Elsevier Sci Ltd: Rome, ITALY, 2002, p 1265-1269.
[44] Kim, S.; Wang, S.; Chen, X.; Yang, Y.; Wu, N.; Ignatiev, A.; Jacobson, A.; Abeles, B. J. Electrochem. Soc. 2000, 147, 2398-2406.
[45] Wang, S.; van der Heide, P. A. W.; Chavez, C.; Jacobson, A. J.; Adler, S. B. Solid State Ion. 2003, 156, 201-208.
[46] Girdauskaite, E.; Ullmann, H.; Vashook, V. V.; Guth, U.; Caraman, G. B.; Bucher, E.; Sitte, W. Solid State Ion. 2008, 179, 385-392.
[47] Bassat, J. M.; Petitjean, M.; Fouletier, J.; Lalanne, C.; Caboche, G.; Mauvy, F.; Grenier, J. C. Applied Catalysis A: General 2005, 289, 84-89.
[48] Mauvy, F.; Bassat, J. M.; Boehma, E.; Dordor, P.; Loup, J. P. Solid State Ion. 2003, 158, 395-407.
[49] Albert Tarancón, S.; Chater, R.; Hernández-Ramírez, F.; Kilner, J. Journal of Materials Chemistry 2007, 17.
Chapter 5 Conclusion
134
Chapter 5 Conclusion
Summary
This work is mainly concerned with the mixed conducting double layered perovskite
GdBaCo2O5+δ which has been investigated as potential cathode materials for solid oxide fuel cells
operating in the intermediate to low temperature range, aiming to improve the electrode performance
by Ni and Fe substitution for Co as well as better understand the oxygen transport properties in these
materials and the oxygen reduction performance for cathode application.
Firstly GdBaCo2-xMxO5+δ (M=Ni or Fe, x = 0.1, 0.2 …) have been synthesized trough different
methods, and highly substituted compounds with solubility until x = 0.8 for both Ni and Fe cases are
obtained by either modified gel combustion process or microwave-assisted combustion route. Finally,
five composition were selected for further investigation with x = 0, 0.3, 0.6, as GBCO, GBCN03,
GBCN06, GBCF03 and GBCF06 for short.
Detailed crystal structural information was obtained by Rietveld refinement on the X-ray powder
diffraction data. By increasing Fe substitution, an orthorhombic (P4/mmm, ap×ap×2ap) to tetragonal
(P4/mmm, ap×ap×2ap) phase transition was shown when x >0.4, whilst Ni substitution seemed to
enhance the orthorhombic distortion. Combined with the oxygen contents determined by iodometry
and thermogravimetric for air-annealed samples, showing Fe substitution decreased the oxygen
content, this observed phase transition could be related to the oxygen re-odering caused by Fe
substitution. DSC results showed that both Ni and Fe substitution could reduce the temperature for the
high temperature phase transition, except those GBCF compound exhibiting already tetragonal phase
at room temperature. A particular case was found in GBCF06, for which no phase transition was
observed through DSC, but temperature dependent XRD showed a tetragonal-orthorhombic-tetragonal
in the temperature range 100-300 °C.
In addition, the thermal expansion coefficients were calculated based on the evolution of
structural parameters as a function of temperature extracted from refinement of XRD data. Ni
substitution was shown to decrease the TEC, while the Fe substitution showed the inverse. However,
the obtained TECs are still too large compared to those of currently used electrolytes such as CGO
applied in this work.
Chapter 5 Conclusion
135
Electrochemical characterization have been carried out with different configurations to evaluate
the electrode performance in GBCO and Ni, Fe-substituted GBCM (M=Ni, Fe) and also to understand
the oxygen reduction reaction taking place on these materials. Symmetric cells on CGO electrolytes
were fabricated trough screen-printing deposition and measured under both air and reducing
atmosphere. However, SEM showed some negative electrode morphologies, such as big electrode
grains and poor electrode thickness (~10 μm) which could possibly lower the cathode performance
and contribute to the large ASR values obtained in this work.
Under air condition; with the decrease of temperature, transfer process at the electrode/electrolyte
interface, which is usually represented as impedance spectra arcs at high frequency, became
predominant, especially for Fe-substituted GBCF. This gives rise to the assumption that Fe
substitution might enhance the oxygen charge transfer process, by introducing higher oxygen vacancy
concentration in combination with the higher level of oxygen nonstoichiometry caused by Fe
substitution. In all cases, the whole oxygen reduction reaction is co-limited by the interfacial charge
transfer process with very weak 2OP dependence, and the oxygen surface exchange or/and solid state
diffusion on cathode, which is associated with variation of reaction order m. With respect to the
possible species involved and high ionic conduction in this series of materials, oxygen surface
absorption/desorption involving atomic oxygen and bulk diffusion are supposed to dominate rather
than surface diffusion along the electrode to electrode/electrolyte interface or the gas phase diffusion.
Both Ni and Fe doping has increased the electrode polarisation resistance compared with the pristine
GBCO, which is in agreement with the single cell tests of GBCO and GBCF by A. Kulka using same
electrode materials fabricated in this work. With proton conducting electrolyte La0.995Ca0.005NbO4, the
electrode performance is limited by the ionic charge transfer process especially at low temperature
range, due to fact that the protons are the major charge carrier and dominate the low temperature ionic
conducting which could be enhanced by the presence of water vapour. Comparatively large
polarisation resistance values and low electrolyte conductivity are obtained due to the poor interfacial
connectivity observed by SEM.
The oxygen nonstoichiometry at high temperatures has been measurement by thermogravimetry
analysis (TGA) as a function of oxygen partial pressure, meanwhile the thermodynamic factor γ is
obtained by the linear regression over the investigated 2OP ranges. It has confirmed that the Fe
substitution give rise to an increase of oxygen nonstoichiometry at high temperatures, whereas the
materials show a tetragonal structure with two-dimensional distribution of oxygen vacancies. The
Chapter 5 Conclusion
136
overall electrical conductivity in air exhibits a low temperature metal-insulator transition as well as a
p-type metallic-like behaviour at high temperature, which was confirmed by the measurements of
electrical conductivity as a function of oxygen partial pressure at constant temperatures. A remarkable
decrease in overall conductivity with increasing Fe proportion was observed. Nevertheless, over the
temperature range of 300-800 °C, all the investigated materials have a total electrical conductivity
larger than 100 S cm-1, being suitable for cathode materials in IT-SOFCs at the operating temperature.
An electrical conductivity relaxation measurement system has been mounted to investigate the
oxygen transport kinetics using dense bar sample. Unfortunately, identical high density was not
achieved, thus low density value and discrepancy between different samples require careful
examination for the reliability of fitted results. Based on the chemical diffusion coefficients D and
surface exchange coefficients Ktr values obtained from fitting the experimental data over the
investigated temperature ranges, all the five materials could be taken as fast oxygen ion conductors. In
addition, both temperature and oxygen partial pressure dependences have been observed, as well as
very small activation energies for D and Ktr. Moreover, the tracer-self diffusion coefficients have
been calculated by using the thermal dynamic factors. The obtained values of D and Ktr, as well as D*,
in this work are comparatively significant, even orders of magnitudes higher than the results from
previous work on GBCO, possibly due to the inconsistent sample density, large reactor volume or bad
signal and noise. .
In general, the Ni substitution does not show obvious influence on neither electrical conductivity
nor oxygen transport. On the contrary, the Fe substitution which increased the oxygen
nonstoichiometry at the investigated temperatures was initially supposed to enhance the electrical and
electrochemical properties, but finally it shows inverse results throughout these measurements. For
example, the GBCF06 possesses the highest oxygen vacancies concentrations, which were supposed to
have high concentration of electron holes, was firstly assumed to favour the oxygen bulk diffusion and
electrical conductivity, respectively. In the contrast, lowest electrical conductivity values and chemical
diffusion coefficient have been obtained for GBCF06. Nevertheless, this needs further investigation
with improved experimental setup in order to avoid or diminish the external influence such as sample
density and signal quality.
Chapter 5 Conclusion
137
Perspectives
Further studied could be devoted to improve in several ways.
Firstly, the evaluation of oxygen transport kinetics concerns more experimental optimizations,
including ameliorating the measurement system such adoption of small reactor or elimination of signal
noise, and also fabrication of identical samples. Referring to results in this work, considered oxygen
diffusion and surface exchange rate could be expected.
Even Ni substitution was proved to be able to reduce the TEC to some extend, generally its effect
is still far from the requirement matching other cell components, especially the electrolyte. Thus,
morphology optimization seems to be necessary. Firstly, the electrode should be deposited with
thicker layers than those used in this work, for example ~15-30 μ m, to proved sufficient active zone
for the oxygen reduction reaction. Also, the precursor powders of electrode materials is suggested to
be well ball milled to get smaller grain size, and in conjunction with processing control, larger specific
surface on electrode could be obtained, providing increasing gas/electrode interfaces for oxygen
incorporation. In addition, utilization of interlayer between electrolyte and electrode or composite
electrodes is still promising technology.
As Ni and Fe have been test as substitution for Co, and different influences on the investigated
properties are obvious in evidence. Some other transition metals which haven been used as B-site
substation in perovskites and RP structure oxide compounds could also be considered, such as Cu, Mn,


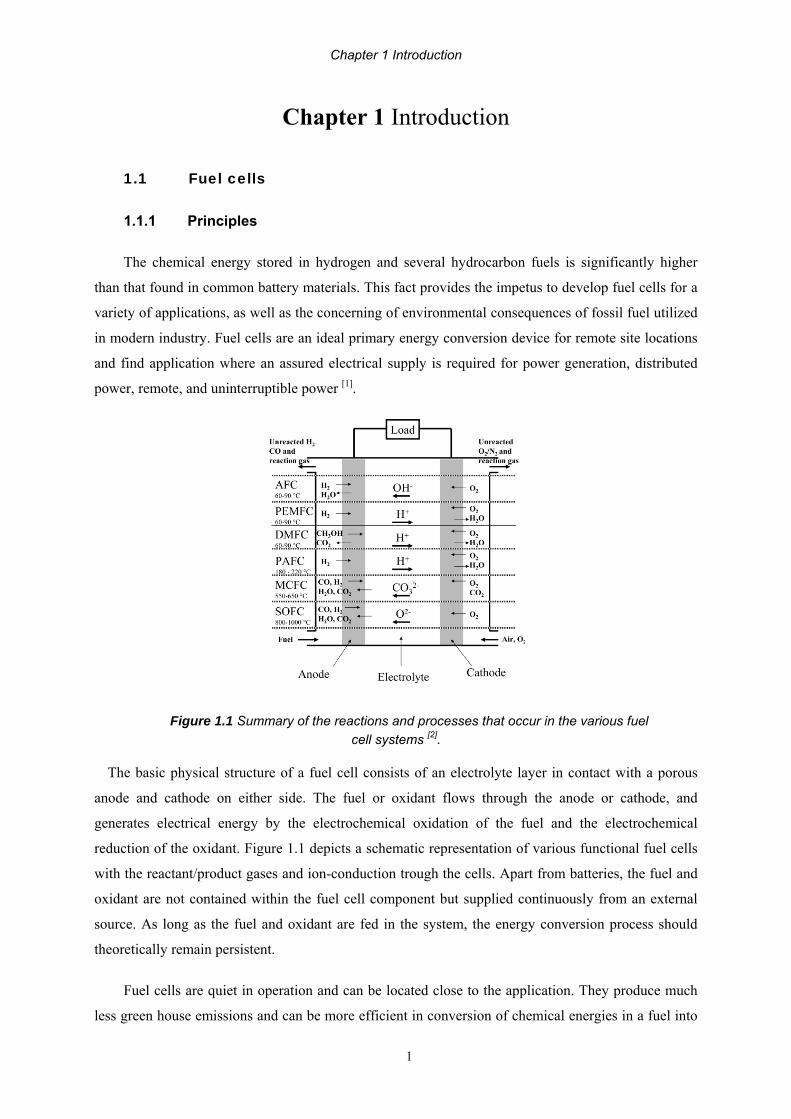


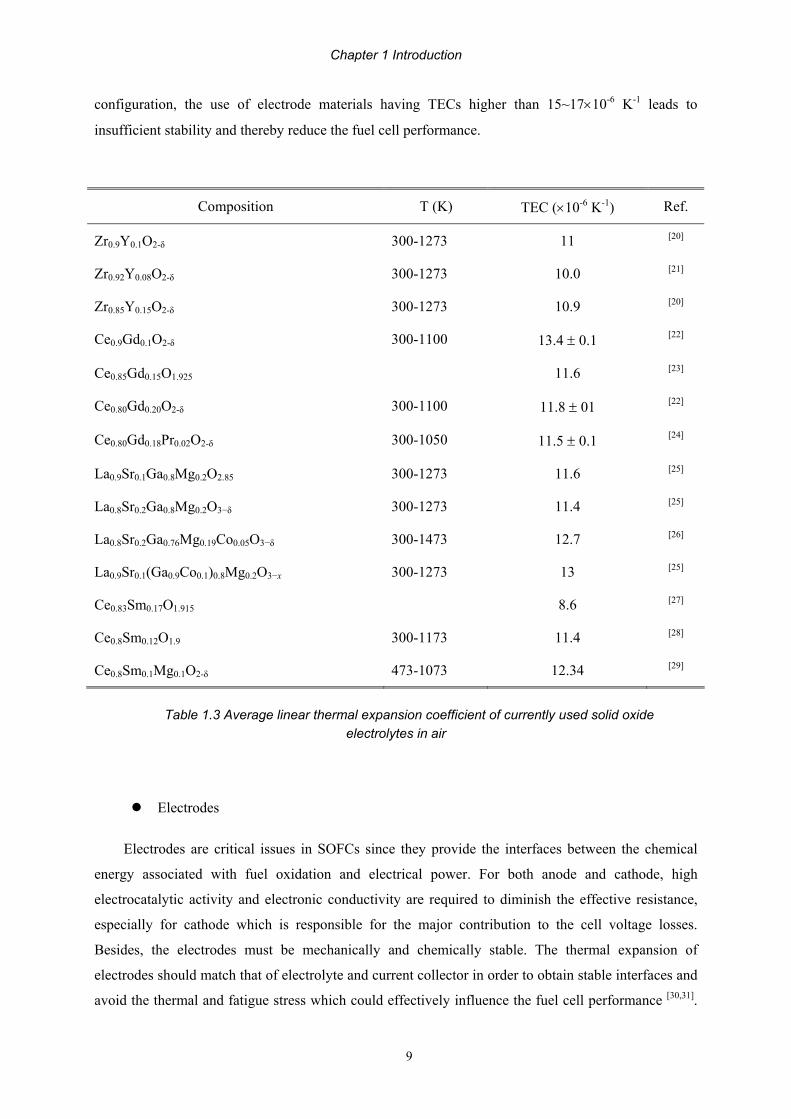


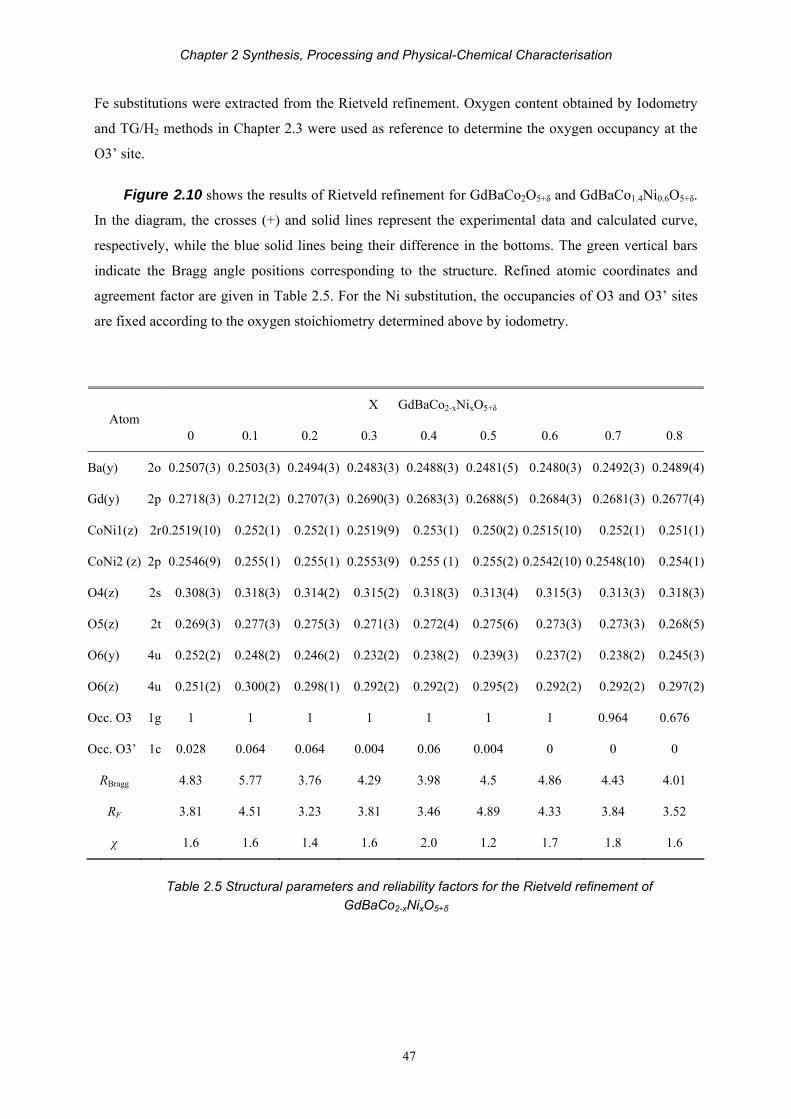


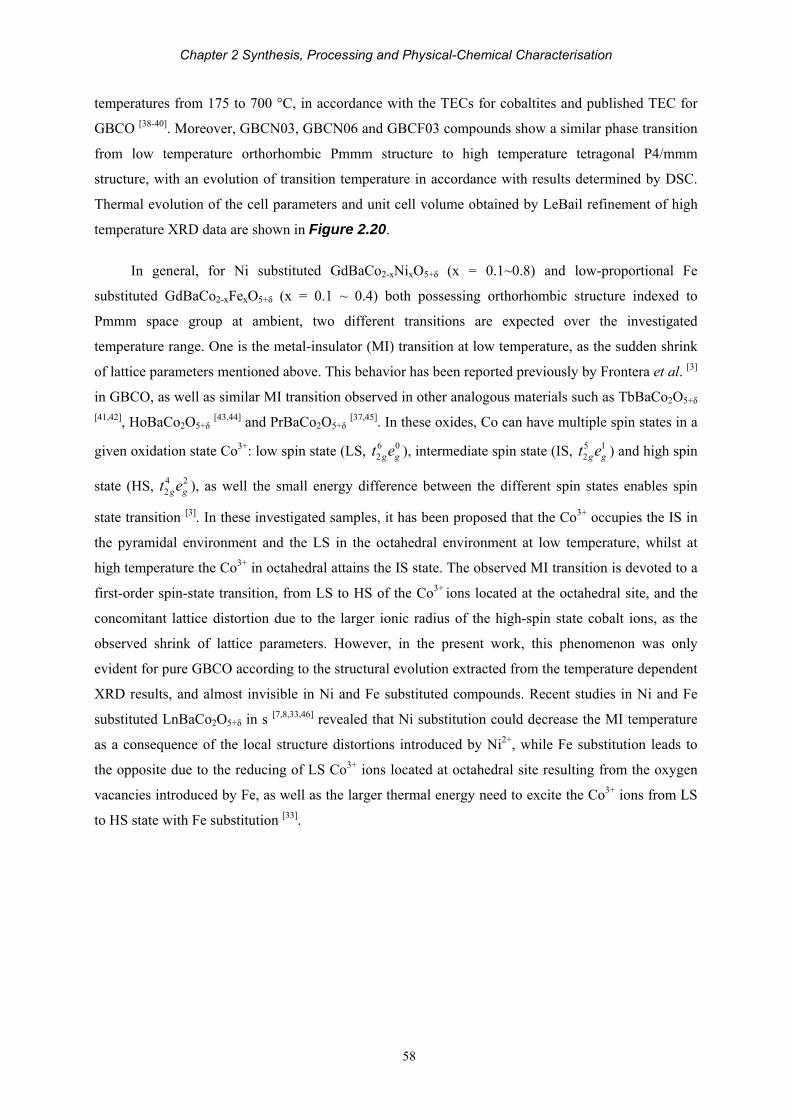


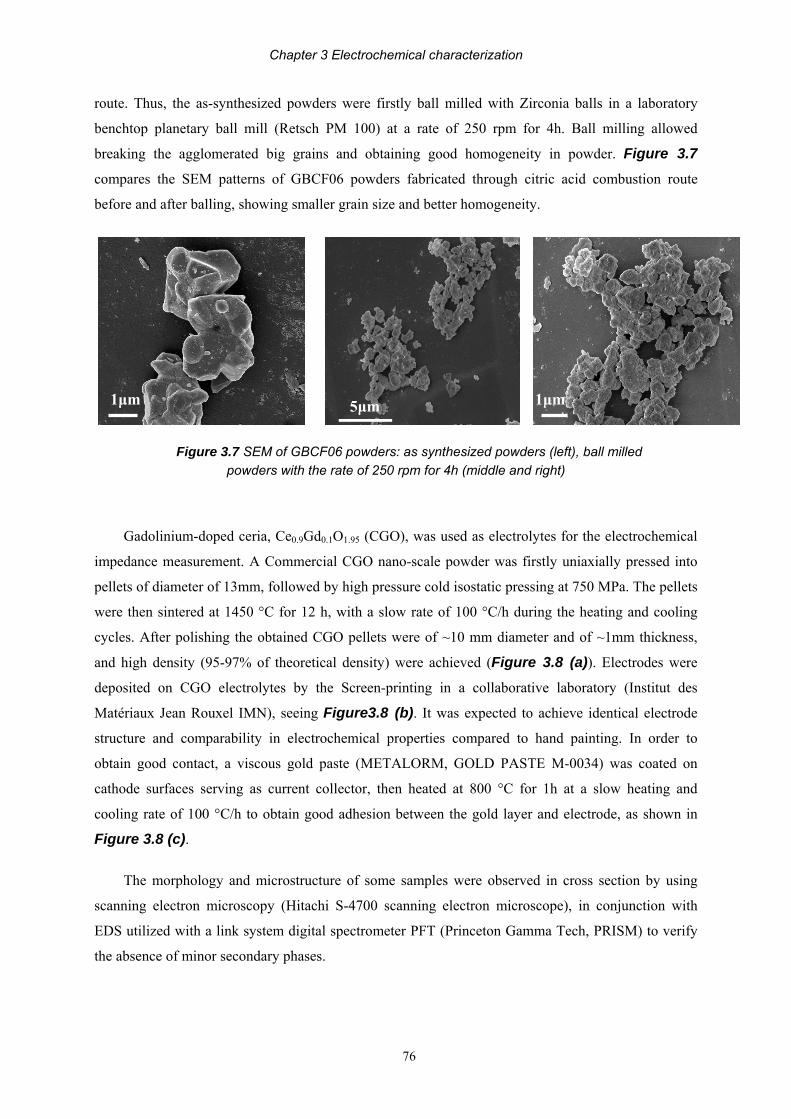


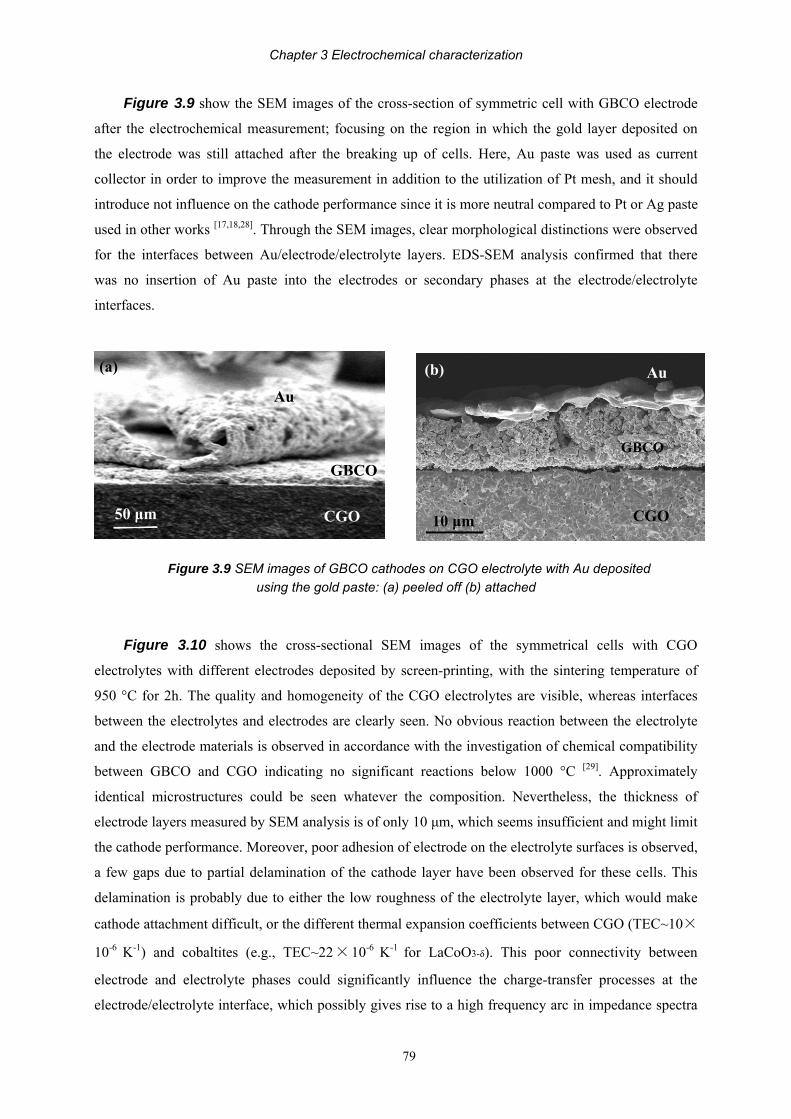


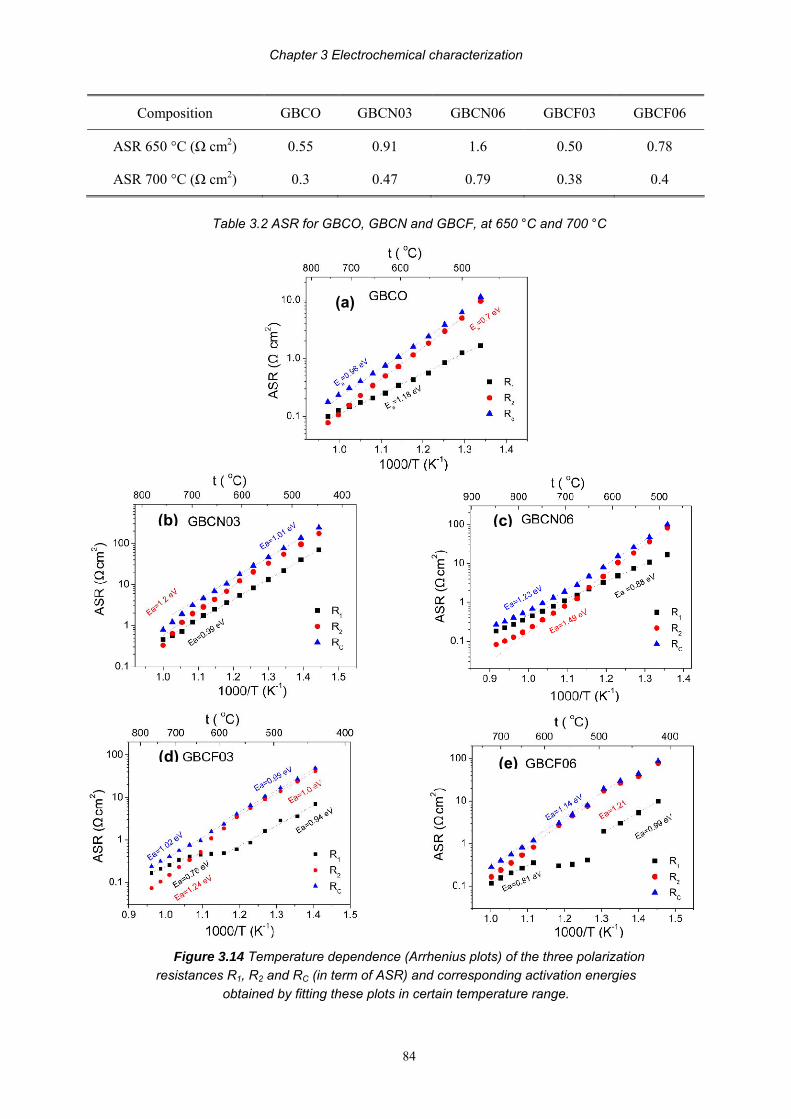


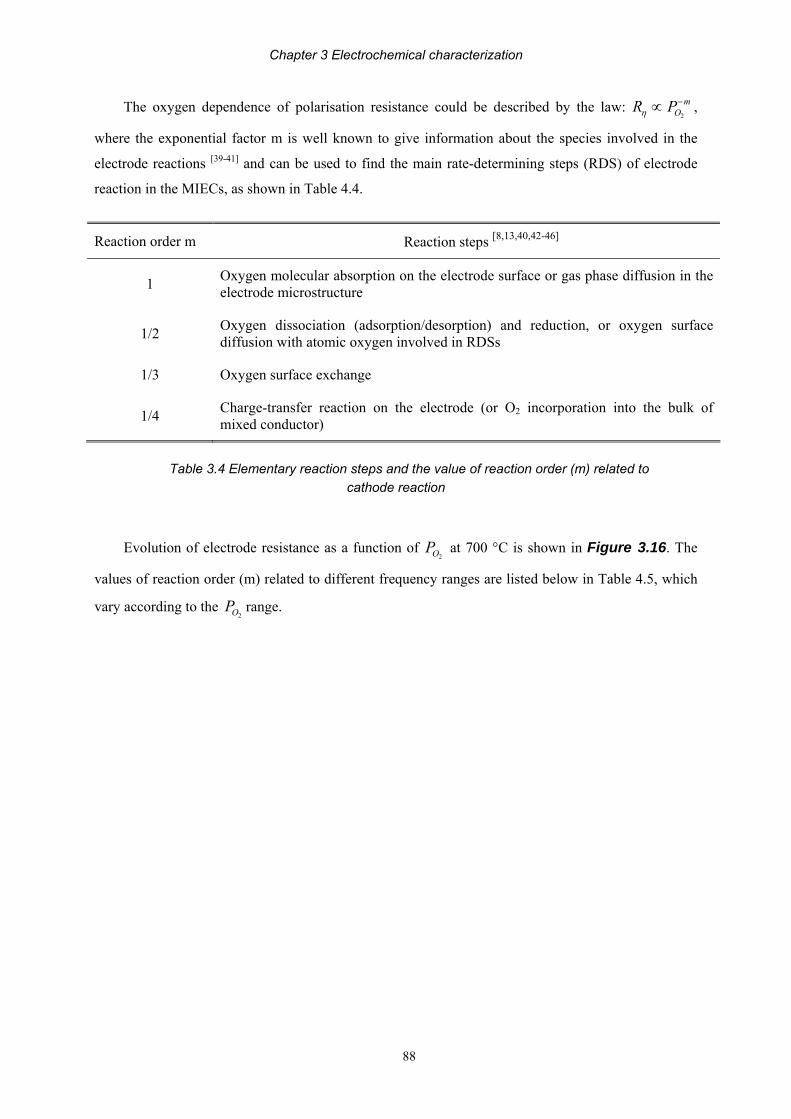


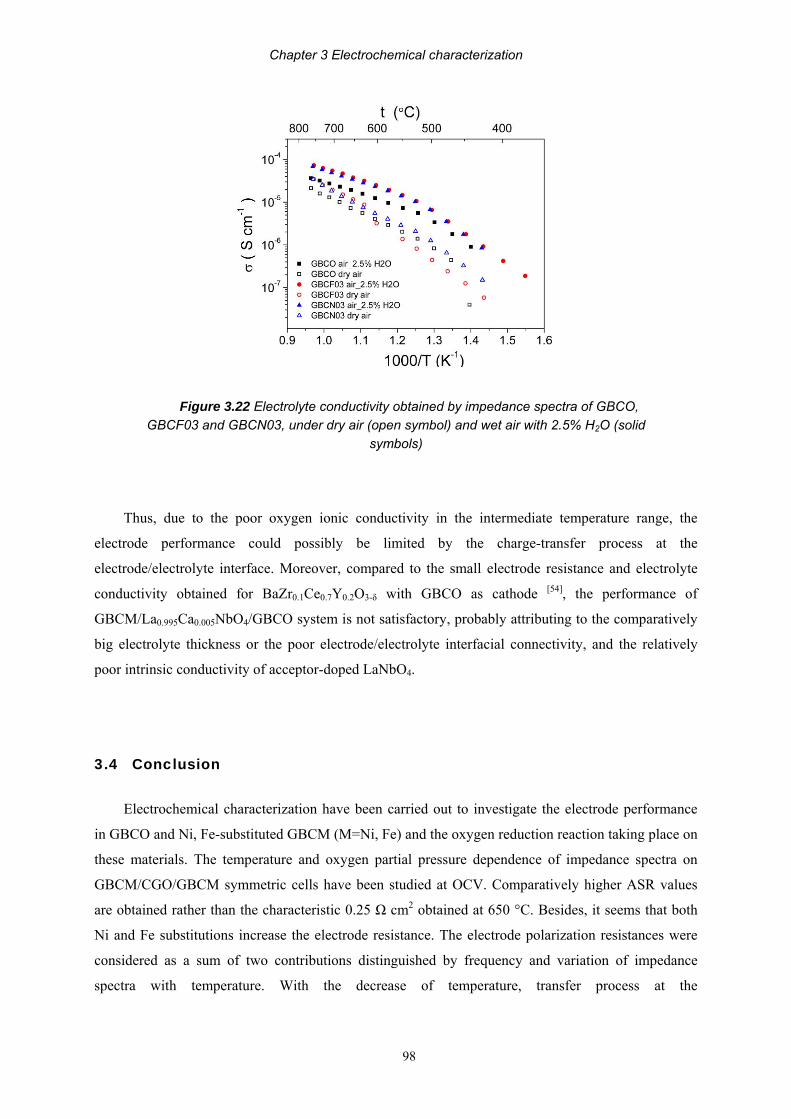


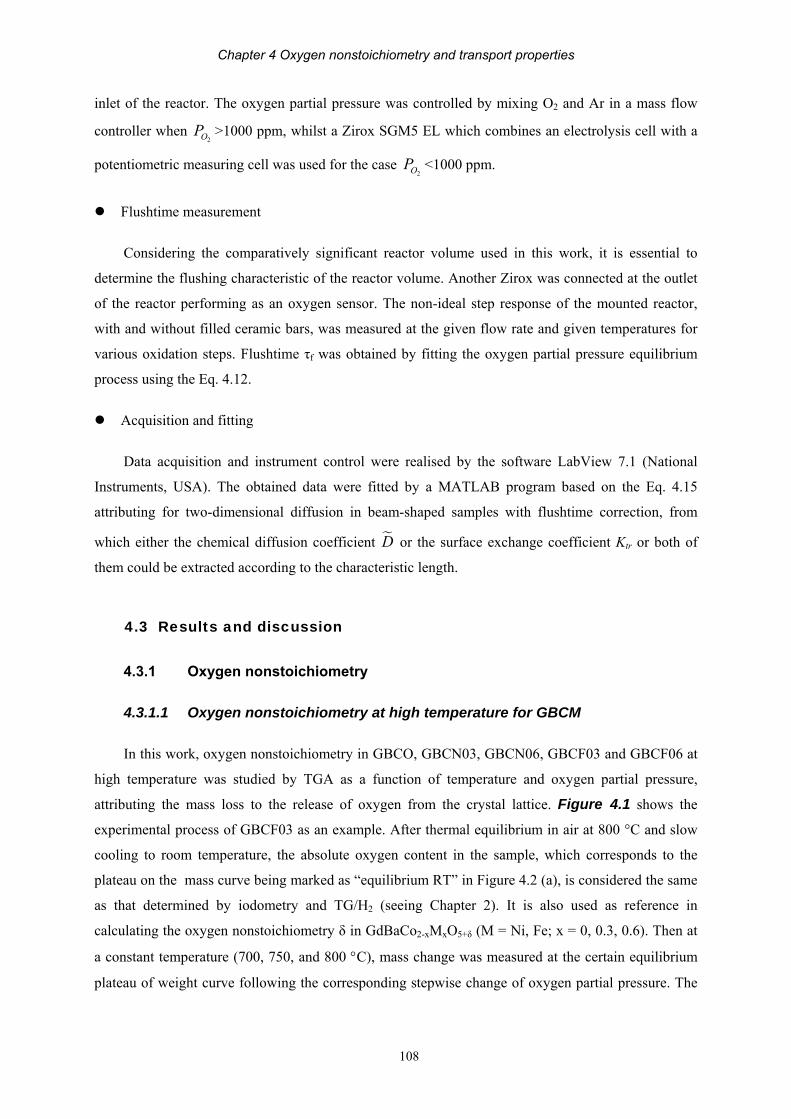


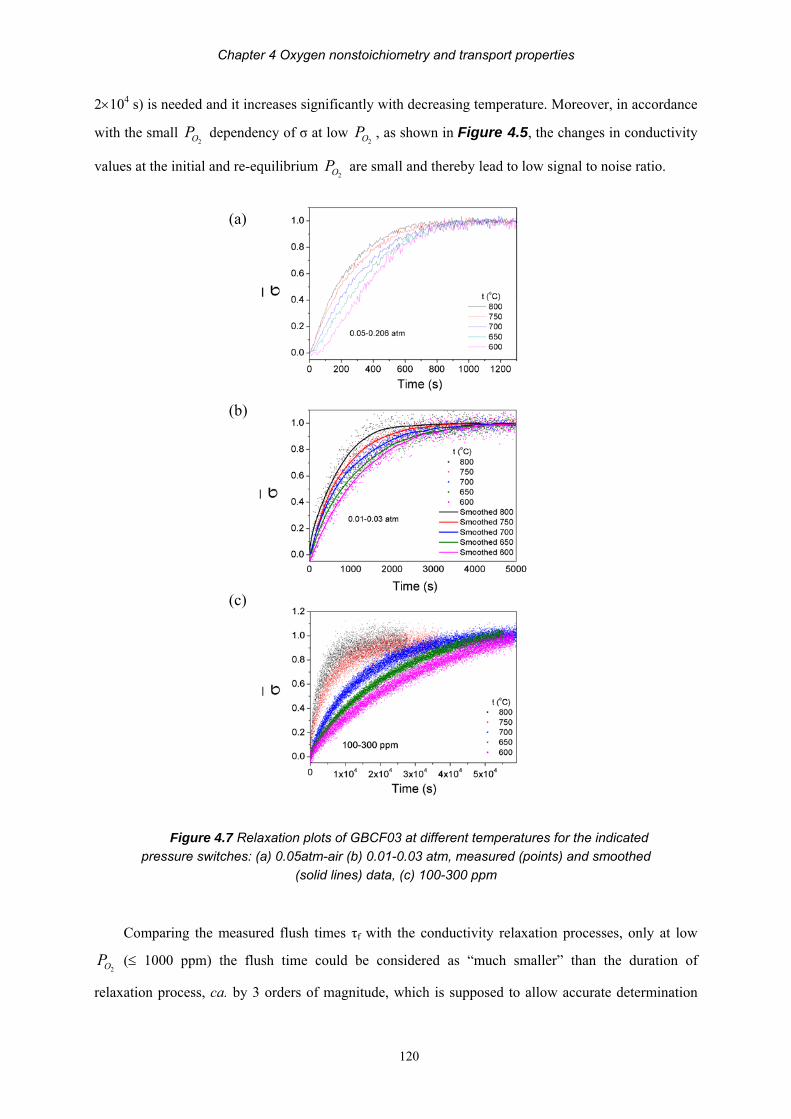


![Quantitative visualization of flow inside an automotive ...-0.2-0.1 0.0 0.0 0.1 0.2 0.3x [m] y [m] V [m/s] y xy x A a) Cool-vent mode V [m/s]-0.3-0.2-0.1 0.0 0.0 0.1 0.2 0.3x [m] y](https://static.documents.pub/doc/80x56/6005c0f59988167be95732aa/quantitative-visualization-of-flow-inside-an-automotive-02-01-00-00-01.jpg)


