* Department of Electrical and Computer Engineering, University of Illinois at Urbana-Champaign
Jee Hyun Choi, Martin Wolf, Larisa Safonova, Ursula Wolf, and Enrico GrattonLaboratory for Fluorescence Dynamics, Department of Physics, University of Illinois at Urbana-Champaign, 1110
____________________________________________________________________________________References and links
1. E. Gratton, W. W. Mantulin, vande M. J. Ven, J. B. Fishkin, M. B. Maris, and B. Chance, “The possibilityof a near-infrared imaging system using frequency-domain methods,” Proc. Third Intl. Conf.: Peacethrough Mind/ Brain Science, 183-189, Hamamatsu City, Japan (1990)
2. M. S. Patterson, J. D. Moulton, B. C. Wilson , “Frequency-domain reflectance for the determination of thescattering and absorption properties of tissue”, Appl. Opt. 30, 4474-4476 (1991b)
3. B. Tromberg, L. O. Svaasand, T. Tsay, R. C. Haskell, “Properties of photon density waves in multiple-scattering media,” Appl. Opt. 32, 607-616 (1993)
4. M. Firbank, E. Okada, D. T. Delpy, “A theoretical study of the signal contribution of regions of the adulthead to near-infrared spectroscopy studies of visual evoked responses,” Neuroimage 8, 69-78 (1998)
5. T. O. McBride, B. W. Pogue, U. L. Osterberg, K. D. Paulsen, “Separation of absorption and scatteringheterogeneities in NIR tomographic imaging of tissue,” in Biomedical Topical Meetings, OSA TechnicalDigest (Optical Society of America, Washington DC, 2000), pp.339-341.
6. B. Chance, Z. Zhuang, C. Unah, C. Alter, L. Lipton, “Cognition-activated low-frequency modulation oflight absorption in human brain,” Proc. Natl. Acad. Sci. U S A. 90, 3770-4 (1993)
7. B. Chance, E. Anday, S. Nioka, S. Zhou, L. Hong, K. Worden, C. Li, T. Murray, Y. Ovetsky, D. Pidikitiand R. Thomas, “A novel method for fast imaging of brain function, non-invasively, with light,” Opt.Express 2, 411-423 (1998) http://www.opticsexpress.org/oearchive/source/4445.htm
8. A. Villringer, B. Chance, Non-invasive optical spectroscopy and imaging of human brain function, TrendsNeurosci. 20, 435-42 (1997)
9. V. Toronov, M. Wolf, A. Michalos, and E. Gratton, “Analysis of cerebral hemodynamic fluctuationsmeasured simultaneously by magnetic resonance imaging and near-infrared spectroscopy,” WA5, Proc.OSA Technical Digest, Biomedical Topical Meeting (2000)
(C) 2001 OSA 8 October 2001 / Vol. 9, No. 8 / OPTICS EXPRESS 417#35023 - $15.00 US Received August 20, 2001; Revised October 08, 2001
10. V. Toronov, A. Webb, J. H. Choi, M. Wolf, A. Michalos, E. Gratton E., and D. Hueber, “Investigation ofhuman brain hemodynamics by simultaneous near-infrared spectroscopy and functional magneticresonance imaging”, Med. Phys. 28, 521-527(2001)
11. S. Wray, M. Cope, D.T. Delpy, J. S. Wyatt, and E. O. Reynolds, "Characterization of the near infraredabsorption spectra of cytochrome aa3 and haemoglobin for the non-invasive monitoring of cerebraloxygenation", Biochim. Biophys. Acta 933, 184-192 (1988).
12. S. Fantini, M. A. Franceschini and E. Gratton., “Semi-infinite geometry boundary problem for lightmigration in highly scattering media: a frequency-domain study in the diffusion approximation”, J. Opt.Soc. Am. B 11, 2128-2138 (1994).
13. T. Durduran, A.G. Yodh, B. Chance, and D.A. Boas, “Does the photon-diffusion coefficient depend onabsorption?,” J. Opt. Soc. Am. A 14, 3358-3365 (1997).
14. D.J. Durian, “The diffusion coefficient depends on absorption,” Opt. Lett. 23, 1502-1504 (1998).15. M. Bassani, F. Martelli, G. Zaccanti, and D. Contini, “Independence of the diffusion coefficient from
absorption: experimental and numerical evidence,” Opt. Lett. 22, 853-855 (1997).16. V. Toronov, M. A. Franceschini, M. Filiaci, S. Fantini, M. Wolf, A. Michalos, and E. Gratton, “Near-
infrared study of fluctuations in cerebral hemodynamics during rest and motor stimulation: temporalanalysis and spatial mapping”, Med. Phys. 27, 801-15 (2000).
17. A. Maki, Y. Yamashita, Y. Ito, E. Watanabe, Y. Mayangi, and H. Koizumi, “Spatial and temporal analysisof human motor activity using non-invasive NIR topography”, Med. Phys. 22, 1997-2005 (1995).
18. L. A. Paunescu, A. Michalos, J. H. Choi, U. Wolf, M. Wolf, and E. Gratton, “In vitro correlation betweenreduced scattering coefficient and hemoglobin concentration of human blood determined by near-infraredspectroscopy”, Proceedings of SPIE 4050, 319-325 (2001).
19. S. Fantini, D. Hueber, M. A. Franceschini, E. Gratton, W. Rosenfeld, P. G. Stubblefield, D. Maulik, M.R. Stankovic, “Non-invasive optical monitoring of the newborn piglet brain using continuous-wave andfrequency-domain spectroscopy”, Phys. Med. Biol. 44(6), 1543-1563 (1999).
20. I. Miller and J. E. Freund, Probability and Statistics for Engineers, Prentice-Hall, (1977).21. K. J. Friston, P. Jezzard, and R. Turner, “Analysis of Functional MRI Time-Series”, Human Brain
The method of frequency-domain near-infrared spectroscopy (NIRS) of biological tissues hasa number of advantages over continuous-wave NIRS [1-3]. Using numerical simulations oflight propagation in the human head Firbank et al. [4] showed that the spatial profile of thesensitivity of phase to changes in optical properties spreads deeper into the brain tissuecompared to the sensitivity profile of the amplitude. Also, frequency-domain NIRS allowsbetter separation of absorption and scattering properties of tissue [1], which is important forimaging heterogeneous tissues [5]. However, it is usually difficult to obtain a sufficiently highsignal-to-noise ratio in the phase signal to perform dynamic measurements. Although manyresults on measuring brain hemodynamics using continuous-wave NIRS have been published[6-10], no measurement of hemodynamic changes using the phase of frequency-domain NIRSsignal have been reported to date. The goal of the study presented here was to explore thepossibility of detecting hemodynamic changes in the brain using frequency-domain NIRS.
To obtain phase signals at the highest possible signal-to-noise ratio, we performed aseries of simultaneous NIRS-fMRI measurements, with subsequent correlation of the timecourses of both measurements. The cognitive paradigm used arithmetic calculations, withoptical signals acquired with sensors placed on the forehead. The arithmetic calculationparadigm was selected because it is known to cause activation in the regions of the frontalcortex situated under the areas of the head surface that are usually free from hair [6,7]. Tomeasure cerebral hemodynamics independently from NIRS, simultaneous fMRI of the brainwas employed. In our previous studies of functional brain hemodynamics by simultaneousNIRS and fMRI we observed distortions of functional signals measured by NIRS, which werepresumably caused by the hemodynamic fluctuations in extracranial tissues [10]. To accountfor the hemodynamic changes in different tissue layers we designed an optical sensor having aset of short and long source-detector distances. The short-distance signals were used to correctfor the contributions of superficial and systemic fluctuations in the long-distance opticalsignals. Following our previous study of functional hemodynamics in motor cortex by
(C) 2001 OSA 8 October 2001 / Vol. 9, No. 8 / OPTICS EXPRESS 418#35023 - $15.00 US Received August 20, 2001; Revised October 08, 2001
simultaneous NIRS and fMRI [10], we used correlation analysis to reveal correlation in thetime course of NIRS signals with the cerebral hemodynamic changes.
In this study, we found that, not only can functional hemodynamic changes in a largevolume of the brain tissue be detected using the phase of intensity modulated light, but alsothat the phase can be sensitive to relatively weak local spontaneous cerebral fluctuations.
2. Instrumentation and experimental setup
For NIRS measurements we used a two-wavelength (758 and 830 nm) frequency-domain(110 MHz modulation frequency) Oximeter (ISS, Champaign, IL), which had sixteen laserdiodes (eight for each wavelength) and two photomultiplier tube detectors. At a wavelength of758 nm light absorption by the deoxy-hemoglobin (HHb) substantially exceeds absorption bythe oxy-hemoglobin (O2Hb), while at 830 nm the O2Hb absorption is much higher than theHHb absorption. The laser diodes operated in a sequential multiplexing mode with 40 ms“on” time for each diode. The whole acquisition cycle for 16 light sources was 640 ms. Lightemitted by the laser diodes was guided to the tissue through 10m long multi-mode silicaoptical fibers (CUDA, FL). Two 10m long glass fiber bundles collected the scattered light andguided it to the detectors. The paired (758 and 830 nm wavelength) source fibers wereattached to the sensor at 8 positions.
B
A
1
2
3 4
5 6
7 8
Source &Detector Distance
1A2A5B6B 8 mm
3B4B7B8B 11 mm
3A4A 25 mm
5A6A 30 mm
7A8A 36 mm
Source location
Detector location
Fig. 1. The optical sensor. At each location marked by numbers 1 - 8 there are two lightsources, at 830 nm and 758 nm
For this study we designed the optical sensor shown in Fig. 1. The sensor had twodetectors, marked as A and B in the figure, and sixteen paired sources at eight locationsmarked by numbers 1 through 8 (758 and 830 nm at each location). The distances betweensources at locations 3-8 and detector A ranged between 2.5 and 3.6 cm. These light channelswere used for measuring hemodynamic changes in the brain. The distances between sourcesat locations 3-8 and the detector B, as well as the distances between sources at locations 1 and2 and the detector A, were 0.8 cm or 1.1 cm (see Fig. 1). These light channels providedinformation on the hemodynamic fluctuations in superficial tissue near the main detector Aand near the main sources at locations 3-8. This information was used for the correction ofthe signals measured at large source-detector separations with respect to the contribution ofsuperficial and systemic fluctuations (see Section 3). To ensure that the light intensities fromall sources were within the dynamic range of the data acquisition card, the signal fromdetector A and the sources at locations 7 and 8 were attenuated using neutral density filters
(C) 2001 OSA 8 October 2001 / Vol. 9, No. 8 / OPTICS EXPRESS 419#35023 - $15.00 US Received August 20, 2001; Revised October 08, 2001
(Kodak). The optical sensor was attached to the left or right side of the subject’s foreheadabove the eyebrow above the sinuses.
Magnetic resonance imaging was performed using a 1.5 Tesla whole body MR scanner(Signa, General Electric Medical Systems, Milwaukee, WI) equipped with echospeedgradients and a standard circularly polarized birdcage head coil. Sagittal T1-weighted localizerscans were used to determine the correct plane for the functional scans. Gradient-echo echo-planar images were acquired using a data matrix of 64 x 64 complex points, TR=1280 ms, TE= 40 ms, FOV = 240 mm, slice thickness = 7 mm, no inter-slice gap, receiver bandwidth 62.5kHz, and flip angle 60o. Multi-modality radiological markers (IZI Medical Products Corp,Baltimore, MD) were embedded into the optical sensor to facilitate correct orientation of theMRI slices with respect to the sensor and to enable recovery of the sensor orientation for dataanalysis.
3. Data analysis
The major absorbers of near-infrared light in the human tissues are oxy- anddeoxyhemoglobin. Changes in the oxy- and deoxyhemoglobin concentrations (∆[O2Hb] and ∆[HHb], respectively) can be related to the changes of the tissue absorption coefficient λµa∆at the wavelength λ as
λλλ εεµ ][][2 ][][2 HHbHbOa HHbHbO ∆+∆=∆ , (1)
where λε ][ 2HbO and λε ][HHb are the extinction coefficients of oxy- and deoxyhemoglobin [11].
On the other hand, λµa∆ can be related to the changes in the recorded near-infrared signal
using solutions of the diffusion equation describing the transport of light in the highlyscattering medium. The simplest solution of the frequency-domain diffusion equation is [12]
2/12/122/1
]1)1[(2
−+
= xD
r aµφ , (2,a)
)4
ln()()ln( 02
1
cD
S
DrrU a
DC πµ +−= , (2,b)
)4
ln(]1)1[(2
)ln( 02/12/122/1
cD
ASx
DrrU a
AC πµ +++
−= , (2,c)
where c is the speed of light in the medium, UDC , UAC and φ are the intensity, modulationamplitude (AC) and phase of the photon density wave respectively, r is the distance from thesource to the point of measurement, µ's is the reduced scattering coefficient, and
D=[3(αµa+µ's)]-1
is the diffusion coefficient where the value of the parameter α may vary
between 0.2 and 1 depending on the experimental conditions [13-15]. S0
and A are the
strength and the modulation amplitude of the light source, respectively. The value of thedimensionless parameter x=ω/cµa is small at the modulation frequency ω of our instrument(110 MHz). The solution shown in Eqns. (2) is valid for an infinite homogeneous scatteringmedium and gives a good approximation to the exact solution for a homogeneous semi-infinite medium in the case of a large source-detector distance (r»D) [12]. Although theoptical properties of the head are not homogeneous, Eqns. (2) may be used for qualitative
(C) 2001 OSA 8 October 2001 / Vol. 9, No. 8 / OPTICS EXPRESS 420#35023 - $15.00 US Received August 20, 2001; Revised October 08, 2001
estimation of the time course of changes occurring in the brain provided that there are nosignificant fluctuations in the extracranial tissue or if such fluctuations can be removed fromthe signal by means of some correction procedure. Given the small size of x and keeping in
mind that for human tissues µa«µ's, one can see from Eqns.(2,b) and (2,c) that )ln( ACrU
and )ln( DCrU are proportional to - aµ . Examining Eq. (2a) one can see that under the
same conditions (µa«µ's and x«1) the phase is proportional to aµ/1 . This shows that a
small change in the absorption coefficient will produce a proportional decrease in the values
of φ, )ln( ACrU and )ln( DCrU . Also we can assume that relative variations in the
scattering due to changes in the oxy- and deoxyhemoglobin concentrations are smallcompared to the relative variations in absorption. There are two reasons for that. First, due tothe blood flow increase during functional activation no significant increase in the total bloodvolume occurs but rather exchange between the relative concentrations of HHb and HbO2
[16,17]. Second, moderate changes in tissue blood volume cause stronger relative changes inabsorption than in scattering at light wavelengths of 758 nm and 830 nm [18]. This is becauseat 758 nm and 830 nm the absorption is caused almost exclusively by hemoglobin, while thescattering is caused by the whole tissue, not only by the blood cells. Neglecting variation inscattering, change in the recorded signal can be related to small absorption change as:
aACACrU µσ ∆−=∆ )ln( , (3,a)
aDCDCrU µσ ∆−=∆ )ln( , (3,b)
aµσϕ φ ∆−=∆ , (3,c)
where ACσ , DCσ , and φσ are the differential path length factors (DPF) for the signal
modulation amplitude, intensity and phase, respectively [19]. One should note that at the
modulation frequency of 110 MHz ACσ ≈ DCσ . Thus, the time course of small changes in the
absorption at a given wavelength can be obtained from the changes in light intensity andphase up to the DPF. By measuring changes in the absorption at two wavelengths one canobtain ∆[O2Hb] and ∆[HHb] from Eqn. (1):
22
1212
1221
2 ]HbO[ λλλλ
λλλλ
εεεεεµεµ
HbOHbHbHbO
HbaHba
−∆−∆=∆ , (4,a)
22
1212
22
112
2
]HHb[ λλλλ
λλλλ
εεεεεµεµ
HbOHbHbHbO
HbOaHbOa
−∆−∆=∆ . (4,b)
In their numerical simulation study of the sensitivity of the frequency-domain nearinfrared signal to hemodynamic changes in different layers of the human skull Firbank et al.[4] showed that the signal is most sensitive to the changes in the superficial tissue adjacent tothe source and detector but the sensitivity decreases rapidly with depth. In our previous NIRSstudies of functional hemodynamics in the brain we found possible signal distortion byhemodynamic fluctuations in extracranial tissues [10]. These facts prompted correcting thelong-distance optical signal with respect to fluctuations contributed by superficial tissuelayers. For this we fitted every long-distance phase and AC signal from light channelsbetween source locations 3-8 and detector A with a linear combination of all short-distant
(C) 2001 OSA 8 October 2001 / Vol. 9, No. 8 / OPTICS EXPRESS 421#35023 - $15.00 US Received August 20, 2001; Revised October 08, 2001
signals (source locations 3-8 and detector B, and source locations 1 and 2 and detector A) atthe same wavelength using a multiple linear regression algorithm, and then subtracted this fit.The average signals were calculated from the six corrected long-distance AC or phase signalsand then used to calculate deoxyhemoglobin changes. The motivation for this procedure wasthat the subtraction of the multiple regression fit from a long-distance signal should eliminatecomponents in its time course that are correlated with the short-distance signals, and theaveraging of the corrected long-distant signals should emphasize the signal variationscommon for all long-distance signals. We expected this procedure to reduce both thecontribution of superficial fluctuations and systemic changes, i.e. changes which werecorrelated in all layers of the head. One should note that the signal correction procedure usingmultiple regression fit does not distort the signals since, if there is no correlation, theregression coefficients are equal to zero. Additionally, the data were linearly detrended andlow-pass filtered with a cut-off frequency of 0.2 Hz. This low-pass filtering excludedfluctuations of the time scale significantly shorter than the activation period, particularlyfluctuations due to respiration [9].
It is known that the blood oxygen level dependent (BOLD) fMRI signal (the change inthe intensity of the EPI images) is due to the changes in the deoxyhemoglobin concentration[10]. Namely, the increase of the BOLD signal corresponds to a decrease in [HHb]. The –∆[HHb] time series obtained from the AC and phase records with original acquisition periodof 640 ms were locked to the fMRI acquisition period (1280 ms) and then used as an indicatorfunction (a predictor) in the correlation analysis of the fMRI data.
For the analysis of fMRI data we used the MEDx 3.4 image processing package (SensorSystems, Inc.). Every measurement produced 500 sets of six axial 2D EPI slices (64×64matrix). with a repetition time of 1280 ms. The time series corresponding to the EPI imageintensity (the BOLD signal) at each voxel were cross-correlated with the predictor (–∆[HHb]time series) to calculate the correlation coefficient. Values of correlation coefficients werethen transformed to a z-score (which is a Gaussian distribution with zero mean and unitvariance [20]). Then the test of statistical significance of the z-values was performed using anuncorrected p-value of 0.005. The Bonferroni correction was applied to reduce the probabilityof false significance [21]. The resulting critical z-value corresponding to the correctedprobability threshold was used as a threshold in the final correlation maps.To obtain fMRI correlation maps showing activation due to the task a smoothed boxcarpredictor function instead of –�∆[HHb] time series was used. The maximum of this predictorfunction coincided with the middle of the activation periods, and the minimum correspondedto the middle of the relaxation periods. Correlation coefficients were calculated using theautocorrelation correction and assuming a hemodynamic response delay of 5 s. Theassessment of statistical significance and thresholding was performed in the same way aswhen using the � -∆[HHb] predictor.
4. Measurement protocol
The pairs of numbers separated by the “+” symbol were presented to the subjects using thefiber-optic goggles connected to a computer outside the magnet room. Every subjectperformed six 40s long calculation trials separated by the 20s periods of fixation. Duringfixation periods only the “+” symbol was presented. The beginning of the fMRI recording wastriggered by the program presenting the stimulus. The beginning of the fMRI recording andevery activation period were marked in the NIRS data to provide synchronization betweenfMRI and optical data records.
Seven healthy right-handed 20-38 year old subjects were screened. The optical sensorwas attached to the left or right side of the subject’s forehead above the eyebrow and thesinuses. The detector line was oriented parallel to the eyebrow. After the activation analysismeasurements were repeated with those subjects who exhibited activation under the non-hairyarea of the forehead with the optical sensor attached to the place where the activation occurred
(C) 2001 OSA 8 October 2001 / Vol. 9, No. 8 / OPTICS EXPRESS 422#35023 - $15.00 US Received August 20, 2001; Revised October 08, 2001
during the first measurement. The above protocol was approved by the Institutional ReviewBoard (protocol number 01075.)
5. Results
Analyzing task-related brain activation from fMRI data we found that in all subjects thecalculation stimulus caused most pronounced activation (in terms of z-score) in dorsal lateralareas of the frontal lobe, which were under the hairy skin and away from the optical sensorlocation. In some subjects activation was also detected in the lower part of the superior andmiddle frontal gyri under the non-hairy skin. However, during the second measurement thefrontal activation was reproduced at exactly the same location only in two subjects. In onesubject activation under the optical sensor was detected during the first measurement.
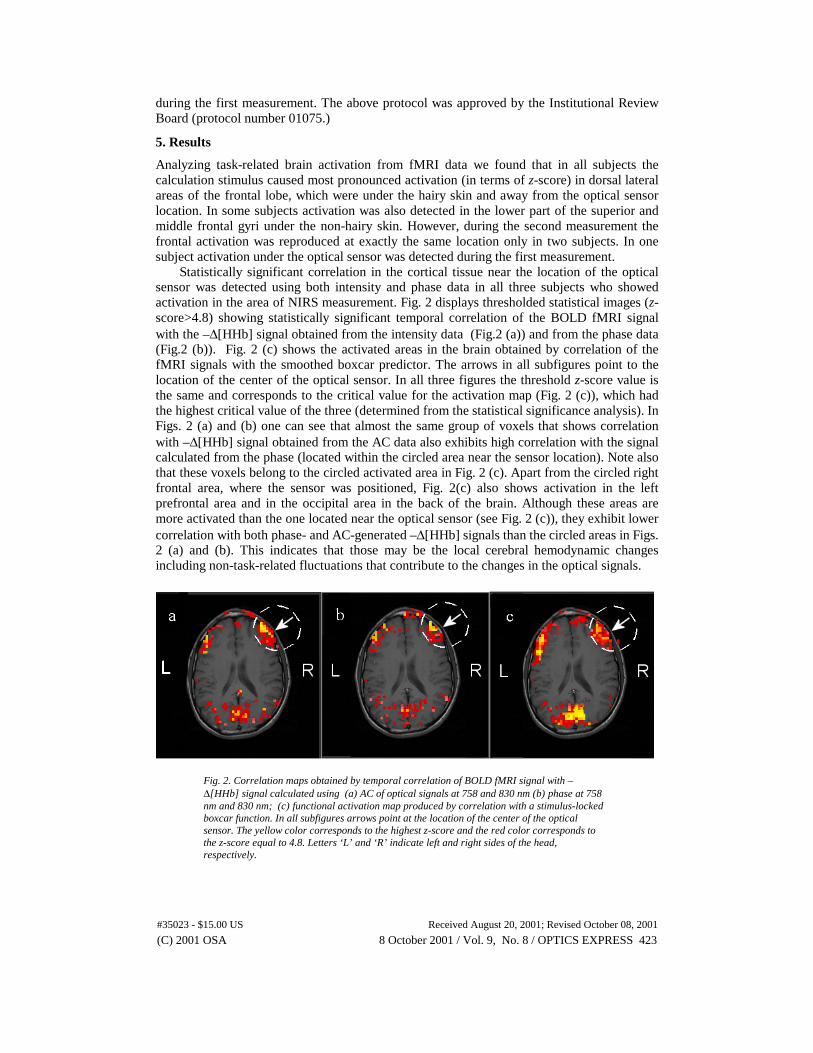
Statistically significant correlation in the cortical tissue near the location of the opticalsensor was detected using both intensity and phase data in all three subjects who showedactivation in the area of NIRS measurement. Fig. 2 displays thresholded statistical images (z-score>4.8) showing statistically significant temporal correlation of the BOLD fMRI signalwith the –∆[HHb] signal obtained from the intensity data (Fig.2 (a)) and from the phase data(Fig.2 (b)). Fig. 2 (c) shows the activated areas in the brain obtained by correlation of thefMRI signals with the smoothed boxcar predictor. The arrows in all subfigures point to thelocation of the center of the optical sensor. In all three figures the threshold z-score value isthe same and corresponds to the critical value for the activation map (Fig. 2 (c)), which hadthe highest critical value of the three (determined from the statistical significance analysis). InFigs. 2 (a) and (b) one can see that almost the same group of voxels that shows correlationwith –∆[HHb] signal obtained from the AC data also exhibits high correlation with the signalcalculated from the phase (located within the circled area near the sensor location). Note alsothat these voxels belong to the circled activated area in Fig. 2 (c). Apart from the circled rightfrontal area, where the sensor was positioned, Fig. 2(c) also shows activation in the leftprefrontal area and in the occipital area in the back of the brain. Although these areas aremore activated than the one located near the optical sensor (see Fig. 2 (c)), they exhibit lowercorrelation with both phase- and AC-generated –∆[HHb] signals than the circled areas in Figs.2 (a) and (b). This indicates that those may be the local cerebral hemodynamic changesincluding non-task-related fluctuations that contribute to the changes in the optical signals.
Fig. 2. Correlation maps obtained by temporal correlation of BOLD fMRI signal with –∆[HHb] signal calculated using (a) AC of optical signals at 758 and 830 nm (b) phase at 758nm and 830 nm; (c) functional activation map produced by correlation with a stimulus-lockedboxcar function. In all subfigures arrows point at the location of the center of the opticalsensor. The yellow color corresponds to the highest z-score and the red color corresponds tothe z-score equal to 4.8. Letters ‘L’ and ‘R’ indicate left and right sides of the head,respectively.
(C) 2001 OSA 8 October 2001 / Vol. 9, No. 8 / OPTICS EXPRESS 423#35023 - $15.00 US Received August 20, 2001; Revised October 08, 2001
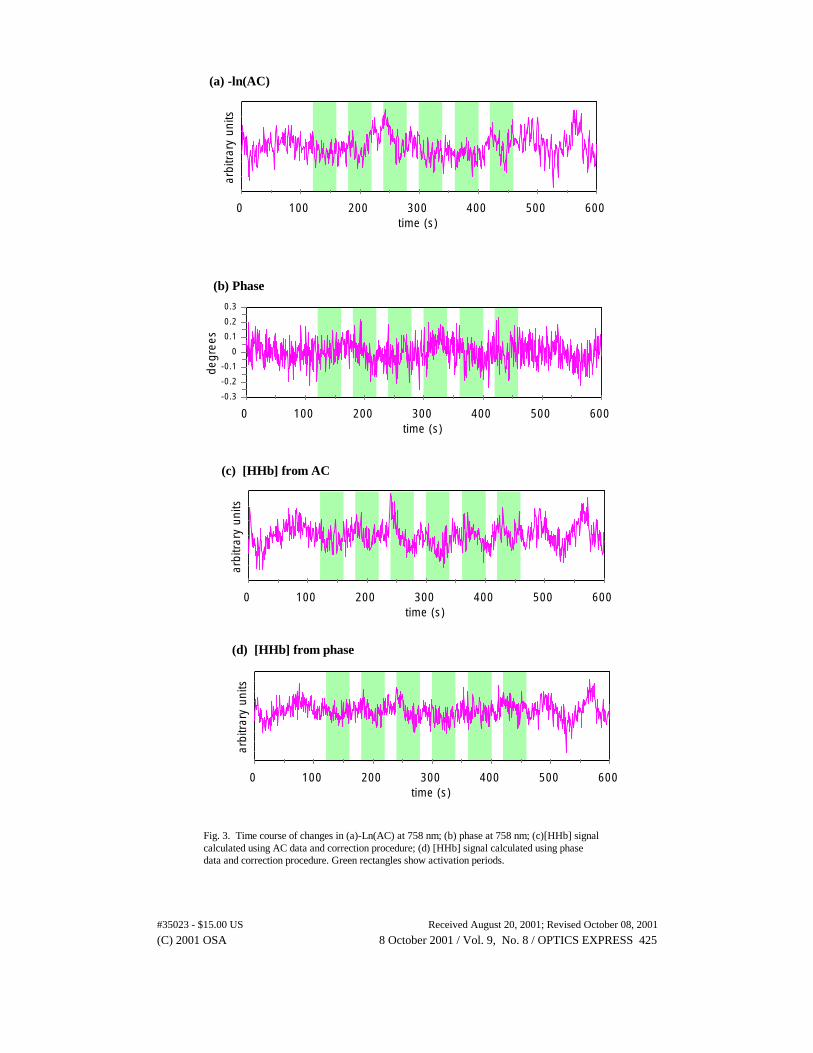
Fig.3 shows the time course of changes in (a)-ln(AC) at 758 nm, (b) phase at 758 nm;(c) ∆[HHb] signal calculated using AC and (d) ∆[HHb] signal calculated using phase data.Absorption and phase changes shown in Figs. 3 (a) and (b) are not corrected. ∆[HHb] signals(see Figs. 3 (c) and (d)) are obtained after the correction for the superficial changes. One cansee that curves in Figs. 3 (a) and (b) do not show significant correlation with the activationunlike curves in Figs. 3 (c) and (d), which both exhibit decreases during the activations andincreases during the relaxations. This illustrates the effectiveness of the correction proceduredescribed in Section 3.
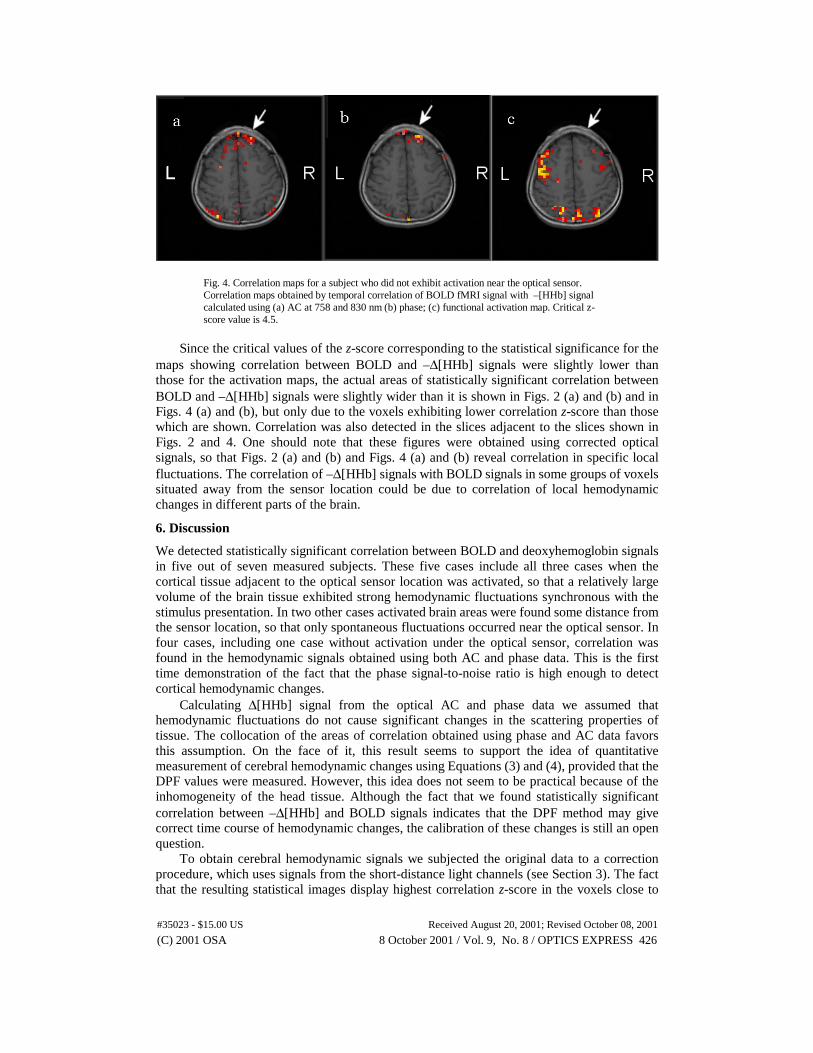
In two subjects statistically significant correlation between BOLD and –∆[HHb] signalswere detected in brain areas that showed no correlation between the BOLD signal and thesmoothed boxcar predictor. In one of them correlation was found only for hemodynamicsignal obtained from the AC data; in the other - in the signals calculated from both the ACand phase data. Fig. 4 shows correlation maps for the latter subject. As in Fig.2 the thresholdz-score value is the same in all three figures and corresponds to the critical value for theactivation map (Fig. 4 (c)). In Figs. 4 (a) and (b) one can see that cortical areas near theoptical sensor location exhibit statistically significant correlation between the BOLD and–∆[HHb] signals, although the areas of correlation are much narrower than those in Figs. 2 (a)and (b) at close threshold z-score value (4.8 for Fig.2 and 4.5 for Fig.3).
(C) 2001 OSA 8 October 2001 / Vol. 9, No. 8 / OPTICS EXPRESS 424#35023 - $15.00 US Received August 20, 2001; Revised October 08, 2001
arbi
trar
yun
its
0 100 200 300 400 500 600time (s)
(a) -ln(AC)
-0.3
-0.2
-0.1
0
0.1
0.2
0.3
degr
ees
0 100 200 300 400 500 600time (s)
(b) Phase
arbi
trar
yun
its
0 100 200 300 400 500 600time (s)
(d) [HHb] from phase
arbi
trar
yun
its
0 100 200 300 400 500 600time (s)
(c) [HHb] from AC
Fig. 3. Time course of changes in (a)-Ln(AC) at 758 nm; (b) phase at 758 nm; (c)[HHb] signalcalculated using AC data and correction procedure; (d) [HHb] signal calculated using phasedata and correction procedure. Green rectangles show activation periods.
(C) 2001 OSA 8 October 2001 / Vol. 9, No. 8 / OPTICS EXPRESS 425#35023 - $15.00 US Received August 20, 2001; Revised October 08, 2001
Fig. 4. Correlation maps for a subject who did not exhibit activation near the optical sensor.Correlation maps obtained by temporal correlation of BOLD fMRI signal with –[HHb] signalcalculated using (a) AC at 758 and 830 nm (b) phase; (c) functional activation map. Critical z-score value is 4.5.
Since the critical values of the z-score corresponding to the statistical significance for themaps showing correlation between BOLD and –∆[HHb] signals were slightly lower thanthose for the activation maps, the actual areas of statistically significant correlation betweenBOLD and –∆[HHb] signals were slightly wider than it is shown in Figs. 2 (a) and (b) and inFigs. 4 (a) and (b), but only due to the voxels exhibiting lower correlation z-score than thosewhich are shown. Correlation was also detected in the slices adjacent to the slices shown inFigs. 2 and 4. One should note that these figures were obtained using corrected opticalsignals, so that Figs. 2 (a) and (b) and Figs. 4 (a) and (b) reveal correlation in specific localfluctuations. The correlation of –∆[HHb] signals with BOLD signals in some groups of voxelssituated away from the sensor location could be due to correlation of local hemodynamicchanges in different parts of the brain.
6. Discussion
We detected statistically significant correlation between BOLD and deoxyhemoglobin signalsin five out of seven measured subjects. These five cases include all three cases when thecortical tissue adjacent to the optical sensor location was activated, so that a relatively largevolume of the brain tissue exhibited strong hemodynamic fluctuations synchronous with thestimulus presentation. In two other cases activated brain areas were found some distance fromthe sensor location, so that only spontaneous fluctuations occurred near the optical sensor. Infour cases, including one case without activation under the optical sensor, correlation wasfound in the hemodynamic signals obtained using both AC and phase data. This is the firsttime demonstration of the fact that the phase signal-to-noise ratio is high enough to detectcortical hemodynamic changes.
Calculating ∆[HHb] signal from the optical AC and phase data we assumed thathemodynamic fluctuations do not cause significant changes in the scattering properties oftissue. The collocation of the areas of correlation obtained using phase and AC data favorsthis assumption. On the face of it, this result seems to support the idea of quantitativemeasurement of cerebral hemodynamic changes using Equations (3) and (4), provided that theDPF values were measured. However, this idea does not seem to be practical because of theinhomogeneity of the head tissue. Although the fact that we found statistically significantcorrelation between –∆[HHb] and BOLD signals indicates that the DPF method may givecorrect time course of hemodynamic changes, the calibration of these changes is still an openquestion.
To obtain cerebral hemodynamic signals we subjected the original data to a correctionprocedure, which uses signals from the short-distance light channels (see Section 3). The factthat the resulting statistical images display highest correlation z-score in the voxels close to
(C) 2001 OSA 8 October 2001 / Vol. 9, No. 8 / OPTICS EXPRESS 426#35023 - $15.00 US Received August 20, 2001; Revised October 08, 2001
the location of the optical sensor indicates that our method is efficient for the exclusion ofsuperficial and systemic hemodynamic fluctuations.
The fact that statistically significant correlation was detected even for spontaneoushemodynamic fluctuations indicates that NIRS can be sensitive even to relatively weak localfluctuations in the human brain. However, this is only a preliminary result, which should beconfirmed by larger number of observations.
7.Conclusion
In five subjects we demonstrated correlation in hemodynamic signals obtained from the NIRSand BOLD fMRI data, which were simultaneously recorded during brain activation. In foursubjects correlation was found for the hemodynamic signal obtained using the phase ofintensity modulated NIRS signal. This is the first-time demonstration of the possibility ofusing the phase of the intensity-modulated optical signal for the detection of hemodynamicchanges in the human brain. Our results show that the DPF method correctly reproduces thetime course of the cerebral hemodynamic signals. The effect of superficial and systemicfluctuations on the overall optical signal can be reduced by a data correction procedure, whichuses signals acquired at small source-detector distances (1 cm and less).
Acknowledgments
This work was supported by National Institutes of Health (NIH) CA57032 and RR10966.
(C) 2001 OSA 8 October 2001 / Vol. 9, No. 8 / OPTICS EXPRESS 427#35023 - $15.00 US Received August 20, 2001; Revised October 08, 2001