This paper numerically studies the Mach number effect on cruise performance of 3D Co-Flow Jet (CFJ) wingsat freestream Mach number of 0.15, 0.30, 0.35, 0.40, 0.46 and 0.50. The non-swept wing with three aspect ratios(AR) of 5, 10 and 20 based on CFJ-NACA-6421 airfoil are investigated. The numerical simulations employ theintensively validated in house FASIP CFD code, which utilizes a 3D RANS solver with Spalart-Allmaras (S-A)turbulence model, 3rd order WENO scheme for the inviscid fluxes, and 2nd order central differencing for theviscous terms. Similar to the previous 2D study, the 3D lift coefficient is increased with the Mach number due tocompressibility effect. However, the overall aerodynamic efficiency and productivity are substantially droppedfrom 2D to 3D due to increased induced drag and the CFJ power coefficient. The penalty is further increasedwith the decreased aspect ratio. Compared with the baseline 3D wing with NACA-6421 airfoil at the same aspectratio, the cruise lift coefficient is increased on the average by about 30% for AR of 5 and 60% for AR of 20.For the AR of 20, the pure aerodynamic lift to drag ratio CL/CD is also increased by about 30%. Consideringthe CFJ pumping power consumption, the equivalent aerodynamic efficiency (CL/CD)c is about the same asthe baseline wing. The productivity efficiency (C2
L/CD)c are increased by about 30% due to the increased liftcoefficient. For AR of 5, no efficiency advantage is obtained even though the high cruise lift coefficient remains.The study indicates that the CFJ wing with a thick airfoil is advantageous for cruise at subsonic speed up toMach number of 0.50, in particular for high aspect ratio wing.
Nomenclature
CFJ Co-flow jetAoA Angle of attackLE Leading EdgeTE Trailing EdgeS Planform areac Airfoil chordU Flow velocityq Dynamic pressure 0.5 ρU2
p Static pressureη Pump efficiencyρ Air density
∗ Graduate Student† Professor, AIAA associate Fellow
Pc Power coefficient L/(q∞ S V∞)PR Total Pressure ratio of the CFJ pumpMis Isentropic Mach NumberM∞ Freestream Mach NumberPtinj Total injection pressurePtsuc Total suction pressureVinj/V∞ Normalized injection velocity
1 Introduction
High cruise efficiency is crucial to minimize the energy consumption of airliners. This is particular importantfor electric aircraft development to extend range and increase payload with the current limited battery energydensity. However, increasing aircraft aerodynamic efficiency at cruise condition is very challenging because theflow condition is usually very benign at a low angle of attack. Most of the efforts to increase cruise efficiencyin the past few decades are focused on 3D combination, including winglet, wing body combination, flying wing,boundary layer ingestion with integrated propulsion system and fuselage, distributed propulsion, etc. Few effortsare focused on improving the airfoil performance at cruise condition since they are considered mature with littleroom to improve.
Recently, the Co-Flow Jet (CFJ) flow control airfoil developed [1, 2, 3, 4, 5, 6, 7, 8, 9, 10, 11, 12] provides apromising concept to improve the cruise efficiency. In a CFJ airfoil, an injection slot near the leading edge (LE)and a suction slot near the trailing edge (TE) on the airfoil suction surface are created. As shown in Fig. 1, asmall amount of mass flow is drawn into the suction duct, pressurized and energized by the micro compressor, andthen injected near the LE tangentially to the main flow via an injection duct. The whole process does not add anymass flow to the system and hence is a zero-net-mass-flux(ZNMF) flow control. The CFJ airfoil is demonstratedto achieve radical lift augmentation, stall margin increase, drag reduction and increased nose-down moment forstationary and pitching airfoils.
The CFJ airfoil has a unique low energy expenditure mechanism, because the jet gets injected at the leadingedge peak suction location, where the main flow pressure is the lowest and makes it easy to inject the flow, and itgets sucked at the trailing edge, where the main flow pressure is the highest and makes it easy to draw the flow.The low energy expenditure is a key factor enabling the CFJ airfoil to achieve high cruise efficiency [13] at lowAoA when the flow is benign.
Dow
nloa
ded
by G
eche
ng Z
ha o
n Ja
nuar
y 22
, 202
0 | h
ttp://
arc.
aiaa
.org
| D
OI:
10.
2514
/6.2
020-
0045
Since aircraft operate at different cruise speeds, a question that needs to ask is how freestream Mach numberaffects the CFJ wings’ aerodynamic performance and efficiency. Wang and Zha studied the 2D CFJ airfoil cruiseperformance at different Mach numbers [14]. Their study indicates that the 2D CFJ airfoil is able to significantlyincrease the cruise lift coefficient and aerodynamic efficiency. However, a 3D wing with finite wing span willintroduce the induced drag,the higher the lift, the greater the induced drag. In [15], the 3D CFJ wing effect dueto aspect ratio is studied at a fixed Mach number of 0.15. The cruise lift coefficient is increased substantially.The aerodynamic efficiency and productivity efficiency are also increased significantly at high aspect ratio. Theefficiency advantage diminishes when the aspect ratio is decreased. No study is done to understand the 3D CFJwing with variation of the Mach number.
The purpose of this paper is to extend the previous studies [14, 15] to 3D CFJ wings with varying Mach numberand aspect ratio. The study indicates that the 2D CFJ aerodynamic efficiency improvement is largely offset bythe increased induced drag due to the enhanced cruise lift coefficient. However, the productivity efficiency is stilllargely increased due to the augmented cruise lift coefficient.
Figure 1: Schematic plot of a typical CFJ airfoil.
2 Co-Flow Jet Parameters
2.1 Lift and Drag Calculation
The momentum and pressure at the injection and suction slots produce a reactionary force, which is automati-cally measured by the force balance in wind tunnel testing. However, for CFD simulation, the full reactionary forceneeds to be included. Using control volume analysis as shown in Fig. 2, the reactionary force can be calculatedusing the flow parameters at the injection and suction slot opening surfaces. Zha et al. [2] give the followingformulations to calculate the lift and drag due to the jet reactionary force for a CFJ airfoil. By considering theeffects of injection and suction jets on the CFJ airfoil, the expressions for these reactionary forces are given as :
where the subscripts 1 and 2 stand for the injection and suction respectively, and θ1 and θ2 are the angles betweenthe injection and suction slot’s surface and a line normal to the airfoil chord. α is the angle of attack.
The total lift and drag on the airfoil can then be expressed as:
D = R′x − Fxcfj (3)
L = R′y − Fycfj (4)
where R′x and R′y are the surface integral of pressure and shear stress in x (drag) and y (lift) direction excludingthe internal ducts of injection and suction. For CFJ wing simulations, the total lift and drag are calculated byintegrating Eq. (3) and Eq. (4) in the spanwise direction.
2.2 Jet Momentum Coefficient
The jet momentum coefficient Cµ is a parameter used to quantify the jet intensity. It is defined as:
Cµ =mVj
12ρ∞V∞
2S(5)
where m is the injection mass flow, Vj is the mass-averaged injection velocity, ρ∞ and V∞ denote the free streamdensity and velocity, and S is the planform area.
Dow
nloa
ded
by G
eche
ng Z
ha o
n Ja
nuar
y 22
, 202
0 | h
ttp://
arc.
aiaa
.org
| D
OI:
10.
2514
/6.2
020-
0045
2.3 Power Coefficient
CFJ is implemented by mounting a pumping system inside the wing that withdraws air from the suction slotand blows it into the injection slot. The power consumption is determined by the jet mass flow and total enthalpychange as the following:
P = m(Ht1 −Ht2) (6)
where Ht1 and Ht2 are the mass-averaged total enthalpy in the injection cavity and suction cavity respectively,P is the Power required by the pump and m the jet mass flow rate. Introducing Pt1 and Pt2 the mass-averagedtotal pressure in the injection and suction cavity respectively, the pump efficiency η, and the total pressure ratioof the pump Γ = Pt1
Pt2, the power consumption is expressed as:
P =mCpTt2
η(Γ
γ−1γ − 1) (7)
where γ is the specific heat ratio equal to 1.4 for air. The power coefficient is expressed as:
Pc =P
12ρ∞V
3∞S
(8)
2.4 Corrected Aerodynamic Efficiency
The conventional wing aerodynamic efficiency is defined as:
L
D(9)
For the CFJ wing, the ratio above still represents the pure aerodynamic relationship between lift and drag.However since CFJ active flow control consumes energy, the ratio above is modified to take into account theenergy consumption of the pump. The formulation of the corrected aerodynamic efficiency for CFJ wings is:
(L
D)c =
CLCD + Pc
(10)
where V∞ is the free stream velocity, P is the pumping power, and L and D are the lift and drag generated bythe CFJ wing. The formulation above converts the power consumed by the CFJ into a force P
V∞which is added to
the aerodynamic drag D. If the pumping power is set to 0, this formulation returns to the aerodynamic efficiencyof a conventional wing.
2.5 Aircraft Productivity
To compare aircraft that have the same ratio of initial weight to final weight with the same engine fuel con-sumption or battery energy density, the productivity efficiency C2
L/CD is introduced to measure the productivityof an airplane represented by its range multiplied by its weight [16].
Dow
nloa
ded
by G
eche
ng Z
ha o
n Ja
nuar
y 22
, 202
0 | h
ttp://
arc.
aiaa
.org
| D
OI:
10.
2514
/6.2
020-
0045
The productivity efficiency C2L/CD = CL(CL/CD) is a more comprehensive parameter than the conventional
aerodynamic efficiency CL/CD to measure the merit of an airplane aerodynamic design for cruise performance.The former includes not only the information of CL/CD, but also the information of the aircraft weight CL. Forexample, for two airplane designs having the same CL/CD with one CL twice larger than the other, if the wingsizes are the same, one airplane will be able to carry twice more weight than the other with productivity and wingloading increased by 100%. Such a large difference is not reflected by CL/CD, but very well reflected by C2
L/CD.
The definition of CL/CD in general is a suitable measure of merit for conventional aircraft design. This isbecause at a certain Mach number regime, the maximum CL/CD is usually achieved at low angle of attack withinthe drag bucket and is more or less the same for different airfoil designs. In other words, for the same optimumCL/CD, the CL is about the same. A typical CL for subsonic airfoil is about 0.4 and for transonic airfoil is about0.7.
For CFJ airfoil, the minimum CFJ pumping power occurs at a fairly high AoA [7, 17]. With the augmentationof CFJ, the subsonic cruise lift coefficient of a CFJ airfoil is typically 2 to 3 times higher than the conventionalairfoil with about the same (CL/CD)c [12]. Such a high lift coefficient is unattainable for conventional airfoil sincethey would be either stalled or near stalled with very high drag. Hence for CFJ aircraft design, the productivityefficiency C2
L/CD = CL(CL/CD) is more informative to be used to reflect the aerodynamic performance. Thecorrected productivity efficiency for CFJ airfoils is (C2
L/CD)c = C2L/(CD + Pc).
3 Numerical Algorithms
3.1 CFD Simulation Setup
The in house FASIP (Flow-Acoustics-Structure Interaction Package) CFD code is used to conduct the numericalsimulation. The 3D Reynolds Averaged Navier-Stokes (RANS) equations with one-equation Spalart-Allmaras [18]turbulence model is used. A 3rd order WENO scheme for the inviscid flux [19, 20, 21, 22, 23, 24] and a 2nd ordercentral differencing for the viscous terms [19, 23] are employed to discretize the Navier-Stokes equations. The lowdiffusion E-CUSP scheme used as the approximate Riemann solver suggested by Zha et al [20] is utilized with theWENO scheme to evaluate the inviscid fluxes. Implicit time marching method using Gauss-Seidel line relaxationis used to achieve a fast convergence rate [25]. Parallel computing is implemented to save wall clock simulationtime [26].
Dow
nloa
ded
by G
eche
ng Z
ha o
n Ja
nuar
y 22
, 202
0 | h
ttp://
arc.
aiaa
.org
| D
OI:
10.
2514
/6.2
020-
0045
Figure 3: Computational mesh used in the current work.
3.2 Boundary Conditions
The 3rd order accuracy no slip condition is enforced on the solid surface with the wall treatment suggestedin [27] to achieve the flux conservation on the wall. The computational mesh is shown in Fig. 3 with O-meshtopology and the radial farfield boundary located at 20 chord radius. The spanwise farfield is located at 20 chordaway from the wing tip. The ducts geometries are predetermined based on our previous 2D designs [14]. Totalpressure, total temperature and flow angles are specified at the injection duct inlet, as well as the upstream portionof the far field. Constant static pressure is applied at the suction duct outlet as well as the downstream portionof the far field. Symmetry boundary conditions are applied at the root of the wing, whereas the wing tip flowis resolved by a mesh block. The cross-section faces of the CFJ ducts are meshed using “H” topology while thedomains around the airfoil are meshed using “O” topology. The total mesh size is 3.918 millions points, split into111 blocks for the parallel computation. The first grid point on the wing surface is placed at y+ ≈ 1. This meshsize is the same as the mesh size used in the study of Wang and Zha [15], for which the mesh refinement is verifiedfor mesh independence.
4 Results and Discussion
4.1 CFJ Wing Geometry Parameters
The detailed parameters of CFJ airfoil used to create the 3D CFJ wing are presented by the injection andsuction slot size normalized by airfoil chord length (C). The CFJ6421-SST150-SUC247-INJ117 airfoil designed in[14, 15] is optimized by enlarging the injection and suction size based on the CFJ airfoil from [12]. The CFJ6421-SST150-SUC247-INJ117 wing has a injection slot size of 1.17%C and suction slot size of 2.47%C. The suctionsurface translation (SST) is 1.50%C.
Table. 1 lists all the freestream conditions studied with the Mach number varying from 0.15 to 0.50 at the
aspect ratio of 5, 10, and 20. Since the focus is on the cruise performance, the AoA is fixed at 5◦ and the Cµ isfixed at 0.03. The AoA of 5◦ and Cµ of 0.03 give the optimum aerodynamic efficiency for all the Mach numbersexcept for 0.50, for which the optimum condition is at AoA of 2◦ and Cµ of 0.01 due to avoiding the transonicshock wave.
This section discusses the performance of 3D CFJ Wing and 2D CFJ Airfoil at Different M∞ and AoA. Aswe can seen from these tables, the AoA of 5◦ and 6◦ always give the best CFJ corrected aerodynamic efficiency.Thus, the analysis of 3D CFJ wing performance is based on the AoA of 5◦. The results of M∞ of 0.15, 0.35, and0.40 are not listed below to save space. The M∞ of 0.30 has higher compressibility than that at M∞ of 0.15,but is still far from the sonic speed. At M∞ of 0.46, the critical Mach number for the airfoil, the CFJ correctedaerodynamic efficiency is still very good since no shock appears in the flow filed. But when the M∞ is increasedto 0.50, the flow becomes transonic and the optimum aerodynamic efficiency occurs at a lower AoA of 2◦ and Cµof 0.01. Thus, these three representative Mach number (0.30, 0.46, and 0.50) are chosen to present more detailedresults.
Table. 2 and Table. 3 show the performance of 3D CFJ wings at M∞ of 0.30 and Cµ of 0.03 at different AoA.
Table 2: Performance at M∞ 0.30 for the 3D CFJ Wing at AR 20 and different AoA and Cµ of 0.03.
AoA CL CL/CD (CL/CD)c (CL2/CD)c Pc PR Ptinj m/Span Vinj
Table. 6 and Table. 7 show the performance of 3D CFJ wings and 2D CFJ airfoil at M∞ of 0.50 and Cµ of0.01 at different AoA. As the results show on previous 2D Mach number study [14], the best performance for M∞of 0.50 is at AoA of 2◦ instead of AoA of 6◦, and Cµ of 0.01 instead of 0.03. This is because the flow becomestransonic at M∞ of 0.50 with shock wave appearance. The same AoA and Cµ from the 2D study are adopted forthis 3D wing study.
Dow
nloa
ded
by G
eche
ng Z
ha o
n Ja
nuar
y 22
, 202
0 | h
ttp://
arc.
aiaa
.org
| D
OI:
10.
2514
/6.2
020-
0045
Table 6: Performance at M∞ 0.50 for the 3D CFJ Wing at AR 20 and different AoA and Cµ of 0.01.
AoA CL CL/CD (CL/CD)c (CL2/CD)c Pc PR Ptinj m/Span Vinj
4.3 3D CFJ Wing Cruise Performance at Different Mach Number
The cruise lift, drag and moment coefficients vs. M∞ for the 3D CFJ and baseline wing at different AR areshown in Fig. 4 with the 2D CFJ airfoil results [14]. As the M∞ increases, all the CFJ coefficient of lift, drag andnose down pitching moment also are increased due to the compressibility effect, whereas the baseline wing has allthose coefficients fairly. As expected, the drag coefficient of the higher AR is smaller than the lower AR case dueto decreased induced drag. The nose down moment CM is increased with the CL.
(a) (b) (c)
Figure 4: Lift, drag and moment coefficients for the 3D CFJ wings and 2D CFJ airfoil.
The CL/CD, (CL/CD)c, (CL2/CD)c at different Mach number are substantially lower than the 2D CFJ airfoil
due to the induced drag penalty as shown in Fig. 5. All the 3D results remain fairly constant with the Machnumber, whereas the 2D aerodynamic efficiency and productivity efficiency are increased with the Mach numberuntil it reaches Mach number of 0.50, which reaches the transonic regime with shock wave.
(a) (b) (c)
Figure 5: CL/CD, (CL/CD)c, (CL2/CD)c plots for the 3D CFJ wings and 2D CFJ airfoil.
Compared with the baseline 3D wing with NACA-6421 airfoil at the same aspect ratio, the cruise lift coefficientis increased on the average by about 30% for AR of 5 and 60% for AR of 20 as shown in Fig. 4. For the AR of 20,the pure aerodynamic lift to drag ratio CL/CD is also increased by about 30% as displayed in Fig. 5. Consideringthe CFJ pumping power consumption, the equivalent aerodynamic efficiency CL/CDc is about the same as thebaseline wing. The productivity efficiency C2
L/CDc are increased by about 30% due to the increased lift coefficient.For AR of 5, no efficiency advantage is obtained even though the high cruise lift coefficient remains.
CFJ makes the thick airfoil beneficial for the aircraft system by providing large lift coefficient and lighterstructure weight. As shown in Fig. 4 and Fig. 5, the cruise lift coefficient of the CFJ wing at AR of 20 reaches1.45 at Mach 0.5 while keeping a CL/CD of 28 similar to the baseline wing. Such a high lift coefficient for cruiseis unachievable for conventional subsonic wing with a typical cruise lift coefficient of 0.5-0.7. At a CL of 1.45,the conventional wing will be either stalled or near being stalled. Since CFJ wing can tolerate very high angle ofattack without being stalled, such a thick airfoil wing is thus very feasible and efficient for subsonic aircraft.
As shown in Fig. 6, the 3D CFJ wing power coefficient increases linearly with the Mach number until it isgreater than Mach 0.46 with more increased rate due to approaching transonic regime.
Figure 6: Pc plot for the 3D CFJ wings and 2D CFJ airfoil.
Fig. 7 shows the Isentropic Mach number distribution of the wing section from root to tip at different spanlocations. Compared with the 2D case, the loading is substantially decreased as also reflected by the lift coefficientin Fig. 4 (a). At the outer span close to the wing tip, the loading is decreased due to wing tip vortices. Again, ahigher aspect ratio always has a higher loading due to less effect of the tip vortex. The maximum Mach numberis also shown in Fig. 11 and Fig. 12.
(a) AR 5 (b) AR 10 (c) AR 20
Figure 7: Isentropic Mach Number plots for the 3D CFJ wings and 2D CFJ airfoil at M∞ of 0.30, Cµ of 0.03,and AoA of 5◦ with different AR.
Fig. 8 (a) and (b) are the normalized injection total pressure and the total pressure ratio between injection andsuction. The pressure is normalized as:
p = p/(ρ∞V2∞) (11)
Fig. 8 (a) indicates that to achieve the same injection momentum coefficient, the injection total pressure isdecreased with the increasing Mach number. This is because the leading edge suction effect is greater and the
main flow pressure is lower in that region. Since the overall pressure level is lower with increased Mach number,the CFJ suction slot static pressure is also reduced. However, the important parameter determining the powerconsumption is the total pressure ratio between the injection and suction slot as shown in Fig. 8 (b). For cruiseMach number at 0.15 and AoA of 5◦, the total pressure ratio is at the level of 1.02. For Mach number of 0.3 and0.46, it is increased to 1.08 and 1.2 respectively. For the cruise Mach number of 0.5 at AoA of 5◦, the total pressureratio is about 1.24. The required CFJ total pressure ratio is increased with increasing Mach number due to theboundary layer suffering more loss at higher speed. It is the main reason that the power coefficient is increasedwith Mach number as shown in Fig. 6. For the same Cµ, the total pressure ratio of the 3D cases vary little withaspect ratio and is also about the same as the 2D case.
(a) (b)
Figure 8: Injection total pressure and the total pressure ratio between injection and suction plots for the 3D CFJwings and 2D CFJ airfoil.
Fig. 9 (a) shows the normalized mass flow rate per unit span at injection, which shows that with decreasedaspect ratio, the normalized mass flow rate per unit span is increased. This is the main reason that the powercoefficient is increased with the decreased aspect ratio as shown in Fig. 6. Fig. 9 (b) shows the mass averagedinjection jet speed normalized by the freestream speed. The normalized jet speed is increased with the Machnumber from 1.14 at Mach 0.15 to 1.19 at Mach 0.50. Overall, the jet speed ratio is low and is beneficial for thelow power required at cruise (Fig. 6)and the high efficiency shown in Fig. 5. Also, the normalized injection jetspeed is a little lower than that at 2D and the lower aspect ratio wing has a lower injection speed ratio.
Figure 9: Normalized mass flow rate and injection velocity plots for the 3D CFJ wings and 2D CFJ airfoil.
5 Analysis of 3D CFJ Wing Penalty
In order to understand the penalty of the 3D CFJ wing, the wing results are broken down to various componentsin Table. 8 and Table. 9 and are compared with the 2D results at Mach 0.30. Table. 9 lists the lift, drag, andmoment coefficient and their detailed components from pressure, viscous force, and jet reactionary forces. Asshown in Table. 8, the corrected aerodynamic efficiency (CL/CD)c drops substantially from 80.33 to 28.74 whenthe configuration is changed from 2D to 3D with AR of 20.
Table 8: Performance at M∞ 0.30 for the 3D CFJ Wing with Different AR and 2D CFJ airfoil.
Dimension AR AoA CL/CD (CL/CD)c (CL2/CD)c Pc PR Ptinj m/Span Vinj
Based on Table. 8 and Table. 9, the factors decreasing the (CL/CD)c of the AR 20 CFJ wing compared withthe 2D airfoil include: 1) the lift coefficient drops by 12%; 2) the total drag coefficient is increased by 240% from0.01 to 0.034, which is mostly due to the increased induced drag.; 3) the power coefficient Pc is increased by 24%from 0.0074 to 0.0092.
Among the drag contributions, the majority of the drag increase is due to the pressure drag increase, which isdetermined by the induced drag. The friction drag is only increased by 7.6%. The CFJ reactionary force generatesabout the same thrust for the 2D and 3D cases at the thrust coefficient level of -0.095. The CFJ also reduce thetotal lift by the same amount between the 2D and 3D at the lift coefficient level of -0.54.
Fig. 10 shows the Mach contour for 2D CFJ airfoil at at M∞ 0.30 and AoA of 5◦. Fig. 11 and Fig. 12 show theMach contours for 3D CFJ and Baseline wings at M∞ 0.30 and AoA of 5◦. As we can see, the 2D airfoil Machcontour has the highest Mach number 0.558, whereas it is 0.537 for the CFJ wing at AR 20 and 0.515 for thebaseline wing at AR 20. The maximum Mach number decreases with the decrease of aspect ratio. Also, the highvelocity region near the injection slot on the suction surface is increased with the increase of the span locationtoward the wing tip.
Figure 10: Mach contour for 2D CFJ airfoil at M∞ 0.30 and AoA of 5◦.
(a) Baseline Wing AR 5 (b) Baseline Wing AR 10 (c) Baseline Wing AR 20
Figure 12: Mach contours at 10%, 50% and 95% spanwise location for baseline wing at different AR, AoA = 5◦,M∞ = 0.30.
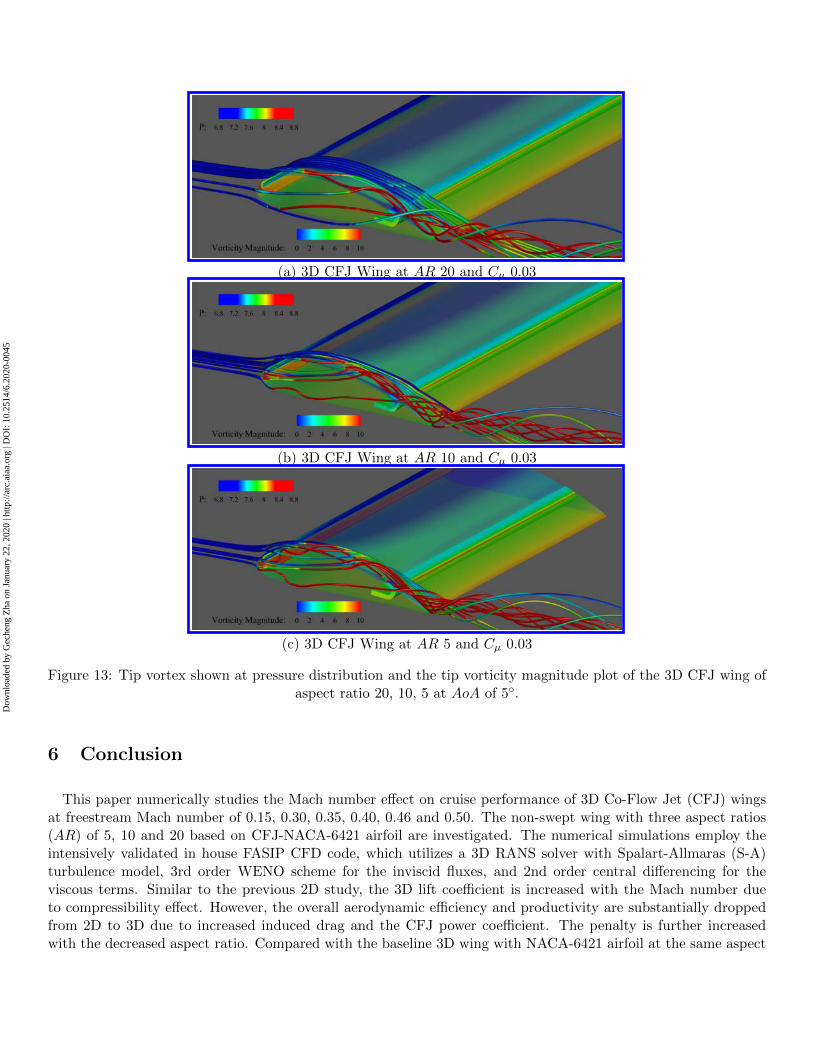
Fig. 13 shows the CFJ wing surface static pressure contours at M∞ of 0.30 with the streamlines showing tipvortex colored with the vorticity at AR 20, 10, and 5. They are plotted with the same scale for comparison. Aswe can see, the tip vortex is stronger at the wing tip with lower aspect ratio.
Figure 13: Tip vortex shown at pressure distribution and the tip vorticity magnitude plot of the 3D CFJ wing ofaspect ratio 20, 10, 5 at AoA of 5◦.
6 Conclusion
This paper numerically studies the Mach number effect on cruise performance of 3D Co-Flow Jet (CFJ) wingsat freestream Mach number of 0.15, 0.30, 0.35, 0.40, 0.46 and 0.50. The non-swept wing with three aspect ratios(AR) of 5, 10 and 20 based on CFJ-NACA-6421 airfoil are investigated. The numerical simulations employ theintensively validated in house FASIP CFD code, which utilizes a 3D RANS solver with Spalart-Allmaras (S-A)turbulence model, 3rd order WENO scheme for the inviscid fluxes, and 2nd order central differencing for theviscous terms. Similar to the previous 2D study, the 3D lift coefficient is increased with the Mach number dueto compressibility effect. However, the overall aerodynamic efficiency and productivity are substantially droppedfrom 2D to 3D due to increased induced drag and the CFJ power coefficient. The penalty is further increasedwith the decreased aspect ratio. Compared with the baseline 3D wing with NACA-6421 airfoil at the same aspect
ratio, the cruise lift coefficient is increased on the average by about 30% for AR of 5 and 60% for AR of 20. Forthe AR of 20, the pure aerodynamic lift to drag ratio CL/CD is also increased by about 30%. Considering the CFJpumping power consumption, the equivalent aerodynamic efficiency (CL/CD)c is about the same as the baselinewing. The productivity efficiency (C2
L/CD)c are increased by about 30% due to the increased lift coefficient. ForAR of 5, no efficiency advantage is obtained even though the high cruise lift coefficient remains. One importantadvantage for the CFJ active flow control is that it can use thick airfoil such as the 21% thickness for the wholeflight envelop since CFJ airfoil has high resistance for flow separation. Thick airfoil can provide high lift coefficientand lighter structure weight. As an example shown in this study for cruise Mach number of 0.5, the wing with ARof 20 has a cruise lift coefficient of 1.45, which is far greater than the lift coefficient of 0.5 - 0.7 for conventionalsubsonic wings. The advantage of a thick CFJ airfoil is that it provides high lift coefficient for the whole flightenvelop and reduces the structure weight.
7 Acknowledgment
The simulations are conducted on Pegasus super computing system at the Center for Computational Sciencesat the University of Miami.
Disclosure: Dr. GeCheng Zha is on the Board of Directors/Corporate Officer for CoFlow Jet and holds equityin CoFlow Jet. Dr. Zha is also the inventor of intellectual property licensed to CoFlow Jet.
References
[1] G.-C. Zha and D. C. Paxton, “A Novel Flow Control Method for Airfoil Performance Enhancement UsingCo-Flow Jet.” Applications of Circulation Control Technologies, Chapter 10, p. 293-314, Vol. 214, Progress inAstronautics and Aeronautics, AIAA Book Series, Editors: Joslin, R. D. and Jones, G.S., 2006.
[2] G.-C. Zha, W. Gao, and C. Paxton, “Jet Effects on Co-Flow Jet Airfoil Performance,” AIAA Journal, No.6,, vol. 45, pp. 1222–1231, 2007.
[3] G.-C. Zha, C. Paxton, A. Conley, A. Wells, and B. Carroll, “Effect of Injection Slot Size on High PerformanceCo-Flow Jet Airfoil,” AIAA Journal of Aircraft, vol. 43, 2006.
[4] G.-C. Zha, B. Carroll, C. Paxton, A. Conley, and A. Wells, “High Performance Airfoil with Co-Flow Jet FlowControl,” AIAA Journal, vol. 45, 2007.
[5] Wang, B.-Y. and Haddoukessouni, B. and Levy, J. and Zha, G.-C., “Numerical Investigations of Injection SlotSize Effect on the Performance of Co-Flow Jet Airfoil,” Journal of Aircraft, vol. Vol. 45, No. 6,, pp. pp.2084–2091, 2008.
[6] B. P. E. Dano, D. Kirk, and G.-C. Zha, “Experimental Investigation of Jet Mixing Mechanism of Co- FlowJet Airfoil.” AIAA-2010-4421, 5th AIAA Flow Control Conference, Chicago, IL, 28 Jun - 1 Jul 2010.
[7] B. P. E. Dano, G.-C. Zha, and M. Castillo, “Experimental Study of Co-Flow Jet Airfoil Performance Enhance-ment Using Micro Discreet Jets.” AIAA Paper 2011-0941, 49th AIAA Aerospace Sciences Meeting, Orlando,FL, 4-7 January 2011.
[8] A. Lefebvre, B. Dano, W. Bartow, M. Fronzo, and G. Zha, “Performance and energy expenditure of coflowjet airfoil with variation of mach number,” Journal of Aircraft, vol. 53, no. 6, pp. 1757–1767, 2016.
[9] A. Lefebvre, G-C. Zha, “Numerical Simulation of Pitching Airfoil Performance Enhancement Using Co-FlowJet Flow Control,” AIAA paper 2013-2517, June 2013.
[10] A. Lefebvre, G-C. Zha, “Cow-Flow Jet Airfoil Trade Study Part I : Energy Consumption and AerodynamicPerformance,” 32nd AIAA Applied Aerodynamics Conference, AIAA AVIATION Forum, AIAA 2014-2682,June 2014.
[11] A. Lefebvre, G-C. Zha, “Cow-Flow Jet Airfoil Trade Study Part II : Moment and Drag,” 32nd AIAA AppliedAerodynamics Conference, AIAA AVIATION Forum, AIAA 2014-2683, June 2014.
[12] Lefebvre, A. and Zha, G.-C., “Trade Study of 3D Co-Flow Jet Wing for Cruise Performance.” AIAA Paper2016-0570, AIAA SCITECH2016, AIAA Aerospace Science Meeting, San Diego, CA, 4-8 January 2016.
[13] Lefebvre, A. and Zha, G.-C. , “Design of High Wing Loading Compact Electric Airplane Utilizing Co-Flow JetFlow Control.” AIAA Paper 2015-0772, AIAA SciTech2015: 53nd Aerospace Sciences Meeting, Kissimmee,FL, 5-9 Jan 2015.
[14] Wang, Yang and Zha, G.-C., “Study of Mach Number Effect for 2D Co-flow Jet Airfoil at Cruise Conditions.”AIAA AVIATION Forum 2019, AIAA Aviation and Aeronautics Forum and Exposition, Dallas, Texas, June17-21, 2019.
[15] Wang, Yang and Zha, G.-C., “Study of 3D Co-Flow Jet Wing Induced Drag and Power Consumption atCruise Conditions.” AIAA Paper 2019-0034, AIAA Scitech Forum 2019, San Diego, California, January 7-11,2019.
[16] Yunchao Yang and Gecheng Zha, “Super-Lift Coefficient of Active Flow Control Airfoil: What is the Limit?.”AIAA Paper 2017-1693, AIAA SCITECH2017, 55th AIAA Aerospace Science Meeting, Grapevine, January9-13 2017.
[17] Lefebvre, A. and Dano, B. and Bartow, W. and Di Franzo, M. and Zha, G.-C., “Performance Enhancementand Energy Expenditure of Co-Flow Jet Airfoil with Variation of Mach Number.” AIAA Paper 2013-0490,AIAA Journal of Aircraft, DOI: 10.2514/1.C033113, 2016.
[18] P. R. Spalart and S. R. Allmaras, “A one-equation turbulence model for aerodynamic flows,” in 30th AerospaceSciences Meeting and Exhibit, Aerospace Sciences Meetings, Reno, NV, USA, AIAA Paper 92-0439, 1992.
[19] Y.-Q. Shen and G.-C. Zha, “Large Eddy Simulation Using a New Set of Sixth Order Schemes for CompressibleViscous Terms ,” Journal of Computational Physics, vol. 229, pp. 8296–8312, 2010.
[20] Zha, G.C., Shen, Y.Q. and Wang, B.Y., “An improved low diffusion E-CUSP upwind scheme ,” Journal ofComputer and Fluids, vol. 48, pp. 214–220, Sep. 2011.
[21] Y.-Q. Shen and G.-Z. Zha , “Generalized finite compact difference scheme for shock/complex flowfield inter-action,” Journal of Computational Physics, vol. doi:10.1016/j.jcp.2011.01.039, 2011.
[22] Shen, Y.-Q. and Zha, G.-C. and Wang, B.-Y., “ Improvement of Stability and Accuracy of Implicit WENOScheme,” AIAA Journal, vol. 47, No. 2, pp. 331–344, 2009.
[23] Shen, Y.-Q. and Zha, G.-C. and Chen, X.-Y., “ High Order Conservative Differencing for Viscous Termsand the Application to Vortex-Induced Vibration Flows,” Journal of Computational Physics, vol. 228(2),pp. 8283–8300, 2009.
[24] Shen, Y.-Q. and Zha, G.-C. , “ Improvement of the WENO Scheme Smoothness Estimator,” InternationalJournal for Numerical Methods in Fluids, vol. DOI:10.1002/fld.2186, 2009.
[25] G.-C. Zha and E. Bilgen, “Numerical Study of Three-Dimensional Transonic Flows Using Unfactored Upwind-Relaxation Sweeping Algorithm,” Journal of Computational Physics, vol. 125, pp. 425–433, 1996.
[26] B.-Y. Wang and G.-C. Zha, “A General Sub-Domain Boundary Mapping Procedure For Structured GridCFD Parallel Computation,” AIAA Journal of Aerospace Computing, Information, and Communication,vol. 5, No.11, pp. 2084–2091, 2008.
[27] Y.-Q. Shen, G.-C. Zha, and B.-Y. Wang, “Improvement of Stability and Accuracy of Implicit WENO Scheme,” AIAA Journal, vol. 47, pp. 331–344, 2009.