22
MINISTRY OF ECONOMY A STUDY OF POLAND’S ECONOMIC PERFORMANCE IN THE 1 ST HALF OF 2009 ANALYSES AND FORECASTING DEPARTMENT Warsaw, August 2009
8/14/2019 Study of Poland's Economic Performance Q2 2009
http://slidepdf.com/reader/full/study-of-polands-economic-performance-q2-2009 1/22
MINISTRY OF ECONOMY
A STUDY OF POLAND’S
ECONOMIC PERFORMANCE
IN THE 1ST HALF OF 2009
ANALYSES
AND FORECASTING
DEPARTMENT
Warsaw, August 2009
8/14/2019 Study of Poland's Economic Performance Q2 2009
http://slidepdf.com/reader/full/study-of-polands-economic-performance-q2-2009 2/22
2
Contents
Synthesis ............................................................................................................... 3
Significant slowdown of economic growth…...................................................... 5
Considerable deterioration in performance of industry… ................................. 7
Construction… ..................................................................................................... 8
Agriculture…........................................................................................................9
Decrease in domestic trade turnover… .............................................................10
Inflation… .......................................................................................................... 11
Labour market – gradual deterioration….........................................................12
Increase in wages, salaries and social benefits…............................................. 14
Public finances... ................................................................................................15
Monetary policy and exchange rate…............................................................... 16
Higher drop in exports than in imports............................................................. 18
Improvement in balance of payments …........................................................... 19

8/14/2019 Study of Poland's Economic Performance Q2 2009
http://slidepdf.com/reader/full/study-of-polands-economic-performance-q2-2009 3/22
3
Synthesis
• The year 2008 was a period of gradual economic slowdown in Poland. However there
is still relatively high economic growth, and consequences of the world crisis on thefinancial market had limited scope. The sources of economic growth (recovery of
investment demand, stable and high growth of consumption and fast growing exports)
allowed to gain one of the better result in EU. On the other hand it should be underlined
that in the latest months of the year tendency debilitated.
• In the first half of current year GDP growth highly slowed. According to provisional CSO
estimates GDP growth in the 1st
quarter of 2009 reached 0.8%, however in the 2nd
quarter
according to DAF MoE estimates GDP increased by 0.5%. The vital role in the process of
GDP creation was played by external demand, while internal demand lost its positive
influence.
• I the period of January-June 2009 sold production of industry went down by 8,3% in
entities with more than 9 employees. Depreciating trend of dynamics started in 4th
quarter
was still upward. It resulted from a weaker financing position of Polish enterprises and
lower demand.
• In the 1st
half of 2009 production in construction decreased by 1.4% (in entities with
more than 9 employees). It was caused by a limited availability of credits and a weaker
financing position of the economic entities what entailed to decline in demand.
• In the comparison to previous year domestic trade results deteriorated and decreased by
0.7% in volume of retail sales in entities with more than 9 employees. It resulted frominternal demand declining which was caused by a slowdown of salaries pace in real terms.
• According to preliminary CSO data in the period of January-June of 2009 the volume of
the exports – counted in current prices – amounted to EUR 45.7bn and was by 22.5%
lower than year ago. The volume of imports stood at EUR 49.4bn and was by 30.6%
lower than in the previous year. The negative balance of foreign trade turnover
reached a level of EUR 3.7bn which was a lower value by EUR 7.8bn than in the same
period of 2008. Reduction of foreign trade deficit was a consequence of relative good
position of domestic exporters as a result of polish currency depreciation.
• According to provisional NBP data, in the period of January-June of 2009 improvementof a balance of the current account was observed, comparing to the previous year. The
surplus resulted from a lower negative balance on goods. Simultaneously FDI inflow was
lower than a year ago.
• In the period of January-June 2009 the annual average consumer price index (CPI) stood
at lower level than in 2008 and amounted to 3.5%. The producer price index exceeded
previous year’s level by 4.6%, and construction prices increased by 1.1%.

8/14/2019 Study of Poland's Economic Performance Q2 2009
http://slidepdf.com/reader/full/study-of-polands-economic-performance-q2-2009 4/22
4
• The first symptoms of labour market prosperity deterioration appeared in the last quarterof previous year. In the period of January-June 2009 the average employment in the
enterprise sector was by 0.5% lower than a year before. At the end of June 2009 the
number of registered unemployed was higher comparing to June 2008 by 14%, and the
registered unemployment rate raised to 10.7% (against 9.5% in December 2008).
• In the period of January-June 2009, in real terms salaries in enterprise sector, retirement
payments and pensions form non-agriculture security system increased, likewise
purchasing power of retirement pays and pensions of individual farmers comparing to
corresponding period of 2008.
• In the first six months of 2009 the nominal budget deficit was definitely higher than in theprevious year and amount to PLN 16.7bn. The budget revenues stood at PLN 134.3bn,
when expenditures amounted by PLN 151.0bn. Comparing to 2008 incomes decreased by
1.0pp (5.3%) and expenditures execution was higher by 4.6pp (15.2%). Concerning
revenues, it was caused by receipts from indirect taxes, however concerning expendituresgeneral subsidies to local self-government entities were crucial factor.
• In the 1st
half of 2009, the Monetary Policy Council changed interest rates four times.MPC cut rates by 0.75pp in January and in February, March and June by 0.25pp, each
time.
• As regards the foreign exchange market, in the period of January-June 2009 depreciation
of Polish zloty took place. It was caused by negative influence of volatility in global
economy and of foreign investors withdrawal.

8/14/2019 Study of Poland's Economic Performance Q2 2009
http://slidepdf.com/reader/full/study-of-polands-economic-performance-q2-2009 5/22
5
Significant slowdown of economic growth…
In accordance to CSO in 2008 the rate of GDP was lower than a year before. A weakening of
an economic growth was a result of situation on the global financial market, however strong
foundation of Polish economy contributed to the GDP growth by 4.9%. It was one of thehigher results in EU.
Table 1. GDP growth rate in 2006-2009
2006 2007 2008 2009
YoY 6.2 6.6 4.9
I-III IV-VI VII-IX X-XII I-III IV-VI VII-IX X-XII I-III IV-VI VII-IX X-XII I-III IV-IV
YoY 5.4 6.3 6.6 6.6 7.4 6.5 6.5 6.5 6.1 5.9 5.0 2.9 0.8* 0.5**
*CSO estimate
** DAF MoE estimate
Source: CSO
Chart 1. Changes in GDP and its major items in the years 2000 – 2009 (correspondingperiod of the previous year = 100)
-5.0
-3.0
-1.0
1.0
3.0
5.0
7.0
9.0
Q 1 2 0 0 0
Q 2 2 0 0 0
Q 3 2 0 0 0
Q 4 2 0 0 0
Q 1 2 0 0 1
Q 2 2 0 0 1
Q 3 2 0 0 1
Q 4 2 0 0 1
Q 1 2 0 0 2
Q 2 2 0 0 2
Q 3 2 0 0 2
Q 4 2 0 0 2
Q 1 2 0 0 3
Q 2 2 0 0 3
Q 3 2 0 0 3
Q 4 2 0 0 3
Q 1 2 0 0 4
Q 2 2 0 0 4
Q 3 2 0 0 4
Q 4 2 0 0 4
Q 1 2 0 0 5
Q 2 2 0 0 5
Q 3 2 0 0 5
Q 4 2 0 0 5
Q 1 2 0 0 6
Q 2 2 0 0 6
Q 3 2 0 0 6
Q 4 2 0 0 6
Q 1 2 0 0 7
Q 2 2 0 0 7
Q 3 2 0 0 7
Q 4 2 0 0 7
Q 1 2 0 0 8
Q 2 2 0 0 8
Q 3 2 0 0 8
Q 4 2 0 0 8
Q 1 2 0 0 9 *
%
Individual consumption Public consumption
Accumulation Net exports
* CSO estimate
Source: DAF MoE calculations based on the CSO data
In the 1st
half of 2009 GDP increased by 0.6% comparing to the same period of previous year.
The performance confirms resistance of Polish economy to the world crisis. Dynamics of
Poland’s GDP growth still remains at one of the highest in Europe.
In the 1st
half of 2009 dynamics of individual consumption increased. However domestic
demand left off being the main factor of economic growth, as a consequence of stocks
adjustment to limitation of activity level of economy. Similarly to the crisis of the years 2000
and 2001, the contribution of domestic demand was negative. The engine of the Polish
economy was external demand, which has positively contributed to GDP.
Lower dynamics of individual consumption was a result of decreasing purchasing power of
households and worst financial condition of enterprises, as well as impeded access to credits.
An additional source of dropping of domestic demand was deterioration in consumers’
sentiments (though in the 2nd
q. slight optimism occurred).
8/14/2019 Study of Poland's Economic Performance Q2 2009
http://slidepdf.com/reader/full/study-of-polands-economic-performance-q2-2009 6/22
6
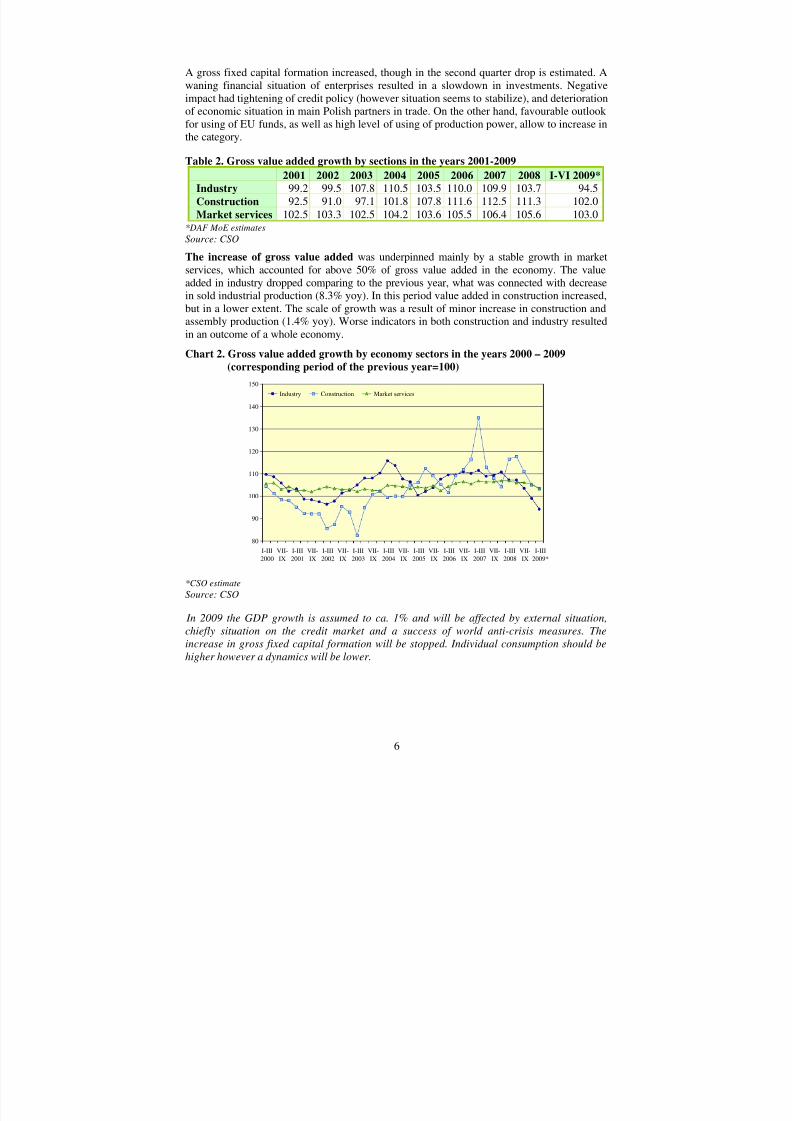
A gross fixed capital formation increased, though in the second quarter drop is estimated. A
waning financial situation of enterprises resulted in a slowdown in investments. Negative
impact had tightening of credit policy (however situation seems to stabilize), and deterioration
of economic situation in main Polish partners in trade. On the other hand, favourable outlook
for using of EU funds, as well as high level of using of production power, allow to increase in
the category.
Table 2. Gross value added growth by sections in the years 2001-2009
2001 2002 2003 2004 2005 2006
2007 2008 I-VI 2009*
Industry 99.2 99.5 107.8 110.5 103.5 110.0 109.9 103.7 94.5
Construction 92.5 91.0 97.1 101.8 107.8 111.6 112.5 111.3 102.0
Market services 102.5 103.3 102.5 104.2 103.6 105.5 106.4 105.6 103.0*DAF MoE estimates
Source: CSO
The increase of gross value added was underpinned mainly by a stable growth in market
services, which accounted for above 50% of gross value added in the economy. The value
added in industry dropped comparing to the previous year, what was connected with decrease
in sold industrial production (8.3% yoy). In this period value added in construction increased,
but in a lower extent. The scale of growth was a result of minor increase in construction and
assembly production (1.4% yoy). Worse indicators in both construction and industry resulted
in an outcome of a whole economy.
Chart 2. Gross value added growth by economy sectors in the years 2000 – 2009
(corresponding period of the previous year=100)
*CSO estimate
Source: CSO
In 2009 the GDP growth is assumed to ca. 1% and will be affected by external situation,
chiefly situation on the credit market and a success of world anti-crisis measures. The
increase in gross fixed capital formation will be stopped. Individual consumption should be
higher however a dynamics will be lower.
80
90
100
110
120
130
140
150
I-III
2000
VII-
IX
I-III
2001
VII-
IX
I-III
2002
VII-
IX
I-III
2003
VII-
IX
I-III
2004
VII-
IX
I-III
2005
VII-
IX
I-III
2006
VII-
IX
I-III
2007
VII-
IX
I-III
2008
VII-
IX
I-III
2009*
Industry Construction Market services
8/14/2019 Study of Poland's Economic Performance Q2 2009
http://slidepdf.com/reader/full/study-of-polands-economic-performance-q2-2009 7/22
7
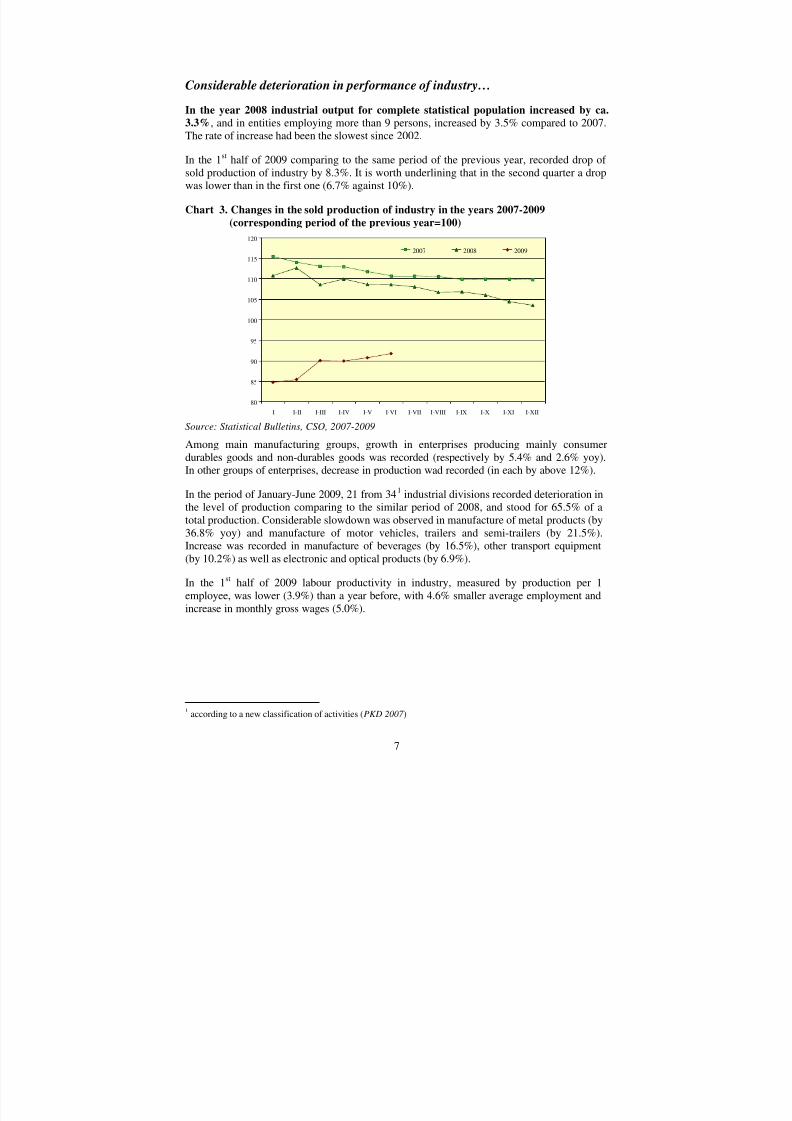
Considerable deterioration in performance of industry…
In the year 2008 industrial output for complete statistical population increased by ca.
3.3%, and in entities employing more than 9 persons, increased by 3.5% compared to 2007.
The rate of increase had been the slowest since 2002.
In the 1st
half of 2009 comparing to the same period of the previous year, recorded drop of
sold production of industry by 8.3%. It is worth underlining that in the second quarter a drop
was lower than in the first one (6.7% against 10%).
Chart 3. Changes in the sold production of industry in the years 2007-2009
(corresponding period of the previous year=100)
Source: Statistical Bulletins, CSO, 2007-2009
Among main manufacturing groups, growth in enterprises producing mainly consumer
durables goods and non-durables goods was recorded (respectively by 5.4% and 2.6% yoy).
In other groups of enterprises, decrease in production wad recorded (in each by above 12%).
In the period of January-June 2009, 21 from 341
industrial divisions recorded deterioration in
the level of production comparing to the similar period of 2008, and stood for 65.5% of a
total production. Considerable slowdown was observed in manufacture of metal products (by
36.8% yoy) and manufacture of motor vehicles, trailers and semi-trailers (by 21.5%).
Increase was recorded in manufacture of beverages (by 16.5%), other transport equipment
(by 10.2%) as well as electronic and optical products (by 6.9%).
In the 1st
half of 2009 labour productivity in industry, measured by production per 1
employee, was lower (3.9%) than a year before, with 4.6% smaller average employment and
increase in monthly gross wages (5.0%).
1according to a new classification of activities (PKD 2007 )
80
85
90
95
100
105
110
115
120
I I-II I-III I-IV I-V I-VI I-VII I-VIII I-IX I-X I-XI I-XII
2007 2008 2009
8/14/2019 Study of Poland's Economic Performance Q2 2009
http://slidepdf.com/reader/full/study-of-polands-economic-performance-q2-2009 8/22
8
Construction…
In 2008 persistent investment recovery was accompanied by high increase in production of
construction. A scale of growth in construction and assembly production in companies
with more than 9 employees amounted to 10.9%.
In the period of January-June current year construction and assembly production in
entities with more than 9 employees decreased by 1.4% comparing to 1st
half of 2008. The
increase in sales of repairs was recorded (by 6.4%), however sales of investment works
dropped (by 0.6%).
Chart 4. Construction and assembly production indices in the years 2007-2009
(corresponding period of the previous year=100)
Source: Statistical Bulletins, CSO, 2007-2009
A significant decrease of construction and assembly production, considering the type of
construction works, was recorded in the entities dealing with building construction (by 5.2%
yoy). On the other hand entities dealing with building constructions of land and water
engineering (by 12.4%) and with specialized constructions (by 2.6%) increased production.
In the first quarter of 2009 76.0 thousand dwellings were completed, which was by 9.7%
more than in the previous year2. In a case of dwelling for sale or rent as well as in privateconstruction amount of dwellings completed was higher than a year ago (respectively by
23.3% and 1.2%).
Negative, for overall condition of construction sector, are data concerning a number of
granted permits for dwellings (drop by 21.4% yoy) and dwellings being constructed (drop by
28.3% yoy) in analyzed period. This situation was caused by a limited availability of credits
and as a result of it declining of demand on real estate market. As a consequence further
downward trend in the sector and maintenance of negative production dynamics could be held
in the next months.
2Provisional CSO data.
85
95
105
115
125
135
145
155
165
I I-II I-III I-IV I-V I-VI I-VII I-VIII I-IX I-X I-XI I-XII
2007 2008 2009.0
8/14/2019 Study of Poland's Economic Performance Q2 2009
http://slidepdf.com/reader/full/study-of-polands-economic-performance-q2-2009 9/22
9
Agriculture…
In 2008 crop output increased by 6.8% on the other hand animal output dropped by
1.5%. As a consequence, the gross agricultural output surged by 3.1%.
In the period from July 2008 to June 2009 as a result of increase of wheat purchase by 17.2%
and rye purchase by 42.0%, the purchase of cereals with corn mixture without sowing grain
surged by 18.8% comparing with analogous period of the previous season.
Table 3. Gross agricultural production in the years 2000-2008 (constant prices)
2002 2003 2004 2005 2006 2007 2008
Gross output 98.1 99.2 107.5 95.7 98.8 106.1 103.1
Crop output 93.3 94.3 116.7 88.1 94.8 109.5 106.8
Animal output 103.4 104.8 97.3 105.2 102.6 102.6 98.5
Source: CSO
In June 2009 the grain purchase increased more than twice comparing with June 2008. In the
same time the purchase of wheat raised twice and the purchase of rye quadrupled (yoy). High
supply level for agricultural products resulted in decrease of their purchase price accordingly
by 41.4% and 48.5% also on the markets by 33.8% and 34% (yoy). Average potato prices on
the markets increased by 48.8% in June 2009.
On the market of slaughter animals from January to June 2009 the purchases dropped by
14.4% comparing to the same period in 2008. This situation was caused by decrease of hog
animals purchases (drop by 22.9%) and poultry animals (drop by 6.4%) in the same period.
Referring lower animal output and coming holiday season significant price increase of
slaughter animal was recorded. In the first half of this year average hog animals purchase
prices surged by 27.8% and on the markets by 20.7%, the prices of ox animals raised
accordingly by 14.6% and 7% and the purchase prices of poultry animals by 9.1%. Milk
supply in analyzing period surged by 6.2% and purchase prices diminished by 22.7% (yoy).
8/14/2019 Study of Poland's Economic Performance Q2 2009
http://slidepdf.com/reader/full/study-of-polands-economic-performance-q2-2009 10/22
10
Decrease in domestic trade turnover…
In 2008 volume of retail sales for complete statistical population exceeded previous
year’s level by 5.3%. In enterprises with more than 9 employees the rise of 9.6% was
recorded3
.
In the period of January-June 2009 retail sales in constant prices dropped by 0.7% and was
below very high dynamics level recorded in the same time of previous year (I half 2008 –
113.8).
Chart 5. Retail sales indices (corresponding period of the previous year = 100,
constant prices)
Source: Statistical Bulletins, CSO, 2007-2009
Lower than a year before sales in the first half of 2009 was recorder in the four groups with
the biggest share in retail sales in general. Sale dynamics in the following groups: motor
vehicles, spare parts and liquid and gas oil dropped significantly respectively by 12.1% and
9.6% (yoy). Lower sales was also recorded in food, drinks and tobacco (by 1.8 % yoy) and
the sales of ‘others’ (drop by 2.4% yoy).
Favorable dynamics in the analyzing period, likewise last year, was noticed in the detail sales
in the rest of the sections. The highest dynamics level was recorded in the sales of: fiber,
clothing and shoes (increase by 25.3%) and the rest of retail sales in not specialized stores(increase by 22.5% yoy).
In the first half of 2009 wholesale trading companies employing more than 9 persons was by
9.7% lower than a year before.4
Very low level of non-agricultural intermediate products,
waste and scrap wholesale was recorded in this period (drop by 22.7%).
3 constant prices4
current prices
97
99
101
103
105
107
109
111
113
115
117
I I-II I-III I-IV I-V I-VI I-VII I-VIII I-IX I-X I-XI I-XII
2007 2008 2009

8/14/2019 Study of Poland's Economic Performance Q2 2009
http://slidepdf.com/reader/full/study-of-polands-economic-performance-q2-2009 11/22
11
Inflation…
In 2008 the price index of consumer goods and services amounted to 4.2%. Higher prices
of energy resources and food on the global market, as well as enlargement of domestic
demand and wages pressure, influenced prices growth.
In the first half of 2009 CPI index was still above the level of inflation target, at the same
time did not exceed deviation level (3.5% in comparison with the same period last year).
In the first half of 2009 recorded price increase was caused by higher dynamics of food and
beverages prices (by 4.5% yoy). The rise of house charges (by 10.1%) including energy
carriers (by 13.1% yoy), among them the highest increase was recorded in solid fuels (by
20.8% yoy).
In spite of decreasing domestic demand, lower wages pressure caused by increasing
unemployment rate and weaken output dynamics, relatively high inflation level is noticed. Itis cause by growth of global food prices, prices of imported goods (low value of zloty) and
regulated prices (concerning energy carriers).
In the period of January-June 2009, the prices of sold production of industry were on
average by 4.6% higher, in comparison with the same time in 2008. The acceleration of the
dynamics was caused mainly by price increase of raw materials. Growth of average wage
prices has a very important impact too. The highest price growth was recorded in the section
of producing and supplying of electricity, gas, steam and hot water (by 19.1%) and mining
and quarrying sections (by 10.6% yoy).
In the same period, prices in construction and assembly production rose by 1.1% incomparison with the previous year. Low price dynamics was caused by the drop of interest in
the real estate market among individual client resulting in decreasing the level of construction
production. This situation was also a result of financial crisis that limited access to mortgage
credits in the country. It also has negative influence on shaping relation between demand and
supply in this sector.
In 2009 inflation rate will be shaped by global economic slowdown and relating
deteriorations of labour market situation that influences on limiting the inflation pressure. In
respect of all factors it is estimated that global price growth of goods and services in the end
of the year will be close to a level of 3%.
8/14/2019 Study of Poland's Economic Performance Q2 2009
http://slidepdf.com/reader/full/study-of-polands-economic-performance-q2-2009 12/22
12
Labour market – gradual deterioration…
Since fourth quarter of 2008 the situation on labour market has gradually deteriorated. It is
caused by global economic slowdown that negative influences production dynamics, in some
way limits the demand for labour. Since 2003 we observed improvement in labour index,current situation stopped this tendency.
Table 4. Primary LFS’ score in 2007-2009
4th q of 2007 1st q of 2008 2nd q of 2008 3rd q of 2008 1st q of 2009
Economic activity rate (%) 54.1 53.7 53.9 54.6 54.7
Employment rate (%) 49.5 49.4 50.1 51.0 51.0
Unemployment rate (%) 8.5 8.1 7.1 6.6 6.7
Employed persons (thousand) 15,538 15,515 15,689 15,990 16,005
Unemployed persons (thousand) 1,448 1,361 1,196 1,132 1,154
Economically inactive persons (thousand) 14,416 14,548 14,445 14,231 14,224
Source: Statistical Bulletins, CSO, 2007-2009
In the period January-June of 2009 an average employment in enterprises sector was lower
than in the previous (0.5% yoy). This element along with worst macro data allows to expect,
that in the consecutive months the trend continue. Limitation of hard situation is possibly as
an effect of measures taken to mitigate results of crisis at the labour market.
Table 5. The average employment in enterprise sector (thous.)
I-VI 2008 I-VI 2009 2009/2008
Total 5,369 5,344 99.5
Industry 2,602 2,481 95.4
Mining and quarrying 178 180 101.4
Manufacturing 2,179 2,052 94.2
Electricity, gas, steam and air conditioning supply 149 149 99.7
Water supply; sewerage, waste management and
remediation activities 96 99 103.7
Construction 407 429 105.5
Trade; repair of motor vehicles 1,051 1,092 103.9
Transportation and storage 459 467 101.7
Accommodation and catering 94 101 107.6
Information and communication 156 160 102.4
Real estate activities 90 88 98.1
Professional, science and technical activitiesa
126 140 111.2
Administrative and support service activities 260 260 100.0a Does not include divisions: Scientific Research and Development, Veterinary activities.
Source: Statistical Bulletin, CSO, 2008-2009

8/14/2019 Study of Poland's Economic Performance Q2 2009
http://slidepdf.com/reader/full/study-of-polands-economic-performance-q2-2009 13/22
13
Among divisions of manufacturing the highest changes in dynamics of employment, in the 1st
half of 2009, were observed in divisions producing:
1. pharmaceutical products 102.0
1. textiles 84.02. wearing apperal 85.3
In the period of January-June 2009, the number of registered unemployed and unemployment
rate were volatile.
Chart 6. The number of the unemployed and registered unemployment rate
Source: CSO
At the end of June 2009 the number of registered unemployed shaped at the level of 1,658.7
persons, i.e. by 14% higher than in the same month of the previous year. The unemployment
rate amounted to 10.7% and was higher by 1.3 percentage point then in June 2008.
Started in the last quarter of 2008 decline of labour demand and lack of significant change of
this tendency in the summer (seasonal works) let us to assume that this trend has consolidated
and could intensify. That is why, it is expected to increase an unemployment rate up to about
12% at the end of year.
1,300
1,800
2,300
2,800
3,300
I III
2004
V V II IX X I I III
2005
V V II IX X I I III
2006
V V II IX XI I III
2007
V V II IX X I I III
2008
V V II IX XI I III
2009
V
t h o u s . p e r s o n s
8.0
10.0
12.0
14.0
16.0
18.0
20.0
22.0 %
number of unemployed registered unemployment rate

8/14/2019 Study of Poland's Economic Performance Q2 2009
http://slidepdf.com/reader/full/study-of-polands-economic-performance-q2-2009 14/22
14
Increase in wages, salaries and social benefits…
In the period of January-June 2009 the average gross salary in enterprise sector amounted to
PLN 3,263 (growth by 5.0% towards corresponding period of the previous year).
Among divisions of manufacturing a drop in the average gross salary was recorded just in two
of them. The highest changes in wages and salaries took place in manufacture of:
1. pharmaceutical products 115,4
2. tobacco products 109,4
3. chemicals and chemical products 106,8
4. beverages 106,8
1. coke and refined petroleum products 86,0
Table 6. Average gross wages and salaries in the enterprise sector
I-VI 2008 I-VI 2009 2009/2008Total 3,109 3,263 105.0
Industry 3,086 3,239 105.0
Mining and quarrying 5,061 5,357 105.9
Manufacturing 2,840 2,945 103.7
Electricity, gas, steam and air conditioning supply 4,398 4,797 109.1
Water supply; sewerage, waste management and
remediation activities 2,958 3,147 106.4
Construction 3,221 3,364 104.5
Trade; repair of motor vehicles 2,915 3,047 104.5
Transportation and storage 2,997 3,107 103.7
Accommodation and catering 2,225 2,293 103.0
Information and communication 5,715 6,017 105.3
Real estate activities 3,199 3,338 104.3
Professional, science and technical activitiesa
5,089 5,409 106.3
Administrative and support service activities 1,881 2,028 107.8a
Does not include divisions: Scientific Research and Development, Veterinary activities.
Source: Statistical Bulletins, CSO, 2008-2009
The purchasing power of wages in the enterprise sector increased by 1.6% in the 1st
half of
2009.
In the period of January-June 2009 the social security benefits rose, too. The average monthlyretirements payments and pensions from non-agricultural social security system amounted to
PLN 1, 522 which is 9.5% (in nominal terms) and 4.8% (in real terms) higher than a year
before. The average retirement payments and pensions of individual farmers increased in
analyzed period by 6.4% and reached a level of PLN 902 (growth by 1.8% yoy in real terms).
It is expected that in 2009, according to deterioration of labour market condition, the nominal
growth of average wages will be slower. In a real terms, in the enterprise sector, among
single divisions, it is also possible to appear a negative dynamics of salaries, which could be
caused by a significant decline in demand on exports goods and raising unemployment rate
which limits increase in wage pressure.

8/14/2019 Study of Poland's Economic Performance Q2 2009
http://slidepdf.com/reader/full/study-of-polands-economic-performance-q2-2009 15/22

8/14/2019 Study of Poland's Economic Performance Q2 2009
http://slidepdf.com/reader/full/study-of-polands-economic-performance-q2-2009 16/22
16
Monetary policy and exchange rate…
In 2008 interest rates were changed six times. They were raised fourth times by 0.25
percentage point each time. However at the end of the year they were cut by 1 pp in total.
Thereby at the end of the year interest rates shaped at a level of: Reference – 5.00%,Lombard – 6.50%, Deposit – 3.50%, and Rediscount 5.25%. In 2008 our currency
strengthened against euro as well as against US dollar. An average annual exchange
rate of euro amounted to PLN 3.5166 and was lower by 7.0% comparing to 2007. An
average annual exchange rate of US dollar amounted to PLN 2.4092 and was lower by
12.9% comparing to 2007.
Chart 7. NBP interest rates in the years 2001-2009
Source: NBP
In the period of January-May 2009, the Monetary Policy Council continued alleviate
monetary policy. The Monetary Policy Council lowered interest rates four times. In January,
interest rates dropped by 0.75 percentage point and in February, March and June by 0.25
percentage point each time. At the end of the 2nd
quarter of 2009 the interest rates
shaped at a level of: Reference – 3.5%, Lombard – 5.0%, Deposit – 2.0%, and
Rediscount 3.75%.
Risk aversion, which characterised financial institutions in that time, was a main cause of
limited credits activity of Polish banks. Comparing to the end of previous year value of credits rose overall to 5.3%. Debts growth of households in analyzed period amounted to
8.1%, enterprises to 1.6% and non-monetary financial institutions to 5.3%. Non-commercial
institutions demand for credits decreased by -0.6%.
In the period of January-May 2009 an average quarterly euro exchange rate amounted to
PLN 4.4678 and was higher by 27.9% annually. US dollar exchange rate amounted to PLN
3.3531 and increased by 46.8% annually. In January 2009 an average exchange rate of both
currency reached a level of respectively 4.5081 EUR/PLN and 3.2146 USD/PLN.
Depreciation of the Polish currency - noticed in analyzed period twice, since the beginning
of the year up to February and temporarily in April - against US dollar and euro was causedby withdrawal of foreign investors from domestic market and global downturn forecasts. In
0
5
10
15
20
25
0 1 / 0 1 / 2 0 0
1
0 1 / 0 3 / 2 0 0
1
0 1 / 0 5 / 2 0 0
1
0 1 / 0 7 / 2 0 0
1
0 1 / 0 9 / 2 0 0
1
0 1 / 1 1 / 2 0 0
1
0 1 / 0 1 / 2 0 0
2
0 1 / 0 3 / 2 0 0
2
0 1 / 0 5 / 2 0 0
2
0 1 / 0 7 / 2 0 0
2
0 1 / 0 9 / 2 0 0
2
0 1 / 1 1 / 2 0 0
2
0 1 / 0 1 / 2 0 0
3
0 1 / 0 3 / 2 0 0
3
0 1 / 0 5 / 2 0 0
3
0 1 / 0 7 / 2 0 0
3
0 1 / 0 9 / 2 0 0
3
0 1 / 1 1 / 2 0 0
3
0 1 / 0 1 / 2 0 0
4
0 1 / 0 3 / 2 0 0
4
0 1 / 0 5 / 2 0 0
4
0 1 / 0 7 / 2 0 0
4
0 1 / 0 9 / 2 0 0
4
0 1 / 1 1 / 2 0 0
4
0 1 / 0 1 / 2 0 0
5
0 1 / 0 3 / 2 0 0
5
0 1 / 0 5 / 2 0 0
5
0 1 / 0 7 / 2 0 0
5
0 1 / 0 9 / 2 0 0
5
0 1 / 1 1 / 2 0 0
5
0 1 / 0 1 / 2 0 0
6
0 1 / 0 3 / 2 0 0
6
0 1 / 0 5 / 2 0 0
6
0 1 / 0 7 / 2 0 0
6
0 1 / 0 9 / 2 0 0
6
0 1 / 1 1 / 2 0 0
6
0 1 / 0 1 / 2 0 0
7
0 1 / 0 3 / 2 0 0
7
0 1 / 0 5 / 2 0 0
7
0 1 / 0 7 / 2 0 0
7
0 1 / 0 9 / 2 0 0
7
0 1 / 1 1 / 2 0 0
7
0 1 / 0 1 / 2 0 0
8
0 1 / 0 3 / 2 0 0
8
0 1 / 0 5 / 2 0 0
8
0 1 / 0 7 / 2 0 0
8
0 1 / 0 9 / 2 0 0
8
0 1 / 1 1 / 2 0 0
8
0 1 / 0 1 / 2 0 0
9
0 1 / 0 3 / 2 0 0
9
0 1 / 0 5 / 2 0 0
9
%
Lombard Rediscount Reference Deposit

8/14/2019 Study of Poland's Economic Performance Q2 2009
http://slidepdf.com/reader/full/study-of-polands-economic-performance-q2-2009 17/22
17
the second quarter of 2009 the situation has changed. Relatively good macroeconomics data,
comparing to the rest of EU members, has affected on consolidation of Polish currency on
the market and appreciation against euro and dollar. Moreover a limited risk aversion on a
global financial market caused increase of demand on Polish zloty, especially by foreign
portfolio investors.
Chart 8. Zloty against the EUR and the US dollar (nominal exchange rates)
Source: NBP
2.0
2.5
3.0
3.5
4.0
4.5
5.0
0 3 / 0 1 / 2 0 0 0
0 3 / 0 5 / 2 0 0 0
0 3 / 0 9 / 2 0 0 0
0 3 / 0 1 / 2 0 0 1
0 3 / 0 5 / 2 0 0 1
0 3 / 0 9 / 2 0 0 1
0 3 / 0 1 / 2 0 0 2
0 3 / 0 5 / 2 0 0 2
0 3 / 0 9 / 2 0 0 2
0 3 / 0 1 / 2 0 0 3
0 3 / 0 5 / 2 0 0 3
0 3 / 0 9 / 2 0 0 3
0 3 / 0 1 / 2 0 0 4
0 3 / 0 5 / 2 0 0 4
0 3 / 0 9 / 2 0 0 4
0 3 / 0 1 / 2 0 0 5
0 3 / 0 5 / 2 0 0 5
0 3 / 0 9 / 2 0 0 5
0 3 / 0 1 / 2 0 0 6
0 3 / 0 5 / 2 0 0 6
0 3 / 0 9 / 2 0 0 6
0 3 / 0 1 / 2 0 0 7
0 3 / 0 5 / 2 0 0 7
0 3 / 0 9 / 2 0 0 7
0 3 / 0 1 / 2 0 0 8
0 3 / 0 5 / 2 0 0 8
0 3 / 0 9 / 2 0 0 8
0 3 / 0 1 / 2 0 0 9
0 3 / 0 5 / 2 0 0 9
PLN
1 USD 1 EUR

8/14/2019 Study of Poland's Economic Performance Q2 2009
http://slidepdf.com/reader/full/study-of-polands-economic-performance-q2-2009 18/22
18
Higher drop in exports than in imports...
According to the preliminary CSO data, in the period of January-June 2009 the value of
exports denominated in EUR (in current prices) was lower by 22.5% compared to the similar
period of 2008 and reached a level of EUR 45.7bn. It was caused by deepening recession in a
euro zone countries which represents more than 50% of Polish exports recipients. The imports
value decreased by 30.6% and amounted to EUR 49.4bn. It was an effect of low imports of
indirect goods and previously noticed materials price fall. The negative balance of foreign
trade reached a level of EUR 3.7bn, EUR 7.8bn less than in the same period of 2008.
Reduction of foreign trade deficit was a consequence of relative good position of domestic
exporters as a result of polish currency depreciation.
Table 8. Geographical structure of Polish foreign trade in the period I-VI 2009
Exports Imports
Share of
total (%)Change (pp)
Share of
total (%)Change (pp)
Developed countries 85.5 +1.7 69.0 -0.6European Union 79.4 +0.6 61.2 -2.3
Developing countries 7.0 +0.7 21.3 +3.2
Central and East European countries 7.5 -2.4 9.7 -1.8
Source: CSO
Poland’s main trading partners in the period I-VI 2009 (comparing to the corresponding period
of the year 2008):
Germany:
Exports (in €) decreased by 19.5%, and imports by 34.8%,
Share of total Poland’s exports – 26,1% (+1.0 pp); imports – 22,3% (-1.4 pp).
Russia:Exports (in €) decreased by 43.7%, and imports by 37.9%,
Share of total Poland’s exports – 3.6% (-1.4 pp); imports – 8.5% (-1.1 pp).
China:
Share of total Poland’s imports – 9.4 % (+2.1 pp).
Chart 9. Export revenues and import expenditure in EUR (rates of change, transaction
approach)
* preliminary data
Source: NBP
-40
-30
-20
-10
0
10
20
30
40
I
2004
V IX I
2005
V IX I
2006
V IX I
2007
V IX I *
2008
V * IX * I *
2009
V *
%
Exports Imports
8/14/2019 Study of Poland's Economic Performance Q2 2009
http://slidepdf.com/reader/full/study-of-polands-economic-performance-q2-2009 19/22
19
According to initial data from the National Bank of Poland , in the period of January-June
2009, the value of exports amounted to EUR 47.1bn and was by 23.8% lower comparing to the
same period of the previous year. Imports expenditures reached a level of EUR 47.7bn and was
by 31.3% lower than in the 2008. As a result, trade balance was negative at a level of EUR 0.6bn
comparing to EUR 7.6bn deficit in the corresponding period of previous year.
In 2009 exports is expected to reach a level of EUR 102bn, so about 12% less than in 2008.
Value of imports estimates to EUR 118bn, about 17% less than in previous year. The negative
balance of a foreign trade turnover will reach a level of EUR 16bn, so about EUR 10bn less than
in 2008.
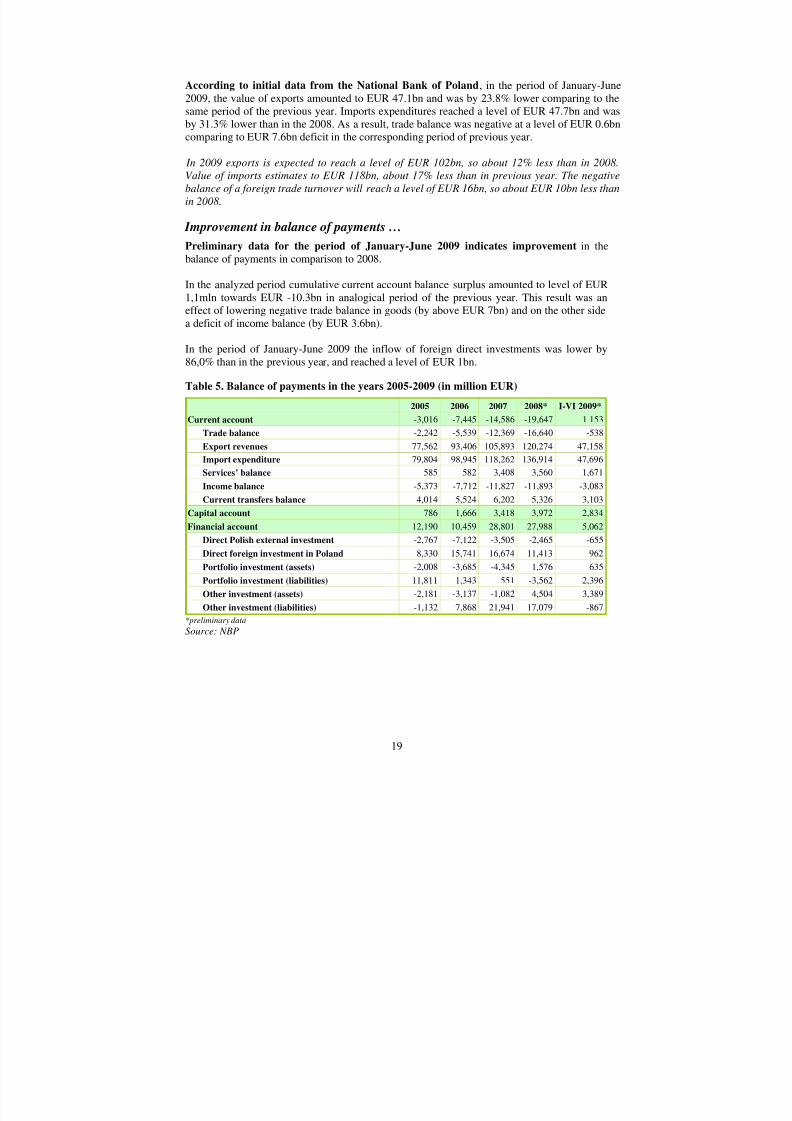
Improvement in balance of payments …
Preliminary data for the period of January-June 2009 indicates improvement in the
balance of payments in comparison to 2008.
In the analyzed period cumulative current account balance surplus amounted to level of EUR
1,1mln towards EUR -10.3bn in analogical period of the previous year. This result was an
effect of lowering negative trade balance in goods (by above EUR 7bn) and on the other side
a deficit of income balance (by EUR 3.6bn).
In the period of January-June 2009 the inflow of foreign direct investments was lower by
86,0% than in the previous year, and reached a level of EUR 1bn.
Table 5. Balance of payments in the years 2005-2009 (in million EUR)
2005 2006 2007 2008* I-VI 2009*
Current account -3,016 -7,445 -14,586 -19,647 1 153
Trade balance -2,242 -5,539 -12,369 -16,640 -538
Export revenues 77,562 93,406 105,893 120,274 47,158
Import expenditure 79,804 98,945 118,262 136,914 47,696
Services’ balance 585 582 3,408 3,560 1,671
Income balance -5,373 -7,712 -11,827 -11,893 -3,083
Current transfers balance 4,014 5,524 6,202 5,326 3,103
Capital account 786 1,666 3,418 3,972 2,834
Financial account 12,190 10,459 28,801 27,988 5,062
Direct Polish external investment -2,767 -7,122 -3,505 -2,465 -655
Direct foreign investment in Poland 8,330 15,741 16,674 11,413 962Portfolio investment (assets) -2,008 -3,685 -4,345 1,576 635
Portfolio investment (liabilities) 11,811 1,343 551 -3,562 2,396
Other investment (assets) -2,181 -3,137 -1,082 4,504 3,389
Other investment (liabilities) -1,132 7,868 21,941 17,079 -867
*preliminary data
Source: NBP

8/14/2019 Study of Poland's Economic Performance Q2 2009
http://slidepdf.com/reader/full/study-of-polands-economic-performance-q2-2009 20/22
20
MINISTRY OF ECONOMY Analyses and Forecasting Department
Warsaw, August 2009
POLAND’S MACROECONOMIC PERFORMANCE IN 2008-2009
Specification Unit 2008 VI 2008 VI 2009 I-VI 2009
GDP % 104.9 100.61
Consumption % 105.9
- individual % 105.4 102.61
Gross capital formation % 103.8
- gross fixed capital formation % 108.2 100.01
Prices
Year-on-year price index of consumergoods and services (CPI)
% 104.2 104.6 103.5 103.5
Year-on-year price index of sold productionof industry (PPI)
% 102.2 102.2 104.0 104.6
Production2 %
Sold production of industry % 102.5 106.5 95.7 91.7
Construction and assembly production % 110.9 119.4 100.6 101.4
Wages and salaries
Average wages and salaries in the nationaleconomy. of which:
PLN 2,944
- enterprise sector PLN 3,186 3,222 3,288 3,263
Average retirement pay and pension
- non-agricultural social security system PLN 1,419 1,444 1,559 1,522
- individual farmers PLN 858 861 914 902
Labour market
Average employment in enterprise sector thous.pers. 5,392 5,383 5,280 5,344
Average number of retirees and pensioners thous.pers. 9,257 9,240 9,352 9,342
- non-agricultural social security system thous.pers. 7,779 7,761 7,925 7,903
- individual farmers thous.pers. 1,478 1,479 1,428 1,439
Unemployment rate (as at the end of a
period)% 9.5 9.4 10.7 10.7
Foreign trade acc. to CSO
Trade balance m EUR -26,2043 -3,7523
- export revenues m EUR 116,2443 45,6563
- import expenditure m EUR 142,4483 49,4083
1- DAF MoE estimates
2- The year 2008 concerns complete statistical population, other data concerns entities employing more than 9 persons
3- preliminary data
8/14/2019 Study of Poland's Economic Performance Q2 2009
http://slidepdf.com/reader/full/study-of-polands-economic-performance-q2-2009 21/22
21
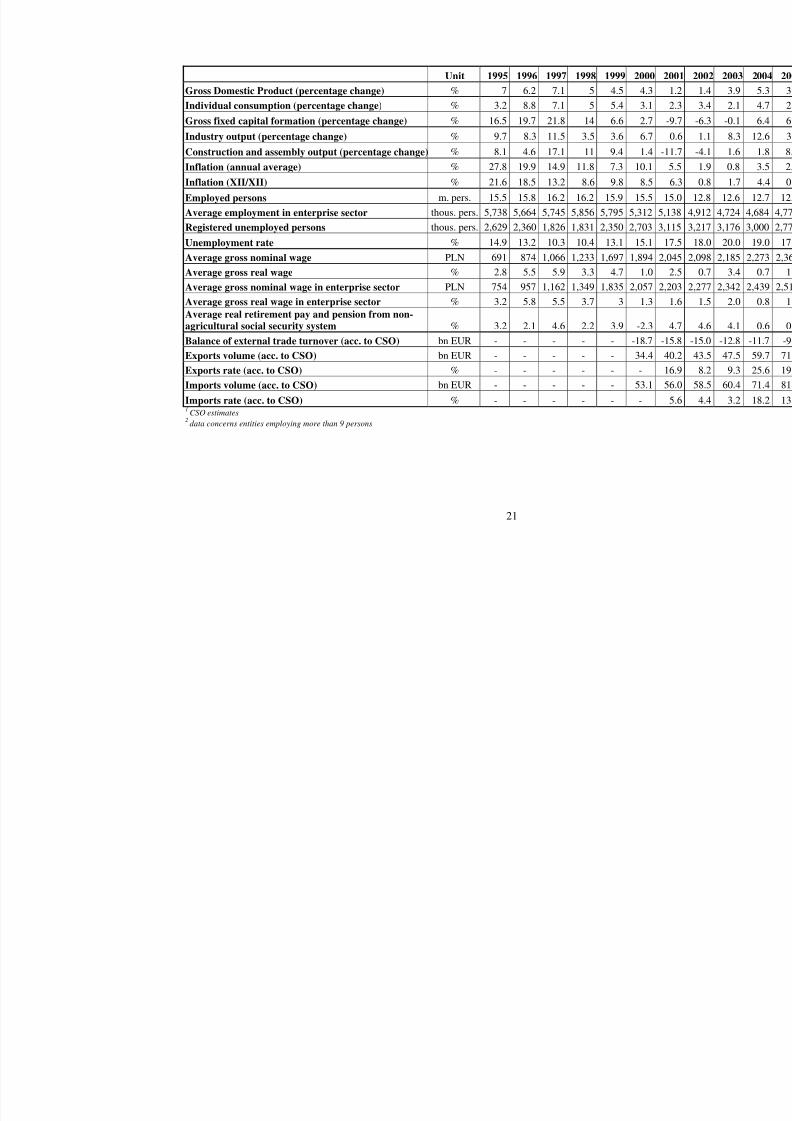
Unit 1995 1996 1997 1998 1999 2000 200
Gross Domestic Product (percentage change) % 7 6.2 7.1 5 4.5 4.3 1
Individual consumption (percentage change) % 3.2 8.8 7.1 5 5.4 3.1 2
Gross fixed capital formation (percentage change) % 16.5 19.7 21.8 14 6.6 2.7 -9
Industry output (percentage change) % 9.7 8.3 11.5 3.5 3.6 6.7 0Construction and assembly output (percentage change) % 8.1 4.6 17.1 11 9.4 1.4 -11
Inflation (annual average) % 27.8 19.9 14.9 11.8 7.3 10.1 5
Inflation (XII/XII) % 21.6 18.5 13.2 8.6 9.8 8.5 6
Employed persons m. pers. 15.5 15.8 16.2 16.2 15.9 15.5 15
Average employment in enterprise sector thous. pers. 5,738 5,664 5,745 5,856 5,795 5,312 5,13
Registered unemployed persons thous. pers. 2,629 2,360 1,826 1,831 2,350 2,703 3,11
Unemployment rate % 14.9 13.2 10.3 10.4 13.1 15.1 17
Average gross nominal wage PLN 691 874 1,066 1,233 1,697 1,894 2,04
Average gross real wage % 2.8 5.5 5.9 3.3 4.7 1.0 2Average gross nominal wage in enterprise sector PLN 754 957 1,162 1,349 1,835 2,057 2,20
Average gross real wage in enterprise sector % 3.2 5.8 5.5 3.7 3 1.3 1
Average real retirement pay and pension from non-
agricultural social security system % 3.2 2.1 4.6 2.2 3.9 -2.3 4
Balance of external trade turnover (acc. to CSO) bn EUR - - - - - -18.7 -15
Exports volume (acc. to CSO) bn EUR - - - - - 34.4 40
Exports rate (acc. to CSO) % - - - - - - 16
Imports volume (acc. to CSO) bn EUR - - - - - 53.1 56
Imports rate (acc. to CSO) % - - - - - - 51
CSO estimates2 data concerns entities employing more than 9 persons
8/14/2019 Study of Poland's Economic Performance Q2 2009
http://slidepdf.com/reader/full/study-of-polands-economic-performance-q2-2009 22/22
Prepared in Macroeconomic Analyses Unit
in Analyses and Forecasting Department
Monika Krupa-Leończyk
Tomasz Chałupa
Accepted by Aneta Pią tkowska
Director of Department


