97
STUDY OF RESIN TRANSFER MOULDING PROCESS PARAMETERS FOR THE MANUFACTURING OF THE SENSOR NOSE CONE by Francisco Ribeiro Fernandes 01/06/2016

STUDY OF RESIN TRANSFER MOULDING
PROCESS PARAMETERS FOR THE
MANUFACTURING OF THE SENSOR NOSE CONE
by
Francisco Ribeiro Fernandes
01/06/2016


MSc Thesis
Department of Mechanical and Manufacturing Engineering
Fibigerstræde 16
9220 Aalborg Ø
Telephone (+45) 9940 7117
Fax (+45) 9815 3030
http://www.m-tech.aau.dk
MSc Program: Manufacturing Technology
Title: Study of Resin Transfer Moulding Process
Parameters for the Manufacturing of the Sensor
Nose Cone
Thesis submitted: June 01, 2016
MSc supervisor: Associate Prof. Ewa Kristiansen,
Aalborg University
MSc supervisor: Associate Prof. Johnny Jakobsen,
Aalborg University
External examiner: Jon Hofman Ibsen
Total page count: 97 pages
© Copyright by author


I
ABSTRACT
Reducing void content in components produced via Resin Transfer
Moulding (RTM) is one of the challenges for improving the surface quality
achieved with this manufacturing process. This thesis is an attempt to
understand the impact of RTM process parameters vacuum assistance,
injection pressure and hydrostatic pressure, in the void content and in the
surface quality of the laminate. To perform this study it was devised a
strategy that consisted in two iterative stage processes, which were
intercalated by an intermediate learning process. The first stage consisted in
defining and implementing an initial hypothesis for the Sensor Nose Cone,
based on information collected from the reviewed literature. Afterwards, the
intermediate learning process was planned based on a factorial design at two
levels, which allowed to analyse behavioural trends caused by changes in
the process parameters. At last, the second stage consisted in defining and
implementing a hypothesis based on the results of the intermediate learning
process.
The results obtained in this study showed that using a combination of a low
injection pressure value combined with a high hydrostatic pressure have
contributed to a better surface quality of the Sensor Nose Cone.
Additionally, despite the use of vacuum assistance did not have shown a
positive influence for the Sensor Nose Cone surface quality, it provided
benefits when applied to flat panels in the designed experiments. It was
concluded that this may have been due to the fact that the designed
experiments did not represent the true state of nature for the Sensor Nose
Cone scenario.
Key words: resin transfer moulding; vacuum assistance; injection pressure;
hydrostatic pressure; voids in composite laminates; surface quality in
composite laminates.


III
PREFACE
This Master Thesis report was submitted as part of the forth semester
program of the Cand.polyt. Manufacturing Technology at Aalborg
University. The project period ran from 01/02/2016 to 01/06/2016. A
reading guide for this report is provided on page V. This project was
proposed and developed in partnership with Terma Aerostructures A/S,
which also provided all the material resources and equipment for making
the tests.

V
READING GUIDE
This thesis is organized in six chapters and in three appendices, and its
content is resumed below:
Chapter 1. Introduction: in this chapter is made an introduction to the
project, presenting its context, the statement of the problem, the purpose of
the study and the primary research question. The chapter concludes with the
description of the assumptions, limitations and the scope for the project.
Chapter 2. Literature Review: in the literature review it is provided an
introduction to voids followed by an analysis to the effects of each process
parameter studied in this project; respectively vacuum assistance, injection
pressure, and hydrostatic pressure, based on the literature findings. Finally,
it is made a summary with all the conclusions taken from the sections
included in this chapter.
Chapter 3. Approach and Method: this chapter starts with an explanation
about the iterative learning process used in the present study. Then, it is
presented the approach the approach and the methods, which are part of the
strategy defined for the project. The chapter finishes with concluding
remarks about the strategy defined.
Chapter 4. Implementation: this chapter covers the implementation of the
initial hypothesis and of the designed experiments for the intermediate
learning process, and it ends with a conclusion about the challenges of
implementing each task
Chapter 5. Results: this chapter is composed by three sections that present
the results from each experiment and by a forth section that discusses the
conclusions made. In Section 5.1 and 5.2, are presented respectively the
results of the initial hypothesis and the results of the designed experiments
for the intermediate learning process. Section 5.3, starts by giving an insight
on the implementation of the second hypothesis and afterwards are
presented the results achieved. The chapters ends in Section 5.4, with the
conclusions from each set of results.
Chapter 6. Concluding Remarks: this chapter contains an overall
conclusion for the report, as well as perspectives and thoughts for future
works that are presented in Section 6.2.

VI
Appendix A. Permeability Test: this appendix contains the description of
the procedure taken to determine an approximate value of the permeability
of the Sensor Nose Cone laminate. It includes the method chosen, the results
obtained and their final discussion.
Appendix B. Determination of Injection Time: this appendix contains the
description of the procedures taken to simulate and determine the injection
time for the Sensor Nose Cone. It includes the method chosen, the results
obtained and their final discussion.
Appendix C. Designed Experiments Based on Factorial Design at Two
Levels: this appendix contains the description of the procedures made in the
intermediate data collection stage, as well as the results obtained and their
discussion.

VII
ACKNOWLEDGEMENTS
First, I would like to thank my thesis advisories Professor Johnny Jakobsen
and Professor Ewa Kristiansen of the Department of Mechanical and
Manufacturing Engineering at Aalborg University, for always steered me in
the right the direction.
I would also like to thank Terma Aerostructures A/S Team, for being such
amazing team mates, and for the invaluable knowledge shared.
Finally, I must express my very profound gratitude to my family. They had
always provided me with unfailing support, since the very beginning, and
will be the ones to be with me until the very end. Luísa, José Carlos,
Margarida, João, Miguel, Diogo you are truly an inspiration to me.
This accomplishment would not have been possible without all of you.


IX
TABLE OF CONTENTS
Abstract .................................................................................................................... i
Preface .................................................................................................................... iii
Reading Guide ......................................................................................................... v
Chapter 1. Introduction .......................................................................................... 1
1.1. Introduction.......................................................................................... 1
1.2. Context ................................................................................................. 1
1.3. Statement of the Problem ..................................................................... 5
1.4. Purpose of the Study ............................................................................ 5
1.5. Significance of the Study ..................................................................... 6
1.6. Primary Research Question ................................................................. 6
1.7. Assumptions Limitations and Scope .................................................... 7
Chapter 2. Literature Review ................................................................................. 9
2.1. Introduction to Voids ........................................................................... 9
2.2. Effect of Vacuum Assistance ............................................................. 10
2.3. Effect of Injection Pressure................................................................ 11
2.4. Effect of Hydrostatic Pressure ........................................................... 11
2.5. Conclusions........................................................................................ 12
Chapter 3. Approach and Method ....................................................................... 15
3.1. Learning by Iteration ......................................................................... 15
3.2. Approach............................................................................................ 16
3.3. Method ............................................................................................... 18
3.3.1. Factorial Design at Two Levels .................................................. 19
3.3.2. Grading System For the Classification of the Results ................. 19
3.4. Conclusions........................................................................................ 20
Chapter 4. Implementation .................................................................................. 23
4.1. Initial Hypothesis ............................................................................... 23
4.1.1. Vacuum Assistance ..................................................................... 23
4.1.2. Injection Pressure ........................................................................ 25

X
4.1.3. Hydrostatic Pressure.................................................................... 26
4.1.4. Procedures ................................................................................... 26
4.1.5. Assumptions ................................................................................ 27
4.2. Designed Experiments for Intermediate Learning Process ................ 28
4.3. Second Hypothesis ............................................................................. 30
4.4. Conclusions........................................................................................ 30
Chapter 5. Results ................................................................................................. 33
5.1. Initial Hypothesis ............................................................................... 33
5.2. Designed Experiments for Intermediate Learning Process ................ 35
5.3. Implementation and Results of the Second Hypothesis ..................... 36
5.3.1. Implementation of the Second Hypothesis.................................. 36
5.3.2. Results of the Second Hypothesis ............................................... 39
5.4. Conclusions........................................................................................ 40
5.4.1. Initial Hypothesis ........................................................................ 40
5.4.2. Designed Experiments for Intermediate Learning Process ......... 41
5.4.3. Second Hypothesis ...................................................................... 43
5.4.4. Overall Conclusion ..................................................................... 45
Chapter 6. Concluding Remarks ......................................................................... 47
6.1. Conclusion ......................................................................................... 47
6.2. Perspectives ....................................................................................... 48
Literature list ......................................................................................................... 51
Appendices ............................................................................................................. 53
Appendix A. Permeability Test ............................................................................ 55
Appendix B. Determination of the Injection Time ............................................. 61
Appendix C. Designed Experiments Based on Factorial Design at Two
Levels ...................................................................................................................... 69
XI
LIST OF FIGURES
Figure 1 - Sensor Nose Cone main components and assembly configuration 2 Figure 2 - Cross section view of the Sensor Nose Cone ................................ 2 Figure 3 - Shape of the redesigned Sensor Nose Cone .................................. 3 Figure 4 - Cross section of the lay-up ............................................................ 3 Figure 5 - O-ring seal ..................................................................................... 4 Figure 6 - O-ring mounted on the groves of the open mould ......................... 4 Figure 7 – Sensor Nose Cone mould ready to be closed ................................ 4 Figure 8 – Set up for the manufacturing of the Sensor Nose Cone ................ 5 Figure 9 – Main steps of RTM process .......................................................... 6 Figure 10 – Graph of saturated water vapour pressure [7] ........................... 12 Figure 11 – Sub stages of RTM injection stage ........................................... 14 Figure 12 – The iterative way of learning [8] ............................................... 15 Figure 13 - Representation of the iterative learning process using a feedback
loop [8] ......................................................................................................... 16 Figure 14 - Iterative learning method using the Sensor Nose Cone ............. 17 Figure 15 - Diagram of the selected approach for this study........................ 18 Figure 16 – Representation of the O-ring, the T-joint and the grove faces .. 24 Figure 17 – Glued T-joint of the O-ring ....................................................... 24 Figure 18 – O-ring ends being glued ............................................................ 28 Figure 19 – Moulds and lay-up for flat panels ............................................. 28 Figure 20 – Example of a geometric representation for a factorial design at
two levels ...................................................................................................... 30 Figure 21 - Side view of the result from the initial hypothesis, with a
description of the lay-up sections ................................................................. 33 Figure 22 – Voids present in the second section .......................................... 34 Figure 23 – Fibre bundles with a low degree of penetration ........................ 34 Figure 24 – Voids in the surface close to the outlet ports ............................ 34 Figure 25 – Geometrical representation of the results .................................. 36 Figure 26 – Images of the Sensor Nose Cone produced using the second
hypothesis ..................................................................................................... 40 Figure 27 – Geometrical representation of the results, with relationship
arrows ........................................................................................................... 42 Figure 28 – Geometrical representation with the highlighted top and bottom
planes ............................................................................................................ 43 Figure 29 – Geometrical representation with the highlighted left and right
planes ............................................................................................................ 43 Figure 30 – Preparations for the designed experiments ............................... 44 Figure 31 - Cross section view of the Sensor Nose Cone mould ................. 44

XII
Figure 32 – Image taken from [9], illustrating the effect of vacuum assisted
capillarity rise ............................................................................................... 45 Figure 33 – Sketch of the experiment designed to determine the permeability
...................................................................................................................... 56 Figure 34 – Preparations before bagging the specimens .............................. 57 Figure 35 – Failed flow front ....................................................................... 58 Figure 36 – Expected irregularities in a flow front ...................................... 58 Figure 37 - Cause of the flow front obstruction ........................................... 58 Figure 38 – Sensor Nose Cone model and its regions .................................. 62 Figure 39 – Representation of the resin reach area in the 2nd region ............ 63 Figure 40 - Model of the specimen for the third region ............................... 65 Figure 41 – Image taken from the results of the Sensor Nose Cone injection
simulation, showing the flow speed [m/s] .................................................... 67 Figure 42 – Flat panel lay-up ....................................................................... 70 Figure 43 – O-ring seal with a purposely made leak .................................... 70 Figure 44 – Example of a geometric representation of the variables
behaviour ...................................................................................................... 72 Figure 45 – Geometric representation of the results .................................... 74 Figure 46 – Panel top view of test 1 ............................................................. 74 Figure 47 – Panel top view of test 2 ............................................................. 74 Figure 48 – Microscope view of test 3 with a magnification of 2x .............. 74 Figure 49 - Microscope view of test 3 with a magnification of 20x ............ 74 Figure 50 - Panel top view of test 3 .............................................................. 75 Figure 51 - Panel top view of test 4 .............................................................. 75 Figure 52 - Panel top view of test 5 .............................................................. 75 Figure 53 - Microscope view of test 5 with a magnification of 2x .............. 75 Figure 54 - Panel top view of test 6 .............................................................. 75 Figure 55 - Microscope view of test 6 with a magnification of 2x .............. 75 Figure 56 - Panel top view of test 7 .............................................................. 76 Figure 57 - Microscope view of test 7 with a magnification of 20x ............ 76 Figure 58 - Panel top view of test 8 .............................................................. 76 Figure 59 - Microscope view of test 8 with a magnification of 2x .............. 76 Figure 60 – Top and bottom of the geometrical representation ................... 77 Figure 61 - Left and right of the geometrical representation ........................ 77
XIII
LIST TABLES
Table 1 – Influence from process parameters, based on [5] ......................... 13 Table 2 – Experimental combinations and the values assigned to each
variable ......................................................................................................... 29 Table 3 - Experiment combinations with the corresponding grades ............ 35 Table 4 – Permeability values obtained from the second specimen
representing the first region .......................................................................... 57 Table 5 - Permeability values obtained the third region ............................... 57 Table 6 – Permeability value for each region ............................................... 63 Table 7 – Combinations for the inlet and outlet ports .................................. 64 Table 8 – Result achieved for the additional simulations, of the 1st and 3rd
regions .......................................................................................................... 65 Table 9 – Simulation results of the Sensor Nose Cone for each scenario. ... 66 Table 10 – Values assigned to each variable ................................................ 70 Table 11 – Experimental combinations for a 23 factorial design ................. 71 Table 12 – Experiment combinations and the corresponding grade ............ 73


CHAPTER 1. INTRODUCTION
1
CHAPTER 1. INTRODUCTION
1.1. INTRODUCTION
In the past years, several manufacturing companies in the field of composite
structures have shown an increased interest about Resin Transfer Moulding
(RTM) processes. Respectively, each company that decides to invest in
RTM does it with its own expectations, convictions and experience. Despite
that, most companies investing in RTM do not possess the knowledge and
experience about closed moulding of composites, and many raise the
questions towards what is happening inside the mould cavity.
As one of the interested companies, Terma Aerostructures A/S has decided
to invest in studying the RTM process with the goal of increasing the
understanding about the process parameters as well as developing a baseline
for a robust manufacturing process. By doing so, it will increase the
company capabilities, allowing Terma Aerostructures A/S to apply this
manufacturing process to future products.
1.2. CONTEXT
The present project is a continuation of the work performed during the third
semester of the Master of Manufacturing Technology [1]. The motivation of
the previous project was to develop a RTM process to replace the current
production processes for the Sensor Nose Cone, with the goal of reducing
production costs.
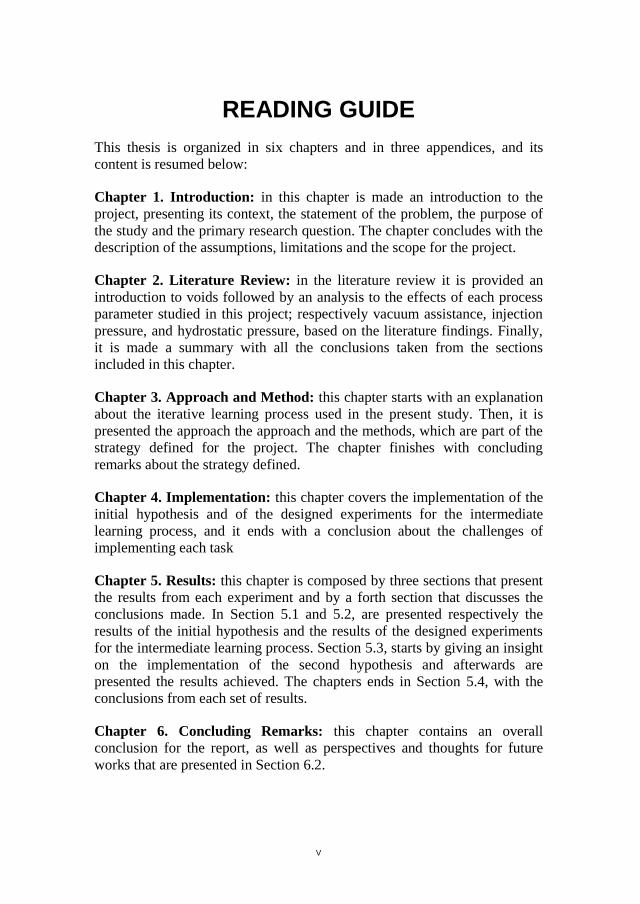
As can be seen in Figure 1, the Sensor Nose Cone is an assembly composed
by four parts: the bulkhead, the skin, the sensor mount and the nose. The
skin is manufactured by metal spinning an aluminium sheet and then
machined to its final shape. The sensor mount, bulkhead and nose are
machined from aluminium billets. Before being assembled together, the
parts undergo a series of quality controls, surface treatments and paint jobs.
Once all the preparations are completed, the parts are assembled together
and afterwards the gaps of the assembly joints are sealed using a
polyurethane joint sealant. Finally, the surfaces are polished to level all the
irregularities in the joints, and the Sensor Nose Cone is painted. By
analysing the Sensor Nose Cone production, it was concluded that having an
assembly composed by four main components results in higher workload
due to the number of tasks and processes that need to be carried out, and it
STUDY OF RESIN TRANSFER MOULDING PROCESS PARAMETERS FOR THE MANUFACTURING OF THE SENSOR NOSE CONE
2
also results in a higher consumption of material resources. Therefore, the
problems with the current Sensor Nose Cone design are related with
quantity of processes needed to produce a single unit, which lead to long
production time and high costs involved.
Figure 1 - Sensor Nose Cone main components and assembly configuration
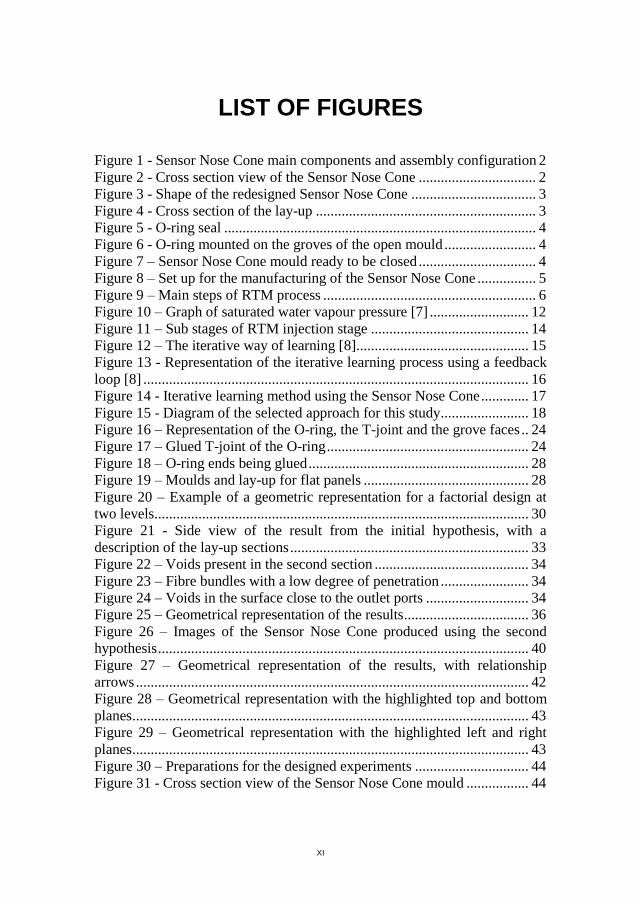
Figure 2 - Cross section view of the Sensor Nose Cone
Based on those issues, Terma Aerostructures A/S proposed a research
project to evaluate the possibility of converting the current aluminium
design to a composite structure, manufactured via RTM, to achieve
significant cost savings. The redesign of the Sensor Nose Cone would
require producing the skin, sensor mount and bulkhead in a single
component, thus resulting in substantial reduction of the production
processes.
In order to implement a RTM process, several changes were made to the
initial geometry of the Sensor Nose Cone, see Figure 2, while the
mechanical properties of the component were maintained. The resultant
redesign can be seen in Figure 3. In regards to its structure, the composite
version of the Sensor Nose Cone uses an 11 inch +/- 45 degrees fibreglass
biaxial sleeve as the reinforcement material with an epoxy matrix
constituted by Araldite® LY 1564 and by Aradur® 3486 as the hardener. In
Figure 4 it is illustrated the lay-up sequence, in which can be seen three
layers of reinforcement material used for the skin, marked in red, and eight
layers marked in green, used to reinforce the joggle area which will be
prone to bolt shear loads. It should be noted here for future references that,
the lay-up can be divided in four sections based on the number of layers
stacked in each section, which are also represented in Figure 4. The first
section is constituted by only the three skin layers that cover the entire
mould cavity. Then, the second section, also referenced as the tapered
section, is a transition region in which the reinforcement layers for joggle

CHAPTER 1. INTRODUCTION
3
start to appear. Due to the change in the number of layers between the first
and third sections, the second section will have a resin rich area. The third
section is made of eleven layers, three from the skin and another additional
eight layers to reinforce the joggle area. Finally is the forth section, although
this section has the same number of layers as the previous one, it has
additionally a fibreglass rod passing in the middle of the reinforcement
layers of the joggle. The purpose of the fibreglass rod is exclusively to hold
the eight reinforcement layers, preventing them from falling inside the
mould cavity while the mould is being closed. Like the second region, the
forth has also has a resin rich area close to the vent ports.
Figure 3 - Shape of the redesigned Sensor Nose Cone
Figure 4 - Cross section of the lay-up
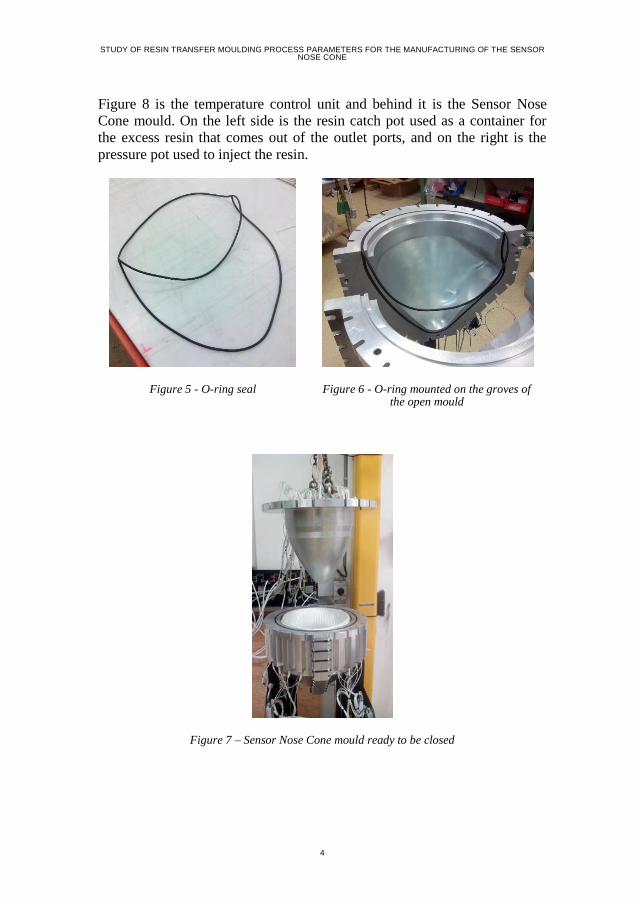
In the previous project [1], it was also developed and prepared the tooling
and equipment necessary to implement the RTM process for the Sensor
Nose Cone. In Figure 5, is shown the O-ring used to seal the mould cavity,
which was produced by using an O-ring cord that was cut with the length of
seal grove, and then the ends were bonded together using cyanoacrylate
glue. Figure 6 shows the O-ring mounted on one of the sides of the concave
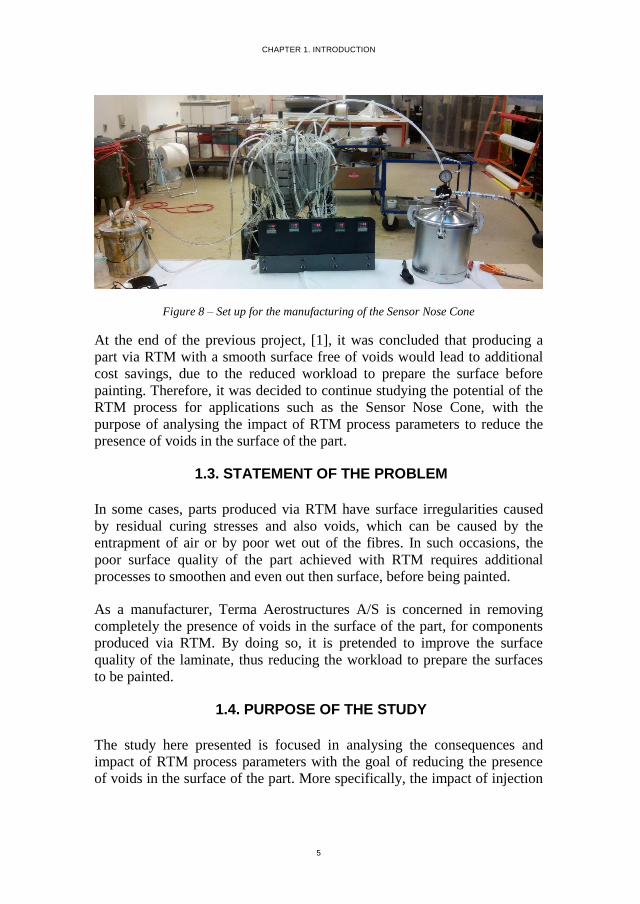
mould, while in Figure 7 is captured the moment before closing the mould,
in which both sides are bolted together and the convex side of the mould is
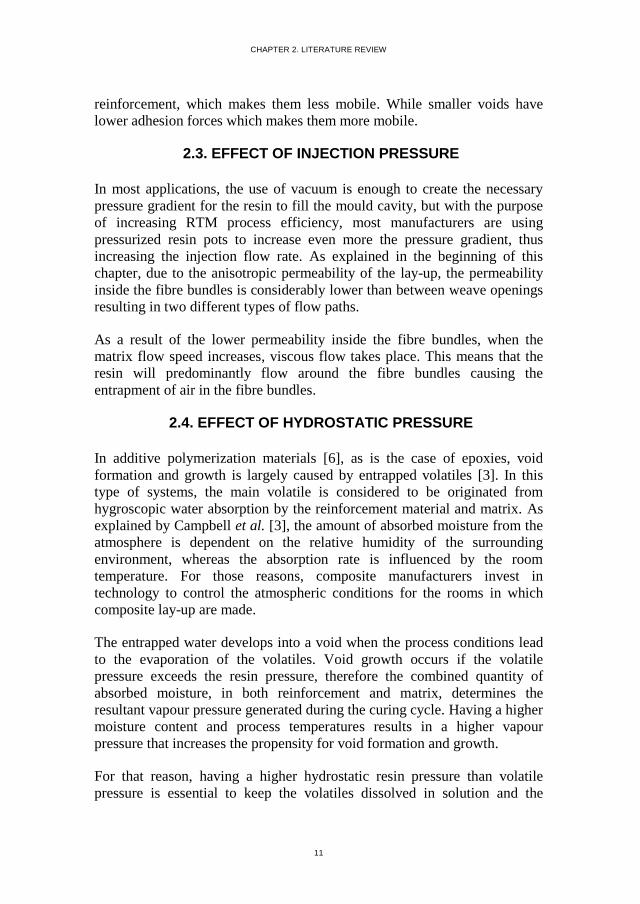
ready to be inserted. Lastly, in Figure 8 is shown the set-up with the
equipment for the production of the Sensor Nose Cone. In the centre of
STUDY OF RESIN TRANSFER MOULDING PROCESS PARAMETERS FOR THE MANUFACTURING OF THE SENSOR NOSE CONE
4
Figure 8 is the temperature control unit and behind it is the Sensor Nose
Cone mould. On the left side is the resin catch pot used as a container for
the excess resin that comes out of the outlet ports, and on the right is the
pressure pot used to inject the resin.
Figure 5 - O-ring seal
Figure 6 - O-ring mounted on the groves of the open mould
Figure 7 – Sensor Nose Cone mould ready to be closed
CHAPTER 1. INTRODUCTION
5
Figure 8 – Set up for the manufacturing of the Sensor Nose Cone
At the end of the previous project, [1], it was concluded that producing a
part via RTM with a smooth surface free of voids would lead to additional
cost savings, due to the reduced workload to prepare the surface before
painting. Therefore, it was decided to continue studying the potential of the
RTM process for applications such as the Sensor Nose Cone, with the
purpose of analysing the impact of RTM process parameters to reduce the
presence of voids in the surface of the part.
1.3. STATEMENT OF THE PROBLEM
In some cases, parts produced via RTM have surface irregularities caused
by residual curing stresses and also voids, which can be caused by the
entrapment of air or by poor wet out of the fibres. In such occasions, the
poor surface quality of the part achieved with RTM requires additional
processes to smoothen and even out then surface, before being painted.
As a manufacturer, Terma Aerostructures A/S is concerned in removing
completely the presence of voids in the surface of the part, for components
produced via RTM. By doing so, it is pretended to improve the surface
quality of the laminate, thus reducing the workload to prepare the surfaces
to be painted.
1.4. PURPOSE OF THE STUDY
The study here presented is focused in analysing the consequences and
impact of RTM process parameters with the goal of reducing the presence
of voids in the surface of the part. More specifically, the impact of injection

STUDY OF RESIN TRANSFER MOULDING PROCESS PARAMETERS FOR THE MANUFACTURING OF THE SENSOR NOSE CONE
6
pressure, vacuum assistance during injection and the use of hydrostatic
pressure during the curing stage. Figure 9 illustrates the main steps of a
RTM process, and highlights the steps in which the study is focused on.
Figure 9 – Main steps of RTM process
1.5. SIGNIFICANCE OF THE STUDY
It is the interest of all manufacturing companies that use RTM, to make the
process as efficient as possible. In this specific case, by improving the
surface quality after the RTM process, it will result in cost savings in
additional surface treatments.
Additionally, companies are also interested in reducing void content,
because besides affecting the surface finish, it also affects the mechanical
properties of the composite laminate. Therefore, having a part with a void
free surface can be associated with better mechanical properties of the
laminate.
The analysis of RTM process parameters also contributes to an increased
knowledge and experience based on a real application of the studied
concepts, and will allow Terma Aerostructures A/S to approach RTM
processes with confidence on its advantages, by being a reliable and
repeatable process capable of producing quality parts.
1.6. PRIMARY RESEARCH QUESTION
The analysis performed in this study is focused in answering questions
regarding the impact of RTM process parameters, such as injection pressure,
vacuum assistance during injection and hydrostatic pressure during curing,
in the quality of the surface finish of a Sensor Nose Cone.
Based on the conclusions derived from the experiments, this study attempts
to define an ideal approach to inject and cure parts manufactured via RTM.
Preforming Lay-Up Injection CuringPart
Removal

CHAPTER 1. INTRODUCTION
7
1.7. ASSUMPTIONS LIMITATIONS AND SCOPE
In the development of this project it is assumed that the composite version
of the Sensor Nose Cone, developed in the previous semester, can be used
as an example for future applications.
Regarding tooling and equipment, it is considered that the necessary devices
to control the process parameters were available, could be used without
limitations and were free of defects.
In what concerns the variations of the conditions in the room environment in
which the experiments were performed, these were considered negligible.
Therefore, it is assumed that the environmental conditions of the room
cannot be used as an argument to justify two different results from
experiments.
This study was limited on analysing three RTM process parameters, these
being: injection pressure, vacuum assistance during injection and
hydrostatic pressure during curing. Therefore, it is necessary to
acknowledge that there are other parameters capable of affecting the void
content in the surface of a part, which were not taken into consideration,
such as: surface finish of the mould cavity, the method to clean and release
the mould, fibre arrangement, and fibre volume fraction.
The focus of the study is within the injection and curing stages of the RTM
process. Regarding the scope of the conclusions, these shall only be applied
to cases that have the same amount of control of the process parameters as
in this study.


CHAPTER 2. LITERATURE REVIEW
9
CHAPTER 2. LITERATURE REVIEW
In this chapter is made a literature review of three RTM process parameters:
vacuum assistance, injection pressure and hydrostatic pressure. Moreover,
their impact on void formation and growth is highlighted. Each process
parameter is presented independently from the others parameters, in its own
separate section. In this review is also given an overview of the results and
conclusions gathered from other studies that were considered relevant to the
present topic. Thereby an initial understanding of the process parameters is
achieved and may be used to design a RTM test campaign.
2.1. INTRODUCTION TO VOIDS
Although the terms void and porosity have not been yet defined by the
composite industry, it is necessary to establish a definition for both terms. In
this study, the term porosity is used to refer a small pore, whereas void
implies a large pore.
The reduction or elimination of voids in components produced via RTM
requires understanding the mechanics of void formation and growth during
injection and curing of the laminate. Mentioning Hamidi et al. [2], there are
two sources of voids formation in a RTM process: 1) mechanical
entrapment during mould injection; and 2) vaporization of volatiles.
The mechanical entrapment of voids is assumed to arise due to constant
changes in the flow path of the resin caused by the anisotropic permeability
of the reinforcement material [2]. In composites, the anisotropic
permeability generates two types of flow in the preform. One being
classified as a viscous flow, in which the matrix travels through the weave
openings in between fibre bundles, and the other being caused by capillary
flow, in which the resin flows in the tows of the fibre bundles. Considering
the separate effects of each type of flow during the preform impregnation, a
viscous flow occurs with higher injection flow rates, resulting in the
entrapment of voids within the fibre bundles. On the other hand, capillary
flow occurs at lower flow rates and it leads to the entrapment of voids
between fibre bundles.
Another effect of the velocity is related with the flow pattern of the matrix
flow. As it is thought, with a high flow speed, the resin passes through the

STUDY OF RESIN TRANSFER MOULDING PROCESS PARAMETERS FOR THE MANUFACTURING OF THE SENSOR NOSE CONE
10
fibres and causes the formation of vortexes, thus leaving dry surfaces on the
fibres.
In what concerns the formation of voids due to vaporization of volatiles, it is
believed to be related with hygroscopic water absorption by the
reinforcement and matrix materials. As documented by Campbell [3], even
with small amounts of moisture, during the injection and curing process the
conditions can lead to the evaporation of water inside the laminate, resulting
in large gas volumes and pressures.
For the purpose of this study, mathematical methods for the prediction of
void formation and growth were not used, because as referenced by Hamidi
et al. [2], even though several models were created, such models can only
be applied to special conditions that replicate the ones in which they were
created. Based on that, it was chosen not to do so since it would reduce the
applicability of the results obtained in this project in real conditions of
production.
2.2. EFFECT OF VACUUM ASSISTANCE
In composite manufacturing, it is a common practice to use vacuum in order
to improve the quality of the laminate. As explained by Hayward et al. [4],
the positive effect of vacuum assistance is significant, since the resin flow
efficiency is improved due to the increased pressure gradient, as well as due
to the removal of moisture and contaminants absorbed while handling the
materials. Lundstrom et al. [5], also indicates that the improved quality
associated with the use of vacuum is mostly caused by the mechanical effect
due to a reduction in pressure in the trapped air that enhances the degree of
penetration of the resin.
On the other hand, with the use of vacuum assistance some problems can
arise. These can be caused by: an improperly sealed mould, an incomplete
degassing of the resin matrix and the increased size of the voids due to the
reduction of pressure. When using vacuum with an improperly sealed tool,
it generates airflow from the outside of the mould to the inside, in the
direction of the vent ports. This airflow consequently creates a stream of
voids in the laminate, which due to the constant leak flow during injection,
will be entrapped as the resin gelation point is reached, due to the constant
leak flow during injection. In a situation using a resin system that was not
entirely degassed, it can result in a degassing process while the resin is
being injected, leading to an increased quantity of voids in the laminate.
Finally, due to the pressure drop the existing voids will expand, thus making
it harder to remove them, because of the increased adhesion forces with the
CHAPTER 2. LITERATURE REVIEW
11
reinforcement, which makes them less mobile. While smaller voids have
lower adhesion forces which makes them more mobile.
2.3. EFFECT OF INJECTION PRESSURE
In most applications, the use of vacuum is enough to create the necessary
pressure gradient for the resin to fill the mould cavity, but with the purpose
of increasing RTM process efficiency, most manufacturers are using
pressurized resin pots to increase even more the pressure gradient, thus
increasing the injection flow rate. As explained in the beginning of this
chapter, due to the anisotropic permeability of the lay-up, the permeability
inside the fibre bundles is considerably lower than between weave openings
resulting in two different types of flow paths.
As a result of the lower permeability inside the fibre bundles, when the
matrix flow speed increases, viscous flow takes place. This means that the
resin will predominantly flow around the fibre bundles causing the
entrapment of air in the fibre bundles.
2.4. EFFECT OF HYDROSTATIC PRESSURE
In additive polymerization materials [6], as is the case of epoxies, void
formation and growth is largely caused by entrapped volatiles [3]. In this
type of systems, the main volatile is considered to be originated from
hygroscopic water absorption by the reinforcement material and matrix. As
explained by Campbell et al. [3], the amount of absorbed moisture from the
atmosphere is dependent on the relative humidity of the surrounding
environment, whereas the absorption rate is influenced by the room
temperature. For those reasons, composite manufacturers invest in
technology to control the atmospheric conditions for the rooms in which
composite lay-up are made.
The entrapped water develops into a void when the process conditions lead
to the evaporation of the volatiles. Void growth occurs if the volatile
pressure exceeds the resin pressure, therefore the combined quantity of
absorbed moisture, in both reinforcement and matrix, determines the
resultant vapour pressure generated during the curing cycle. Having a higher
moisture content and process temperatures results in a higher vapour
pressure that increases the propensity for void formation and growth.
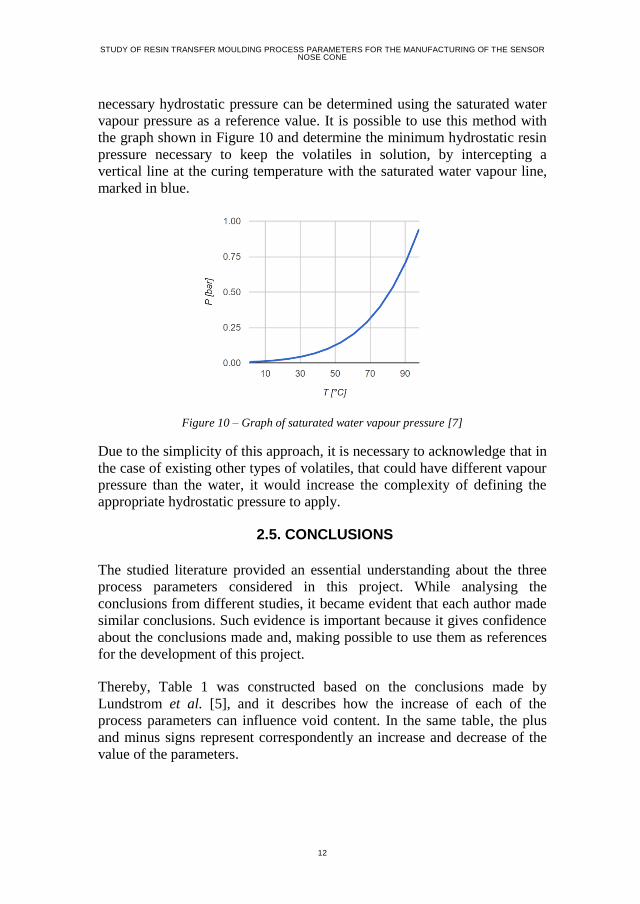
For that reason, having a higher hydrostatic resin pressure than volatile
pressure is essential to keep the volatiles dissolved in solution and the
STUDY OF RESIN TRANSFER MOULDING PROCESS PARAMETERS FOR THE MANUFACTURING OF THE SENSOR NOSE CONE
12
necessary hydrostatic pressure can be determined using the saturated water
vapour pressure as a reference value. It is possible to use this method with
the graph shown in Figure 10 and determine the minimum hydrostatic resin
pressure necessary to keep the volatiles in solution, by intercepting a
vertical line at the curing temperature with the saturated water vapour line,
marked in blue.
Figure 10 – Graph of saturated water vapour pressure [7]
Due to the simplicity of this approach, it is necessary to acknowledge that in
the case of existing other types of volatiles, that could have different vapour
pressure than the water, it would increase the complexity of defining the
appropriate hydrostatic pressure to apply.
2.5. CONCLUSIONS
The studied literature provided an essential understanding about the three
process parameters considered in this project. While analysing the
conclusions from different studies, it became evident that each author made
similar conclusions. Such evidence is important because it gives confidence
about the conclusions made and, making possible to use them as references
for the development of this project.
Thereby, Table 1 was constructed based on the conclusions made by
Lundstrom et al. [5], and it describes how the increase of each of the
process parameters can influence void content. In the same table, the plus
and minus signs represent correspondently an increase and decrease of the
value of the parameters.

CHAPTER 2. LITERATURE REVIEW
13
Table 1 – Influence from process parameters, based on [5]
Parameter
Type of Change
of the parameter Void Content
Vacuum Level + -
Injection Pressure + +
Hydrostatic
Pressure + -
From the literature, it was also possible to establish several good practices
to be used when working RTM composite parts, which were divided in two
different groups. The first group is not directly related with the RTM
process, but plays an important role to obtain a void free laminate. Within
this first group are the following considerations:
Leak free mould: if vacuum is used, a leak in the sealant will create
an air stream, leading to the appearance of voids in the direction
from the leak to the vent ports.
Complete matrix degassing: when using vacuum, if the resin matrix
is not properly degassed, the negative pressure gradient inside the
mould cavity will generate the conditions for a degassing. This will
facilitate the release of entrapped air and volatiles that can cause
voids.
Controlled environment: the room conditions can influence the
laminate quality. Having clean storage and working room, free of
impurities and with a low relative humidity, will result in a laminate
with lower content of contaminants.
Additionally it was also possible to conclude that in situations in which the
mould has a leak or the resin matrix has not been completely degassed, it is
recommended not to use vacuum and, instead of that, use pressure at the
injection pot to push the matrix inside the mould cavity. However, this
approach requires a double sided mould, which results in an increase of
investment for their manufacture when comparing with a Vacuum Assisted
RTM (VARTM) process.
The second group of good practices is directly related with RTM process,
during the injection and curing stages. The injection stage of the RTM
process, as illustrated in Figure 9, can be separated in five sub stages, as
shown in Figure 11.

STUDY OF RESIN TRANSFER MOULDING PROCESS PARAMETERS FOR THE MANUFACTURING OF THE SENSOR NOSE CONE
14
Figure 11 – Sub stages of RTM injection stage
The first two sub stages are relative to the creation of a vacuum pressure in
order to evacuate air and other volatiles from the inside of the mould cavity.
Once the specified vacuum pressure is reached the injection port is opened
to let the resin flow. As explained in Section 2.3, the matrix flow speed
should be as low as possible in order to avoid a predominant viscous flow,
which results in the entrapment of air inside the fibre bundles, but it should
be fast enough so that the injection process is completed before the resin
reaches the gel point. The fourth sub stage corresponds to the complete
filling of the mould cavity, which is considered to be completed when a
clear stream of resin flows out from the vent port. Once the mould filling is
completed the vent ports can be closed.
After closing the vent port, the curing stage can be initiated. For better
quality of the laminate, as presented by Campbell et al. [3], the resin matrix
should cure while applying a hydrostatic resin pressure in order to keep the
volatiles in solution. In cases which the necessary hydrostatic pressure is
unclear, it is possible to define it by using the saturate water vapour pressure
as a reference for the curing temperature. The hydrostatic pressure should be
created after closing the vent port, and before the resin reaches the gel point,
but maintained until the laminate curing is completed.
Finally, the conclusions made based on previous studies about the three
RTM process parameters, will allow comparing and discussing the results
obtained from the test trials made in this study.
Open vent port
Start vacuum
Open injection
port
Fill mould cavity
Close vacuum port
CHAPTER 3. APPROACH AND METHOD
15
CHAPTER 3. APPROACH AND
METHOD
The purpose of this chapter is to delineate and present the strategy specially
designed to study the influence of three variables in the surface finish of a
part produced via RTM process. The chapter takes off with an explanation
about the iterative learning process, followed by a description of the devised
approach and method for this study. The chapter finishes with concluding
remarks about the strategy made.
3.1. LEARNING BY ITERATION
As explained by Hunter et al. [8], scientific research is characterized by
being a process of guided learning, in which learning is considered to be an
iterative process. In other words, a scientific research is a guided iterative
process which evolves based on the knowledge obtained from each
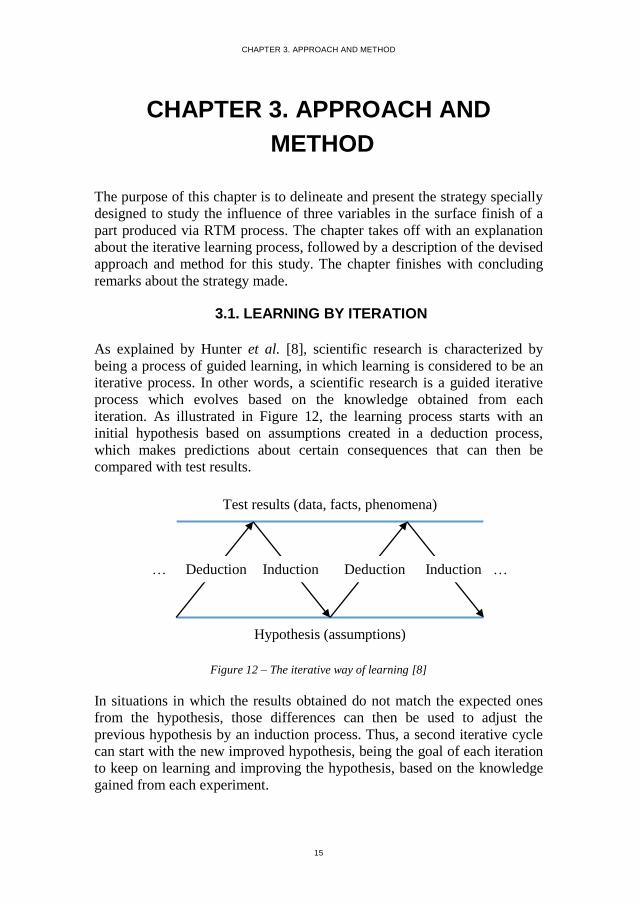
iteration. As illustrated in Figure 12, the learning process starts with an
initial hypothesis based on assumptions created in a deduction process,
which makes predictions about certain consequences that can then be
compared with test results.
Figure 12 – The iterative way of learning [8]
In situations in which the results obtained do not match the expected ones
from the hypothesis, those differences can then be used to adjust the
previous hypothesis by an induction process. Thus, a second iterative cycle
can start with the new improved hypothesis, being the goal of each iteration
to keep on learning and improving the hypothesis, based on the knowledge
gained from each experiment.
Deduction Deduction Induction Induction … …
Test results (data, facts, phenomena)
Hypothesis (assumptions)

STUDY OF RESIN TRANSFER MOULDING PROCESS PARAMETERS FOR THE MANUFACTURING OF THE SENSOR NOSE CONE
16
As illustrated in Figure 13, a feedback loop can also be used to describe the
iterative process of learning. When performing experiments, the hypothesis
shall only be changed based on information collected from the results of the
true state of nature experiments. Thus, it should be noted that to this project,
the expression true state of nature experiment is used to define an
experiment that replicates the same conditions of a real case.
Figure 13 - Representation of the iterative learning process using a feedback loop [8]
It should be noted that to execute experiments it is not necessary to have a
defined strategy, although this might lead to an inefficient iterative process,
whereas without knowledge about the subject it is impossible to learn and to
improve. Hence, the goal of using statistical methods is to make the process
as efficient as possible. Finally, the true state of nature has to be correctly
replicated in order to extract the pretended data from the experiments,
otherwise they will provide results with useless applicability.
3.2. APPROACH
As explained in Chapter 1, Sections 1.4 and 1.6, the goal of this study was
to analyse the impact of injection pressure, vacuum assistance during
injection and the impact of hydrostatic pressure during the curing stage of
the RTM process, for the quality of the surface finish. For the purpose of
CHAPTER 3. APPROACH AND METHOD
17
this learning process, the Sensor Nose Cone was used as an example to test
and implement the findings.
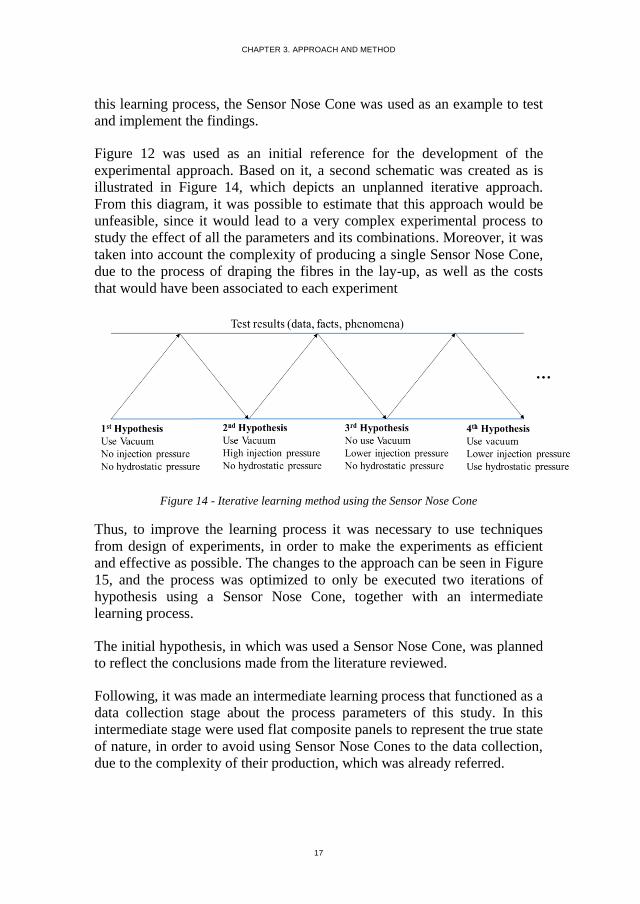
Figure 12 was used as an initial reference for the development of the
experimental approach. Based on it, a second schematic was created as is
illustrated in Figure 14, which depicts an unplanned iterative approach.
From this diagram, it was possible to estimate that this approach would be
unfeasible, since it would lead to a very complex experimental process to
study the effect of all the parameters and its combinations. Moreover, it was
taken into account the complexity of producing a single Sensor Nose Cone,
due to the process of draping the fibres in the lay-up, as well as the costs
that would have been associated to each experiment
Figure 14 - Iterative learning method using the Sensor Nose Cone
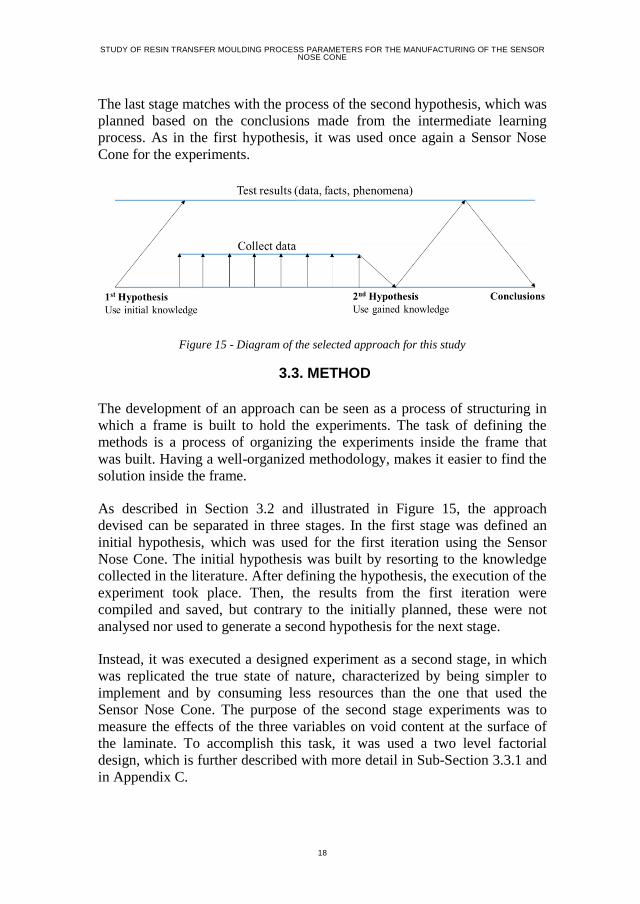
Thus, to improve the learning process it was necessary to use techniques
from design of experiments, in order to make the experiments as efficient
and effective as possible. The changes to the approach can be seen in Figure
15, and the process was optimized to only be executed two iterations of
hypothesis using a Sensor Nose Cone, together with an intermediate
learning process.
The initial hypothesis, in which was used a Sensor Nose Cone, was planned
to reflect the conclusions made from the literature reviewed.
Following, it was made an intermediate learning process that functioned as a
data collection stage about the process parameters of this study. In this
intermediate stage were used flat composite panels to represent the true state
of nature, in order to avoid using Sensor Nose Cones to the data collection,
due to the complexity of their production, which was already referred.
STUDY OF RESIN TRANSFER MOULDING PROCESS PARAMETERS FOR THE MANUFACTURING OF THE SENSOR NOSE CONE
18
The last stage matches with the process of the second hypothesis, which was
planned based on the conclusions made from the intermediate learning
process. As in the first hypothesis, it was used once again a Sensor Nose
Cone for the experiments.
Figure 15 - Diagram of the selected approach for this study
3.3. METHOD
The development of an approach can be seen as a process of structuring in
which a frame is built to hold the experiments. The task of defining the
methods is a process of organizing the experiments inside the frame that
was built. Having a well-organized methodology, makes it easier to find the
solution inside the frame.
As described in Section 3.2 and illustrated in Figure 15, the approach
devised can be separated in three stages. In the first stage was defined an
initial hypothesis, which was used for the first iteration using the Sensor
Nose Cone. The initial hypothesis was built by resorting to the knowledge
collected in the literature. After defining the hypothesis, the execution of the
experiment took place. Then, the results from the first iteration were
compiled and saved, but contrary to the initially planned, these were not
analysed nor used to generate a second hypothesis for the next stage.
Instead, it was executed a designed experiment as a second stage, in which
was replicated the true state of nature, characterized by being simpler to
implement and by consuming less resources than the one that used the
Sensor Nose Cone. The purpose of the second stage experiments was to
measure the effects of the three variables on void content at the surface of
the laminate. To accomplish this task, it was used a two level factorial
design, which is further described with more detail in Sub-Section 3.3.1 and
in Appendix C.
CHAPTER 3. APPROACH AND METHOD
19
Finally, the third stage, which corresponds to the second iteration of the
Sensor Nose Cone, makes a hypothesis that was built from the conclusions
derived from the designed experiments. Then, the results from the first
iteration using the Sensor Nose Cone were compared with the second
iteration and a conclusion from the results was discussed.
3.3.1. FACTORIAL DESIGN AT TWO LEVELS
According to Hunter et al. [8], factorial design is composed by a set of
variables, denominated as factors. For each variable it is selected a fixed
number of versions, also called levels, and the experimental tests are done
using all the possible combinations of the variables. For example, in a
situation in which is pretended to experiment three variables, v1, v2 and v3,
if v1 has four variations, v2 has five variations and v3 has two variations,
thus forty experimental runs are necessary to make the complete set of
combinations. Whereas, with factorial design at two levels, each variable
only has two variations, making a total number of runs to complete all the
combinations of eight, thus reducing the amount of time and cost for these
experiments.
Since factorial design at two levels limits each variable to two levels only,
this characteristic restricts its capacity to investigate a wider panel in the
factor space. Thus, this method is used to identify trends. For that reason,
factorial design at two levels is used to determine promising directions,
either as a filter for further experiments or as a guide to create concepts for
implementation.
Based on the arguments explained above, factorial design at two levels was
used to study the variables injection pressure, vacuum assistance and
hydrostatic pressure in the intermediate learning process.
3.3.2. GRADING SYSTEM FOR THE CLASSIFICATION OF THE RESULTS
The method selected to evaluate the results from the experiments, of the
factorial design at two levels, was based on a qualitative grading system,
which use a visual inspection, assisted with a microscope. The grading
system classifies the results of each experiment, in a scale from one to five
and is fully described below:
STUDY OF RESIN TRANSFER MOULDING PROCESS PARAMETERS FOR THE MANUFACTURING OF THE SENSOR NOSE CONE
20
Grade 1: is given to a complete failed laminate, meaning that there
is a combination of a dry spot and a large quantity of voids.
Grade 2: is used to describe a laminate without one of the defects,
but its quality is still unacceptable.
Grade 3: classifies a panel with a reasonable quality, which still a
considerable amount of voids.
Grade 4: describes a panel with almost no voids.
Grade 5: is given to a panel with no visible voids, and a very low
quantity of porosities.
The other option would have been to use a quantitative approach, counting
the number of voids and porosities in a defined area. This approach was
discarded, due to the difficulties of defining an appropriate region to make
the measurements that would represent an entire specimen, as well as the
difficulties associated to the counting of the exact number of porosities and
voids in the constrained region.
3.4. CONCLUSIONS
The knowledge obtained by learning about iteration using designed
experiments (data collection stage), allowed to avoid using an inappropriate
standard iterative approach. Instead, it was tailored a strategy capable of
meeting the requirements for this specific study. This resulted in the
creation of an efficient approach that contained the necessary methods to
study the variables, and in which the true state of nature of the RTM process
for the Sensor Nose Cone was guaranteed.
The division of the approach in three sections allowed to apply an initial
hypothesis based on the principles learned from the literature, and
afterwards compare them with a second hypothesis created based on the
data collected from a designed learning process. The approach illustrated in
Figure 14 was discarded because of its inefficiency as well as uncertainties
regarding the usefulness of the experimental runs to yield the necessary data
to generate a second hypothesis for the RTM process.
Factorial design at two levels was the selected method to organize the
intermediate learning process. This method was chosen due to its capacity to
indicate the impact of each variable, while using a lower number of
experimental runs.

CHAPTER 3. APPROACH AND METHOD
21
Due to the difficulties associated with using quantitative measurements to
evaluate the results from the experiments, it was decided to use instead a
qualitative system, which grades the results using a scale from 1 to 5.
Despite the subjectivity associated with a qualitative grading system, it was
considered that this method would provide enough detail to be able to
differentiate the results.
Lastly, it should be noticed the importance of delineating the chosen
strategy in order to perform the necessary experiments efficiently and to
collect the data as efficiently as possible.


CHAPTER 4. IMPLEMENTATION
23
CHAPTER 4. IMPLEMENTATION
This chapter is focused in presenting how the approach and methods were
implemented in order to initiate the learning process. The chapter starts with
a description of the process of defining the initial hypothesis and its
implementation in order to produce a Sensor Nose Cone. Following, it is
made a description about the designed experiments for the intermediate
learning process, as well as about the implementation of factorial design at
two levels. The chapter finishes with a short conclusion about the challenges
of implementing each task.
4.1. INITIAL HYPOTHESIS
The present section is focused on explaining and presenting the decisions
made for the initial hypothesis. This section starts by defining the three
process parameters, based on the reviewed literature. Afterwards are
explained the procedures for the RTM process. Finally, are presented the
assumptions made for the expected results.
4.1.1. VACUUM ASSISTANCE
In most RTM applications, the use of vacuum is considered essential.
Nevertheless, for the initial hypothesis of this project it was decided not to
use vacuum assistance. The reason for not using vacuum can be justified by
the high probability of having a leak in the mould sealant. Thus, such would
result in an air stream from the outside of the mould to the outlet ports,
consequently leading to the entrapment of air bubbles.
The source of the leak in the mould cavity was believed to be originated at
the O-ring joints. In this experiment, there were two factors that contributed
for the appearance of the leak, the first being related with the design of the
seal grove, and the second being related to the production process of the O-
ring. In Figure 16, it is schematized the intersection of the T-joint with the
mould surfaces. In the scheme, the red curved line, inside the circled region,
points the area that was not being effectively compressed vertically, thus
facilitating the passage of air.

STUDY OF RESIN TRANSFER MOULDING PROCESS PARAMETERS FOR THE MANUFACTURING OF THE SENSOR NOSE CONE
24
Figure 16 – Representation of the O-ring, the T-joint and the grove faces
The O-ring with the T-join used for the experiment is illustrated in Figure 5.
Figure 17 illustrates the bonded joint, in which it is also possible to observe
the flaws that could cause leak in the sealing. By analysing this image, it is
possible to conclude that, as described in Section 1.2 the process used to
fabricate the O-ring with the T-joint was not suitable for the case, but due to
cost limitations and as there were no other options, the study had to continue
with this joint.
Figure 17 – Glued T-joint of the O-ring
Since the first hypothesis does not use vacuum assistance during injection, it
can reduce the degree of penetration of the resin in the fibres. Therefore,
such ought to be compensated with the injection pressure.
CHAPTER 4. IMPLEMENTATION
25
4.1.2. INJECTION PRESSURE
The process of defining the injection pressure can be considered complex,
since it has to be adjusted in order to guarantee that the resin penetrates
through the fibres and that the injection process is completed before the
resin reaches the gel point. Hence, in order to define the optimal value for
the injection pressure it is necessary to know its relation with flow speed.
To study the relation between injection time and injection pressure, were
made simulations using Finite Element Analysis (FEA) based on Darcy’s
Law, which is used to calculate the flow speed based on the permeability of
the material and the pressure gradient between the inlet and outlet ports,
shown in Eq. 1 from Appendix A. The flow speed is then used to find the
flow rate of the resin, and finally the injection time is calculated by dividing
the mould cavity volume by the flow rate. To execute the simulations using
Darcy’s Law, it was also necessary to perform an additional experiment
focused on determining an approximate value of the laminate permeability.
It is important to note that the simulations made did not predict how the
resin would flow inside the mould cavity, as well it did not consider the
necessary bleeding time to extract the remaining entrapped bubbles. A full
description of the permeability experiments and of the injection time
simulations are provided in Appendix A and Appendix B, correspondently.
Comparing the gel time of the resin matrix, Araldite® LY 1564 / Aradur®
3486, and the results obtained from the injection simulation, it was possible
to conclude that, in this case, the gel time would not constrain the injection
pressure. Such can be justified by the fact that even when a low pressure
gradient is applied, i.e. 0.5 bar, the injection time is shorter that the gel time
of the resin system. Thus, the only parameter constraining the injection
pressure would be the level of penetration.
Then, for the initial hypothesis, it was decided to start the injection process
at 0.25 bar. After five minutes, the injection pressure was increased to 0.5
bar and maintained for ten minutes. From then on, the injection pressure
was increased every five minutes with 0.5 bar increments until reaching a
final value of 3 bar.
STUDY OF RESIN TRANSFER MOULDING PROCESS PARAMETERS FOR THE MANUFACTURING OF THE SENSOR NOSE CONE
26
4.1.3. HYDROSTATIC PRESSURE
As explained in Section 2.4, the hydrostatic pressure can be used in order to
keep the volatiles in solution. Additionally to that, in this application, the
hydrostatic pressure was also used to increase the degree of penetration of
the resin.
Based on the saturated water vapour pressure, and considering that the
curing temperature was 100 ºC, the applied hydrostatic pressure had to be
above the atmospheric pressure, 1.0133 bar. Since the mould cavity did not
have pressure transducers, it was necessary to consider that, due to pressure
losses, the hydrostatic pressure inside the mould cavity would be equal or
lower than the pressure applied in the resin pot. As there are no references
stating that using a high hydrostatic pressure can cause void formation or
any other type of defect, it was decided to apply 3 bar at the resin pot,
during the curing process.
4.1.4. PROCEDURES
This section presents the list of procedures used to carry out the experiment.
This was made in order to have a list of instructions, which assisted the
experiment, so that each task could be done and checked along its
execution.
1. Tool warm-up: started heating the mould to the injection
temperature of 40ºC and maintained for thirty minutes to obtain a
uniform heat distribution.
2. Pressure regulation: before closing the resin pot, the pressure valve
had to be adjusted to 0.25 bar. This was necessary in order to avoid
shooting the resin faster than planned.
3. Open injection valve: released the pinch valve at the exit of the
resin pot, allowing the resin to start flowing.
4. Injection process: as defined in Sub-section 4.1.2, the injection
process started at 0.25 bar and, was increased after five minutes to
0.5 bar, being maintained for ten minutes. After that, every five
minutes, the pressure was increased by 0.5 bar increments until a
pressure of 3 bar was reached.
5. Control outlet ports: forced a uniform exiting flow through all the
outlet ports. In the case the matrix only came out from a single
outlet port, this one had to be closed in order to achieve an even
distribution through all the ports.
CHAPTER 4. IMPLEMENTATION
27
6. Close all outlet port: once a uniform resin stream was achieved in
all outlet ports, these were closed. Note that the exiting flow did not
need to be clear of bubbles. Closing all the outlet ports stopped the
resin flow and increased the pressure inside the mould cavity.
7. Bleeding process: while maintaining the pressure at 3 bar, all the
outlet ports were opened and closed one by one. Once a port was
open, it should be closed only when the exiting stream contained a
residual quantity of bubbles. The purpose of that was to allow the
exit of entrapped air bubbles in the regions of each outlet port.
8. Close all outlet ports: after the bleeding process, once a clear stream
came out from all outlet ports, all had be closed.
9. Adjust to curing pressure: adjusted the pressure at the resin pot to
create a hydrostatic pressure. The pressure value was 3 bar.
10. Raise temperature: after adjusting the pressure at the resin pot, the
mould temperature could be increased to 100 ºC, corresponding to
the curing temperature.
4.1.5. ASSUMPTIONS
For the initial hypothesis it was decided not to use vacuum assistance,
because of the risk of creating an air flow due to a possible leak in the
sealant. Since vacuum was not used during the injection process, it was
assumed that regardless the injection pressure, air bubbles would always be
entrapped in the laminate. Yet, it is believed that due to the flow speed, the
quantity of entrapped voids would be larger with an increased injection
pressure. Therefore, it was necessary to develop a technique that used the
injection pressure in order to reduce the quantity of voids.
In the devised method, the resin viscosity was reduced by increasing the
injection temperature of the mould to 40 ºC, together with the use of a low
injection pressure during the first fifteen minutes of the injection process, in
order to avoid dry stops and ensuring a proper distribution of the resin
inside the mould cavity.
The pressure was then increased in order to fill the mould cavity as fast as
possible, but one of the risks of increasing the flow speed was to create
large dry spots. Thus, as explained in Sub-section 4.1.4, it was necessary to
control the outlet ports before closing them.
Once all outlet ports were closed, the resin flow was stopped and the
pressure inside of the mould cavity increased to approximately 3 bar. This
increment caused a reduction of the air bubbles size, thus increasing their
STUDY OF RESIN TRANSFER MOULDING PROCESS PARAMETERS FOR THE MANUFACTURING OF THE SENSOR NOSE CONE
28
density. By reducing their size, the movement of the bubbles was easier, but
the increased density resulted in lower buoyancy. This effect combined with
the vertical orientation of the mould facilitated the upstream flow of the air
bubbles in the direction of the outlet ports.
The key technique used to replace the vacuum assistance was the bleeding
process, which worked as a controlled gating of the outlet ports. This
technique allowed the escape of the accumulated air bubbles in the region of
the opened outlet.
Finally, besides preventing the evaporation of volatiles during curing, it was
also expected that the degree of penetration of the resin would improve from
the applied hydrostatic pressure.
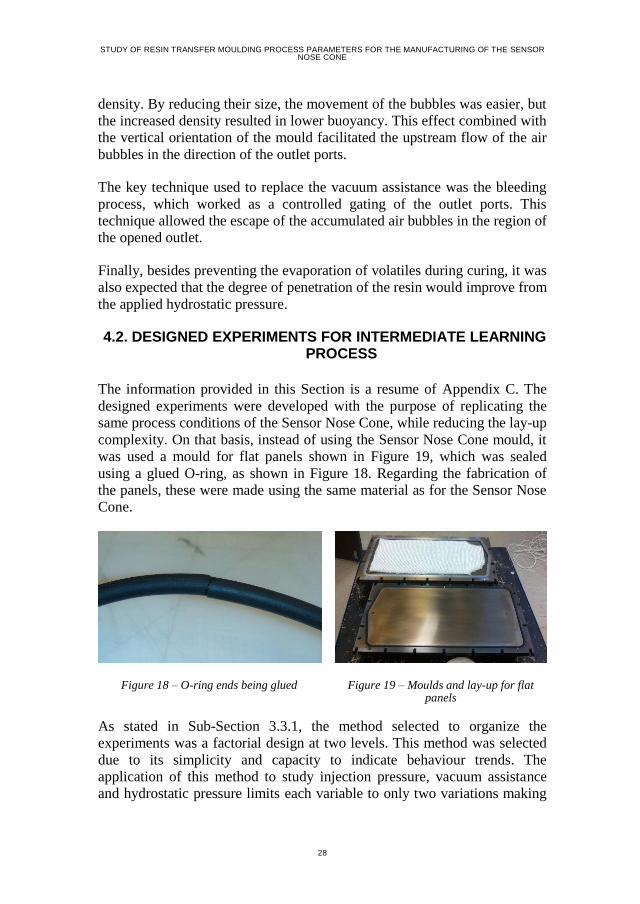
4.2. DESIGNED EXPERIMENTS FOR INTERMEDIATE LEARNING PROCESS
The information provided in this Section is a resume of Appendix C. The
designed experiments were developed with the purpose of replicating the
same process conditions of the Sensor Nose Cone, while reducing the lay-up
complexity. On that basis, instead of using the Sensor Nose Cone mould, it
was used a mould for flat panels shown in Figure 19, which was sealed
using a glued O-ring, as shown in Figure 18. Regarding the fabrication of
the panels, these were made using the same material as for the Sensor Nose
Cone.
Figure 18 – O-ring ends being glued
Figure 19 – Moulds and lay-up for flat panels
As stated in Sub-Section 3.3.1, the method selected to organize the
experiments was a factorial design at two levels. This method was selected
due to its simplicity and capacity to indicate behaviour trends. The
application of this method to study injection pressure, vacuum assistance
and hydrostatic pressure limits each variable to only two variations making

CHAPTER 4. IMPLEMENTATION
29
a total of eight possible combinations. In Table 2 are compiled all the
possible combinations for a two level factorial design, together with the
assigned values for each variable.
Table 2 – Experimental combinations and the values assigned to each variable
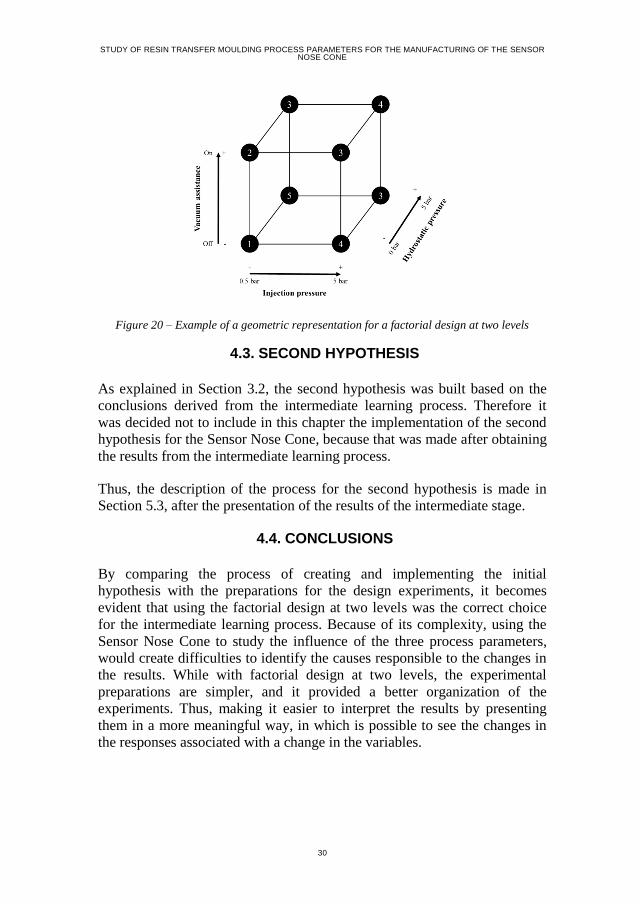
As explained in Sub-section 3.3.2, to evaluate the results obtained from each
panel, it was chosen a qualitative grading system based on visual inspection
assisted with a microscope. The grading scale ranges from one to five. A
grade one classifies a failed laminate, which has a combination of a dry spot
and a large quantity of voids. On the opposite side of the scale, a grade five
is given to a laminate without any visible voids, and a very low amount of
porosities. The results obtained are then displayed via a geometric
representation, as the example shown in Figure 20, capable of displaying the
relations between changes in the process parameters.
Test Number
1
2
3
4
5
6
7
8
Symbol - + - + - +
Values 0.5 5 OFF ON 0 5
-
-
Hydrostatic pressure
+
-
-
Vacuum assistance
+
+
+
+
-
-
+
-
+
-
Injection pressure
+
+
-
-
+
+
-
+
-
Injection Pressure [bar] Hydrostatic Pressure [bar]Vacuum Pressure
STUDY OF RESIN TRANSFER MOULDING PROCESS PARAMETERS FOR THE MANUFACTURING OF THE SENSOR NOSE CONE
30
Figure 20 – Example of a geometric representation for a factorial design at two levels
4.3. SECOND HYPOTHESIS
As explained in Section 3.2, the second hypothesis was built based on the
conclusions derived from the intermediate learning process. Therefore it
was decided not to include in this chapter the implementation of the second
hypothesis for the Sensor Nose Cone, because that was made after obtaining
the results from the intermediate learning process.
Thus, the description of the process for the second hypothesis is made in
Section 5.3, after the presentation of the results of the intermediate stage.
4.4. CONCLUSIONS
By comparing the process of creating and implementing the initial
hypothesis with the preparations for the design experiments, it becomes
evident that using the factorial design at two levels was the correct choice
for the intermediate learning process. Because of its complexity, using the
Sensor Nose Cone to study the influence of the three process parameters,
would create difficulties to identify the causes responsible to the changes in
the results. While with factorial design at two levels, the experimental
preparations are simpler, and it provided a better organization of the
experiments. Thus, making it easier to interpret the results by presenting
them in a more meaningful way, in which is possible to see the changes in
the responses associated with a change in the variables.

CHAPTER 4. IMPLEMENTATION
31
In this chapter is not presented the implementation of the second hypothesis
because it was made based on the experiment of the intermediate stage with
the best results. For that reason its implementation is discussed in the
following chapter.

CHAPTER 5. RESULTS
33
CHAPTER 5. RESULTS
In this chapter the results from each experiment are presented in separate
sections, and then the results are discussed in the conclusions. Due to the
nature of the approach defined in Section 3.2, this chapter is organized in a
chronological manner, since each step was performed sequentially.
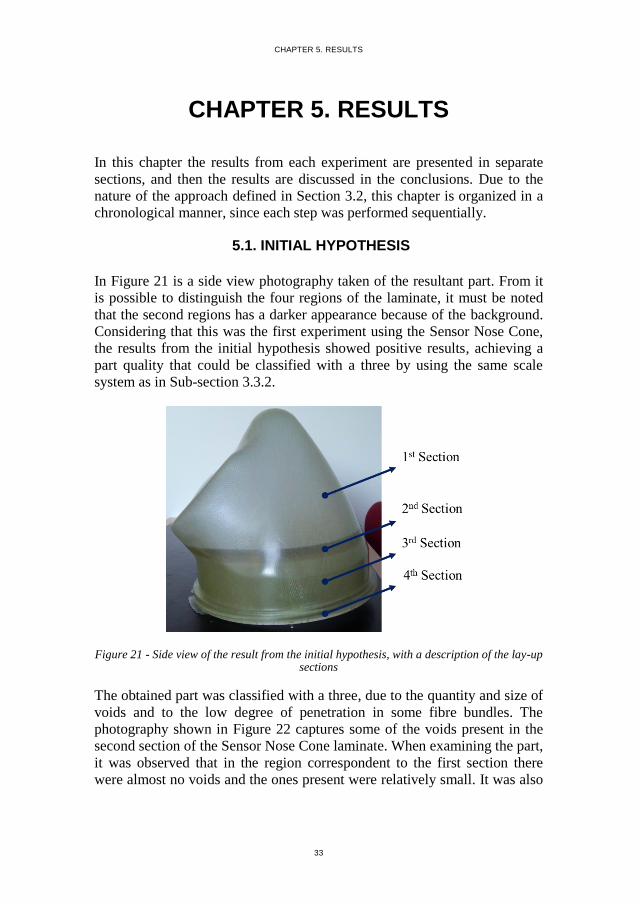
5.1. INITIAL HYPOTHESIS
In Figure 21 is a side view photography taken of the resultant part. From it
is possible to distinguish the four regions of the laminate, it must be noted
that the second regions has a darker appearance because of the background.
Considering that this was the first experiment using the Sensor Nose Cone,
the results from the initial hypothesis showed positive results, achieving a
part quality that could be classified with a three by using the same scale
system as in Sub-section 3.3.2.
Figure 21 - Side view of the result from the initial hypothesis, with a description of the lay-up sections
The obtained part was classified with a three, due to the quantity and size of
voids and to the low degree of penetration in some fibre bundles. The
photography shown in Figure 22 captures some of the voids present in the
second section of the Sensor Nose Cone laminate. When examining the part,
it was observed that in the region correspondent to the first section there
were almost no voids and the ones present were relatively small. It was also

STUDY OF RESIN TRANSFER MOULDING PROCESS PARAMETERS FOR THE MANUFACTURING OF THE SENSOR NOSE CONE
34
possible to notice that the void quantity and their size increased in the
second section and above. Regarding the degree of penetration of the resin,
as shown in Figure 23, the fibre bundles with a whiter coloration indicated
that the inside of the fibre bundles might be dry, thus meaning a low degree
of penetration of the resin.
A positive outcome of this experiment was the part surface finish, which
was free of irregularities caused by voids, with the exception of the regions
close to the outlet ports, as shown in Figure 24. An unexpected result was
injection time, which without counting with the bleeding process, took forty
three minutes.
Figure 22 – Voids present in the second section
Figure 23 – Fibre bundles with a low degree of penetration
Figure 24 – Voids in the surface close to the outlet ports

CHAPTER 5. RESULTS
35
5.2. DESIGNED EXPERIMENTS FOR INTERMEDIATE LEARNING PROCESS
As in Section 4.2, here is presented a summary of Appendix C with the
results obtained in the intermediate learning process. Table 3 displays the
grades for each test panel, together with comments about the quality of each
panel. The results are then compiled and presented in a geometrical
representation in Figure 25. Finally, pictures of each panel can be found in
Appendix C.
Table 3 - Experiment combinations with the corresponding grades
Test Number Combination Grade Comment
1 - / - / - 2 High quantity of voids
Large area with low penetration
2 + / - / - 1 Large dry area
High quantity of voids
3 - / + / - 4
No visible voids
Low quantity of porosities
Low degree of penetration
4 + / + / - 1 Large dry spots
High quantity of voids
5 - / - / + 4
Low quantity of voids
High degree of penetration
High quantity of porosities
6 + / - / + 2
Large dry spots
Fibre distortion
High degree of penetration
Low quantity of voids and
porosities
7 - / + / + 5
No visible voids
Low quantity of porosities
Excellent degree of penetration
8 + / + / + 4
Dry spot
High degree of penetration
Low quantity of voids and
porosities

STUDY OF RESIN TRANSFER MOULDING PROCESS PARAMETERS FOR THE MANUFACTURING OF THE SENSOR NOSE CONE
36
Figure 25 – Geometrical representation of the results
5.3. IMPLEMENTATION AND RESULTS OF THE SECOND HYPOTHESIS
5.3.1. IMPLEMENTATION OF THE SECOND HYPOTHESIS
The purpose of this sub-section is to present and explain the second
hypothesis for the RTM process of the Sensor Nose Cone. As explained in
Section 3.3, the second hypothesis was built based upon the conclusions
collected from the results of the intermediate learning process. Similarly to
Section 4.1, this sub-section begins with a description about the values of
each parameter for the second hypothesis, then a summary of the procedures
for the RTM process is presented, followed by an explanation of the
expected results.
5.3.1.1 Vacuum Assistance
It is possible to observe, from the results of the intermediate learning
process, by comparing the top and bottom plane of the geometrical
representation in Figure 28, that even with a leak in the sealing of the
mould, using vacuum assistance during injection, improves the quality of
the laminate. Based on these results, it was decided to use vacuum during
the injection stage of the process.
CHAPTER 5. RESULTS
37
5.3.1.2 Injection Pressure
In the intermediate learning process, it was found that using a high injection
pressure can lead to the creation of large dry spots in the laminate and,
opposite to that, using a low injection pressure leads to a lower void content
as well as prevents the appearance of dry spots. When defining the injection
time, it was necessary to consider that the injection process of the initial
hypothesis took longer than expected. Therefore, using a low injection
pressure could result in an incomplete injection of the mould cavity. Despite
that risk, since this approach used vacuum, which increases the pressure
gradient and consequently improves the flow of the resin, it was decided to
use a constant injection pressure of 0.5 bar for the second hypothesis.
5.3.1.3 Hydrostatic Pressure
Based on the results obtained from the test panels, in Section 0, it became
obvious that increasing the hydrostatic pressure seemed to only improve the
laminate quality by increasing the degree of penetration of the resin and
reducing void content. Therefore, the curing temperature was maintained,
but the hydrostatic pressure was increased from 3 to 5 bar in the second
hypothesis experiment.
5.3.1.4 Procedures
As in Sub-Section 4.1.4, here are presented a resumed list of the procedures
taken for the RTM process using the second hypothesis:
1. Tool warm-up: started heating the mould to the injection
temperature of 40ºC, and maintained it for thirty minutes to obtain a
uniform heat distribution.
2. Pressure regulation: before closing the resin pot, the pressure valve
had to be adjusted to 0.5 bar.
3. Apply vacuum: Opened the vacuum valve in order to create vacuum
inside the mould cavity. Maintained it open.
4. Open injection valve: After opening the vacuum valve for 5
minutes, the pinch valve at the exit of the resin pot was released,
allowing the resin to start flowing.
5. Injection process: Maintained injection pressure at 0.5 bar and
continued using vacuum assistance.
6. Control outlet ports: forced a uniform exiting flow through all the
outlet ports. In the case the matrix only came out from a single

STUDY OF RESIN TRANSFER MOULDING PROCESS PARAMETERS FOR THE MANUFACTURING OF THE SENSOR NOSE CONE
38
outlet port, this one had to be closed in order to achieve an even
distribution through all the ports.
7. Close all outlet port: once a uniform resin stream was achieved in
all outlet ports, these were closed. Note that the exiting flow did not
need to be clear of bubbles. Closing all the outlet ports stopped the
resin flow and increased the pressure inside the mould cavity.
8. Close vacuum: stopped the vacuum assistance and released the
vacuum to create an atmospheric pressure in the outlet ports.
9. Apply hydrostatic pressure: before the bleeding process, the
injection pressure was increased to 5 bar and maintained during two
minutes.
10. Lower pressure: After applying a pressure of 5 bar during two
minutes, the pressure was lowered to 0.5 bar.
11. Bleeding process: while maintaining the pressure at 0.5 bar, all the
outlet ports were opened and closed one by one. Once a port was
open, it should be closed only when the exiting stream contained a
residual quantity of bubbles. The purpose of that was to allow the
exit of entrapped air bubbles in the regions of each outlet port.
12. Close all outlet ports: after the bleeding process, once a clear stream
came out from all outlet ports, all had to be closed.
13. Adjust to curing pressure: adjusted the pressure at the resin pot to
create a hydrostatic pressure. The pressure value was 5 bar.
14. Raise temperature: after adjusting the pressure at the resin pot, the
mould temperature could be increased to 100 ºC, corresponding to
the curing temperature.
5.3.1.5 Assumptions
For the second hypothesis, it was decided to use vacuum assistance during
the injection process, until resin flowed out of the outlet ports. After the
injection was completed, the vacuum assistance was shut down and the
pressure of the outlet ports raised to the atmospheric pressure. This decision
replicates the procedures used for the designed experiments of the
intermediate learning process, in which was demonstrated that having a leak
in the sealing of the mould and using vacuum assistance would not lead to
the formation of voids.
The choice of the injection pressure was made based on Figure 29, from
which is possible to see that using a lower injection pressure would lead to a
lower void content of the laminate. However, using such a low injection
pressure would increase the risk of having an incomplete injection process.
In spite of that, it was considered that, since it was used vacuum assistance,

CHAPTER 5. RESULTS
39
the pressure gradient would be enough to make the resin flow through the
lay-up.
Similarly to what was done in the initial hypothesis, for the second
hypothesis it was also decided to bleed the mould cavity. This procedure
may seem unnecessary because the process used vacuum assistance, and
theoretically, there would not be any entrapped air to remove by bleeding
the mould. But since the seal had leaks, there was a certain amount of air
bubbles caused by the flow stream of air from the outside to the inside of
the mould, in the direction of the vent ports. In the procedure list in Step 9,
before bleeding the mould it was applied a hydrostatic pressure of five bar.
This was done with the purpose of increasing the degree of penetration of
the resin matrix, as well as push the voids in the direction of the outlet ports.
Finally, the hydrostatic pressure was applied based on the same reasons as
the initial hypothesis, but in this case it was increased to five bar. This
adjustment was made, because the results from the experiments of the
intermediate learning process did not show signs of negative effects from
applying a higher pressure than the necessary to overcome the saturated
vapour pressure.
5.3.2. RESULTS OF THE SECOND HYPOTHESIS
The results from the second hypothesis are visible in Figure 26. From it, is
possible to see that with this approach the quality of the Sensor Nose Cone
is much lower than the one with the initial hypothesis. Although
unexpected, the Sensor Nose Cone laminate was not fully wet, thus
resulting in large dry spots. Besides that, were also identified large voids,
mostly in the resin rich area of the second section and near the inlet port.
Additionally, despite using a higher hydrostatic pressure, the degree of
penetration of the resin matrix is clearly lower than the one obtained with
the initial hypothesis. Such is evident by the whiter colour of the fibre
bundles.
Another unexpected result was the time required to complete the injection
procedure, which was seventeen minutes. Comparing this result with the
value obtained in the simulation of the injection time for scenario two, in
Appendix B, it shows that the injection time calculated from the simulation
almost meets the experiment, which was not the case in with the first
hypothesis.

STUDY OF RESIN TRANSFER MOULDING PROCESS PARAMETERS FOR THE MANUFACTURING OF THE SENSOR NOSE CONE
40
a) Front view
b) Back view
c) Left view
d) Right view
Figure 26 – Images of the Sensor Nose Cone produced using the second hypothesis
5.4. CONCLUSIONS
In this section are discussed the conclusions derived from the results
obtained with the experiments made. The section follows the same order as
the previous sections, starting with the results of the initial hypothesis, being
followed by the intermediate learning process and by the second hypothesis.
Finally, the chapter resumes with an overall conclusion about the results
obtained in this study.
5.4.1. INITIAL HYPOTHESIS
The hypothesis used for the first experiment with the Sensor Nose Cone
proved to meet the assumptions made, and demonstrated to be an effective
approach by achieving a good quality part. By comparing the results

CHAPTER 5. RESULTS
41
obtained with the initial hypothesis and the test panels from the intermediate
learning process, it becomes noticeable that the panel from test five, that
used a low injection, no vacuum and five bar of hydrostatic pressure, had
similar type of defects. Such can be explained by the resemblances of the
injection approach.
The defects identified in the laminate correspond to the quantity and size of
voids and to the low degree of penetration in some fibre bundles. Regarding
void content, it was noticed that the first section of the laminate did not
contain visible voids to the naked eye. Therefore, it is considered that the
voids from the first section travelled upwards, in the direction of the vent
ports, and when the bleeding process stopped these got trapped in the above
sections of the laminate. Thus, void quantity could have been reduced by
continuing the bleeding process. Additionally, it must be noted that the
quantity of voids in the surface of the laminate was residual, such is
considered to be a result of the vertical orientation of the mould, and the
upstream flow of the resin, as demonstrated in Figure 41 from Appendix B.
In relation to the degree of penetration of the resin, it is believed that it
could have been improved by increasing the hydrostatic pressure before the
curing process.
Finally, it was expected that the injection process would have been
completed in thirty minutes, after increasing the injection pressure to two
bar. However, this did not happen and the discrepancy between the expected
injection time and the actual result indicates the presence of a parameter
causing an increase in the flow resistance, thus slowing the injection
process. The differences in the results obtained is believed to have been
caused by the difficulties of draping the fibres always in the same way.
Therefore, the fibre angles of the laminate for the initial hypothesis must
have been different from the ones used to study the permeability of the
material (Appendix A).
5.4.2. DESIGNED EXPERIMENTS FOR INTERMEDIATE LEARNING PROCESS
Using a factorial design at two levels revealed to be an effective and
efficient strategy to study the impact of RTM process parameter in void
content in the surface of the laminate. By looking at Table 3, it is possible to
observe that no panel got a grade three, meaning that the data collected
represents only the extreme responses towards the change of variables.
Thus, proving that factorial design at two levels is an appropriate method to
indicate behavioural trends caused by changes in the variables. Also, the

STUDY OF RESIN TRANSFER MOULDING PROCESS PARAMETERS FOR THE MANUFACTURING OF THE SENSOR NOSE CONE
42
geometrical representation in Figure 25 proved to be a very useful method
of displaying the results, by facilitating the analysis of different
combinations of variables and their impact in the laminate quality.
As explained in Appendix C, the geometrical representation of the results
allowed to establish several relationships between the variables. In Figure
27 are used red arrows to point out how the quality of the laminate can be
improved by changing one or more variables. Additionally, another three
relationships are made. In Figure 28, it is made a comparison between the
bottom and top planes of the cube, showing that the quality of the laminate
increases by using vacuum assistance. A similar technique is used in Figure
29 to compare the left and right side of the cube, demonstrating that
reducing the injection pressure leads to a reduction in void content and
prevents the creation of dry spots. Regarding the hydrostatic pressure, the
experiments showed that it is more effective when using a low pressure
gradient, because with a higher flow speed the risk of creating a dry spot
increases, and from the results it appears that the hydrostatic pressure by
itself is not enough to compensate the dry areas.
Figure 27 – Geometrical representation of the results, with relationship arrows

CHAPTER 5. RESULTS
43
Figure 28 – Geometrical representation with the highlighted top and bottom planes
Figure 29 – Geometrical representation with the highlighted left and right planes
An interesting relation is made between test 5 (-/-/+) and the initial
hypothesis, since both used similar values for the process parameters, and
achieved similar results. From the designed experiments, it was possible to
answer the concerns of using vacuum for the initial hypothesis. In the
experiments, it was possible to realize that there is no relevant effect on void
content for the tests with vacuum assistance, then using a seal with a
purposely made leak.
It must be noted that in test 6 (+/-/+) and 8 (+/+/+), the dry spots can be
explained as a result of fibre wash, which pushed the fibres towards the
outlet port, thus clogging it.
The most positive outcome of this method was the possibility to easily
define the parameters for the second hypothesis. By consulting the Figure
27, the optimal solution was to use a combination of vacuum assistance, low
injection pressure and a high hydrostatic pressure. Nevertheless, it must be
mentioned that, since each experiment was performed only once, it was not
possible to analyse an eventual influence of external parameters in the
results obtained in the present study.
5.4.3. SECOND HYPOTHESIS
The results obtained with the second hypothesis were not exactly the same
as the ones expected. From this experiment, it was assumed that the quality
of the laminate would be free of voids and with a high degree of
penetration, as the panel from test number 7 (-/+/+) of the intermediate
learning process. After evaluating the results, it was necessary to attempt to
understand the causes of the discrepancies.
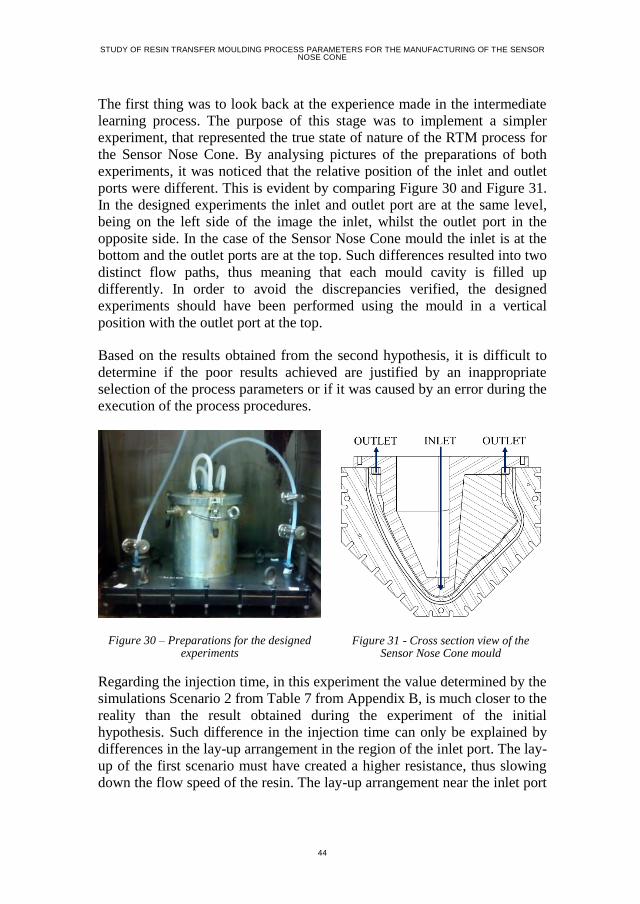
STUDY OF RESIN TRANSFER MOULDING PROCESS PARAMETERS FOR THE MANUFACTURING OF THE SENSOR NOSE CONE
44
The first thing was to look back at the experience made in the intermediate
learning process. The purpose of this stage was to implement a simpler
experiment, that represented the true state of nature of the RTM process for
the Sensor Nose Cone. By analysing pictures of the preparations of both
experiments, it was noticed that the relative position of the inlet and outlet
ports were different. This is evident by comparing Figure 30 and Figure 31.
In the designed experiments the inlet and outlet port are at the same level,
being on the left side of the image the inlet, whilst the outlet port in the
opposite side. In the case of the Sensor Nose Cone mould the inlet is at the
bottom and the outlet ports are at the top. Such differences resulted into two
distinct flow paths, thus meaning that each mould cavity is filled up
differently. In order to avoid the discrepancies verified, the designed
experiments should have been performed using the mould in a vertical
position with the outlet port at the top.
Based on the results obtained from the second hypothesis, it is difficult to
determine if the poor results achieved are justified by an inappropriate
selection of the process parameters or if it was caused by an error during the
execution of the process procedures.
Figure 30 – Preparations for the designed experiments
Figure 31 - Cross section view of the Sensor Nose Cone mould
Regarding the injection time, in this experiment the value determined by the
simulations Scenario 2 from Table 7 from Appendix B, is much closer to the
reality than the result obtained during the experiment of the initial
hypothesis. Such difference in the injection time can only be explained by
differences in the lay-up arrangement in the region of the inlet port. The lay-
up of the first scenario must have created a higher resistance, thus slowing
down the flow speed of the resin. The lay-up arrangement near the inlet port
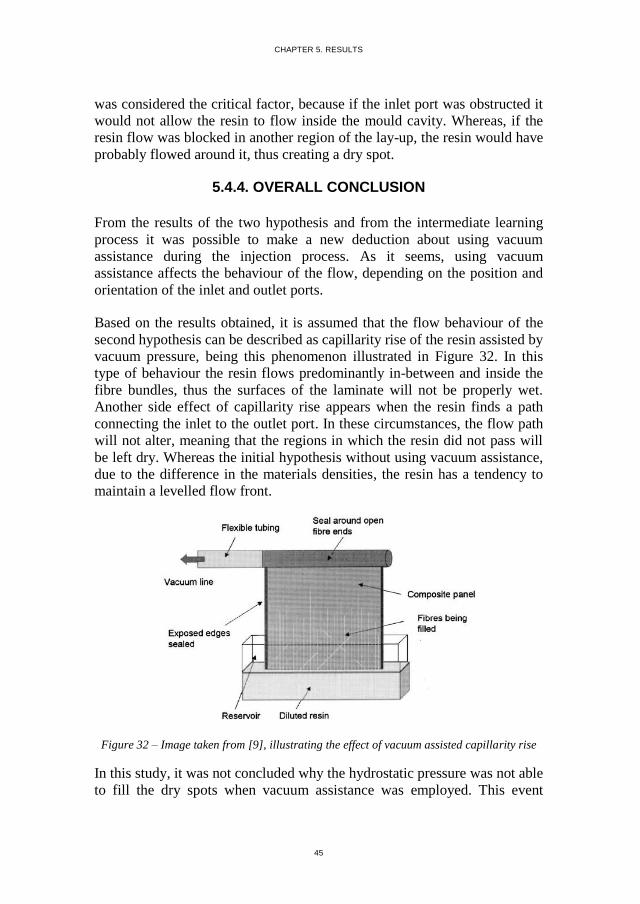
CHAPTER 5. RESULTS
45
was considered the critical factor, because if the inlet port was obstructed it
would not allow the resin to flow inside the mould cavity. Whereas, if the
resin flow was blocked in another region of the lay-up, the resin would have
probably flowed around it, thus creating a dry spot.
5.4.4. OVERALL CONCLUSION
From the results of the two hypothesis and from the intermediate learning
process it was possible to make a new deduction about using vacuum
assistance during the injection process. As it seems, using vacuum
assistance affects the behaviour of the flow, depending on the position and
orientation of the inlet and outlet ports.
Based on the results obtained, it is assumed that the flow behaviour of the
second hypothesis can be described as capillarity rise of the resin assisted by
vacuum pressure, being this phenomenon illustrated in Figure 32. In this
type of behaviour the resin flows predominantly in-between and inside the
fibre bundles, thus the surfaces of the laminate will not be properly wet.
Another side effect of capillarity rise appears when the resin finds a path
connecting the inlet to the outlet port. In these circumstances, the flow path
will not alter, meaning that the regions in which the resin did not pass will
be left dry. Whereas the initial hypothesis without using vacuum assistance,
due to the difference in the materials densities, the resin has a tendency to
maintain a levelled flow front.
Figure 32 – Image taken from [9], illustrating the effect of vacuum assisted capillarity rise
In this study, it was not concluded why the hydrostatic pressure was not able
to fill the dry spots when vacuum assistance was employed. This event
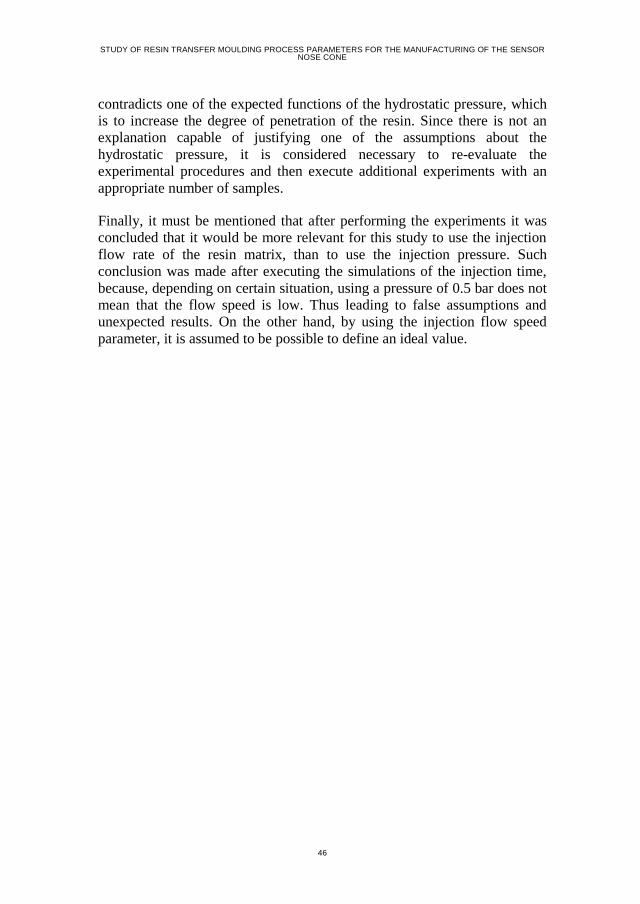
STUDY OF RESIN TRANSFER MOULDING PROCESS PARAMETERS FOR THE MANUFACTURING OF THE SENSOR NOSE CONE
46
contradicts one of the expected functions of the hydrostatic pressure, which
is to increase the degree of penetration of the resin. Since there is not an
explanation capable of justifying one of the assumptions about the
hydrostatic pressure, it is considered necessary to re-evaluate the
experimental procedures and then execute additional experiments with an
appropriate number of samples.
Finally, it must be mentioned that after performing the experiments it was
concluded that it would be more relevant for this study to use the injection
flow rate of the resin matrix, than to use the injection pressure. Such
conclusion was made after executing the simulations of the injection time,
because, depending on certain situation, using a pressure of 0.5 bar does not
mean that the flow speed is low. Thus leading to false assumptions and
unexpected results. On the other hand, by using the injection flow speed
parameter, it is assumed to be possible to define an ideal value.
CHAPTER 6. CONCLUDING REMARKS
47
CHAPTER 6. CONCLUDING REMARKS
In this chapter are depicted the final conclusions of the present study, as
well as the suggestions for future investigation regarding the subject in
question.
6.1. CONCLUSION
The primary research question is focused in understanding the impact of
three RTM process parameters vacuum assistance, injection pressure and
hydrostatic pressure, in the quality of the surface finish. During this study,
the Sensor Nose Cone was used as a sample product, to which the
conclusions derived from the literature and experiments are applied to.
The first effort with this project was to define a strategy to study the process
parameters and apply them to the Sensor Nose Cone. The approach selected
consisted of three main steps. Firstly, it was conceived and implemented, for
the Sensor Nose Cone, an initial hypothesis which reflected the conclusions
drawn from the studied literature. Afterwards, it was executed an
intermediate learning process, which based on a designed experiment
allowed to collect additional information about the behavioural trends
caused by changes in each of the parameters in question. Finally, a second
hypothesis for the Sensor Nose Cone was built from the conclusions of the
intermediate learning process. The strategy defined proved to be very
effective to speed up the learning process. Despite the effectiveness of the
approach and method, the designed experiments proved to be inappropriate.
Meaning that the designed experiments, did not replicate the conditions of
the RTM process of Sensor Nose Cone accurately, which caused
unexpected results for the second hypothesis. Additionally, it must be
mentioned that in order to validate the veracity of the conclusions made it is
necessary to make repetitions of each test run with a more significant
sample.
Based on the results obtained from the first and second hypothesis, it was
possible to understand that the process parameters selected for a RTM
process should also take into consideration the position of the inlet and
outlet ports, as well as the direction of the flow. Therefore, it is considered
that to define an ideal RTM process it is necessary to consider more than
just the three parameters studied here, as well as establishing relationships
between the parameters. Nevertheless, this study allowed to experience a

STUDY OF RESIN TRANSFER MOULDING PROCESS PARAMETERS FOR THE MANUFACTURING OF THE SENSOR NOSE CONE
48
great insight into the manufacturing tasks related with the RTM process, as
well as obtain experience and knowledge about defining RTM process
parameters.
From the results collected it is possible to assume that for the manufacturing
of the Sensor Nose Cone, the best approach is to use, during the injection
stage, a low injection pressure and not use vacuum assistance. Once the
injection process is completed, it should be applied a hydrostatic pressure at
least higher than the saturated vapour pressure correspondent to the curing
temperature.
Based on the expectations to reduce costs associated with the surface
preparations before painting, it is considered that, despite the fact that in
both implementations with the Sensor Nose the surface contained voids, the
present work has contributed to improve the knowledge about the influence
of some parameters in the surface quality of parts produced via RTM
process. Moreover, it must be stated that further investigations have to be
conducted to study this process, in order to continue to create added value to
manufacturers, regarding improving alternative processes to be more
efficient and to consume less resources.
6.2. PERSPECTIVES
Based on the problem statement and primary research question,
correspondingly in Sections 1.3 and 1.6, the purpose of this study was to
analyse the impact of the RTM process parameters; vacuum assistance,
injection pressure and hydrostatic pressure in order to reduce void content at
the surface of the laminate, thus improving the surface quality of the part.
By defining such a narrow scope, it is understandable that this report covers
only a fraction of the challenges in order to reduce void content and
improve the quality of the laminate. After executing the experiments and
analysing the results, it became obvious that, despite being crucial for the
quality of the laminate, the selected parameters were not sufficient to allow
a definition of an ideal approach to inject and cure parts manufactured via
RTM, thus meaning that this study can be extended to other parameters.
Since the factorial designed at two levels proved to be an effective and
efficient strategy to study the impact of RTM process parameter, it is
considered that the same method can be applied in future studies to analyse
the behavioural trends caused by other parameters.

CHAPTER 6. CONCLUDING REMARKS
49
As mentioned in the implementation of both hypothesis for the Sensor Nose
Cone, the tool was preheated to 40 ºC in order to reduce the viscosity of the
resin matrix, thus facilitating the passage of the flow front. When such was
done it was not considered the influence of the viscosity for the escape of
entrapped air, because it was assumed that having a lower viscosity could
facilitate the escape of entrapped air bubbles and increase the degree of
penetration. In order to confirm these assumptions is considered relevant to
quantify the influence of the viscosity for the entrapment of air bubbles,
dependent on the injection flow speed, in future projects.
During the execution of the experiments for the intermediate learning
process with the flat panels, it was noted that for future studies, a possible
solution to facilitate the analysis of the process is to use a transparent mould
that allows to see inside the mould cavity. Despite its simplicity, it is
considered that this approach can reduce the number of experiments in order
to evaluate the effects of the process parameters. This approach could be
implemented to analyse why in cases using vacuum assistance, the dry spots
are not filled with resin even though it is applied a hydrostatic pressure, or
also to observe the effect of having a leakage in the sealant.
The present study was only focused on reducing void content on the surface
of the laminate and, to continue to improve the surface quality of parts
produced via RTM, it is also necessary to study the thermal compatibility
between the fibre reinforcement and the resin matrix. As explained by
Campbell [3], the thermal mismatch between the fibres and the resin is a
major cause of residual stresses, which can lead to distortions and
irregularities on the surface of the part.


LITERATURE LIST
51
LITERATURE LIST
1. Fernandes, Francisco Ribeiro. Sensor Nose Cone – Metal to RTM
Convertion. Aalborg : Aalborg University, 2016.
2. Hamidi, Youssef K.; Aktas, Levent; Altan, M. Cengiz. Formation of
Microscopic Voids in Resin Transfer Molded Composites. Norman,
Oklahoma : ASME, 2004.
3. Campbell, Flake C. Manufacturing Processes for Advanced Composites.
Oxford : Elsevier Advanced Technology, 2004. ISBN 1856174158.
4. Hayward, J. S.; Harris, B. The effect of Vacuum Assitance in Resin
Transfer Moulding. s.l. : Butterworth-Heinemann Ldt, 1990, Vol. 1 No 3.
0956-7143/90/030161.
5. Lundstrom, T. Staffan; Gebart, Rikard. Influence from Different Process
Parameters on Void Formation in Resin Transfer Molding. Pitea, Sweden :
Swedish Institute of Composites, 1994, Vol. 15 No 3. DOI:
10.1002/pc.750150105.
6. Gurit. Guide to Composites. [Online] 2013. [Cited: 08/03/2016.]
http://www.gurit.com/guide-to-composites.aspx.
7. Online Services: Saturated Vapor Pressure. [Online] Dortmund Data Bank
Software & Separation Technology GmbH. [Cited: 16 03 2016.]
http://ddbonline.ddbst.de/AntoineCalculation/AntoineCalculationCGI.exe.
8. Box, Gerorge E. P.; Hunter, William G.; Hunter, J. Stuart. Statistics for
Experiments: An Introduction To Design, Data Analysis, and Model
Building. s.l. : John Wiley & Sons, 1978. ISBN 0-471-09315-7.
9. Bleay, S.M.; Loader, C.B.; Hawyes, V.J.; Humberstone, L.; Curtis, P.T. A
Smart Repair System for Polymer Matrix Composites. Farnborough :
Elsevier, 2001. PII: S1359-835X(01)00020-3.
10. da Silva, Lucas F. M.; Ochsner, Andreas; Adams, Robert D. Handbook
of Adhesion Technology. Berlin : Springer, 2011. ISBN 978-3-642-01168-9.

STUDY OF RESIN TRANSFER MOULDING PROCESS PARAMETERS FOR THE MANUFACTURING OF THE SENSOR NOSE CONE
52
11. Hoeksema, Richard Nolen . Resources. Schlumberger Limited. [Online]
26/10/2014. [Cited:15/03/2016.]
http://www.slb.com/resources/oilfield_review/~/media/Files/resources/oilfiel
d_review/defining_series/Defining-Permeability.ashx.
12. Amico, S.; Lekakou, C. An Experimental Study of the Permeability and
Capillary Pressure in Resin-Transfer Moulding. Guildford : Elsevier Science
Ltd., 2001. PII: S0266-3538(01)00104-X.

53
APPENDICES


APPENDIX A. PERMEABILITY TEST
55
Appendix A. Permeability Test
Introduction The purpose of the experimental test here presented was to determine an
approximate value of the permeability, of the Sensor Nose Cone, in order to
retrieve the necessary data to compute the simulations for the prediction of
the injection time, described in detail in Appendix B. For simplicity reasons,
this test just replicated the lay-up of the first and third regions of the part in
study. As explained in Section 1.2, the Sensor Nose Cone may be divided in
four different sections and in Figure 4 is possible to observe its scheme.
In what concerns permeability, as explained by Ochsner et al. [10] and
Hoeksema et al. [11], it measures the resistance of a fluid to pass through a
porous material. The measuring unit of permeability is square meters, and it
represents the area of the open pore space perpendicular to the flow front.
There are several methods to study the macroscopic permeability of a
porous material, but, the most applied one is based on Darcy’s Law. Despite
that, the task if determining the permeability is still considered to be quite
challenging, since it has not been yet been established a standard method for
testing it and also due to the complex pore structure of a fibre material.
Method Like in the work conducted by Amico et al. [12], the method selected to
study the permeability was based in Darcy’s law.
First, it was made, a simplification was made in order to reduce the problem
to a single dimension, also known as the one dimensional Darcy’s Law and
expressed by Eq. 1. In this equation, vx, k, µ and (dP/dx), are respectively
the flow front velocity [m/s], the material permeability [m2], dynamic
viscosity [Pa.s] of the fluid and the pressure gradient [Pa] over the
specimen.
𝑣𝑥 = −𝑘
𝜇∗
𝑑𝑃
𝑑𝑥⇔ 𝑘 = −
𝑣𝑥 ∗ 𝜇
(𝑑𝑃𝑑𝑥
)
Eq.1
As illustrated in Figure 33, the designed experiment used a pressure gradient
made by a vacuum pump, in order to push the resin matrix through a
rectangular laminate. The necessary data to calculate the permeability was
collected by visual means, while the resin flowed through the laminate, in
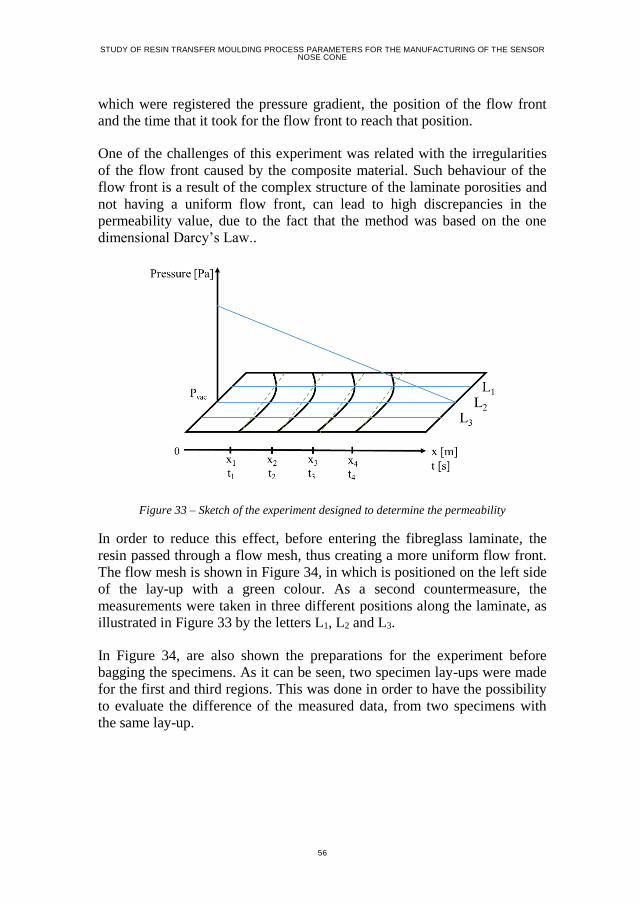
STUDY OF RESIN TRANSFER MOULDING PROCESS PARAMETERS FOR THE MANUFACTURING OF THE SENSOR NOSE CONE
56
which were registered the pressure gradient, the position of the flow front
and the time that it took for the flow front to reach that position.
One of the challenges of this experiment was related with the irregularities
of the flow front caused by the composite material. Such behaviour of the
flow front is a result of the complex structure of the laminate porosities and
not having a uniform flow front, can lead to high discrepancies in the
permeability value, due to the fact that the method was based on the one
dimensional Darcy’s Law..
Figure 33 – Sketch of the experiment designed to determine the permeability
In order to reduce this effect, before entering the fibreglass laminate, the
resin passed through a flow mesh, thus creating a more uniform flow front.
The flow mesh is shown in Figure 34, in which is positioned on the left side
of the lay-up with a green colour. As a second countermeasure, the
measurements were taken in three different positions along the laminate, as
illustrated in Figure 33 by the letters L1, L2 and L3.
In Figure 34, are also shown the preparations for the experiment before
bagging the specimens. As it can be seen, two specimen lay-ups were made
for the first and third regions. This was done in order to have the possibility
to evaluate the difference of the measured data, from two specimens with
the same lay-up.
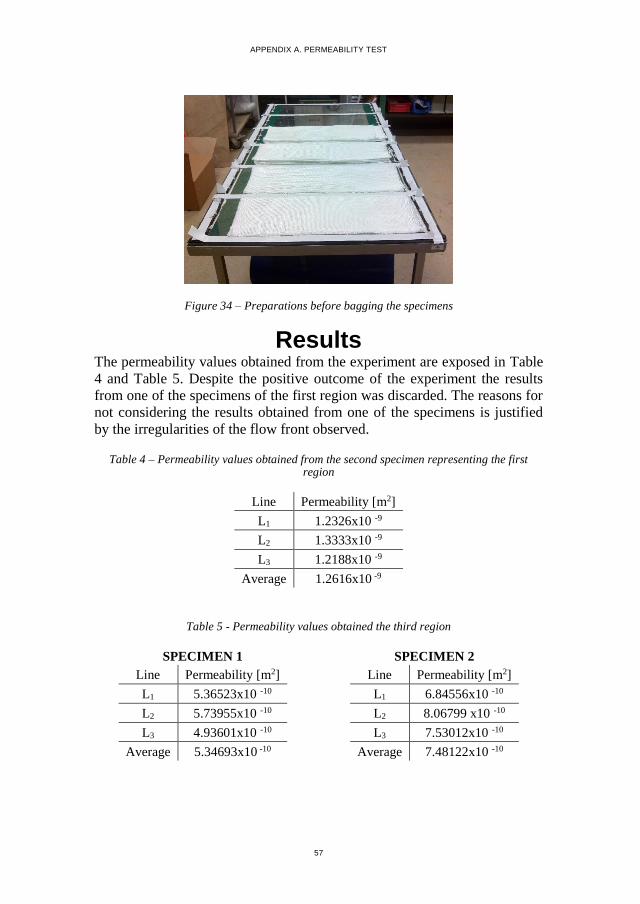
APPENDIX A. PERMEABILITY TEST
57
Figure 34 – Preparations before bagging the specimens
Results The permeability values obtained from the experiment are exposed in Table
4 and Table 5. Despite the positive outcome of the experiment the results
from one of the specimens of the first region was discarded. The reasons for
not considering the results obtained from one of the specimens is justified
by the irregularities of the flow front observed.
Table 4 – Permeability values obtained from the second specimen representing the first region
Line Permeability [m2]
L1 1.2326x10 -9
L2 1.3333x10 -9
L3 1.2188x10 -9
Average 1.2616x10 -9
Table 5 - Permeability values obtained the third region
SPECIMEN 1
Line Permeability [m2]
L1 5.36523x10 -10
L2 5.73955x10 -10
L3 4.93601x10 -10
Average 5.34693x10 -10
SPECIMEN 2
Line Permeability [m2]
L1 6.84556x10 -10
L2 8.06799 x10 -10
L3 7.53012x10 -10
Average 7.48122x10 -10

STUDY OF RESIN TRANSFER MOULDING PROCESS PARAMETERS FOR THE MANUFACTURING OF THE SENSOR NOSE CONE
58
The irregularity becomes obvious when comparing the flow front of both
specimens shown in Figure 35 and Figure 36. In the first picture, it is
possible to see that an obstruction in the middle of the flow front only
allowed the fluid to pass through the sides, while in Figure 36 the
irregularities observed were as expected for a flow front, since they can be
approximated to straight lines.
Figure 35 – Failed flow front
Figure 36 – Expected irregularities in a flow front
The cause of this problem is illustrated in Figure 37, and it was a result of
the misplacement of the flow mesh, which was not contacting with the
laminate fibres, thus allowing the bagging film to block the flow path.
Figure 37 - Cause of the flow front obstruction
APPENDIX A. PERMEABILITY TEST
59
Discussion Regarding the irregularities of the flow front, the method implemented
using the flow mesh demonstrated to be effective. Yet, after completing the
experiments, it was concluded that the specimens for a test based on the
one-dimensional Darcy’s law should not have been as wide as these were.
This is due to the fact that narrower specimens would have provided results
with less noise caused by non-longitudinal flow.
It should be also noted that Darcy’s Law is only valid for homogenous
materials with random porosities. Hence, despite not representing the
reality, the values collected for the laminate permeability had to be
considered as an isotropic property of the material.
In what concerns the permeability values that represented the first and third
regions of the Sensor Nose Cone, they were defined as the average from the
three lines of each experiment. However, the results from Specimen 2 of the
third region were discarded due to conservative reasons, since if they were
considered to the average between the two specimens, it would had led to a
faster injection time that could have brought some problems during its
execution.
Finally, based on the values from Table 4, the permeability considered for
the first region was 1.2616x10 -9 m2, for the third region the permeability
considered was 5.34693x10 -10 m2, which equals the average from the results
of Specimen 1 in Table 5.

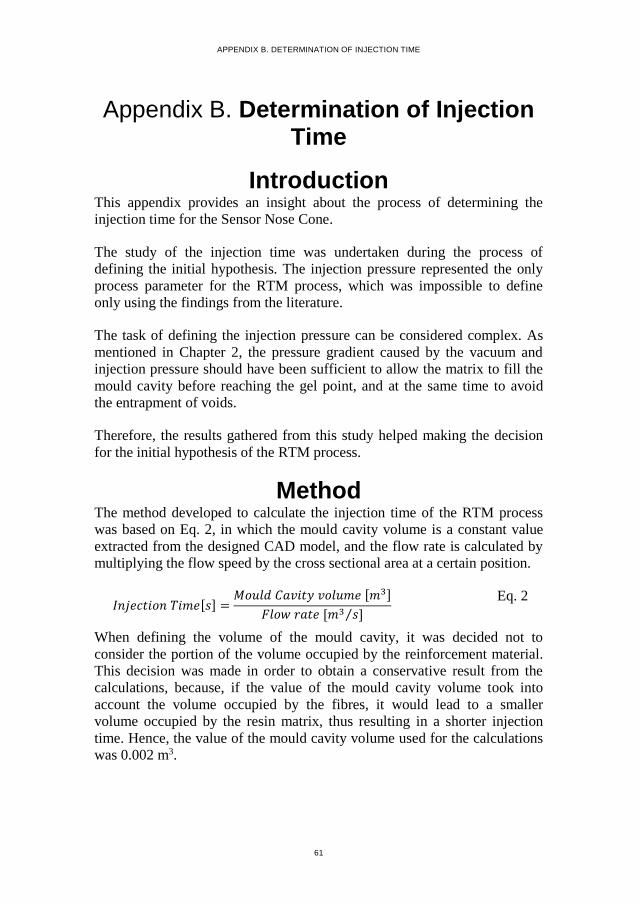
APPENDIX B. DETERMINATION OF INJECTION TIME
61
Appendix B. Determination of Injection Time
Introduction This appendix provides an insight about the process of determining the
injection time for the Sensor Nose Cone.
The study of the injection time was undertaken during the process of
defining the initial hypothesis. The injection pressure represented the only
process parameter for the RTM process, which was impossible to define
only using the findings from the literature.
The task of defining the injection pressure can be considered complex. As
mentioned in Chapter 2, the pressure gradient caused by the vacuum and
injection pressure should have been sufficient to allow the matrix to fill the
mould cavity before reaching the gel point, and at the same time to avoid
the entrapment of voids.
Therefore, the results gathered from this study helped making the decision
for the initial hypothesis of the RTM process.
Method The method developed to calculate the injection time of the RTM process
was based on Eq. 2, in which the mould cavity volume is a constant value
extracted from the designed CAD model, and the flow rate is calculated by
multiplying the flow speed by the cross sectional area at a certain position.
𝐼𝑛𝑗𝑒𝑐𝑡𝑖𝑜𝑛 𝑇𝑖𝑚𝑒[𝑠] =𝑀𝑜𝑢𝑙𝑑 𝐶𝑎𝑣𝑖𝑡𝑦 𝑣𝑜𝑙𝑢𝑚𝑒 [𝑚3]
𝐹𝑙𝑜𝑤 𝑟𝑎𝑡𝑒 [𝑚3 𝑠]⁄
Eq. 2
When defining the volume of the mould cavity, it was decided not to
consider the portion of the volume occupied by the reinforcement material.
This decision was made in order to obtain a conservative result from the
calculations, because, if the value of the mould cavity volume took into
account the volume occupied by the fibres, it would lead to a smaller
volume occupied by the resin matrix, thus resulting in a shorter injection
time. Hence, the value of the mould cavity volume used for the calculations
was 0.002 m3.

STUDY OF RESIN TRANSFER MOULDING PROCESS PARAMETERS FOR THE MANUFACTURING OF THE SENSOR NOSE CONE
62
Before solving Eq. 2, it was necessary to determine the flow speed so that
the flow rate could have been calculated. To accomplish this, it was used a
Finite Element Simulation (FEA) based on Darcy’s Law from Eq. 1, in
Appendix A. For the simulation, the necessary inputs were the geometry of
the laminate, the pressure both at the inlet and at the outlet port, the
permeability values in the different sections of the Sensor Nose Cone, and
the dynamic viscosity of the resin matrix.
As mentioned in Section 1.2, the laminate of the Sensor Nose Cone was
considered to be divided in four regions, each having differences in the
laminate staking, which resulted in different permeability values. For that
reason, the imported geometry was divided in four regions as shown in
Figure 38, and for each region was attributed a specific permeability value.
In order to determine the permeability of the Sensor Nose Cone laminate, it
was necessary to execute an additional experiment, which is detailed in
Appendix A.
a) 1st region
b) 2nd Region
c) 3rd Region
d) 4th Region
Figure 38 – Sensor Nose Cone model and its regions

APPENDIX B. DETERMINATION OF INJECTION TIME
63
The permeability values for each of the sections are displayed in Table 6.
The values for the first and third region were established from the study
described in Appendix A, but the values for the second and forth region had
to be approximated based on assumptions made from the previous values.
Table 6 – Permeability value for each region
Region Permeability [m2]
1st Region 1.2616x10 -9
2nd Region 8.98148x10 -10
3rd Region 5.34693x10⁻¹⁰
4th Region 5.34693x10⁻¹⁰
The second region of the Sensor Nose Cone is characterized by a change in
the number of layers, from three to eleven. This caused the appearance of a
resin rich area illustrated in Figure 39, which increased the permeability of
the laminate. For that reason, it was considered that the second region would
have a permeability equal to the mean value between the first and third
regions.
For the forth region, despite having a resin rich area close to the outlet ports,
the permeability was considered the same as in the third region, because the
number of layer was the same in both of them.
Figure 39 – Representation of the resin reach area in the 2nd region
As described in Section 1.2, the resin system used in this project was
constituted by Araldite® LY 1564 and Aradur® 3486 as the hardener,
which at room temperature has a dynamic viscosity of 0.3 Pa/s.
In regards to the pressure at the inlet and outlet ports, in order to estimate
how the pressure gradient influenced the injection time, it was decided to

STUDY OF RESIN TRANSFER MOULDING PROCESS PARAMETERS FOR THE MANUFACTURING OF THE SENSOR NOSE CONE
64
establish different combinations, which are shown in Table 7. Despite the
combinations considered, the difference in the results between the scenarios
1 and 6, and 2 and 7, should be minimal since the scenarios yield similar
pressure gradients. As expressed in Eq. 1, the Darcy’s Law only uses the
pressure gradient, between the inlet and outlet, to determine the flow speed.
Table 7 – Combinations for the inlet and outlet ports
Scenario Inlet Pressure [Pa] Outlet Pressure [Pa]
Scenario 1 0 -99 500
Scenario 2 50 000 -99 500
Scenario 3 500 000 -99 500
Scenario 4 500 000 0
Scenario 5 50 000 0
Scenario 6 100 000 0
Scenario 7 150 000 0
In addition to the Sensor Nose Cone simulation, with the intention of
ensuring that the results from the simulations would be trustworthy, another
two simulations were necessary. These extraordinary simulations were
developed to represent the same conditions as the ones for the experiments
described in Appendix A, for the first and third regions of the Sensor Nose
Cone. The Figure 40 illustrates the model used to simulate the injection time
of the third region, which represents an 8.8 millimetre thick laminate with
eleven layers. A similar model was used for the first region with the only
difference being the thickness, which was 2.4 millimetre corresponding to
the three layers. In order to reproduce the same conditions as in the actual
experiment, both models had a rectangular shape at the inlet and outlet ports
that represented the flow mesh used in the experiment.
Finally, it should be noted that the simulations here presented did not
attempt to simulate the flow behaviour of the resin matrix inside the mould
cavity, but only to determine the time necessary to fill the mould cavity.

APPENDIX B. DETERMINATION OF INJECTION TIME
65
Figure 40 - Model of the specimen for the third region
Results The results of the simulations representing the experiments in Appendix A
and the Sensor Nose Cone scenarios, are shown in Table 8 and Table 9
correspondingly.
Table 8 – Result achieved for the additional simulations, of the 1st and 3rd regions
Scenario
Flow speed at the inlet
port [m/s]
Flow rate at the inlet
port [m3/s]
Time for
injection [min]
Region 1 0.00275 6.38x10 -7 5
Region 3 0.0057713 1.33894x10 -6 8

STUDY OF RESIN TRANSFER MOULDING PROCESS PARAMETERS FOR THE MANUFACTURING OF THE SENSOR NOSE CONE
66
Table 9 – Simulation results of the Sensor Nose Cone for each scenario.
Scenario
Flow speed at the
inlet port [m/s]
Flow rate at the inlet
port [m3/s]
Time for
injection [min]
1 0.053292 1.04452x10 -6 32
2 0.080072 1.56941x10 -6 21
3 0.32109 6.29336x10⁻⁶ 5
4 0.2678 5.24888x10 -6 6
5 0.02678 5.24888x10 -7 64
6 0.05356 1.04978x10 -6 32
7 0.080341 1.57468x10 -6 21
Discussion From the two additional simulations for the first and third region panels, the
injection times obtained are considered valid, because the results are very
close to the ones of the real experimental tests. The difference are in the
range of one to two minutes. Thus, having a simulation matching the
experimental results, increased the confidence in the results obtained with
the Sensor Nose Cone simulation.
The inlet and outlet pressure values were selected in order to have different
combinations with similar pressure gradient, allowing to conclude that
results of the simulations would only depend on the gradient and not on the
specific values of the pressure in the ports. Meaning that for a simulation
with 1.5 bar of pressure at the inlet and 0.5 bar at the outlet would yield the
same results as another scenario with 0.5 bar at the inlet and -0.5 bar at the
outlet.
The results of the simulation in flow speed are represented in Figure 41 by
the changes in colours from red to dark blue, corresponding from faster to
slower speeds. The variations in the flow speed were in accordance with a
constant flow rate in the Sensor Nose Cone, since the value of the speed was
higher in areas with smaller cross sectional area, as is the case of the inlet
port.
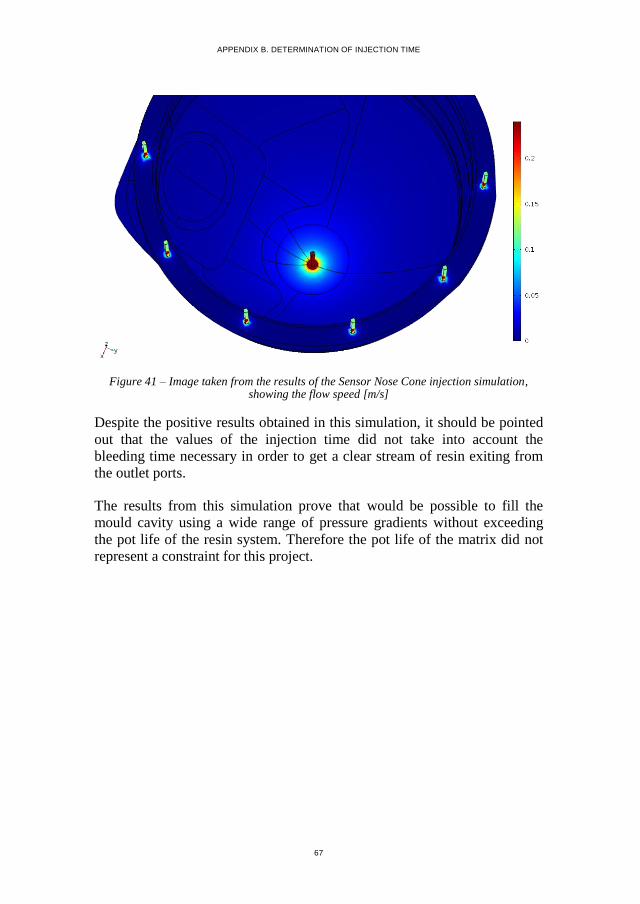
APPENDIX B. DETERMINATION OF INJECTION TIME
67
Figure 41 – Image taken from the results of the Sensor Nose Cone injection simulation, showing the flow speed [m/s]
Despite the positive results obtained in this simulation, it should be pointed
out that the values of the injection time did not take into account the
bleeding time necessary in order to get a clear stream of resin exiting from
the outlet ports.
The results from this simulation prove that would be possible to fill the
mould cavity using a wide range of pressure gradients without exceeding
the pot life of the resin system. Therefore the pot life of the matrix did not
represent a constraint for this project.


APPENDIX C. DESIGNED EXPERIMENTS BASED ON FACTORIAL DESIGN AT TWO LEVELS
69
Appendix C. Designed Experiments Based on Factorial Design at Two
Levels
Introduction Learning is a process that can be approached in several ways. As for the
purpose of this study, it was decided to change the standard iterative
learning process by interrupting the cycle with an intermediate learning
process. The advantage of this approach was the possibility to design a
simpler experiment, that replicated the true state of nature of the RTM
process for the Sensor Nose Cone, and arrange it in such a way so that the
results indicated the consequences caused by a change in one of the process
parameters.
For that purpose, in this appendix are described the process and results of
applying factorial design at two levels for the intermediate learning process
in order to study the impact of RTM process parameters, injection pressure,
vacuum assistance and hydrostatic pressure.
Method The first step of this process was to create a simpler experiment that
replicated the true state of nature of the RTM process for the Sensor Nose
Cone. To meet that requirement, as shown in Figure 42, instead of using the
Sensor Nose Cone, the experiments were made using a flat panel. The
materials used for the lay-up of the flat panel were composed by 3 layers of
eleven inch +/- 45 degrees fibre glass biaxial sleeve as the reinforcement
material, with an epoxy matrix constituted by Araldite® LY 1564 and
Aradur® 3486 as the hardener. With the purpose of creating the same
conditions as the Sensor Nose Cone mould, as described in Sub-section
4.1.1, the sealant used for these experiments was produced in the same way.
By doing so the flat panel mould would have the same leakage flaws due to
the glued faces of the O-ring, as shown in Figure 43.
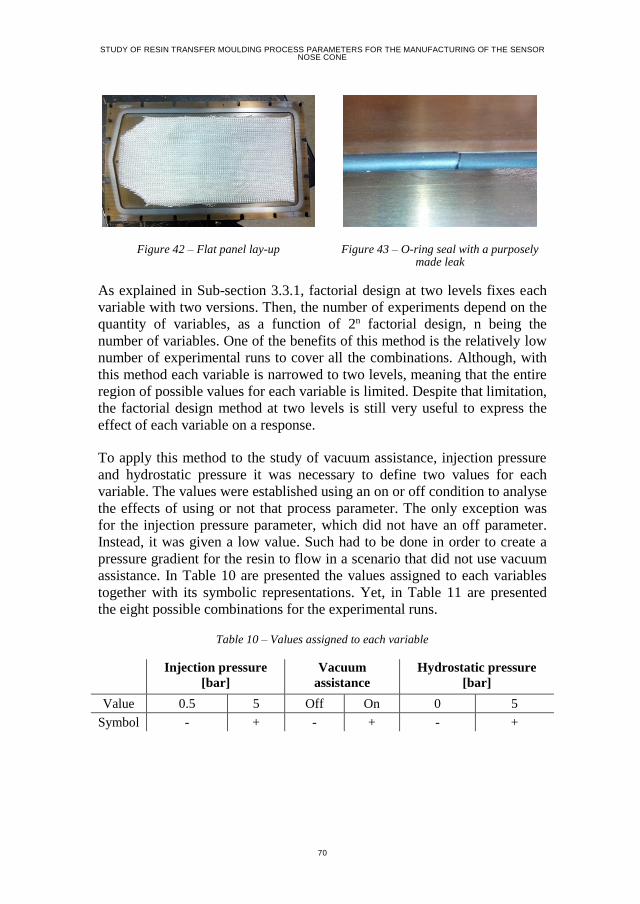
STUDY OF RESIN TRANSFER MOULDING PROCESS PARAMETERS FOR THE MANUFACTURING OF THE SENSOR NOSE CONE
70
Figure 42 – Flat panel lay-up
Figure 43 – O-ring seal with a purposely made leak
As explained in Sub-section 3.3.1, factorial design at two levels fixes each
variable with two versions. Then, the number of experiments depend on the
quantity of variables, as a function of 2n factorial design, n being the
number of variables. One of the benefits of this method is the relatively low
number of experimental runs to cover all the combinations. Although, with
this method each variable is narrowed to two levels, meaning that the entire
region of possible values for each variable is limited. Despite that limitation,
the factorial design method at two levels is still very useful to express the
effect of each variable on a response.
To apply this method to the study of vacuum assistance, injection pressure
and hydrostatic pressure it was necessary to define two values for each
variable. The values were established using an on or off condition to analyse
the effects of using or not that process parameter. The only exception was
for the injection pressure parameter, which did not have an off parameter.
Instead, it was given a low value. Such had to be done in order to create a
pressure gradient for the resin to flow in a scenario that did not use vacuum
assistance. In Table 10 are presented the values assigned to each variables
together with its symbolic representations. Yet, in Table 11 are presented
the eight possible combinations for the experimental runs.
Table 10 – Values assigned to each variable
Injection pressure
[bar]
Vacuum
assistance
Hydrostatic pressure
[bar]
Value 0.5 5 Off On 0 5
Symbol - + - + - +
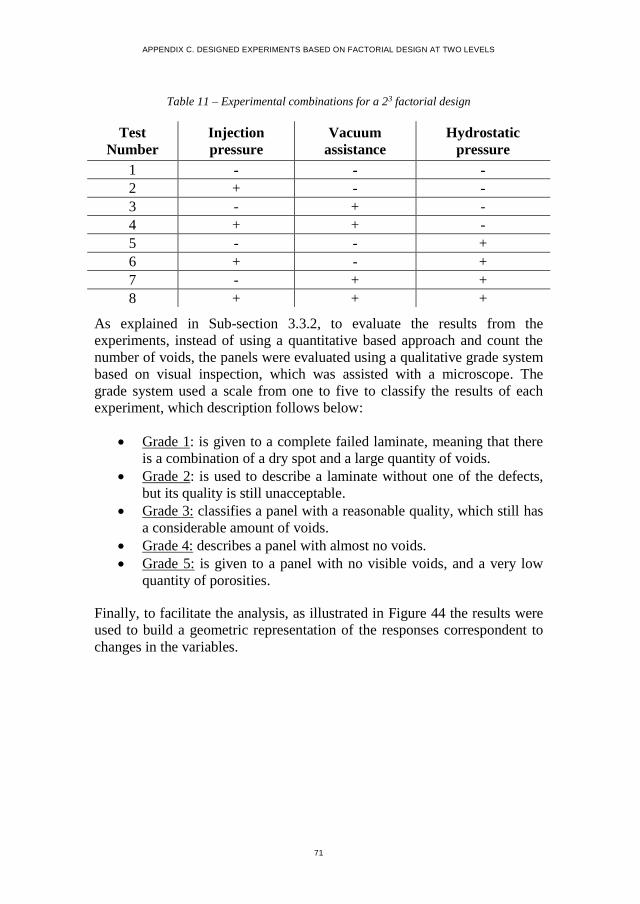
APPENDIX C. DESIGNED EXPERIMENTS BASED ON FACTORIAL DESIGN AT TWO LEVELS
71
Table 11 – Experimental combinations for a 23 factorial design
Test
Number
Injection
pressure
Vacuum
assistance
Hydrostatic
pressure
1 - - -
2 + - -
3 - + -
4 + + -
5 - - +
6 + - +
7 - + +
8 + + +
As explained in Sub-section 3.3.2, to evaluate the results from the
experiments, instead of using a quantitative based approach and count the
number of voids, the panels were evaluated using a qualitative grade system
based on visual inspection, which was assisted with a microscope. The
grade system used a scale from one to five to classify the results of each
experiment, which description follows below:
Grade 1: is given to a complete failed laminate, meaning that there
is a combination of a dry spot and a large quantity of voids.
Grade 2: is used to describe a laminate without one of the defects,
but its quality is still unacceptable.
Grade 3: classifies a panel with a reasonable quality, which still has
a considerable amount of voids.
Grade 4: describes a panel with almost no voids.
Grade 5: is given to a panel with no visible voids, and a very low
quantity of porosities.
Finally, to facilitate the analysis, as illustrated in Figure 44 the results were
used to build a geometric representation of the responses correspondent to
changes in the variables.

STUDY OF RESIN TRANSFER MOULDING PROCESS PARAMETERS FOR THE MANUFACTURING OF THE SENSOR NOSE CONE
72
Figure 44 – Example of a geometric representation of the variables behaviour
Results The grades given for each run are presented in Table 12, as well as the
geometrical representation of the response correspondent to changes in
variables, displayed in Figure 45.
In the following paragraphs are given justifications to the attributed grades
to each test:
Test 1: was graded with a 2 due to the quantity of voids, and,
despite not having a dry spot, from Figure 46 it is visible that there
was a large region with a low degree of penetration of the resin.
Test 2: was graded with a 1, because it had a combination of a large
dry spot and a high void content, which is noticeable in Figure 47.
Test 3: was graded with a 4, because by observing with a
microscope with a magnification of 2x, or even at the naked eye,
there were no visible voids, Figure 48. It was necessary to use a
magnification of 20x, in order to find porosities, Figure 49. The
reason for not attributing a 5 to this panel, is justified by the degree
of penetration of the resin, because, as illustrated in Figure 50, there
were some fibre bundles with a lower wet-out.
Test 4: was graded with a 1, due to the quantity of voids and to the
large dry spot shown in Figure 51.

APPENDIX C. DESIGNED EXPERIMENTS BASED ON FACTORIAL DESIGN AT TWO LEVELS
73
Test 5: was graded with a 4, because it contained almost no voids.
The only visible ones are illustrated in Figure 52, and these are
located outside of the laminate. Another positive outcome from this
test was the improved degree of penetration. The argument for not
attributing a 5 is explained by the high quantity of porosities, which
are shown in Figure 53.
Test 6: was graded with a 2 because, as displayed in Figure 54 there
is a large dry spot in the middle of the laminate, and the fibre lay-up
was distorted. Other than that, it must be mentioned that the degree
of penetration of the resin is considered very good and had almost
no voids, mostly just porosities, as shown in Figure 55.
Test 7: the maximum grade 5 was given to this test, because the
panel had no visible voids and even using the microscope it was
possible to see that the quantity of porosities was very low. It is
considered that this test provided with the best results.
Test 8: despite being considered contradictory, due to the dry spot
shown in Figure 58, the panel was graded with a 4. Such grade was
given because, other than the dry spot, the panel had no visible
imperfections. It was considered that it had a good degree of
penetration as well as almost no presence of voids, mostly just
porosities that were only visible at the microscope level.
Table 12 – Experiment combinations and the corresponding grade
Test
Number
Injection
pressure
Vacuum
assistance
Hydrostatic
pressure Grade
1 - - - 2
2 + - - 1
3 - + - 4
4 + + - 1
5 - - + 4
6 + - + 2
7 - + + 5
8 + + + 4

STUDY OF RESIN TRANSFER MOULDING PROCESS PARAMETERS FOR THE MANUFACTURING OF THE SENSOR NOSE CONE
74
Figure 45 – Geometric representation of the results
Figure 46 – Panel top view of test 1
Figure 47 – Panel top view of test 2
Figure 48 – Microscope view of test 3 with a magnification of 2x
Figure 49 - Microscope view of test 3 with a magnification of 20x

APPENDIX C. DESIGNED EXPERIMENTS BASED ON FACTORIAL DESIGN AT TWO LEVELS
75
Figure 50 - Panel top view of test 3
Figure 51 - Panel top view of test 4
Figure 52 - Panel top view of test 5
Figure 53 - Microscope view of test 5 with a magnification of 2x
Figure 54 - Panel top view of test 6
Figure 55 - Microscope view of test 6 with a magnification of 2x
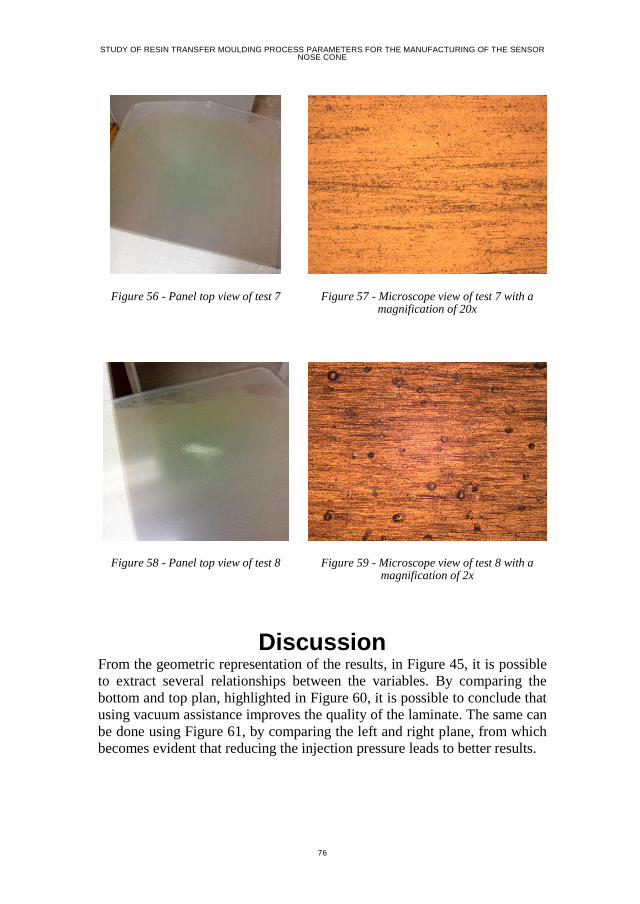
STUDY OF RESIN TRANSFER MOULDING PROCESS PARAMETERS FOR THE MANUFACTURING OF THE SENSOR NOSE CONE
76
Figure 56 - Panel top view of test 7
Figure 57 - Microscope view of test 7 with a magnification of 20x
Figure 58 - Panel top view of test 8
Figure 59 - Microscope view of test 8 with a magnification of 2x
Discussion From the geometric representation of the results, in Figure 45, it is possible
to extract several relationships between the variables. By comparing the
bottom and top plan, highlighted in Figure 60, it is possible to conclude that
using vacuum assistance improves the quality of the laminate. The same can
be done using Figure 61, by comparing the left and right plane, from which
becomes evident that reducing the injection pressure leads to better results.

APPENDIX C. DESIGNED EXPERIMENTS BASED ON FACTORIAL DESIGN AT TWO LEVELS
77
Regarding the hydrostatic pressure, it is most effective when using a low
pressure gradient, because the risk of dry spots increases in the cases using a
high pressure gradient. The results obtained made it evident that the
hydrostatic by itself is not enough to compensate the dry areas. A
particularly interesting result came from test 5 (-/-/+), which showed that it
is possible to obtain good results without using vacuum assistance, when
combining a low injection pressure with a high hydrostatic pressure.
Figure 60 – Top and bottom of the geometrical representation
Figure 61 - Left and right of the geometrical representation
With the experiments made it was also possible to realize that even though
the sealant had a purposely made leak, it showed no effect on the laminate
quality in tests using vacuum assistance. Regarding tests 6 and 8, the cause
for the dry spots can be explained as a result of the fibre movement caused
by the resin flow, which pushed the fibres towards the outlet port, thus
clogging it.
Regarding the method selected to study the three process parameters, the
factorial design at two levels performed as expected. As can be seen from
Table 12, the fact that no panel was graded with a 3 means that the results
only show extreme responses towards the extreme change of variables.
Thus, as expected, this method is appropriate to indicate behaviour trends
caused by changes in the variables. It must be added that with a wider
experimental campaign, would have been possible to obtain a better
representation of the reality, since in this study was only possible to perform
each test once.
Despite that, it is concluded that the best approach is to use a low injection
pressure, combined with vacuum assistance during the injection stage, and a
high hydrostatic pressure during curing.


