Study of Solar Cooling Alternatives for Residential Houses in Bahir Dar City MERON MULATU MENGISTU Master of Science Thesis KTH School of Industrial Engineering and Management Energy Technology EGI-2010 Division of Thermal Studies SE-100 44 STOCKHOLM
Transcript
Study of Solar Cooling Alternatives for Residential Houses in Bahir Dar City
MERON MULATU MENGISTU
Master of Science Thesis KTH School of Industrial Engineering and Management
Energy Technology EGI-2010 Division of Thermal Studies
SE-100 44 STOCKHOLM
1
2
ACKNOWLEDGEMENTS
First of all I would like to thank the almighty God who was always there for me
throughout this thesis and other endeavors of life.
I offer my sincere gratitude to my examiner Professor Torsten Fransson who supported
me throughout my thesis work through his valuable comments. I am heartily thankful to
my supervisor, Anneli Carlqvist (PhD) who supported me with her patience and valuable
comments starting from the proposal stage. Her valuable comments and suggestions
enabled me to see the problem I tackled from different directions. Without her
encouragement and effort this thesis would not have been possible. I am grateful to
thank my local supervisor Dr. Solomon T/Mariam whose encouragement and guidance
enabled me to develop a wider understanding of the subject.
It is an honor to thank Mr Mesfin (Manager of Impact Real-estate Company), Royal
Institute of Technology (KTH) and Bahir Dar University for their support during the
completion of the thesis.
Finally I would like to thank my family, Mr. Ashenafi Tilahun and all my friends who
encouraged me thorough out the project.
Meron Mulatu Mengistu
3
Master of Science Thesis EGI 2010
Study Of Solar Cooling Alternatives For Residential Houses In Bahir Dar City
Meron Mulatu Mengistu
840514-A147
Approved
Date
Examiner
Torsten Fransson
Supervisor
Anneli Carlqvist
Solomon T/mariam
Commissioner
Contact person
ABSTRACT
The energy consumption rate of non-OECD countries rises about 2.3 percent per year
as compared to the energy consumption rate of OECD countries which is 0.6 percent. If
developing countries use energy efficient technology and integrate renewable energy
systems in the new building their carbon dioxide emission rate reduces by 25 to 44
percent. However, even now, renewable energy integrated buildings are hardly
considered while constructing them.
This thesis work focuses on the study of solar cooling system options for residential
house in Bahir Dar city. To meet the demand of housing in the city, different type of
apartments and villa houses are under construction. Case study was made focusing on
two types of residential houses (condominium apartment and Impact Real-estate Villa
house) to determine the cooling load and to select cooling system.
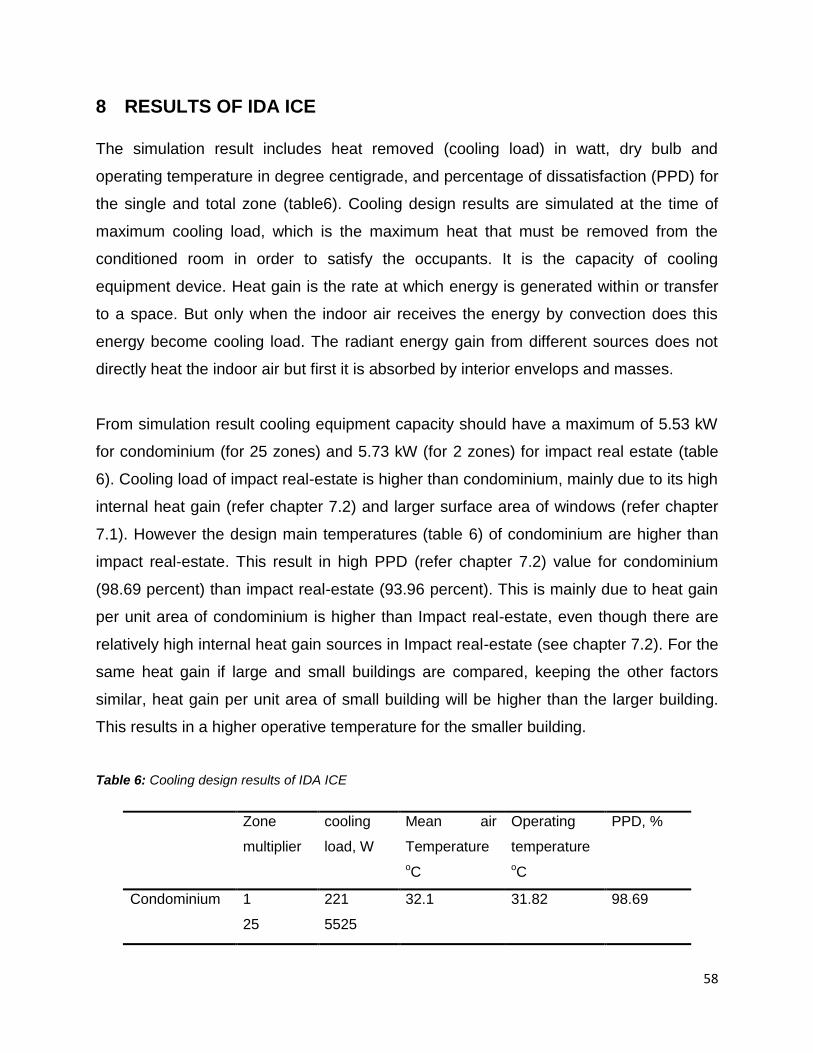
Simulation results of IDA ICE software show that the average operative temperatures
and cooling loads for condominium apartment and Real-estate Vila are 31.8oC and
30.7oC, 5.53 kW and 5.73 kW respectively. Most of the residences are not satisfied at
this operating temperature.
4
There are different types of solar cooling systems. Solar Sorption cooling systems are
commonly used which can also be classified in to absorption, adsorption and desiccant
cooling systems. Solar adsorption cooling systems are easy to manufacture locally as
compared to solar absorption cooling systems. They do not have moving parts. Some of
the working medium pairs used in adsorption cooling system are: Activated
Carbon/Ammonia, Silica gel/ water, Zeolite/water. Adsorption chillier with Silica gel/
water as a working pair was selected since it can operate at regeneration/desorption
temperature as low as 45oC coming from flat plate collectors. At 75oC regeneration
temperature, the system delivers 9oC chilled water temperature.
The selected solar adsorption chiller has been compared with kerosene based
adsorption cooling system using HOMER software. In this project, the optimization was
limited on cost comparison between the two energy sources. The solar based cooling
system has lower working cost.
From cooling load simulation result direct solar irradiation is the highest source of cooling load for both houses. This gives an opportunity for passive solar cooling technology. Keywords: adsorption, cooling load, Condominium, IDA ICE, Impact real-estate
INDEX OF FIGURES ........................................................................................................................................ 6
INDEX OF TABLES .......................................................................................................................................... 7
Figure 1: World marketed energy consumption 1980 to 2030 [IEO, 2009] .................... 10
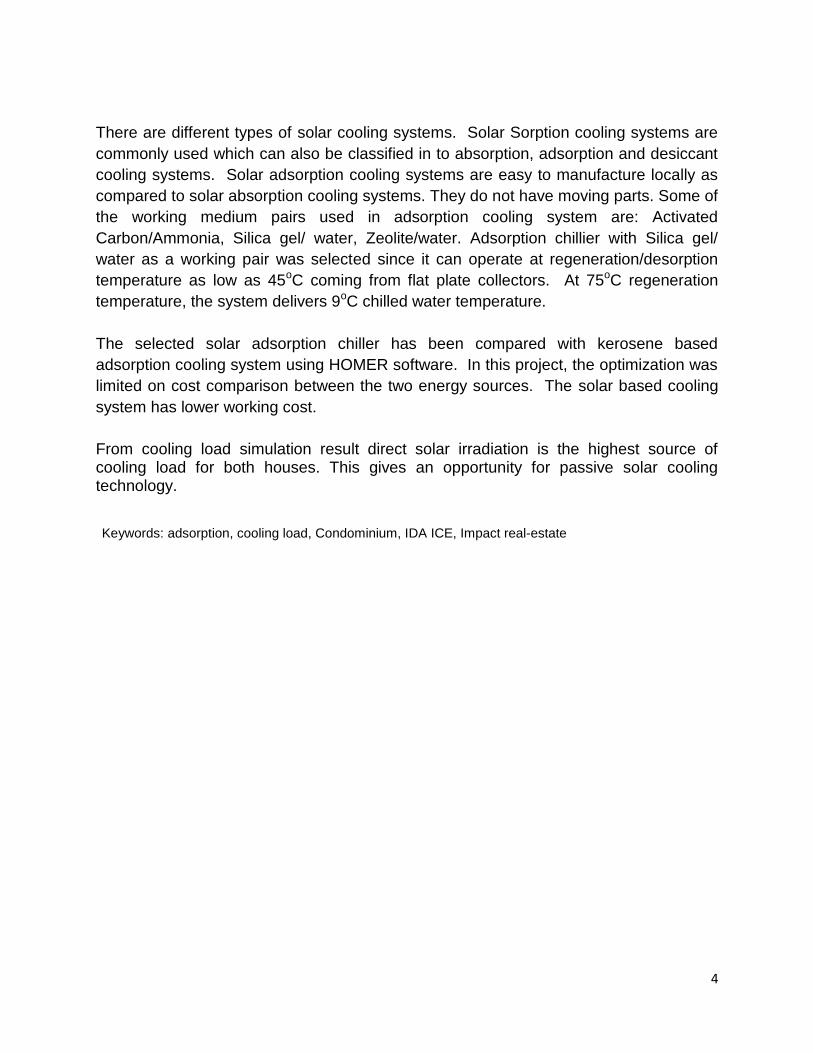
Figure 2: World energy consumption; OECD and non-OECD countries, 1980 to 2030 [IEO, 2009] .................................................................................................................... 11
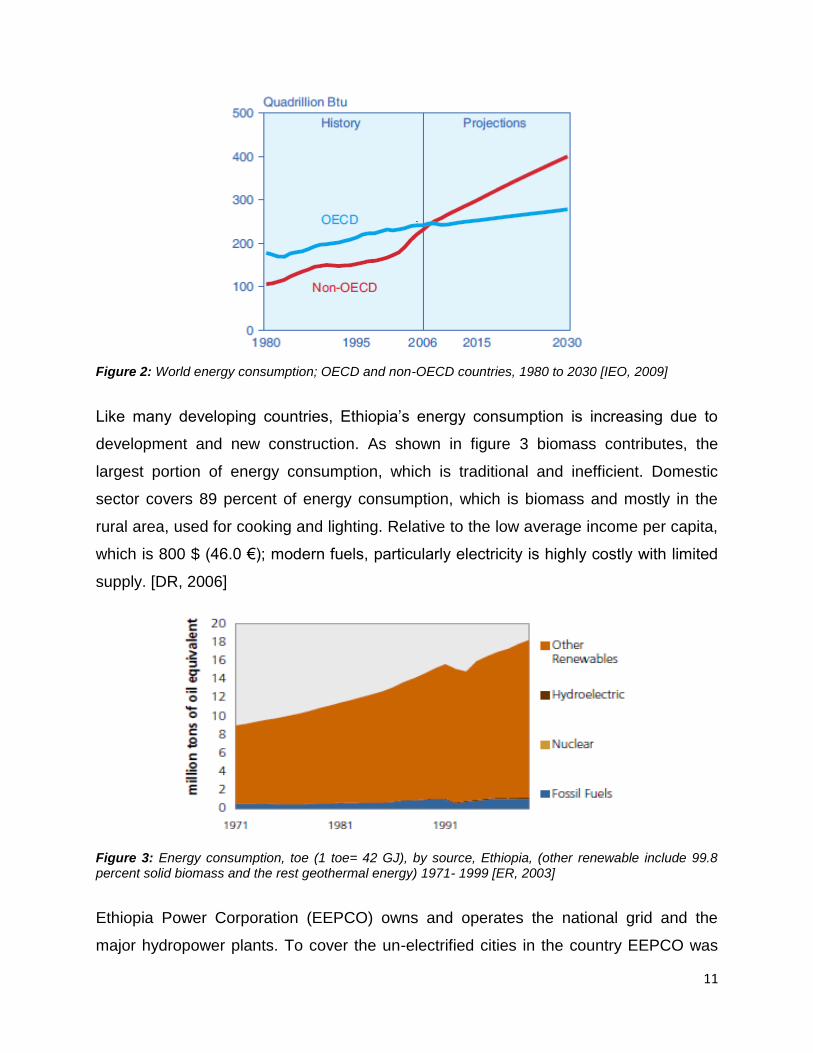
Figure 3: Energy consumption, toe (1 toe= 42 GJ), by source, Ethiopia, (other renewable include 99.8 percent solid biomass and the rest geothermal energy) 1971- 1999 [ER, 2003] ............................................................................................................ 11
Figure 4: passive solar house. [NREL, 2001] ................................................................ 19
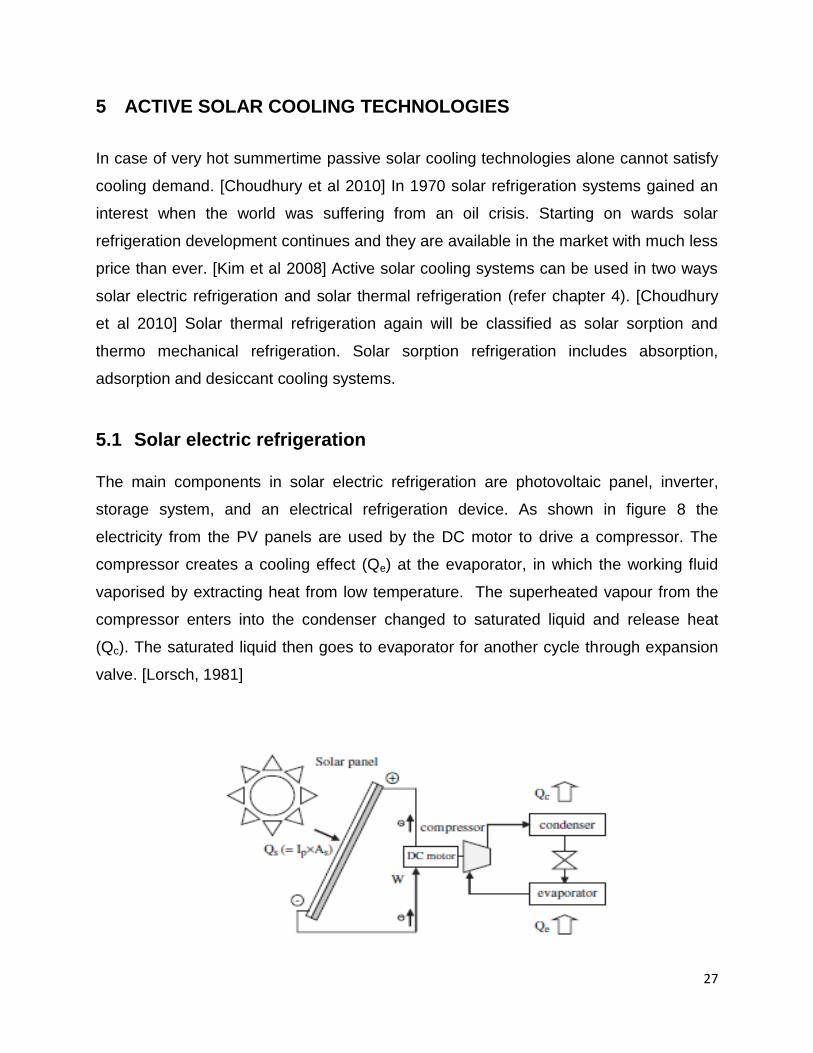
Figure 5: (a) Direct evaporative cooling [Florides et al 2002] (b) Indirect evaporative cooling [Chan et al 2010] ............................................................................................... 21 Figure 6: Solar chimney operation modes [Chan et al 2010] ......................................... 22 Figure 7: Schematic diagram of non-concentrating solar collectors .............................. 24 Figure 8: Schematic diagram of solar electric refrigeration [Kim et al 2008] .................. 28
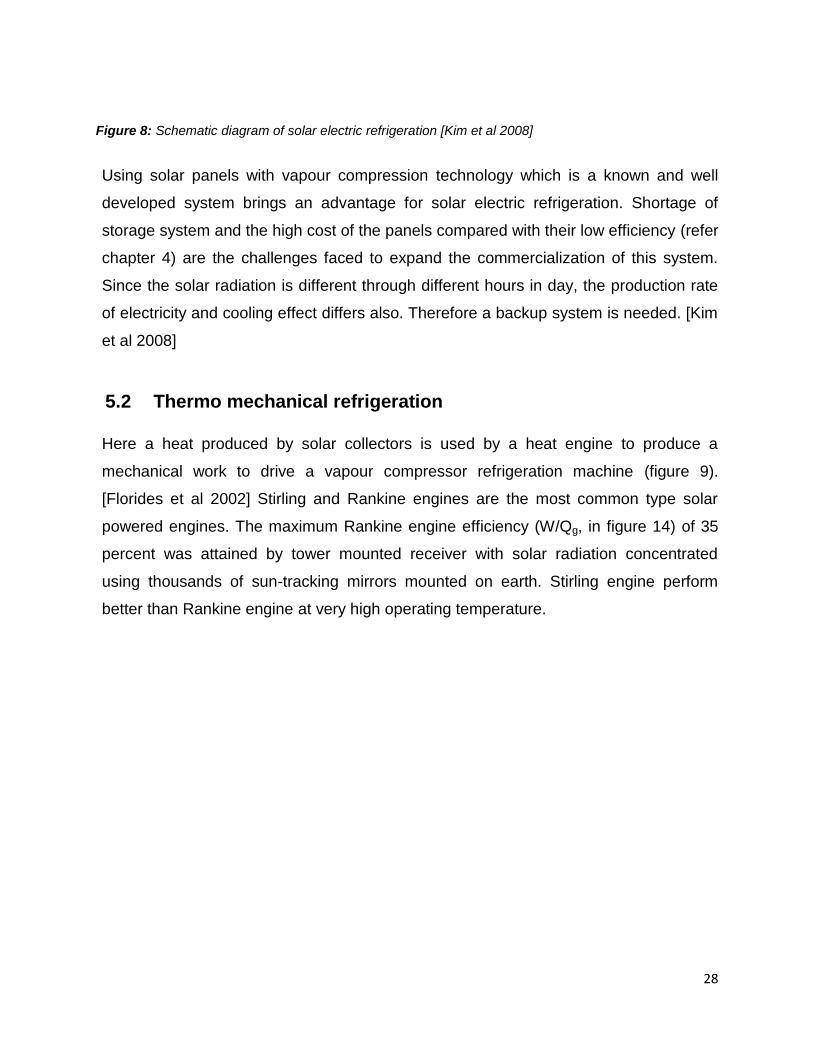
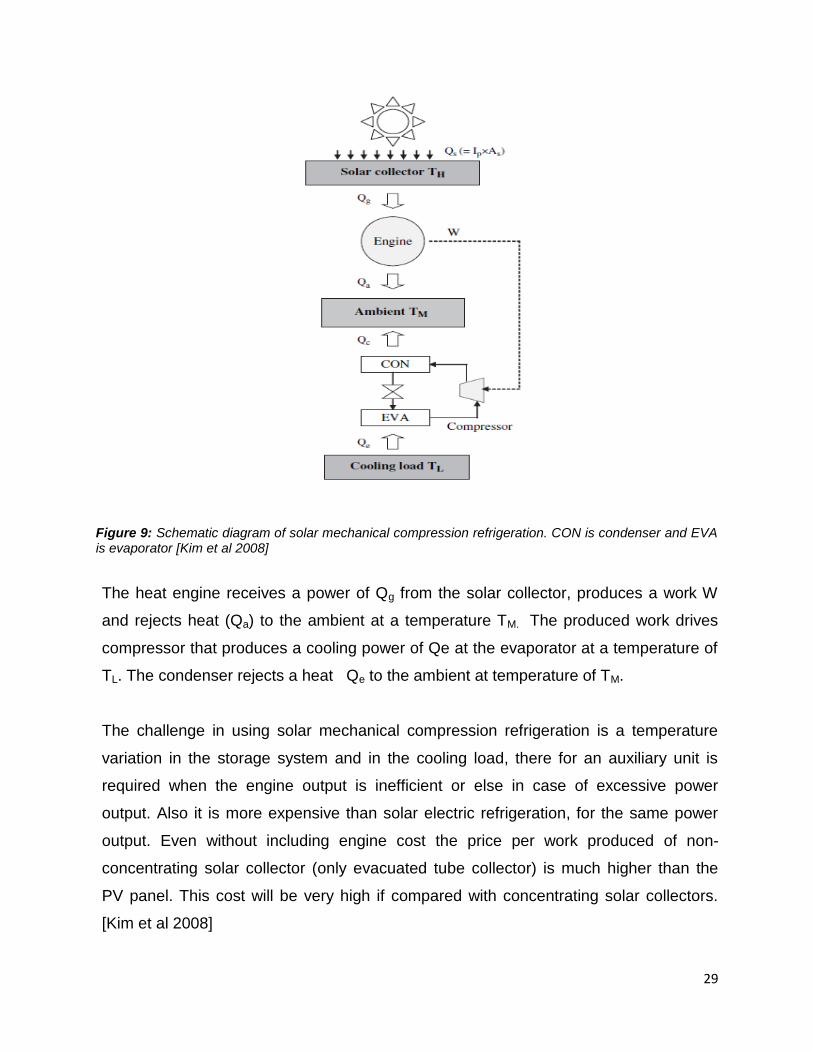
Figure 9: Schematic diagram of solar mechanical compression refrigeration. CON is condenser and EVA is evaporator [Kim et al 2008] ....................................................... 29
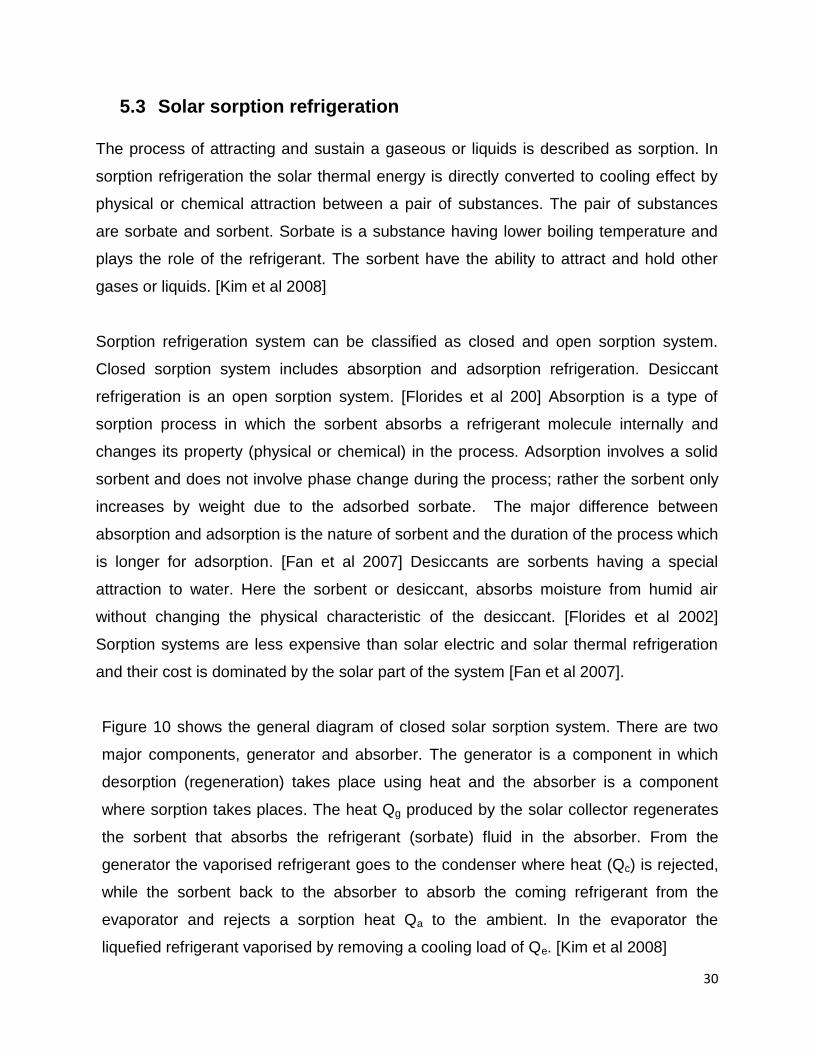
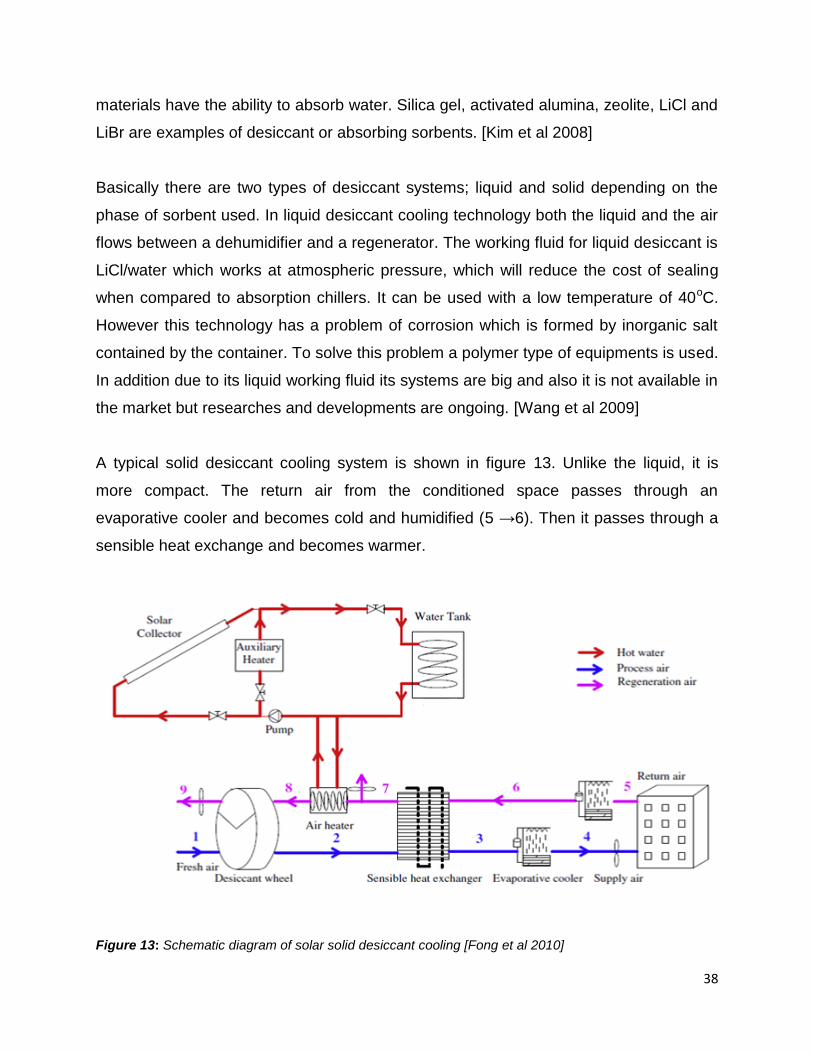
Figure 10: Schematic diagram of closed solar sorption refrigeration. [Kim et al 2008] .. 31 Figure 11: COP curve of different solar thermal chillers at different supply temperature [Henning, 2007] ............................................................................................................. 32 Figure 12: Working principle of adsorption chillers [ESTIF 2006] .................................. 36 Figure 13: Schematic diagram of solar solid desiccant cooling [Fong et al 2010] ......... 38
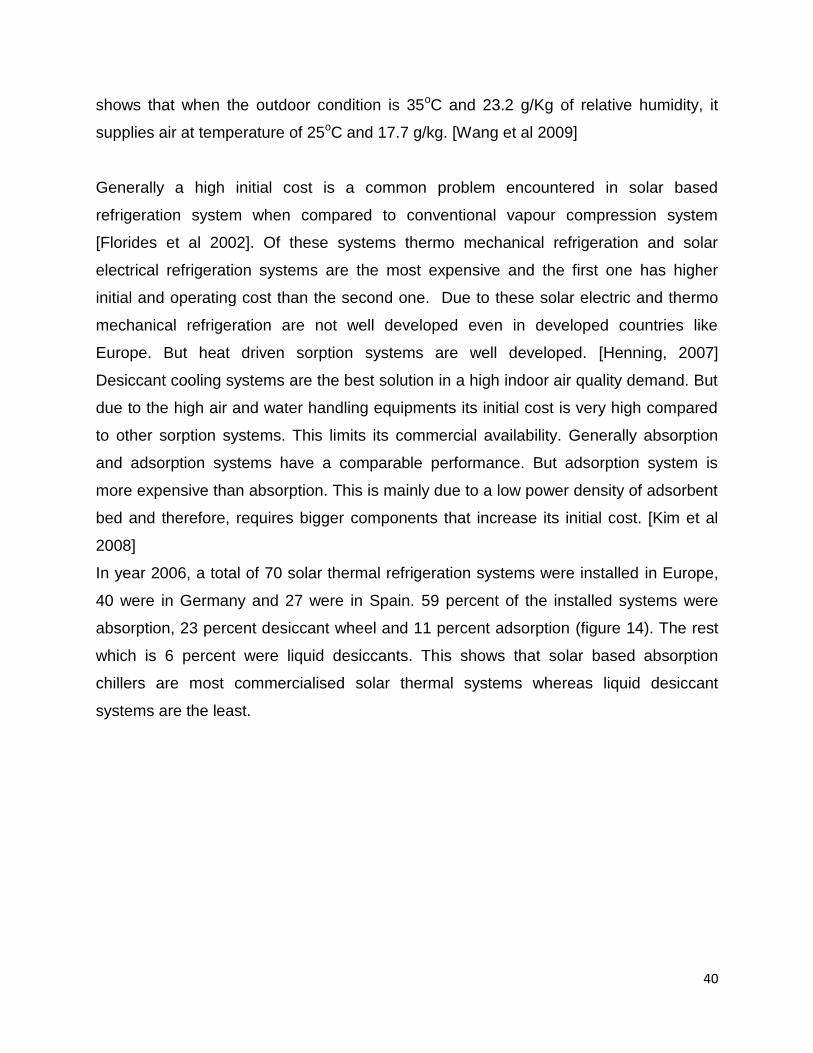
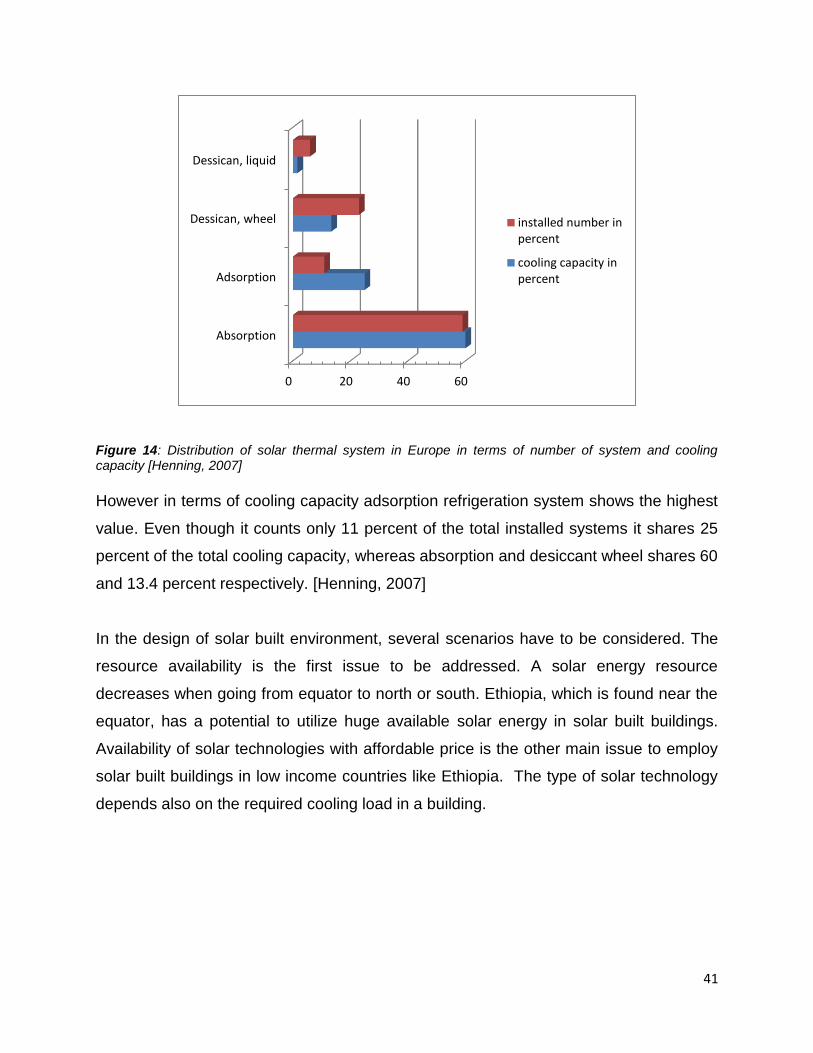
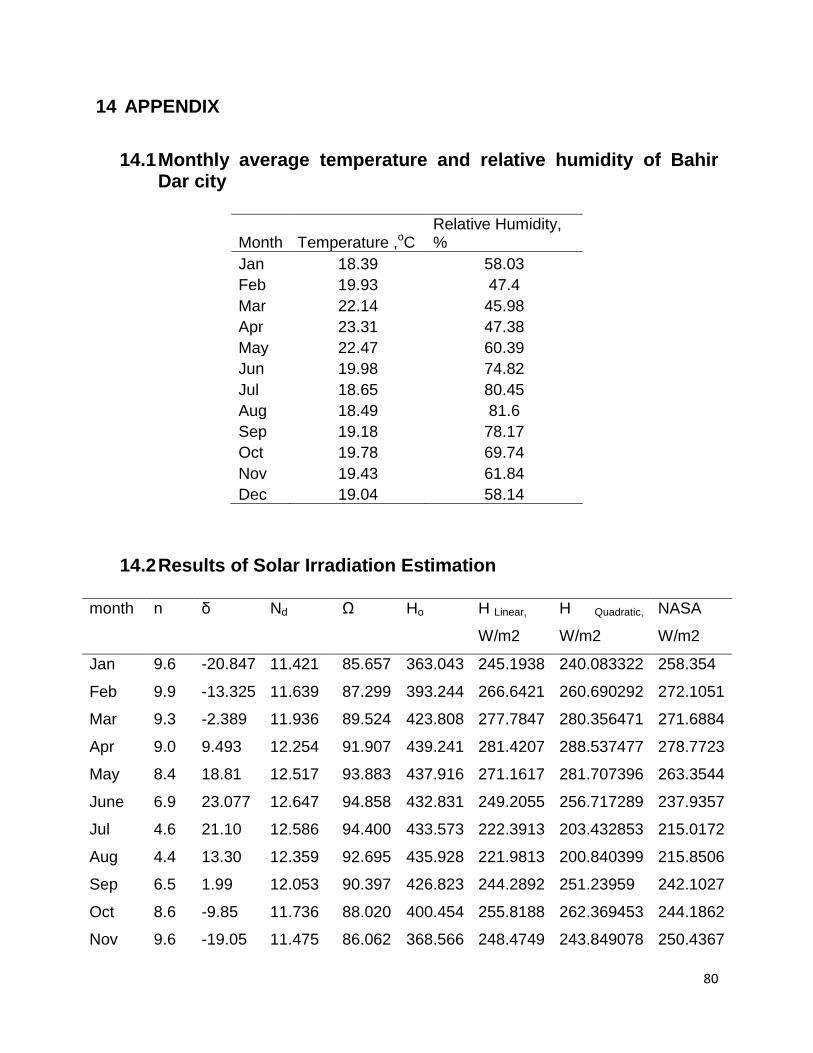
Figure 14: Distribution of solar thermal system in Europe in terms of number of system and cooling capacity [Henning, 2007]............................................................................ 41 Figure 15: Monthly average temperature and relative humidity ..................................... 42
7
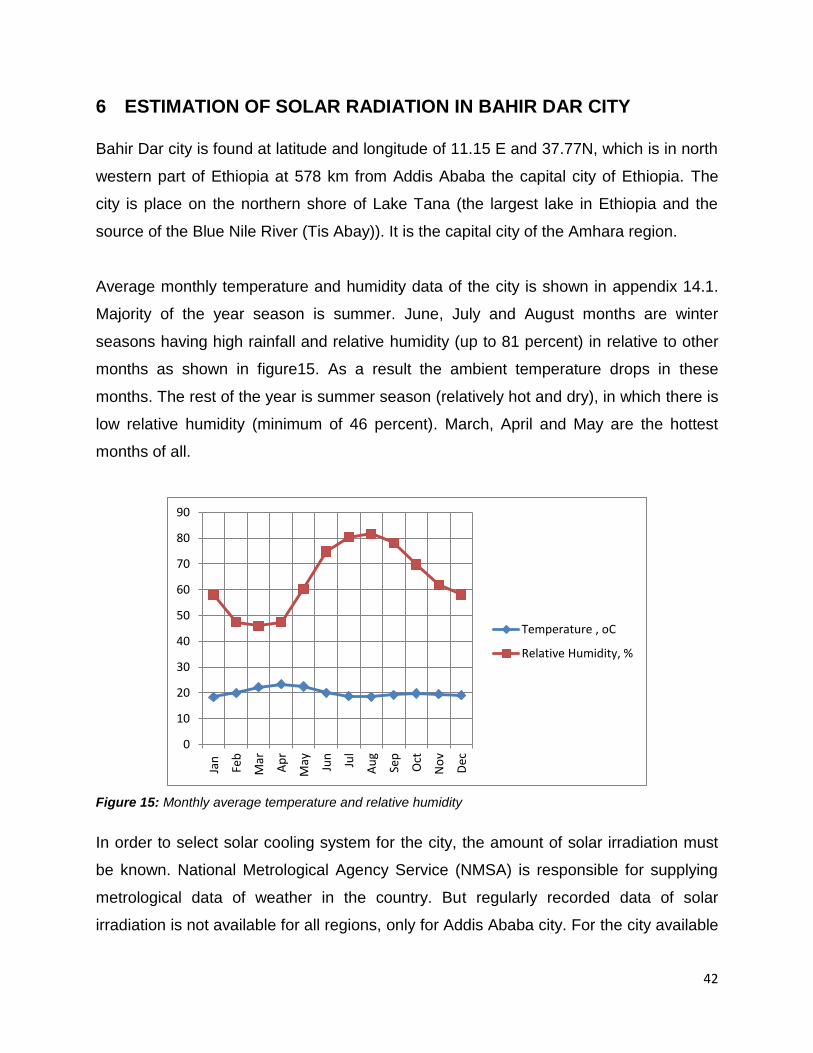
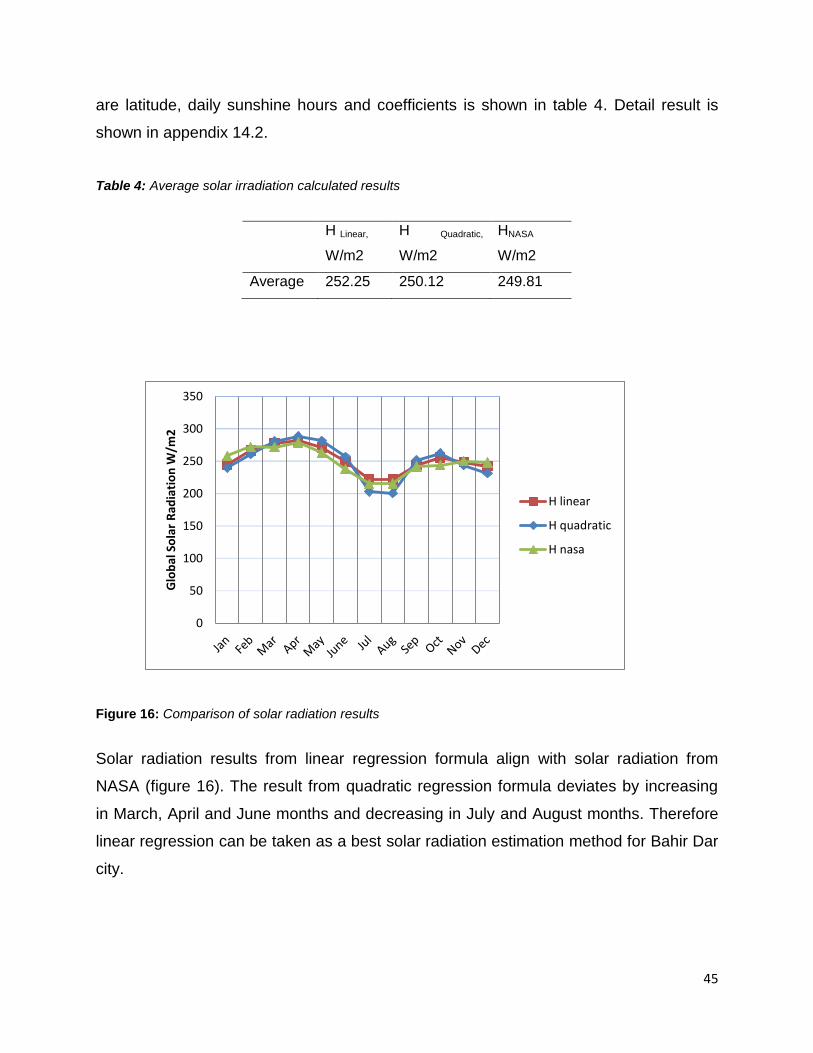
Figure 17: Comparison of solar radiation results ........................................................... 45
Figure 18: A) Floor plan of “one bed room” zone and B) 3-D diagram from IDA ICE software ......................................................................................................................... 48
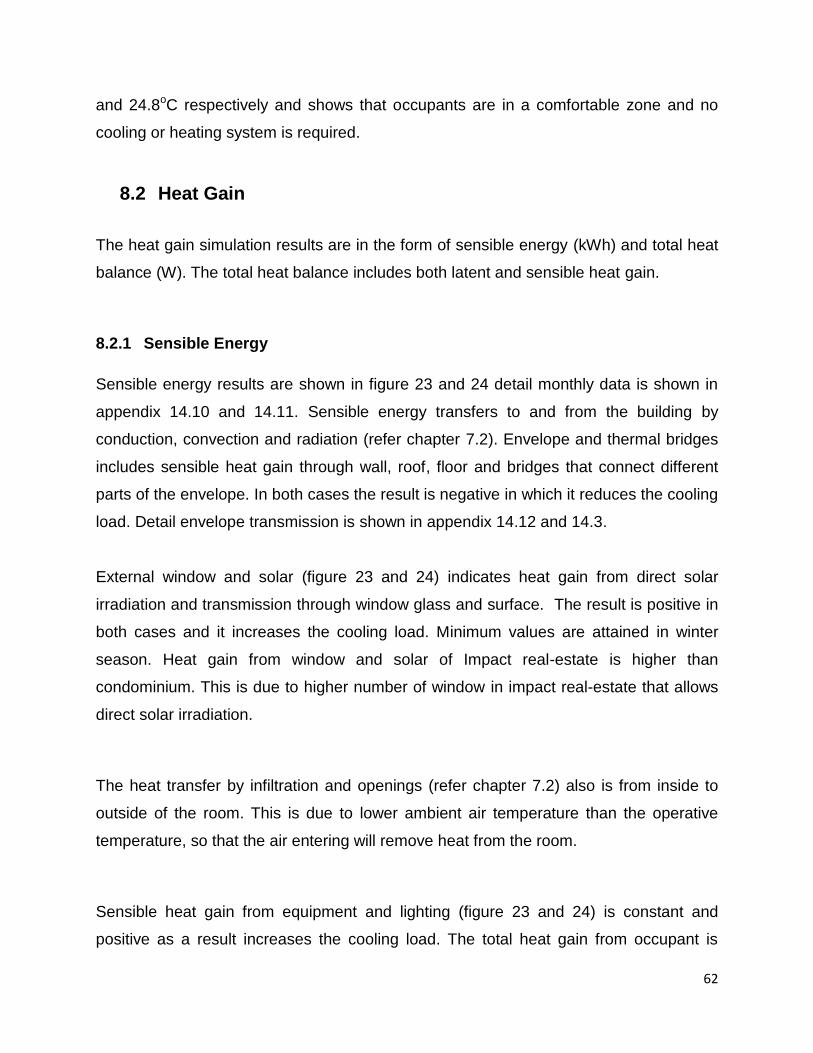
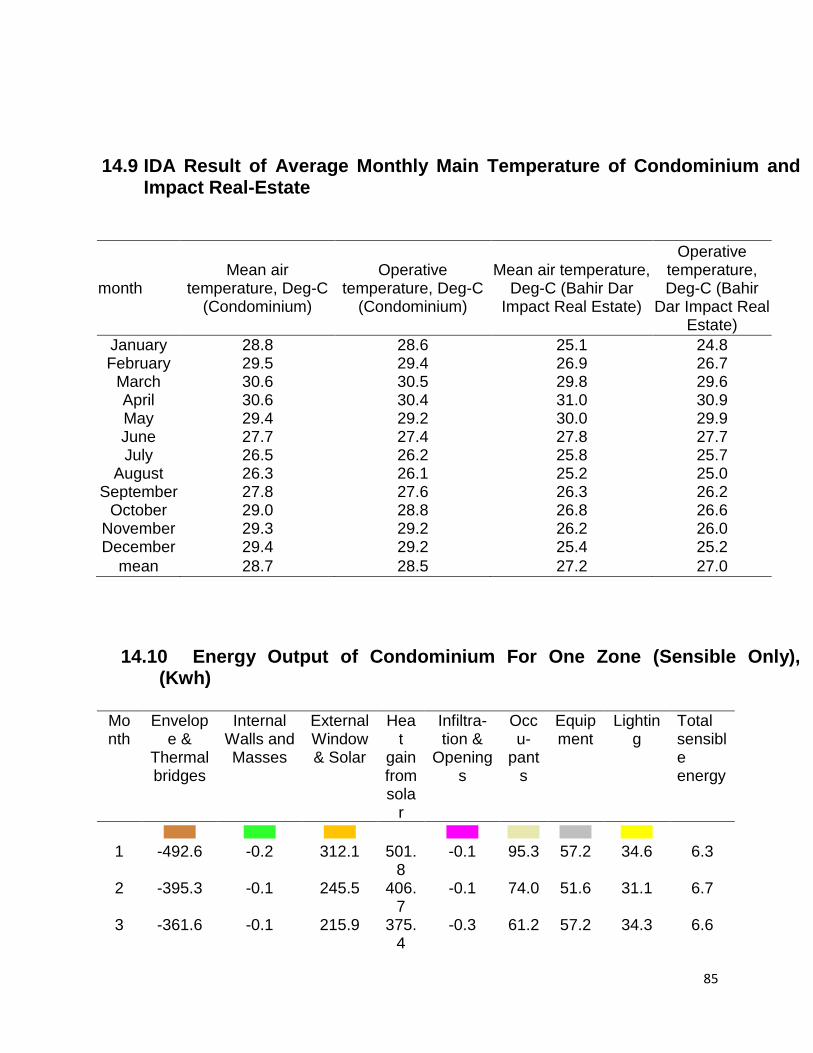
Figure 19: A) Schematic diagram of 500 meter square floor plan; B) 3 D diagram from IDA ICE of impact real-Estate ....................................................................................... 51 Figure 20: Percentage value of internal heat gain of impact real-estate and condominium ................................................................................................................. 57 Figure 21: Mean air and operative temperature of Condominium and impact real-estate ...................................................................................................................................... 60 Figure 22: Dry bulb ambient temperature and operative temperature of condominium and impact real-estate ................................................................................................... 60 Figure 23: Operative and mean air temperature of impact and condominium on May 13 ...................................................................................................................................... 61 Figure 24: Diagram energy output of condominium for one zone (sensible only), kWh 63 Figure 25: Diagram Energy output of impact real-estate for one zone (sensible only), kWh ............................................................................................................................... 64 Figure 26: total heat balance of Condominium and Impact real-estate ......................... 66
Figure 27: Latent heat gain for condominium and impact real-estate ............................ 67 Figure 28: Homer optimization diagram of solar adsorption chiller ................................ 71
Figure 29: HOMER simulation diagram of diesel based adsorption chiller .................... 72
INDEX OF TABLES
Table 1: Carbon dioxide emission from buildings in percent [Wiel et al 1998] ............... 13 Table 2: Solar heating and cooling technologies by active and passive systems [Chan et al 2010] ......................................................................................................................... 18 Table 3: Comparison between absorption system with water/NH3 and LiBr/water [Fan et al 2007] ......................................................................................................................... 34
Table 4: Average solar irradiation calculated results ..................................................... 45 Table 5: Metabolic activity at different activity level [EQUA, 2009] ................................ 54 Table 6: Cooling design results of IDA ICE ................................................................... 58 Table 7: Mean air and operative temperature of Condominium and impact real-estate 59 Table8: Average values of total heat balance variables for condominium and impact real-estate ..................................................................................................................... 65 Table 9: Input parameters for solar based adsorption in HOMER software [Jakob et al 2008, T.Tsoutsos et al 2003, SolarNext] ....................................................................... 71 Table 10: Input parameters for kerosene based adsorption in HOMER software [T.Tsoutsos et al 2003, WFB] ........................................................................................ 72
8
NOMENCLATURE
1 Btu
CPC
1 British Thermal Unit (figure 1 and 2) = 10055 J = 778.2ft*lb
Compound Parabolic Collector
COP Coefficient of Performance
DC Direct Current
DEC
EEPCO
Direct Evaporative Cooling
Ethiopia Electric Power Corporation
ETC Evacuated Tube Collector
FPC Flat Plate Collector
HVAC Heating, Ventilating and Air Conditioning
IEC Indirect Evaporative Cooling
NPC Net Present Cost
OECD Organization For Economic Co-Operation And Development
PV Photovoltaic
PPD Predicted Percentage of Dissatisfied
SHGC Solar Heat Gain Coefficient
SCL
Solar Cooling Load Factor In W/M2
SC Shading Coefficient Which Is Dimensionless
TOE Tonne Of Oil Equivalent
9
ABBREVIATION CaCl2 Calcium Chloride
Cp Specific Heat Capacity Of The Air, J/(Kg-C
Fs Special Allowance Factor Which Is 1.20 For General Application
Fu Ratio of Working Time To 24 Hour
k
Thermal Conductivity
LiBr Lithium Bromide
LiCl Lithium Chloride
NH3 Ammonia
Q Heat Transfer Rate (kW)
TH Temperature Of High Temperature Heat Source (K)
TL Temperature Of Heat Sink (K)
Tm Temperature of Low-Temperature Heat Sink (K)
∆t
Temperature Difference Of Air Entering And Leaving
W Work (kw)
∆ω Humidity Ratio Difference Between Air Entering And Leaving
Λ Latent Heat of Vaporization
10
1 INTRODUCTION
Access to affordable energy service is fundamental to human activities, development,
and economic growth. Development goals in the areas of water, health, agriculture, and
biodiversity often cannot be met without energy inputs and the policies adopt in these
sectors similarly impact the availability and reliability of energy services. This is the
reason behind the large increment in energy consumption in all over the world and
consequently the change in climate [Flavin et al].
International Energy Outlook 2009 (IEO2009) projects world energy demand for the
year 2030 by using data’s of 1980 to 2006 year as history, as shown in figure 1 and it is
reported that world energy consumption increase by 44 percent from year 2006 to 2030.
Currently the OECD countries contribute the largest energy consumption. But the
current energy consumption rate of these countries is 0.6 percent in contrast with non-
OECD countries which is about 2.3 percent per year. Because of these rates it is
expected that non-OECD countries will be the largest energy consumers in the future,
as can be seen in figure 2. This is due to rapid growth and increase in energy
consumption in the non–OECD countries, and availability of energy efficient
technologies and incentives in OECD countries. Of the non-OECD countries Chinese
and India’s total energy consumption will increase by nearly double and this will be
around 28 percent of world energy use in 2030. [IEO, 2009]
Figure 1: World marketed energy consumption 1980 to 2030 [IEO, 2009]
11
Figure 2: World energy consumption; OECD and non-OECD countries, 1980 to 2030 [IEO, 2009]
Like many developing countries, Ethiopia’s energy consumption is increasing due to
development and new construction. As shown in figure 3 biomass contributes, the
largest portion of energy consumption, which is traditional and inefficient. Domestic
sector covers 89 percent of energy consumption, which is biomass and mostly in the
rural area, used for cooking and lighting. Relative to the low average income per capita,
which is 800 $ (46.0 €); modern fuels, particularly electricity is highly costly with limited
supply. [DR, 2006]
Figure 3: Energy consumption, toe (1 toe= 42 GJ), by source, Ethiopia, (other renewable include 99.8 percent solid biomass and the rest geothermal energy) 1971- 1999 [ER, 2003]
Ethiopia Power Corporation (EEPCO) owns and operates the national grid and the
major hydropower plants. To cover the un-electrified cities in the country EEPCO was
12
constructing hydroelectric dams, and in year, 2009/2010 three main hydroelectric
projects called Tkeze (300 MW), Gelgel Gibe II (420 MW) and Tana Beles which is
multipurpose (in addition to electricity production it is also used for irrigation purpose)
hydroelectric project (460 MW) were completed and ready to produce a total of 1180
MW. [Bekele, 2010]
Ethiopia is close enough to the equator and gets plenty of solar power whenever the
sun is shining. That is why the name “thirteen months of sunshine” is given. Even in the
summer season, there is sunlight for a short period of time. Though there is a huge
potential for solar energy utilization as a most promising renewable energy resource,
solar energy is not harnessed to generate power in a desirable way. Bahir Dar city has
a solar insolation of a maximum in April and a minimum insolation in July. [GASIMA,
2007] This thesis work focuses on the study of solar cooling design options and their
feasibility considering the two housing system, low cost housing system and villas
constructed by real estate companies in Bahir Dar city.
1.1 Energy in Built Environment
Due to increment of living standard and comfort, energy demand in built environment is
increasing. 25-30 percent of entire energy allied carbon dioxide emission of developed
countries comes from buildings. Also in developing countries, building carbon dioxide
emission increased from 11 percent to 19 percent from year 1973 to 1990. There is a
reduction of carbon intensity of energy services as a result of improvements in efficiency
and better technology but the increase of energy consumption for more services has
plagued these intensity reductions. As shown in table 1 the total carbon dioxide
emission of OECD countries is compared to Non-OECD and it is higher in the Non-
OECD countries with an almost flat emission growth rate for the OECD countries. [Wiel
et al 1998]
13
Table 1: Carbon dioxide emission from buildings in percent [Wiel et al 1998]
Region
Share of total emission in
1990
Average annual growth rate
in building emissions 1980-
1990
OECD countries
Developing countries
China
Other Asia
Latin America
Africa
Middle East
32
18
19
19
14
17
25
1.1
5.5
5.5
6.3
3.3
6.0
7.8
Carbon dioxide reduction in buildings include both energy-efficiency and non-energy
efficiency technologies. Fuel changes to non-carbon intensive and also renewable
energies are included in non energy-efficiency technology. Energy efficient technology
in buildings includes enhancements to the building shell, better management of energy
consumption, and improving the efficiency of different end-uses. For example, energy-
efficient windows compact florescent and improved efficiency of biomass stoves. In
OECD countries there is a potential of 6-16 percent of reduction in carbon dioxide
emission while non-OECD and developing countries have a larger potential of 25-44
percent when comparing energy efficient scenarios to business as usual trends. This
higher reduction potential is due to construction of new buildings that gives the
opportunity to build in a more efficient way, while in developed countries, energy
consumption reduction is done usually by retrofitting on existing buildings. Growth and
implementation of new technologies that make energy production and consumption
more efficient in non-OECD countries would bring a significant reduction in carbon
dioxide emission. [Wiel et al 1998]
About 86 percent of the population in Ethiopia lives in rural areas. The homes in rural
area are traditional hut called “Tukul” that have circular floor and wall. Wood is the main
14
material that used for the construction of wall and roof supports. The wall is reinforced
with crop stacks and mud or ash or fresh animal dung is used for plastering. For roof
construction light materials like bamboo and grass are used together with thin wood
planks. The floor is a plain made of mud or covered by fresh animal dung to reduce the
dust particles. [Kumie et al 2002]
The majority of the population use traditional and inefficient biomass (only 5 to 10
percent of efficiency) for cooking, lighting and in cold season for heating. This results in
deforestation and indoor air pollution. Most residential houses are not constructed to
take in account the peoples comfort at the design stage. Thermal comfort is done by
using external shading systems that are natural like planting trees or artificial shading
systems, such as infiltration of air through doors and windows, adjusting their wearing
style etc. [HEDON, 2007]
Bahir Dar city is found at altitude of 1800 meter and the heating/cooling load is not as
huge as cities in the north such as Stockholm. The hot season’s duration is longer than
the cold season, and working on technologies for cooling can be much feasible than
heating technologies. Bahir Dar is one of the fast growing cities in the country. To meet
the demand of housing in the city, different type of apartments and villa houses are
under construction. However, renewable energy integrated building are hardly
considered in the construction of theses housings. This can lead to an energy intensive
housing system in the near future. Solar technologies can be installed even after the
construction of buildings. In the design of solar built environment, several scenarios
have to be considered. The resource availability is the first issue to be addressed. A
solar energy resource decreases when going from equator to north or south. Ethiopia,
which is found near the equator, has a potential to utilize huge available solar energy in
buildings. Availability of solar technologies with affordable price is the other main issue
to employ solar built buildings in low income countries like Ethiopia. The type of solar
technology depends also the required heat/ cooling load in a building.
15
So as to propose an affordable solar cooling technology for Bahir Dar city, it is crucial to
study different solar cooling technology, potential of solar irradiation and cooling load
demand of the houses. Depending on people income level and the type of building
house, two case studies will be considered. Low income level people are most likely to
live in low cost housing (Condominium) while people with high income level live in villas
(such as real-estate), which are mostly found in the suburb of the city. For these
reasons solar cooling for condominium apartments and Impact Real-estate are the two
case studies considered in this study.
16
2 OBJECTIVES AND GOALS
This thesis work focuses on the study of solar cooling considering the two residential
housing system, low cost housing system and villas constructed by real estate
companies in Bahir Dar city. To do so a literature study of the solar cooling techniques
available today will be done, an estimation of solar energy potential of the city will be
performed and the cooling load of these two house cases will be analysed. Finally an
optimisation and a comparison with other sources of fuel will be carried out. However,
the limitation of this thesis work is that the software to simulate comparison to other
resources cannot optimise solar thermal system; therefore an approximation is made by
substituting the solar thermal system with a biomass in the software. Further, the thesis
project includes submitting 3 draft reports, work progress reports and a presentation of
the results.
3 METHOD OF ATTACK
To achieve the objective of this project different methods are applied. First literature
review of different solar cooling technologies using different sources will be taken.
Secondly solar energy resource in Bahir Dar city will be estimated. To consider average
living standard residential houses, two case studies will be taken, a high standard level
villas which are built by Impact real-estate Company and low cost condominium houses
which are built by government. A study of house hold energy demand and internal heat
gain of the two cases mentioned will be done by interviews to gather information on
household energy demand and material of construction for both cases by preparing
questionnaires for household responsible and for construction managers, using IDA
ICE software to determine the cooling loads for the two house cases from the data’s of
the interviews. Depending on the simulated load, appropriate solar cooling technology
will be selected. Finally, using HOMER software, optimization and comparison of the
solar thermal cooling system with other resources will be done. During the project report
drafts are continuously written and submitted to the supervisors for feedback.
17
4 SOLAR COOLING SYSTEMS
Energy use in buildings varies due to geographic place, climate, culture, wealth and
types of building. For example space heating is dominant in developed countries like
Europe, northern China and Japan. Where as, in developing countries like India and
Ethiopia cooking is the main energy use. [Kornevall, 2009] Heating, ventilating and air
conditioning (HVAC) are systems that control the indoor air, which is strongly dependent
on the outside climate, by regulating temperature and humidity in order to attain thermal
comfort and indoor air quality. [Mateus et al 2009] This is mostly achieved by vast
energy inputs through conventional systems that utilises fossil fuels. However burning of
fossil fuel has a negative impact regarding the environment and source of energy.
Replacing these non-renewable energy sources with renewable is a major option to
protect global environment and for having secured source of energy. Thus reduction of
energy consumption and generation of CO2 emission give an opportunity for solar
based HVAC systems. Solar based HVAC systems have been used for building
application for many years. [Kim et al 2008] Solar heating systems provide heat or
retain solar radiation in the building structure. Whereas cooling systems provide lower
temperature or protect the building from direct solar radiation. Depending on the way
solar energy utilisation, solar cooling and heating systems can be divided as passive or
active technologies (table 2). Passive technologies do not use mechanical devices or
use them only in small portion and it is related to building design. Whereas active
technologies use mechanical devices, like fans and pumps to increase efficiency of the
system. Active technologies collect the solar radiation by using photovoltaic cells or
solar collectors. [Chan et al 2010]
18
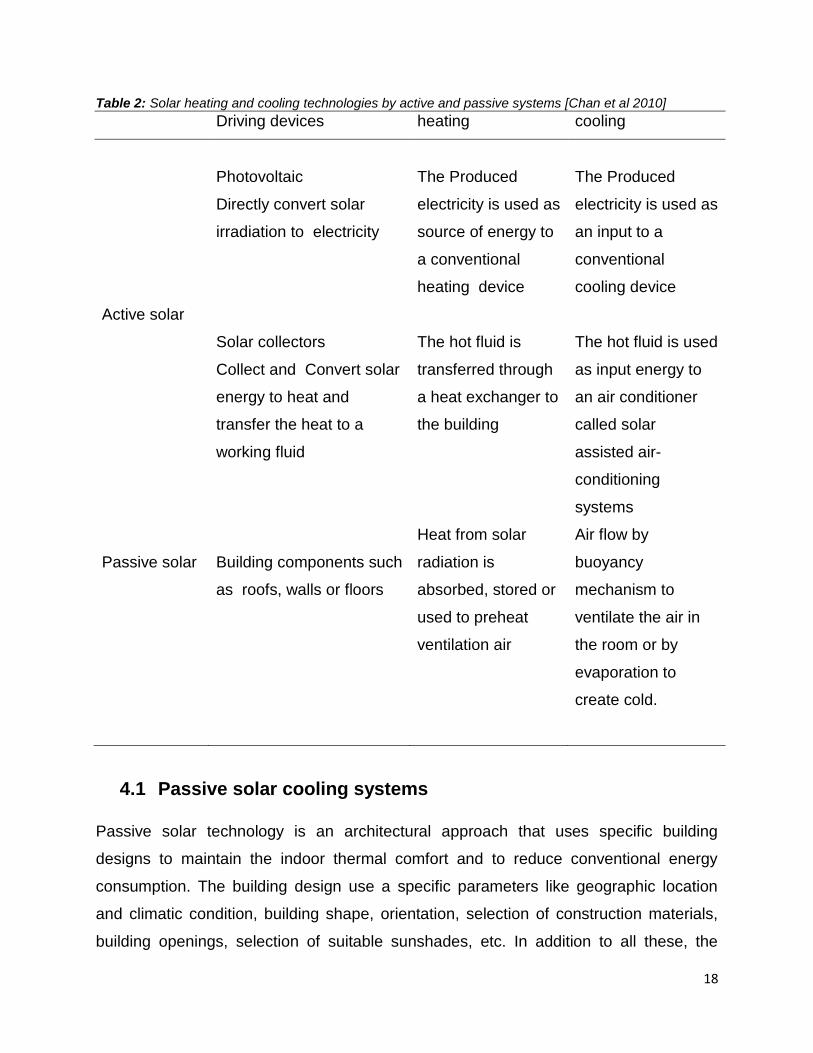
Table 2: Solar heating and cooling technologies by active and passive systems [Chan et al 2010]
Driving devices heating cooling
Active solar
Photovoltaic
Directly convert solar
irradiation to electricity
The Produced
electricity is used as
source of energy to
a conventional
heating device
The Produced
electricity is used as
an input to a
conventional
cooling device
Solar collectors
Collect and Convert solar
energy to heat and
transfer the heat to a
working fluid
The hot fluid is
transferred through
a heat exchanger to
the building
The hot fluid is used
as input energy to
an air conditioner
called solar
assisted air-
conditioning
systems
Passive solar
Building components such
as roofs, walls or floors
Heat from solar
radiation is
absorbed, stored or
used to preheat
ventilation air
Air flow by
buoyancy
mechanism to
ventilate the air in
the room or by
evaporation to
create cold.
4.1 Passive solar cooling systems
Passive solar technology is an architectural approach that uses specific building
designs to maintain the indoor thermal comfort and to reduce conventional energy
consumption. The building design use a specific parameters like geographic location
and climatic condition, building shape, orientation, selection of construction materials,
building openings, selection of suitable sunshades, etc. In addition to all these, the
19
building design must meet economical and functional in a satisfactory performance.
[Robertson et al] Unlike active solar system air flow is obtained by the effect of
buoyancy (table 2) where hot air with low density moves up ward and cold air having
high density moves down ward [Chan et al 2009].For passive solar building
construction, the material of construction, orientation and shape of a building must be
designed by considering the external conditions, such as amount of light, heat, and air
movement needed in the house where as material of constructions are done by
considering thermal, moisture and sound demand [Ralegaonkar et al 2010]. Windows,
walls, and floors can be designed to collect, store and distribute solar energy in the form
of heat in cold season and reject or block heat in hot season. [NREL, 2001]
Passive solar cooling can be done by simply blocking the sunlight by a roof overhang
(control as shown in figure 4) or other devises, such as awnings, shutters and trees. To
maintain the proper shade, the physical dimension of the overhang should be
considered. On the other hand passive solar cooling can be achieved by circulation of
air in the room by buoyancy effect called natural ventilation or through evaporative
effect. [Chan et al 2010]
Figure 4: passive solar house. [NREL, 2001]
20
Aperture (collector): this is glass (window) that allows sunlight to pass through it. Here
the aperture should not be shaded by trees or any other buildings and its face towards
to the equator.
Absorber: it is dark in colour and placed on the direct passage of solar radiation and
absorbs it as heat. It could be a masonry wall, floor, or partition (phase change
material), or that of a water container.
Thermal mass: this element stores the absorbed heat. Usually the absorber and thermal
mass form the same wall or roof, but the absorber is exposed to sunlight and thermal
mass is behind or under the absorber.
Distribution: this is the heat transfer mechanism from the storage to different areas of
the room. For pure passive solar house the heat is transferred by conduction,
convection and radiation. In some application fans, ducts and blowers can be used to
enhance the distribution.
Control: unlike the above four elements that are applicable for solar heat gain during
cold season, this element is appropriate for hot/summer season. It blocks the sunlight
not to pass in to the room or through the collector. Roof overhangs can be used or other
elements that control under-and /or overheating include: electronic sensing devices,
such as a differential thermostat that signals a fan to turn on operable vents and
dampers that allow or restrict heat flow; low emissivity blinds; and awnings. [NREL,
2001]
4.1.1 Evaporative cooling
Evaporative cooling is the oldest and the most effective passive solar cooling system.
This system uses evaporation of water to create a cooling effect and it is integrated on
the roof rather than facade. There are two types of evaporative cooling systems: direct
evaporative cooling (DEC) and indirect evaporative cooling (IEC) systems. In DEC
system the cooling effect is governed by evaporation of water in the air. Here the major
principle is transformation of sensible heat (from air) to latent heat (evaporation of
water). Water is supplied and re-circulated to the air stream by using pumps, so that
some of the water is evaporated by the sensible heat from the air, as shown in figure
21
5(a). At the end of the process the amount of moisture in air is increased which
decrease cooling efficiency of the system especially in hot and humid climate. Therefore
the supply air to the indoor is usually dehumidified to increase the cooling efficiency.
Dehumidification can be attained by using water absorbing substance such as
desiccants.
In IEC system cooling is also attained by evaporation however there is a heat
exchanger in between wet air and dry supplied air stream. The heat exchanger can be a
wall which is covered by a water resistance layer to prevent introduction of moisture in
the supply air as shown in figure 5(b).The principle is the same as the DEC system. The
water in the wet surface is evaporated by the hot air stream and cools down the surface.
This cold surface exchanges only heat (without moisture) with the supply air stream and
results in a cold and dry air stream. Then the cold dry air will be supplied without any
additional dehumidification process. [Chan et al 2010]
Figure 5: (a) Direct evaporative cooling [Florides et al 2002] (b) Indirect evaporative cooling [Chan et al 2010]
22
4.1.2 Solar chimney
The function of solar chimney is to create air movement in the building, by converting
solar thermal energy to kinetic energy. Here the driving force is Buoyancy force which
comes from density difference that results from temperature difference between the inlet
and outlet of the chimney.
Figure 6: Solar chimney operation modes [Chan et al 2010]
Solar chimney can operate in different modes as shown in figure 6. The first one natural
ventilation mode is applied when the outdoor temperature is lower than the indoor, in
which passive cooling is achieved. However when the outdoor temperature is higher
than the indoor (in hot climate) it acts as thermal insulation. In this case other active or
passive systems can be used in place of chimney to satisfy thermal comfort. Solar
chimney has the ability to warm or ventilate the room air even in hazy days. [Chan et al
2010]
Proper solar passive design of orientation, structure envelope, construction material is
very vital to control thermal heat gains/loss and reduces the size of HVAC system, if
there is. Solar passive designs add 0-15 percent of design and construction costs. But
they results in a long life energy savings.
The dark colour of passive solar collector maximises absorption of solar radiation.
However usually this dark surfaces are not acceptable aesthetically. Therefore active
23
solar collectors are used in replace to those facades and installed separately from the
building or confined to roof to minimise aesthetic problems.
4.2 Active Solar cooling Systems
Solar active systems use mechanical device to accomplish the three principles; collect,
store and distribute solar energy. Active systems are more expensive, easier to retrofit
and efficient than passive systems. [NREL, 2001] Depending on the way the solar
energy is used active solar cooling systems can be broadly classified as solar thermal
refrigeration and solar electric refrigeration. In the first one solar thermal collector are
installed with the system to create cooling effect. While in the second one photovoltaic
panel are used to drive conventional system by electricity (refer Table 2).
4.2.1 Solar thermal collectors
According to [Kalogirou et al 2004] solar thermal collectors is defined as “Solar collector
is a device which absorbs the incoming solar radiation, converts it into heat and
transfers this heat to a fluid (usually air, water or oil) flowing through the collector.” Non-
concentrator and concentrators are the two main types of solar collectors. The non-
concentrating solar collector have the same area for intercepting and absorbing the
solar irradiation whereas concentrating solar collectors intercept solar energy generally
in concave shaped surface and focus it to a smaller area of receiver so that a higher
solar radiation flux will be absorbed. [Kalogirou et al 2004]
Non-concentrating solar collectors
There are three types of non-concentrating (fixed) solar collectors; flat plate collector
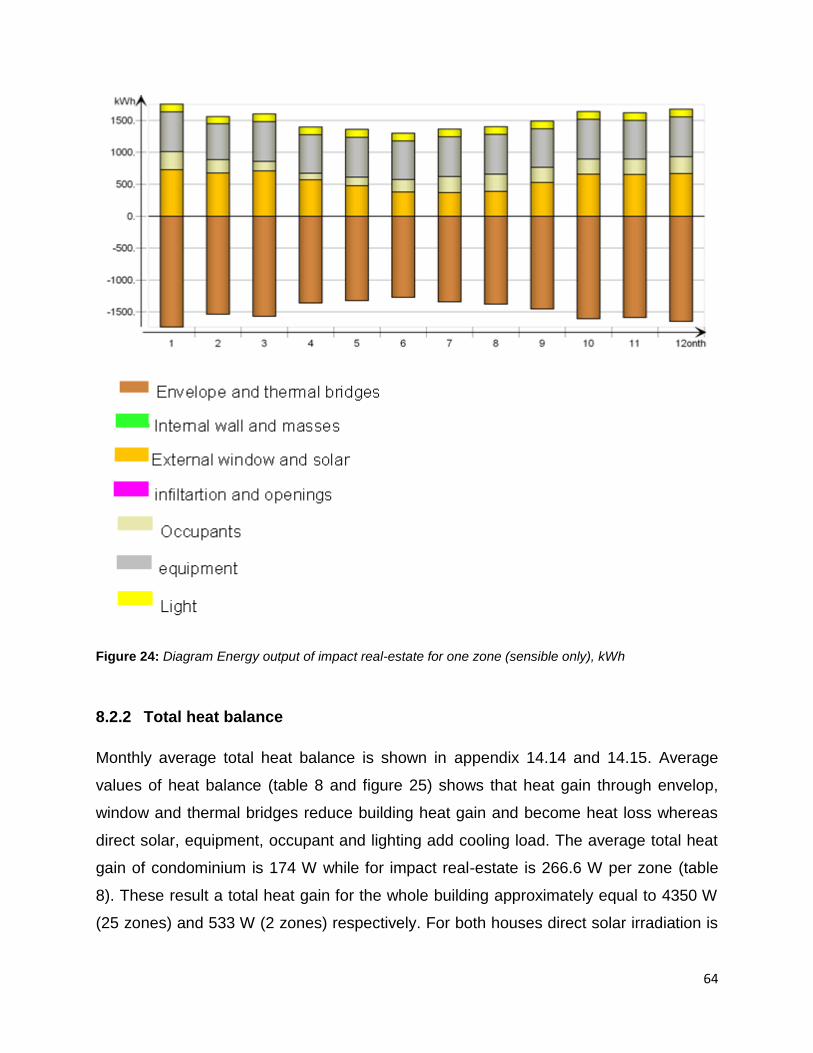
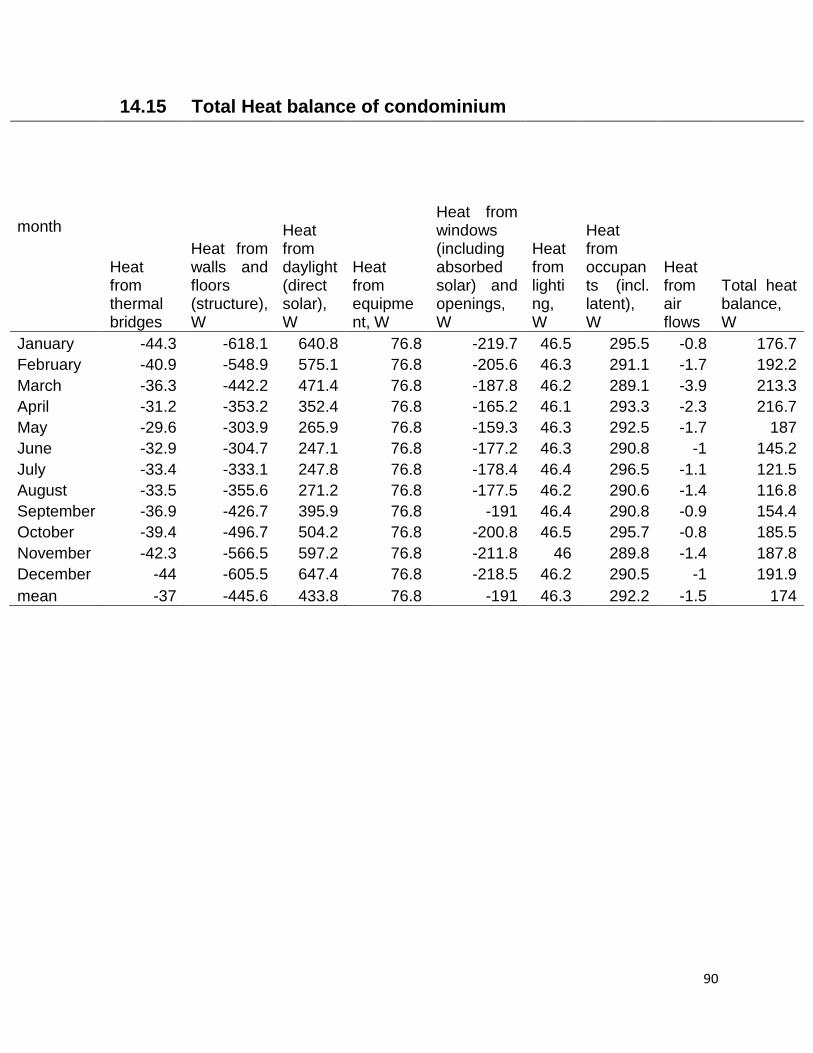
Figure 25: total heat balance of Condominium and Impact real-estate
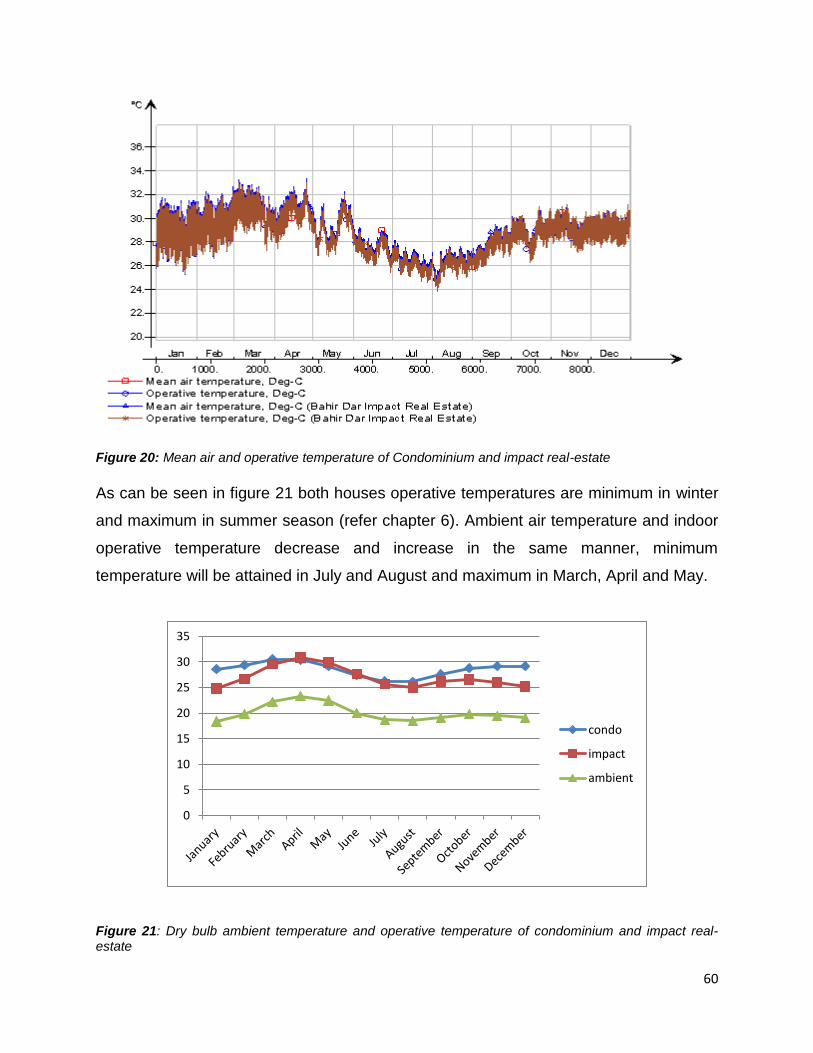
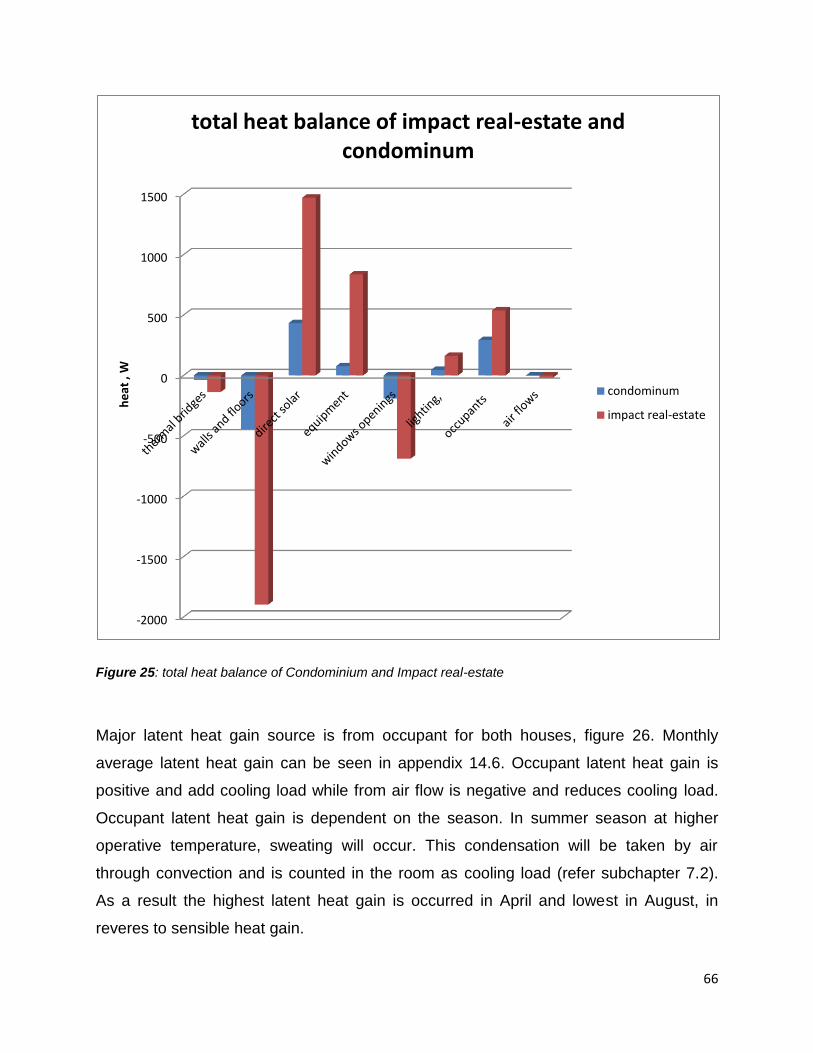
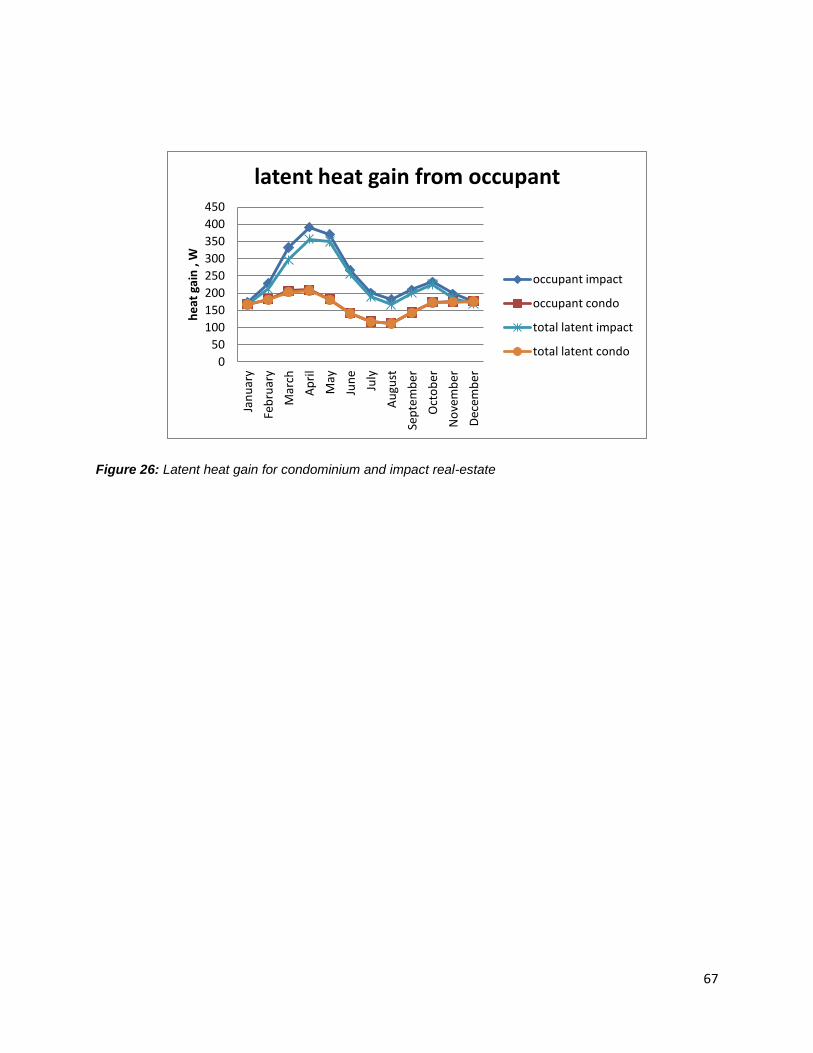
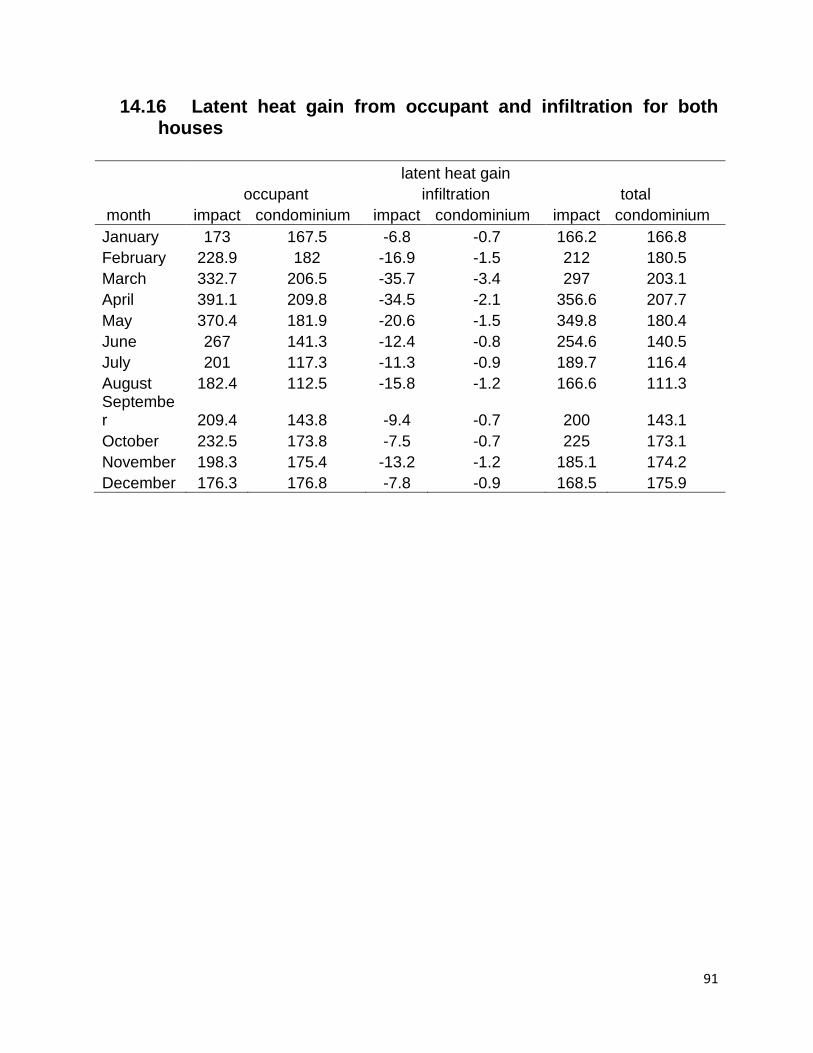
Major latent heat gain source is from occupant for both houses, figure 26. Monthly
average latent heat gain can be seen in appendix 14.6. Occupant latent heat gain is
positive and add cooling load while from air flow is negative and reduces cooling load.
Occupant latent heat gain is dependent on the season. In summer season at higher
operative temperature, sweating will occur. This condensation will be taken by air
through convection and is counted in the room as cooling load (refer subchapter 7.2).
As a result the highest latent heat gain is occurred in April and lowest in August, in
reveres to sensible heat gain.
-2000
-1500
-1000
-500
0
500
1000
1500
he
at ,
W
total heat balance of impact real-estate and condominum
condominum
impact real-estate
67
Figure 26: Latent heat gain for condominium and impact real-estate
0
50
100
150
200
250
300
350
400
450
Jan
uar
y
Feb
ruar
y
Mar
ch
Ap
ril
May
Jun
e
July
Au
gust
Sep
tem
ber
Oct
ob
er
No
vem
ber
Dec
emb
er
he
at g
ain
, W
latent heat gain from occupant
occupant impact
occupant condo
total latent impact
total latent condo
68
9 SOLAR COOLING SELECTION
Cooling load of residential buildings (3-10 kW) is very small as compared to capacity of
market available solar cooling technologies (above 100 kW). Nowadays these
capacities are becoming available in the market (refer chapter 5). There are different
criteria’s that must be considered when selecting a technology.
Solar absorption chiller is most commonly and widely used technology, specifically
using water/LiBr as a working fluid. However this system requires a high regeneration
temperature (greater than 88oC) that can be achieved usually by using evacuated tube
collector. This solar thermal collector is difficult to integrate with building. If flat plate
collector is used COP of the system will drop to 0.4 and chilled water production for
dehumidifying process will not be reached (which are 6 to 12oC). Other problem
regarding this system is corrosion which comes from LiBr salt solution, this results in a
continuous daily maintenance compared with adsorption chiller (refer chapter 4.3.2).
Silica gel/ water adsorption chiller, which can be easily found works at lower
temperature (45 to 95oC hot water). This is an advantage that will allow the system to
use flat plate collectors and can be integrated with the building envelope. Also this
system can produce chilled water as low as 9oC for a regeneration temperature of 75oC;
this will be used by a cooling coil for dehumidification process. Compared to absorption
chiller this system has no moving parts which is very vital for residential areas. In
addition there is no corrosion and crystallization which decreases the shutdown time
needed and cost for maintenance. However the system is expensive when compared to
absorption chiller because of its low cooling density problem, caused by low thermal
conductivity of silica gel, more adsorbent bed needed for a continuous operation. And
also at the same condition its COP is lower than absorption chiller though its
regeneration temperature is lower (refer chapter 4.3.2).
Desiccant solar cooling technology gives the best air quality of all. It reduces both the
temperature and humidity of supply air to the conditioned room. Solid desiccant is
available in the market than the liquid desiccant. These systems are easy to maintain
69
and give high COP at a regeneration hot air temperature of 50 to 80oC. This is the most
promising solar cooling technology for future if it’s compact and easily integrated with
buildings in which it becomes less expensive (refer chapter 4.3.3).
As a result in this project an adsorption chiller with working fluids of silica gel/water is
selected for the two houses. For impact real estate, two zones share one solar
adsorption chiller and for condominium the cooling load is very small for one zone, so
that the entire building (25 zones) can share one solar adsorption chiller.
An exact equal adsorption chiller with simulated cooling load is not available in the
market. The smallest market available adsorption chillers are 5.5 kW and 7.0 kW that
are manufactured by SolarNext Company of Germany. These chillers will work below
their designed capacity but are unable to work above their limit. Therefore a capacity
with 7.0 kW is selected. These 7 kW adsorption chiller with a brand name of chillill®
cooling kits ISC 7 is manufactured in a form of kits. Cooling kits contains solar thermal
collector, hot water storage, pump-set, chiller, re-cooler, and partially cold water storage
and system control (refer appendix 14.17).
Depending on the regeneration temperature (45 to 75oC) produced by flat plate collector
a cooling capacity that ranges between 2 and 6 kW is obtained and chilled water at 15
oC temperatures are supplied to fan coils.
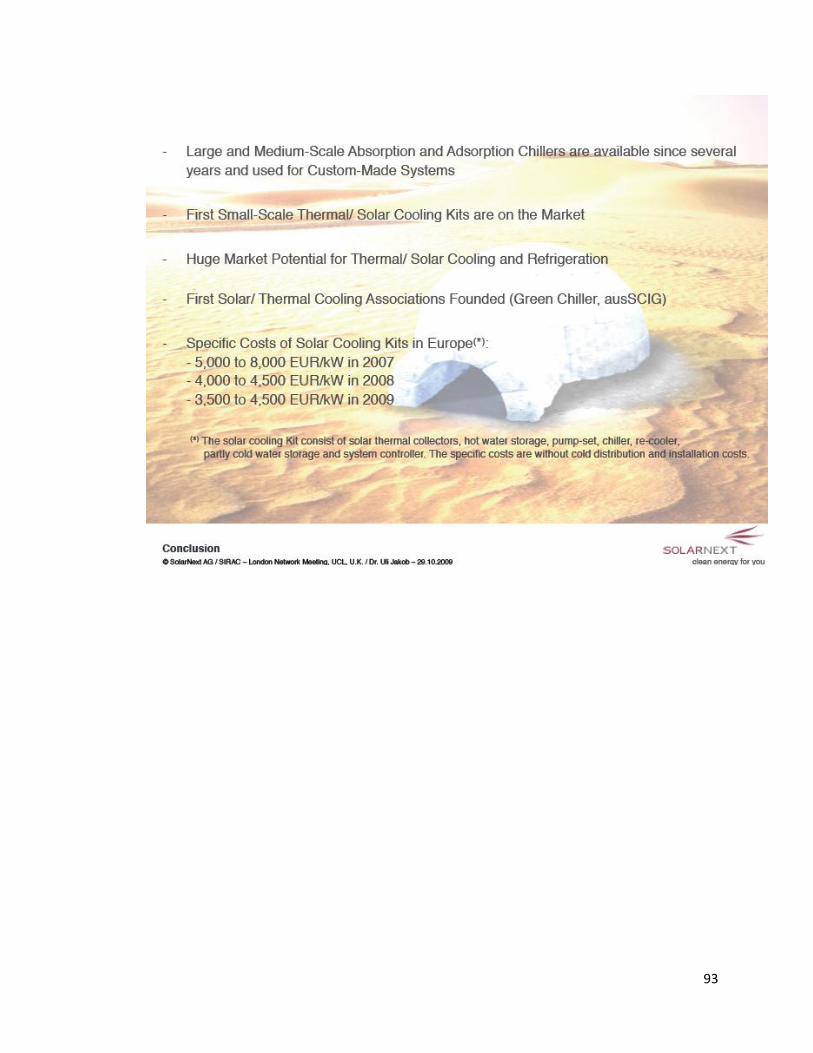
The price of a solar kit was between 5,000 to 8,000 Eur/kW in year 2007 and decreases
to 4000 to 4500 Eur/kW in 2008 year and reaches to 3500 -4500 Eur/kW in year 2009.
And now it is expected to 3,000 Eur/ kW or less than this (appendix 14.17). For small
scale solar sorption system the specific collector area needed usually ranges between
3.5 - 4.5 m2/kW, and an average 4 m2/kW is used [T.Tsoutsos et al 2003]
70
10 HOMER OPTIMIZATION
HOMER is software that makes selection of different technologies easier. It optimizes
resource availability, demand and cost of different systems. The optimization result is
based on cost, the most feasible configuration have the lowest net present cost (NPC).
NPC includes all capital, maintenance, working and replacement cost. Using this
software it is possible to optimize technologies depending on the net present cost
(NPC). As an input parameter it requires the hourly load profile, cost and hourly energy
resource. Then it simulates whether the demand (cooling load) is balanced by the
resource (solar energy) are balanced. After simulation the results will be put in diagrams
and table form so that it will be easy to compare and select a technology with a least net
present cost. [HOMER]
Energy resources such as biomass, wind, solar and kerosene and different system
components used by theses resources can be simulated using the software. However,
only solar PV technologies can be simulated by the software, it cannot simulate solar
thermal technology. Therefore a simple approximation is done to simulate the total NPC
by inserting input data, shown in table 9. To do so an assumption is taken that the solar
irradiation (resource availability) is high enough to run the cooling system. Therefore in
place of biomass input data of selected solar adsorption is used in the software, figure
27. The amount of biomass needed is assumed to be zero since the solar radiation has
no working cost, it is a free gift. Operating cost includes electricity for pumps, interest if
purchasing is by borrowing and others.
71
Table 9: Input parameters for solar based adsorption in HOMER software [Jakob et al 2008, T.Tsoutsos et al 2003, SolarNext]
Variables price
Total kits cost 28140$
Maintenance cost 34.07$ (0.1% of investment cost)
Operating cost 170.2 $/year
Life time 15 year
Installation cost 3376.8$ (12 % of equipment cost)
Figure 27: Homer simulation diagram for solar based adsorption chiller
The Results show that total net present cost of the approximated solar thermal
adsorption system is 34,581$. To compare with kerosene based adsorption chiller, the
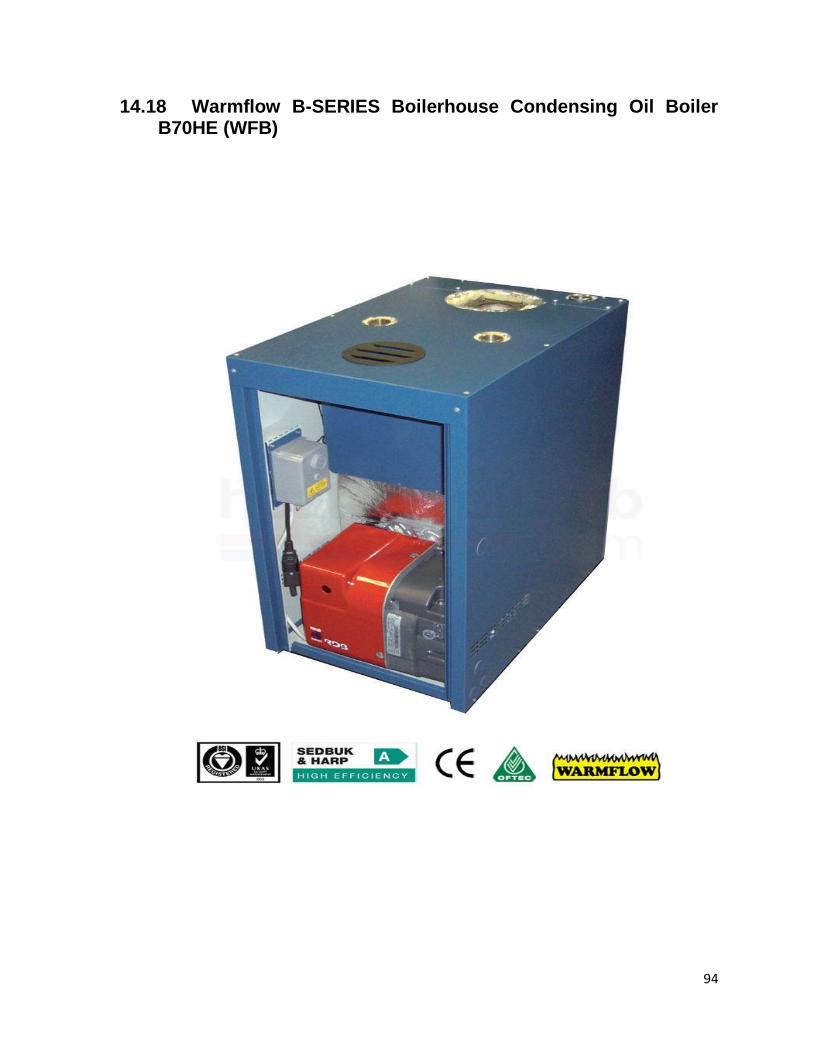
solar collector is replaced by kerosene fuel boiler (table 10 and appendix 14.18). The
installation cost in percent (12 % of equipment cost) and project life time are assumed
to be equal to solar based adsorption chiller. The simulation results a net present cost of
105,247$.
72
Table 10: Input parameters for kerosene based adsorption in HOMER software [T.Tsoutsos et al 2003, WFB]
Variables price
Equipment cost 23064.08$
Maintenance cost 1159.76$ (4% of investment cost)
Life time 15 year
Installation cost 2767.69$ (12 % of equipment cost)
Figure 28: HOMER simulation diagram of kerosene based adsorption chiller
From the simulation kerosene based NPC is higher than the solar based adsorption
system mainly due to the higher working cost of kerosene. Therefore the solar based
system is feasible than kerosene based cooling system.
73
11 CONCLUSION
To select a cooling system, investigation of the potential of resource availability for the
area must be done. Since the country is located in tropical zone, Bahir Dar gets quite
enough solar irradiation, about 250W/m2. It has minimum irradiation in July and August
(local winter seasons) and a maximum in March, April and May (local summer
seasons).
Houses of Impact Real-estate Villa are bigger in size than the condominium houses. As
a result, the total heat gain per zone of the Impact Real-state villa house is around 267
W where as this value for condominium house is 174 W. For both houses direct solar
irradiation shares the highest source of heat gain while building envelope shares the
highest heat loss. At an operating temperature of 30.7oC and 31.8oC, IDA ICE
simulation gave design cooling loads of 5.53 kW and 5.73 kW for 25 zones of
condominium and for 2 zones of Impact Real-state Villa respectively.
A single effect water/NH3 vapour absorption chiller with a regeneration temperature of
80 to 120oC has a COP value in the range of 0.3 to 0.7. A LiBr/water absorption chiller
usually works with a heat source temperature beyond 88oC and has COP value of about
0.6. These systems operate using evacuated tube solar collector to have better
performance. Though its COP is low, about 0.3, Silica gel/water adsorption chiller can
operate at regeneration temperature as low as 45oC. This temperature can easily be
achieved using a simple flat plate solar collector and also it will enable the chillier to
work more than eight hour in a day. Zeolite/water pair needs a regenerating
temperature of above 200oC and activated carbon/ammonia pair needs around 150oC.
These temperatures cannot be achieved from flat plate or evacuated type collectors.
Thus, silica gel/water adsorption chiller having a capacity of 7 kW is proposed both
houses.
An economic comparison was made between the solar energy driven system and
kerosene energy driven Silca-gel/water adsorption chiller using HOMER software. The
simulation result showed that the total net present cost of solar adsorption chiller is
74
34,581$ whereas, the kerosene, adsorption chiller has 105,247$ total net present cost.
This is mainly due to higher working cost of kerosene. This shows that solar based
system is feasible.
75
12 RECOMMENDATION AND FUTURE WORK
Solar irradiation through windows and openings is the highest heat gain in the
system. Hence, it is recommended if roof overhang or other direct sunlight
blocking system is integrated in the building.
Orientation of condominium building is towards south which is disadvantage for
hot climate like Bahir Dar. Therefore, it will be better if most of the windows are
oriented toward the north.
The ambient temperature is less than the indoor operative temperature so that
passive technology such as solar chimney that ventilates the room can be
considered and further investigation should be taken.
Future work can be done on design of solar cooling system that considers
simulation of the whole solar cooling system with the building.
In addition to solar potential resource Ethiopia also has a biomass potential so it
is recommended further investigation on this resource.
HOMER optimization was limited only on economic part of solar thermal system
therefore to evaluate the other parameters finding other software is
recommended.
76
13 REFERENCE
A. Kumie, Y. Berhane, (2002), “Crowding in a traditional rural housing (“Tukul”) in Ethiopia”, available at http://ajol.info/index.php/ejhd/article/viewFile/9798/31275
A. R. Trott and T. Welch (1984), “Refrigeration and Air conditioning”, Butterworth-Heinemann, Britain B. T. Nguyen, T. L. Pryor, (1996), “The relationship between global solar radiation and sunshine duration in Vietnam”, Renewable energy, Vol.11, No.1, September 1996 B. Choudhury, P.K. Chatterjee, J.P. Sarkar, (2010), “Review paper on solar-powered air-conditioning through adsorption route”, Renewable & sustainable energy reviews, March 2010
C. Flavin and M.Hull Aeck, “Energy for Development”. Worldwatch Institute, available
at http://www.worldwatch.org/system/files/ren21-1.pdf [Chirstopher et al]
C. Kornevall (May2009), “Energy Efficiency in Buildings (EEB_2009)”
C. A. Balaras, G. Grossman, Hans-Marin Henning, C. A. I. Ferreira, E. Podesser, L.
Wang, E. Wiemken, (2007), “Solar air conditioning in Europe- an overview”, Renewable
and sustainable energy reviews, Vol.11, February 2005.
Dr. U. Jakob, W. Mittelbach, (2008), “Development and Investigation of a Compact
Silica Gel/Water Adsorption Chiller Integrated in Solar Cooling systems”, Heat Pipes,
Heat Pumps, Refrigerators, Power Sources, September 2008
D.S. Kim, C.A. Infante Ferreira, (2008), “Solar refrigeration options-state –of-the-art review”, International journal of refrigeration, vol.3 I, August 2007 Energy and Resource (ER, 2003), "energy and resource-Ethiopia" http://earthtrends.wri.org/pdf_library/country_profiles/ene_cou_231.pdf, viewed on April 2010 EQUA Simulation AB (2009) “IDA Indoor Climate and Energy 4.0 Manual”, available at http://www.equa.se/deliv/ICE4eng.pdf?lic=ICE40X:ED140.380.361.1.17 ESTIF (2006), “Solar Assisted Cooling-State of the Art”, available at
http://www.estif.org/fileadmin/estif/content/policies/downloads/D23-solar-assisted-cooling.pdf viewed on May 2010 F. C. McQuiston, J. D. Parker, J. D. Spliter (2005), “Heating, Ventilating, and Air conditioning- Analysis and Design”, John Wiley and Sons, Oklahoma, USA F. Drake, Y. Mulugetta, (1996), “Assessment of solar and wind energy resources in Ethiopia. I. Solar Energy”, Solar Energy, May 1996 GASIMA (2007), “Bahir Dar Sunrise, sunset, dawn and dusk times, table”, available at
http://www.gaisma.com/en/location/bahir-dar.html
G. Bekele, B. Palm, (2009), “Feasibility study for a standalone solar-wind-based hybrid energy system for application in Ethiopia”, Applied Energy, Vol.87, July 2009
G.A. Florides, S.A. Tassou, S.A. Kalogirou, L.C. Worbel, (2002), “Review of solar and low energy cooling technologies for buildings”, Renewable & sustainable energy reviews, vol.6, June 2002
G. Panaras, E. Mathioulakis, V. Belessiotis, N. Kyriakis, (2010), “Theoretical and expermintal investigation of the performance of desiccant air-conditioning system”, Renewable energy, vol.35, November 2009 G. Hauser, C. Kempkes, B.W. Olesen, “Computer simulation of Hydraulic Heating/cooling system with embedded pipes”, available at http://www.cibse.org/pdfs/Embedded%20Hydronic%20Pipe%20Sys.pdf H. G. Lorsch, (1981), “Active solar heating and cooling systems: I. Heat pump systems”, energy and buildings, vol.3 Hans–Martin Henning, (2007), “Solar Assisted Air Conditioning of Buildings –an overview”, Applied Thermal Engineering, July 2007]
House Hold Energy Network (HEDON, 2007), "Ethiopia country profile”, available on
http://www.hedon.info/Ethiopia , viewed on April 2010.
Hoy-Yen Chan, S. B. Riffat, J. Zhu, (2010), “Review of passive solar heating and cooling technologies”, Renewable and sustainable energy reviews, vol.14, October 2009
International Energy Outlook 2009 (IEO2009), available at
J. K. Yohanna, I. N. Itodo, V. I. Umogbai, (2011), “A model for determining the global solar radiation for Makurdi Nigeria”, Renewable energy, Vol.36, February 2011
K.F. Fong, T.T. Chow, C.K. Lee, Z. Lin, L.S. Chan, (2010), “Comparative study of different solar cooling systems for buildings in subtropical city”, solar energy, vol.84, December 2009
K. Robertson, A. Athienitis, “solar energy for buildings”, available at http://www.cmhc-
METEOTEST, J. Remund, S. kunz, C. Schilter, S. Moller, (2010) “METEONORM Version 6.0- handbook part 1: software”, available at http://www.meteonorm.com/media/pdf/mn6_installation_en.pdf
M.S. Hatamipour, H. Mahiyar, M. Taheri, (2007), “Evaluation of existing cooling systems for reducing cooling power consumption”, Energy and Buildings, Vol.39, May 2006
NASA, “Surface Meteorology and Solar Energy”, available at http://eosweb.larc.nasa.gov/sse/
National Renewable Energy Laboratory, (NREL-2001), “Passive Solar Design for the
home”, available on, http://www.nrel.gov/docs/fy01osti/27954.pdf
P. Srikhirin, S. Aphornratana, S. Chungpaibulpatana, (2001), “A review of absorption
refrigeration technologies”, Renewable & sustainable energy reviews, vol.5, February
2001
R. V. Ralegaonkar, R. Gupta, (2010), “Review of intelligent building construction: A
passive solar architecture approach”, Renewable and Sustainable Energy Reviews,
April 2010
Renewable Energy Development (DR, 2006),”Renewable Energy in Emerging and
S. A. Kalogirou, (2004), “Solar thermal collectors and applications”, Progress in energy and combustion science, vol.30, February 2004
S. Wiel, N. Martin, M. Levine, L. Price, J. Sathaye, (1998), “The role of building energy efficiency in managing atmospheric Carbon Dioxide”, Environmental Science and Policy, vol. 1; 1998 T. Tsoutsos, J. Anagnostou, C. Pritchard, M. Karagiorgas, D. Agoris, (2003), “Solar
cooling technologies in Greece, An economic viability analysis”, Applied Thermal
energy, Vol.23, March 2003
T. Mateus, A. C. Oliveira, (2008), “Energy and economic analysis of an integrated solar absorption cooling and heating system in different building types and climates”, Applied Energy, vol.86, September 2009 TRANE (2000), “Air Conditioning Clinic- Cooling and Heating Estimation”, Trane Company, America T.S. Ge, F. Ziegler, R.Z. Wang, H. Wang, (2010), “Performance comparison between a solar driven rotary desiccant cooling system and conventional vapor compression system (Performance study of desiccant cooling)”, Applied Thermal Energy, Vol.30, December 2009 V. K. Sharma, A. Colangelo, G. Spagna, (1995), “Photovoltaic technology: basic concepts, sizing of a standalone photovoltaic system for domestic applications and preliminary economic analysis”, non-nuclear energy, vol.36, June 1994 Vitalijus Pavlovas, (2004), “Demand controlled ventilation A case study for existing Swedish multifamily buildings”, Energy and Buildings, Vol.36, 2004 Y. Fan, L. Luo, B. Souyri, (2007), “Review of Solar sorption refrigeration technologies: development and applications”, Renewable & sustainable energy reviews, vol.11, January 2006